Embed Size (px)
Citation preview
*
To he published in Proceedings of ISSW'94, International Snow Science Workshop
Application of Classification and Regression Trees:Selection of Avalanche Activity Indices at Mammoth Mountain
Robert E. Davis*
Kelly Elder**
ABSTRACT
We focus on the the importance of the parameters describing the degree of avalanche activity.Classification and regression trees were trained on weather, snow plot and avalanche occurrenceobservations from the Sierra Nevada, California, a maritime influenced region. Avalancheactivity was characterized by the total number of releases, the sum of the sizes and the maximumsize class. The number of cases for the data set was 482. We show that the accuracy of overallclassification depended on which activity parameter was selected, while the ranking of thecritical input variables remained identical. The probability of correct classi fication was thehighest for the maximum size class, followed by the sum of the sizes, and the total number ofreleases. "
INTRODUCTION
Works in the literature report that the importance of various meteorological and snow plotvariables associated with avalanche hazard changes with geographic region. This observationappears consistent despite the use of various parameters to describe the level of avalanche hazardor the degree of avalanche activity. Thus its seem plausible that for a given region, a list ofcritical variables can also state the order of importance to avalanche hazard or activity. Such alist should, ideally, be constructed from variables dictated by experience and ranked byquantitative analyses. Once a list can be made, a further question arises about the suitability ofusing it for distinguishing among different intensities of avalanche activity.
Describing avalanche activity, the dependent variable, by a meaningful metric that is physicallyjustified and statistically unique represents one of the fundamental problems of statistical ordeterministic studies. Many attempts throughout the world have partitioned avalanche responseinto a variety of genetic and morphologic c1assi fications. Approaches using different dependentvariables run the risk of confounding comparison of forecasting methods. Definitions ofavalanche activity or response range from individual path observations and descriptions (Judsonand King, 1985) to hazard levels based on frequency of events (Elder and Armstron"g, 1986) tobinary outcome of avalanche-day versus non-avalanche-day, (Bois e[ aI., 1974) to the sum of
U.S. Army Cold Regions Research and Engineering Laboratory. 72 Lyme Road, Hanover, NewHampshire 03755-1290
** Center for Remote Sensing and Environmental Optics. University of California. Santa Barbara CA93106
"285

286
avalanche sizes on a given day (McClung and Tweedy, 1993).
Correct identification and quantification of independent variables leading to avalanche releasepotentially present a more difficult problem. Unfortunately, da~a availability often represents themost severe constraint and scientists are forced to make do with data that has already beencollected. While these data are necessary because long-term databases are critical to all nondeterministic forecasting techniques, they have usually been collected for another purpose(weather forecasting for cities, agriculture, etc.). Collection sites are often located in valleybottoms, urban areas, and at low elevations, which make it difficult to extrapolate to conditions inavalanche statting zones.
BACKGROUND
There is general agreement that it will be sometime, if ever, before quantitative. methods cansubstitute for the human element in avalanche forecasting. However, forecasters seemincreasingly dependent on quantitative analysis, from the daily weather predictions to moresophisticated techniques relating to slab release. Great improvements have been made inphysically-based deterministic modeling, but we believe it is likely that future avalancheforecasting aids will arise from hybridization between empirical and physically based modelingbecause of the intensive data requirements of physical models. Two long-standing challengeshave been I) to identify and rank variables that can be measured efficiently and reliably,according to their importance as indicators of avalanche activity and 2) to characterize theavalanche activity by some useful parameter. Much effort has gone toward assessing the former,while little attention has been paid to the latter.
Perla (1970) revisited Atwater's (1954) ten contributory factors for avalanche hazard evaluationand found precipitation and wind direction to be the most important parameters. Fohn et a!.,( 1977) compared conventional forecasting techniques with four statistical methods ranging fromprincipal components analysis (PCA) and discriminate analysis of local and regional data tocluster analysis of local data. They found that all the methods produce about the same results at70 to 80 percent accuracy, with some slightly better than others. Each method had distinctadvantages and disadvantages.
The nearest-neighbor method has been applied in a number of climates with a variety of inputvariables. Buser (1989) gave results from a nearest-neighbor forecasting program introduced byBuser (1983) and used operationally in Switzerland by the ski patrol in the Parsenn area. Theprogram identified the ten days in the record with the most similar conditions to the day inquestion. Similarity is based on the proximity of weighted meteorological and snowpackvariables in data space. The program also creates "elaborated" variables, for example the timetrend in a particular meteorological measurement.
Buser et a!. (1985) reviewed a broad range of avalanche forecasting methods for short and longtime scales and over local and regional spatial scales. Input data collected by conventional fieldmethods and by instruments designed and built for specialized tasks, such as FMCW radar, werediscussed for different applications. Forecasting methods from conventional induction tocoinplex statistical models were reviewed.
Although not directly addressing forecasting, Jaccard (1990) used fuzzy factorial analysiS toidentify important interactions of avalanches related to snowpack, meteorology, terrain andvegetation parameters based on expert opinion. Slope angle and aspect, overall weatherconditions and precipitation were found to be the most important factors related to avalanches.

Avalanche hazard forecasting has been addressed from a number of different angles andapproaches from nearly all of the affected regions of the world. Tables I and II summarize someof the key research on the subject. The lists in Tables I and II are not exhaustive and representunlya portion of the research published in the English language.
Table I. Key articles in literature on quantitative analysis methodologies.
Study (date) method avalanche parameter
Bovis (1977) discriminant analysis avalanche day (local)magnitudetotal number(wet/dry avalanches)
Fohn et al. (1977) conventional avalanche days (local/regional)
Obled and Good (1980) principal components avalanche days (Iocal/regional)discriminant analysis (wet/dry avalanches)
Judson and Erickson (1983) regression analysis total number (local/regional)
Buser (1983, 1987, 1989) nearest neighbor avalanche days (local)
Jaccard (1990) fuzzy factorial analysis total number (local)
Davis et al. ( 1992) classi fication tree avalanche days (local)
McClung and Tweedy (1993) univariate correlation analysis sum of sizes (local)
TREE-BASED.MODELS
Decision trees are an efficient form for representing decision processes for classifying patterns indata or piecewise constant functions in nonlinear regression. A tree functions in an hierarchicalarrangement; data flowing "down"a tree encounters one decision at a time until a terminal nodeis reached. A particular variable enters the calculation only when it is required at a particulardecision node, and only one variable is used at each decision node. Moreover, a variable that isunimportant except for a special case can be used in that special case without impacting thedecisions in other cases. These characteristics contrast with multivariate analyses and clustering,which use all critical variables for each case. In a study comparing the perforrnance of neuralnetworks and classification trees, Atlas et al. (1990) showed that in most cases the twomethodologies exhibited comparable accuracy for prediction. In a related study, Sethi (1990)showed that decision trees can be trained on a data set then used to construct artificial neuralnetworks by mapping the hierarchical layers in the tree to layers in the net.
There are two types of simple binary decision trees; regression and classi fication. Regressiontrees are appropriate where the dependent variable is a ratio scale data type. In other words, ifthe dependent variable can assume any value over the range of observations, and if thedifferences are quantitative and consistent, then we want a model that can predict these valuesand one that is not constrained to. particular members. An example is number of avalanches perday. A regression model will predict somewhere between zero and a reasonable maximumnumber of avalanches for a given day based on the independent variables.
A c1assi fication tree is appropriate where the independent variable itself belongs to the data typesnominal (named) or ordinal (ordered). Nominal data includes such variables as slope aspect:east, west, etc. Ordinal data exhibits relative, rather than quantitative differences: for example,
287
288
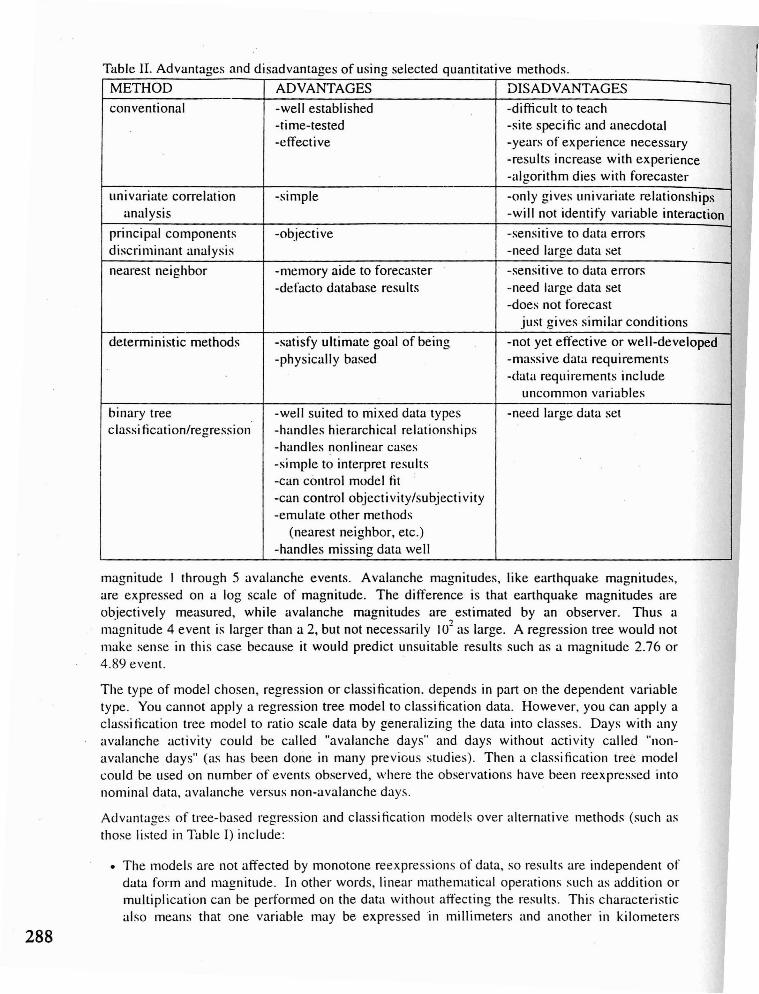
Table II. Advantages and disadvantages of using selected quantitative methods.
METHOD ADVANTAGES DISADVANTAGES
conventional -well established -difficult to teach-time-tested -site specific and anecdotal-effective -years of experience necessary
-results increase with experience-algorithm dies with forecaster
univariate correlation -simple -only gives univariate relationshipsanalysis -will not identify variable interaction
principal components -objective -sensitive to data errorsdiscriminant analysis -need large data set
nearest neighbor -memory aide to forecaster -sensitive to data errors-defacto database results -need large data set
-does not forecastjust gives similar conditions
deterministic methods -satisfy ultimate goal of being -not yet effective or well-developed-physically based -massive data requirements
-data requirements includeuncommon variables
binary tree -well suited to mixed data types -need large data setc1assi fication/regression -handles hierarchical relationships
-handles nonlinear cases-simple to interpret results-can control model fit-can control objectivity/subjectivity-emulate other methods
(nearest neighbor, etc.)-handles missing data well
magnitude I through 5 avalanche events. Avalanche magnitudes, like earthquake magnitudes,are expressed on a log scale of magnitude. The difference is that earthquake magnitudes areobjectively measured, while avalanche magnitudes are estimated by an observer. Thus amagnitude 4 event is larger than a 2, but not necessarily 102 as large. A regression tree would notmake sense in this case because it would predict unsuitable results such as a magnitude 2.76 or4.89 event.
The type of model chosen, regression or classification. depends in part on the dependent variabletype. You cannot apply a regression tree model to c1assi fication data. However, you Can apply ac1assi fication tree model to ratio scale data by generalizing the data into classes. Days with anyavalanche activity could be called "avalanche days" and days without activity called "nonavalanche days" (as has been dorie in many previous studies). Then a classification tree modelcould be used on number of events observed, where the observations have been reexpressed intonominal data, avalanche versus non-avalanche days.
Advantages of tree-based regression and classi fication models over alternative methods (such asthose listed in Table I) include:
• The models are not affected by monotone reexpressions of data, so results are independent ofdata form and magnitude. In other words, linear mathematical operations such as addition ormultiplication can be performed on the data without affecting the results. This characteristicalso means that one variable may be expressed in millimeters and another in kilometers
without affecting the model.
• Gaussian assumptions are not violated by the distribution of one or more independentvariables, (tree-based methods are nonparametric or "distribution free"). Trees are valid evenusing mixed data sets containing multiple distributions. It is not necessary that data benormally distributed or that non-normal data be transformed before analysis.
• Model results are less dependent on missing values in the independent variables(methodology finds "surrogate" values for each decision node). Many statistical modelscannot use data sets where one or more attributes for a given observation are missing. Binarytrees can use the existing data to statistically predict what the missing elements should be, orto use only the elements that do exist. .
• Tree-based models allow complex interactions between the independent variables, whichmust be speci tied 1I priori in standard linear models. For example, snow accumulation mayincrease up to a critical elevation, then decrease with increasing elevation above that criticalpoint. Standard linear models can only take advantage of that fact if a mathematicalexpression for the relationship is formulated and expressed before model implementation.
• Interpretations of complex interactions are clear and often more easily understood than othermodel constructions. A tree is far more easily interpreted by most people than mathematicalexpressions or nonlinear equations.
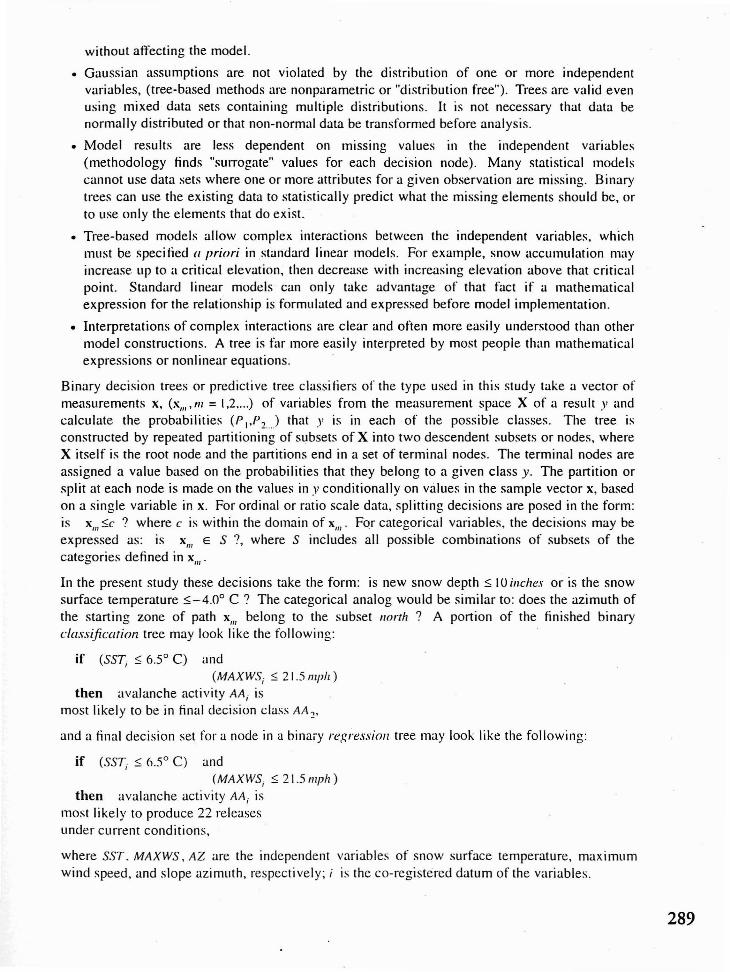
Binary decision trees or predictive tree classi tiers of the type used in this study take a vector ofmeasurements x, (XIII' fIl = 1,2....) of variables from the measurement space X of a result y andcalculate the probabilities (PI,P2J that y is in each of the possible classes. The tree isconstructed by repeated partitioning of subsets of X into two descendent subsets or nodes, whereX itself is the root node and the partitions end in a set of terminal nodes. The terminal nodes areassigned a value based on the probabilities that they belong to a given class y. The partition orsplit at each node is made on the values in y conditionally on values in the sample vector x, basedon a single variable in x. For ordinal or ratio scale data, splitting decisions are posed in the form:is xIII:$c? where c is within the domain of XIII' For categorical variables, the decisions may beexpressed as: is XIII E S ?, where S includes all possible combinations of subsets of thecategories defined in XIII .
In the present study these decisions take the form: is new snow depth :$ 10 illches or is the snowsurface temperature .$-4.0° C ? The categorical analog would be similar to: does the azimuth ofthe starting zone of path XIII belong to the subset I/orth ? A portion of the finished binarydllss~fic(/Tion tree may look like the following:
jf (SST;:$ 6.S o C) and(MAXWS; .$ 21.5 mph)
then avalanche activity AA; ismost likely to be in final decision class AA 2,
and a final decision set for a node in a binaiy regression tree may look like the following:
jf (SST;.$ 6.50 C) and(MAXWS; :$ 21.5 mph)
then avalanche activity AA; ismost likely to produce 22 releasesunder current conditions,
where SST. MAXWS, AZ are the independent variables of snow surface temperature, maximumwind speed, and slope azimuth, respectively; i is the co-registered datum of the variables.
289
290
A collection of such decision rules is obtained through a technique referred to as recursivepartitioning. Three elements must be defined before the sample data may be recursivelypartitioned into a binary decision tree:
I) method for determining the best split at each node,
2) basis for deciding when to continue or stop splitting a node,
3) method for assigning class probabilities for each terminal node.
The details of these decisions are beyond the scope of this paper but are explained at length inthe standard reference on classi fication and regression trees (Brei man et aI., 1984).
We have used both the tree-based model implementation in CART (Breiman et aI., 1984) and inthe S-PLUS mathematical language, which follows closely the development in Breiman et al.( 1984). Both software packages have unique advantages and the user shou ld explore bothimplementations. Details of the S-PLUS software are explained in Chambers and Hastie (1992).Two applications of tree based models in the natural sciences can be found in Michaelsen et al.(1987 and ill press). The output of the software packages includes a ranking of the independentvariables in order of importance as primary decision makers, or as surrogates for otherindependent variables, as well as the decision tree. This is the focus of our discussion.
METHODOLOGY
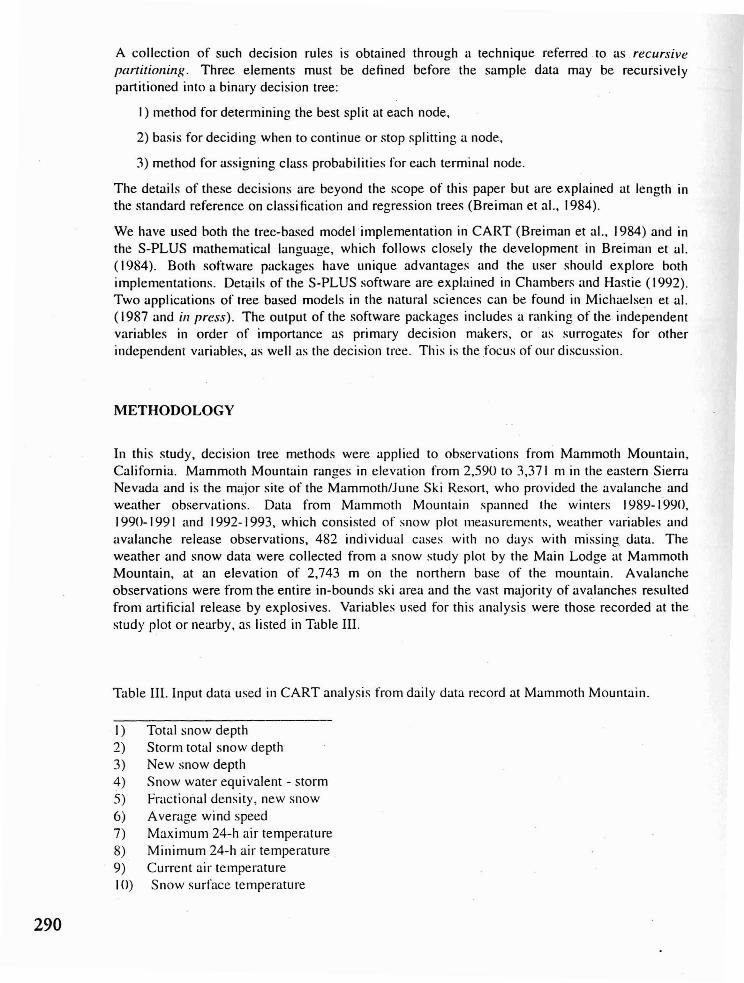
In this study, decision tree methods were applied to observations from Mammoth Mountain,California. Mammoth Mountain ranges in elevation from 2,590 to 3,371 m in the eastern SierraNevada and is the major site of the Mammoth/June Ski Res0l1, who provided the avalanche andweather observations. Data from Mammoth Mountain spanned the winters 1989-1990,1990-1991 and f992-1993, which consisted of snow plot measurements, weather variables andavalanche release observations, 482 individual cases with no days with missing data. Theweather and snow data were collected from a snow study plot by the Main Lodge at MammothMountain, at an elevation of 2,743 m on the northern base of the mountain. Avalancheobservations were from the entire in-bounds ski area and the vast majority of avalanches resultedfrom artificial release by explosives. Variables used for this analysis were those recorded at the.study plot or nearby, as listed in Table III.
Table III. Input data used in CART analysis from daily data record at Mammoth Mountain.
I) Total snow depth2) Storm total snow depth3) New snow depth4) Snow water equivalent - storm5) Fractional density, new snow6) Average wind speed7) Maximum 24-h air temperature8) Minimum 24-h air temperature9) Current air temperature10) Snow surface temperature

Control activities and avalanche observations were recorded at Mammoth Mountain in a formatconsistent with the standard U.S. Forest Service avalanche control and occurrence chart. Thisprotocol consists of codes for the date, time, path, patroller identification, control type, controlnumber, control surface, avalanche class type (hard slab, soft slab, etc.), avalanche triggermechanism, avalanche size, and so forth (Perla and Martinelli, 1978). It should be noted that theavalanche size class is somewhat subjective when comparing the data from different areas, butconsistent within this study area.
Avalanche observations were aggregated into three response variables, the total number ofavalanche releases on a given day, and the maximum size class. Our premise for specifying.these avalanche activity characteristics was that the number of releases may provide anindication of how widespread the avalanche hazard (i.e. spatial dispersion), the sum of the sizesmay indicate the overall intensity of the activity, and that the maximum size may provide anindex of the local intensity of the hazard. Therefore, a regression tree method was used toevaluate the data with the total number of releases and the sum of the sizes as the responsevariable; and a classification tree method was used to evaluate the data with the maximum sizeclass on a given day as the response variable.
RESULTS
Both the regression tree and the classi fication tree analyses produced the same ranking ofweather and snow plot variables, also the same as Davis et aI., 1992. This shows the robustnessof the method.
The overall probability of a case falling into the correct terminal node for the regression treesdepended on the avalanche activity variable; the total number of releases (range 0 - 41) was 0.68,and the sum of the sizes (range 0 - 69) was 0.71. The overall probability of correct c1assi ficationfor the classification tree (maximum size class with a range 0 - 5) was 0.90. The classificationmatrices showed some details in how various values of result were predicted. In Table V theentire classi fication matrix is shown for the outcome of the maximum size class.
Table V. Classification matrix: classification tree constructed using maximum size for avalancheresponse variable.
OBSERVED0 I 2 3 4 S
P 0 409 2 14 () 4 1R I 0 0 0 0 0 0E 2 6 I 20 4 2 0D 3 I I 9 0 0 0I 4 0 0 0 2 3 IC S 0 0 0 0 0 0T
% 98 47 33
The results in Table V show the overall classification accuracy of 0.90 - the sum of the diagonalof con'ect classifications divided by the total number of cases. The accuracy of classification of anon-avalanche day was 0.98, while the accuracy of classification of individual avalanche sizes
291
292
was substantially lower or undefined. The accuracy of individual values of the total number ofreleases and the sum of the sizes was also lower than for the individual size classes.
DISCUSSION
The goal of this work was to explore avalanche response variables other than avalanche day ornon-avalanche day. We were able to show for the data in this study that the probability ofsuccess in obtaining reasonable results seems highest for the maximum size class. Overall it canbe said that the ranking of input variables in terms of sensitivity to avalanche activity appearsinsensitive to the avalanche response variable for the example here and in Davis et al. (1992).
Decision tree analysis may not be able to accurately predict details of avalanche activity in termsof numbers or size of releases with only inputs of observations from the cun-ent day. This isclearly the experience of the Swiss, reported in many classic works. Much l1lf)re ,:,11"011 is neededto condition the data sets and specify elaborated variables (e.g. Buser, 1989). Other factors alsomay come into play because we are dealing primarily with artificially released avalanches.
• Cases in these data involve avalanche paths that are repeatedly shot during an avalanchecycle. Therefore the probability of deep slab release is likely to decrease over time.
• There were situations where conditions were ripe for release, but control operations weredelayed until the weather improved. This may explain the cases where the prediction was forno avalanche, but releases were observed (top row in Table V).
In order to test this technique effectively and objectively, we need to study other data sets fromareas with longer records, which will allow model construction and validation either throughunique elements or cross validation. We would also like to test the method in different snowclimates to assess model performance and objectively confirm the existence of different snowclimates and avalanche response. Both studies are in progress at this time. However, it will betricky to compare avalanche records where releases from one area are natural or skier triggered,and releases in another area are explosively triggered.
SUMMARY
Various statistical techniques have been tried to rank critical variables in terms of theirsensitivity to avalanche activity. Classification and regression tree methodology shows promisebecause of distinct advantages over standard statistical techniques. While the ranking is robustwith respect to the choice of dependent variables describing avalanche activity, the accuracy ofclassification and regression trees shows sensitivity to the choice of the dependent variables. Inthe example used for discussion in this work, the methodology was better at correctly classifyingthe maximum size of releases than it was at predicting the sum of the sizes or total number ofreleases.
ACKNOWLEDGEl\,IENTS
This work was funded under Army Corps of Engineers Project 4A762784AT42 with othergenerous support from MammothlJune Ski Resort and the University of California.MammothlJune Ski Resort staff, including Eddy Bouzglou, Mary Walker, Stacey Tracy and GaryReitman provided much help. The idea to use CART to select critical variables came afterdetailed discussions with Othma Buser of the Swiss Federal Institute of Snow and AvalancheResearch.
REFERENCES
Atlas, L., R. Cole, Y. Muthusamy, A. Lippman, J. Connor, D. Park, M. EI-Sharkawi, and R. J.Marks II, 1990, "A performance comparison of trained multilayer perceptrons and trainedclassi fications trees," Proceedings of the IEEE, Vol. 78( 10), pp. 1614-1618.
Atwater, M.M., 1954, "Snow avalanches," Scient~fic American, vol. 190( I), pp. 26-31.
Bois, P., C. Obled and W. Good, 1974, "Multivariate data analysis as a tool for day-by-dayavalanche forecast", Proceedings of the Snow Mechanics Symposium, IAHS Pub. No. I 14,Grindelwald, pp. 391-403.
Bovis, MJ., 1977, "Statisical forecasting of snow avalanches, San Juan Mountains, southernColorado, U.S.A.," Journal ofGlaciology, Vol. 18(78), pp. 87-99.
Breiman, L., J. H. Friedman, R. A. Olshen, and C. J. Stone, 1984, Class~ficarioll and RegressionTrees, Wadsworth & Brooks/Cole Advanced Books & Software, Pacific Grove, CA.
Buser, 0., 1983, "Avalanche forecast with the method of nearest neighbors: An interactiveapproach." Cold Regions Science ant! Technology, Vol. 8(2), pp. 155-163.
Buser, 0., P. Foehn, W. Good, H. Gubler and B. Salm, 1985, "Different methods for theassessment of avalanche danger", Cold Regions Science and Technology, vol. 8, no. 2, pp. 155163.
Buser, 0., 1989, "Two years experience of operational avalanche forecasting using the nearestneighbors method," Annals ofGlaciolog\', Vol. 13, pp. 31-34.
Chambers, J. and T. Hastie (eds.), 1992, Statistical Models in S, Wadsworth and Brooks, PacificGrove, CA.
Davis, R.E., K. Elder and E. Bouzglou, 1992, Applications of classification tree methodology toavalanche data management and forecasting, Proceedings of the ISSW'92" pp. 126-133.
Elder, K. and R. Armstrong, 1986, "A quantitative approach for verifying avalanche hazardratings", Avalanche Formation, Movement and Effects, IAHS pub. No. 162, B. Salm and H.Gubler eds., International Association of Hydrological Sciences, Wallingford, UK, pp. 593-60 I.
Fohn, P., W. Good, P. Bois, and C. ObJed, 1977, "Evaluation and comparison of statistical andconventional methods of forecasting avalanche hazard," Journal o( Glaciology, Vol. 19(81), pp.375-387.
Jaccard, c., 1990, "Fuzzy factorial analysis of snow avalanches," Natured Hazards, Vol. 3, pp.329-340.
Judson, A., and B. J. Erickson, 1973, "Predicting avalanche intensity from weather data: astatistical analysis," Research Paper RM-112, U. S. Forest Service, Fort Col1ins, CO.
Judson, A., 1983, "On the potential use of index paths for avalanche assessment," ./ounUlI o(Glaciology, Vol. 29( 10 I), pp. 178-184.
Judson, A., and R. King, 1985, "An index of regional snowpack stability based on natural slabavalanches," Journal o(Glaciology, vol. 31, pp. 67-73.
Kennedy, J. L., 1984, "Avalanche Iitigation: Technology and liabi lity ," Proceedings o( theISSW'84" pp. 99-10 I.
293
294
LaChapelle, E., 1965, "Avalanche forecasting - A modern synthesis," International Symposiumon Scientific Aspects of Snow and Ice Avalanches, IAHS Pub. No. 69, pp. 350-356.
McClung, D. M., and J. Tweedy, 1993, "Characteristics of avalanching: Kootenay Pass, BritishColumbia," Journal ofGlaciology, vol. 39, no. 132, PI' 316-322.
Michaelsen, J., F. Davis, M. Borchert, 1987 "A non-paramJtric method for analyzing hierarchicalrelationships in ecological data", Coenoses, vol. 2, no. I, pp. 39-4X.
Michaelsen, J., D. Schimel, M. Friedl, F. Davis and R.Dubayah, ill pres,\', "Regression treeanalysis of satellite and terrain data to guide vegetation sampling and surveys", JournaL (~f
Vcgctation Scicncc.
. Obled, C. and W. Good, 1980. "Recent developments of avalanche forecasting by discriminantanalysis techniques: A methodological review and some applications to the Parsenn area (Davos,Switzerland)," Journal ofGlacioLogy, Vol. 25(92), pp. 315-346.
Penniman, D., 1986, "The Alpine Meadows avalanche trial: Conflicting viewpoints of the expertwitnesses," Avalanche Formation, Movement and Effects, lAHS pub. No. 162. B. Sallll and I-:i.Gubler eds., International Association of Hydrological Sciences, Wallingford. UK. pp. 665-677:
Perla, R., 1970, "On contributory factors in avalanche hazard evaluation", ClIfuulil/1IGeotedmicaL JournaL. vol. 7, no. 14, pp414-419.
Perla, R. and M. Martinelli, 1978, "Avalanche Handbook," Agriculture Handbook 489, rev. ed.,USDA Forest Service, Washington, D.C..
Sethi, 1., 1990, "Entropy nets: from decision trees to neural networks," Proceedings of the IEEE.Vol. 78( I0), PI'. 1605-1613.