Embed Size (px)
Citation preview

1
QUANTIFICATION OF ASYMMETRICAL STEPPING POST-STROKE AND ITS RELATIONSHIP TO HEMIPARETIC WALKING PERFORMANCE
By
CHITRA LAKSHMI KINATINKARA BALASUBRAMANIAN
A DISSERTATION PRESENTED TO THE GRADUATE SCHOOL OF THE UNIVERSITY OF FLORIDA IN PARTIAL FULFILLMENT
OF THE REQUIREMENTS FOR THE DEGREE OF DOCTOR OF PHILOSOPHY
UNIVERSITY OF FLORIDA
2008
2
© 2008 Chitra Lakshmi Kinatinkara Balasubramanian

3
To Mummy, Appa and Anjan

4
ACKNOWLEDGMENTS
I would like to express my heartfelt gratitude to my advisor Dr. Steve Kautz for opening
the doors of science to me, his impeccable scientific vision and for kindling the fire of curiosity
in me. I cannot thank him enough for his unrelenting support and for his constant belief in me to
explore my strengths that I was myself unsure of. I am also indebted to the exceptional members
on my committee Dr. Andrea Behrman, Dr. Craig Velozo and Dr. James Cauraugh for their
invaluable support, belief in my work and for inspiring the art of being a scientist.
Thanks go to each and every person in the lab: Ryan, Kelly and Naresh for all their hard
work and assistance in data analyses; Mark and Erin for their help in data collection and for
putting in that ‘extra’ effort on my behalf during the home stretch. A special thanks goes to Erin
for being my Angel! I would also like to thank Maria Kim and Lise Worthen for collecting and
helping me access the data for my first study that jumpstarted my research. I want to thank Dr.
Richard Neptune and Dr. Felix Zajac for their invaluable comments and contributions to my
research. I have learnt a lot from the two of them! I want to thank all subjects who volunteered to
participate in my research studies. None of of my research pursuits would be possible without
them.
My research pursuits would not be a possibility without the strong infrastructure and
resources provided by UF for graduate education. Thanks go to UF also for inspiring the spirit of
being a family…the gator family! I am grateful to the UF Alumni Association for granting me
the Alumni fellowship that funded my education for four years. I am also thankful to NIH and
VA Medical Center for their grant funding to Dr. Steve Kautz that helped build and maintain the
HMPL where I pursued all my research. Faculty and staff in the Rehabilitation Science Doctoral
(RSD) Program and Physical Therapy Department have been an essential support system
throughout my doctoral studies. Special thanks go to fellow RSD graduate students and the

5
people at Brain Rehabilitation Research Center mostly for being my home away from home!
Thanks go to all my friends here in the US and in India for their wonderful friendships that made
this my time as a graduate student so much better.
None of this would be possible if it weren’t for my parents Drs. Shyamala and
Balasubramanian. From the time I can remember, Mummy and Appa have given me the freedom
to explore my potential and always encouraged me to seek the best in the academic arena. I want
to thank them for selflessly loving and supporting me and for providing me with everything and
much more! Special thanks go to Mummy for the rock of support and love she is to our family
and for being my role model in life. My dissertation work is dedicated to her!
I am extremely thankful to my loving sisters Pooja and Vidya and my brother-in-law
Karthik for always sticking together in times of trials and tribulations that have helped me focus
and prioritize my education here in the US. They are my backbone! A special thanks goes to my
partner in sin….my aunt (Mangalam) for her belief in my abilities and for her love. I also want to
thank my parents-in-law Retired Lieutenant Commander Padmalochan Das and Runu Baruah for
loving me as their daughter and selflessly encouraging me to pursue my endeavors.
I am grateful that my time as a graduate student was shared with my darling husband
Anjan. His unconditional love and encouragement have been pivotal to keep me going
throughout my graduate studies. I am short at words to thank him for putting my dreams before
his and constantly moving around the globe (literally!) to be with me and help me pursue my
education. He has shared with me times of hope and despair, frustration and exhilaration, and
everything in-between. I thank him for being my best friend throughout this journey!
Finally, thank you God for giving me the strength and courage to go after my dreams and
for bringing these wonderful people into my life during my doctoral education.

6
TABLE OF CONTENTS
page
ACKNOWLEDGMENTS ...............................................................................................................4
LIST OF TABLES.........................................................................................................................10
LIST OF FIGURES .......................................................................................................................11
ABSTRACT...................................................................................................................................13
CHAPTER
1 INTRODUCTION ..................................................................................................................15
2 LITERATURE REVIEW .......................................................................................................18
Introduction.............................................................................................................................18 Part 1: Overview of Walking Function...................................................................................18
Neuromotor Control of Healthy Gait ..............................................................................18 Quantifying Gait: Phases in the Healthy Gait Cycle .......................................................19 Walking Capacity after a Stroke......................................................................................19
Stroke: incidence and consequences ........................................................................19 Pathophysiological basis of the locomotor disorder post-stroke..............................20 Nature and rate of walking recovery ........................................................................21 Walking disability in the chronic phase ...................................................................22
Part 2: Asymmetry in Spatiotemporal Step Characteristics and Ground Reaction Forces during Hemiparetic Walking...............................................................................................22
Spatiotemporal Characteristics of Steps..........................................................................23 Temporal asymmetry................................................................................................24 Spatial asymmetry ....................................................................................................25
Ground Reaction Forces in Hemiparetic Gait .................................................................26 Relevance of the Reviewed Literature to Study One ......................................................27
Part 3. Intra-Subject Variability during Walking ...................................................................28 Motor Control and Gait Variability.................................................................................28
Significance of gait variability: theoretical approach ..............................................28 Role of variability during walking ...........................................................................28
Step-by-Step Variability in Spatiotemporal Characteristics............................................29 Step Variability as Quantifiable Markers of Impaired Walking .....................................30 Relevance of Reviewed Literature to Study Two............................................................32
Part 4. Foot Placement in a Body Reference Frame...............................................................32 Defining Foot Placement Relative to Body.....................................................................33 Control of Foot during Gait .............................................................................................33 Body Center of Mass Position and Velocity: Postulated Link to Foot Placement ..........33 Foot Placement Relative to Body and its Relation to Walking Sub-tasks ......................34 Relevance of Reviewed Literature to Study Three..........................................................35
Part 5. Pre-Swing and Swing Phase during Hemiparetic Gait................................................36

7
Introduction to Pre-Swing and Swing Phase during Gait................................................36 Kinematic Characteristics during Pre-Swing and Swing Phase ......................................37 Kinetic Characteristics during Pre-Swing and Swing phase ...........................................38
Moments, Powers, Angular velocities......................................................................38 Interjoint coordination during swing phase..............................................................40
Muscle Activity during Pre-Swing and Swing Phase......................................................41 Relevance of Reviewed Literature to Study Four ...........................................................42
3 RELATIONSHIP BETWEEN STEP LENGTH ASYMMETRY AND WALKING PERFORMANCE IN SUBJECTS WITH CHRONIC HEMIPARESIS................................49
Introduction.............................................................................................................................49 Methods ..................................................................................................................................51
Participants ......................................................................................................................51 Procedures .......................................................................................................................52 Data Analyses..................................................................................................................53 Statistical Analyses..........................................................................................................54
Results.....................................................................................................................................55 Relationship between Step Length Asymmetry (SLR) and GRFs ..................................55 Relationship between Asymmetrical Step Lengths, Hemiparetic Severity and
Walking Speed .............................................................................................................57 Relationship between Step Length Asymmetry, Time Spent in Pre-Swing and
Swing Time..................................................................................................................57 Relationship between SLR, Change in Gait Speed and Parameters That Contribute
to Change in Speed ......................................................................................................57 Discussion...............................................................................................................................58
Relationship between Step Length Asymmetry and Propulsive Forces during Hemiparetic Walking ...................................................................................................58
Relationship between Step Length Asymmetry, Walking Speed and Hemiparetic Severity ........................................................................................................................61
Relationship between Step Length Asymmetry, Paretic Pre-Swing Time and Vertical GRFs ..............................................................................................................62
Conclusions.............................................................................................................................63
4 VARIABILITY IN SPATIOTEMPORAL STEP CHARACTERISTICS AND ITS RELATIONSHIP TO WALKING PERFORMANCE POST-STROKE...............................70
Introduction.............................................................................................................................70 Methods ..................................................................................................................................71
Participants ......................................................................................................................71 Procedures .......................................................................................................................72 Data Analyses..................................................................................................................73 Statistical Analyses..........................................................................................................74
Results.....................................................................................................................................75 Differences in Step Variability between Healthy and Hemiparetic Walking..................75 Association between Step Variability, Clinical Assessments and Asymmetry Index.....76
Discussion...............................................................................................................................77
8
Differences in Step Variability between Healthy and Hemiparetic Participants ............77 Relationship between Hemiparetic Step Variability and Impaired Performance
Post-Stroke...................................................................................................................78 Study Limitations ............................................................................................................81
Conclusions.............................................................................................................................82
5 FOOT PLACEMENT IN A BODY REFERENCE FRAME DURING WALKING AND ITS RELATIONSHIP TO HEMIPARETIC WALKING PERFORMANCE ..............88
Introduction.............................................................................................................................88 Methods ..................................................................................................................................90
Participants ......................................................................................................................90 Procedures .......................................................................................................................91 Data Analyses..................................................................................................................92 Statistical Analyses..........................................................................................................94
Results.....................................................................................................................................95 Quantifying Foot Placement Relative to the Pelvis.........................................................95 Relationship between Anterior-Posterior Foot Placements Relative to Pelvis, Step
Length Asymmetry and Paretic Propulsion .................................................................96 Relationship between Medial-Lateral Foot Placements Relative to Pelvis, Step
Widths, Paretic Weight Support and Dynamic Stability Margin.................................97 Discussion...............................................................................................................................98
Anterior-Posterior Foot Placement Relative to Pelvis and its Relationship to Step Length Asymmetry and Forward Progression .............................................................98
Medial-Lateral Foot Placement Relative to Pelvis and its Relationship to Weight Supported on Paretic Leg and Dynamic Stability Margin .........................................101
Limitations.....................................................................................................................103 Conclusions...........................................................................................................................104
6 EVALUATION OF STEP LENGTH GENERATION DURING POST-STROKE HEMIPARETIC WALKING USING A NOVEL METHODOLOGY OF STEP-BY-STEP VARIABILITY IN GAIT DATA ..............................................................................112
Introduction...........................................................................................................................112 Methods ................................................................................................................................115
Participants ....................................................................................................................115 Procedures .....................................................................................................................116 Data Analyses................................................................................................................117 Statistical Analyses........................................................................................................118
Results...................................................................................................................................120 Predictors of Step Length Variability and the Differences in Selected Predictor
Variables across the Asymmetrical Sub-Groups .......................................................120 Shorter paretic group..............................................................................................120 Symmetric group ....................................................................................................121 Longer paretic group ..............................................................................................121
Discussion.............................................................................................................................122

9
Contralateral Stance Leg Ground Reaction Force (AP Impulse during Ipsilateral Swing) is a Significant Predictor of Step Length Variability ....................................123
Ipsilateral Hip Impulse in Early Swing is a Significant Predictor of Step Length Variability in Persons taking Longer Paretic than Non-Paretic Steps .......................124
Ankle-Joint Center Velocity at Toe-Off is a Significant Predictor of Non-Paretic Step Length Variability..............................................................................................126
Leg Orientation at Toe-Off and Pelvis Velocity at Toe-Off and their Contribution to Explaining Step Length Variability .......................................................................126
Within-Subjects Regression Models .............................................................................127 Limitations.....................................................................................................................128
Conclusions...........................................................................................................................129
7 CONCLUSIONS: INTEGRATING THE FINDINGS.........................................................140
Step Length Asymmetry during Hemiparetic Walking ........................................................140 Step Variability during Hemiparetic Walking......................................................................141 Asymmetrical Stepping in a Body Reference Frame Post-Stroke........................................142 Step Length Generation during Hemiparetic Walking .........................................................142 Summary...............................................................................................................................143
APPENDIX
A LOWER EXREMITY FUGL-MEYER SCALE..................................................................144
B DYNAMIC GAIT INDEX SCALE......................................................................................145
LIST OF REFERENCES.............................................................................................................147
BIOGRAPHICAL SKETCH .......................................................................................................163

10
LIST OF TABLES
Table page 3-1. Correlation between SLR and walking variables...............................................................64
4-1. Definitions of study variables ............................................................................................82
4-2. Step variability (expressed as standard deviation) within the hemiparetic population sub-divided based on their performance measures ............................................................83
5-1. Definition of study variables............................................................................................105
6-1. Subject characteristics......................................................................................................130
6-2. Average gait characteristics for individual participants...................................................131
6-3. Regression models for individual participants to predict paretic step length variability .........................................................................................................................132
6-4. Regression models for individual participants predicting non-paretic step length variability .........................................................................................................................133

11
LIST OF FIGURES
Figure page 2-1. A simplified model demonstrating neural control of gait ..................................................43
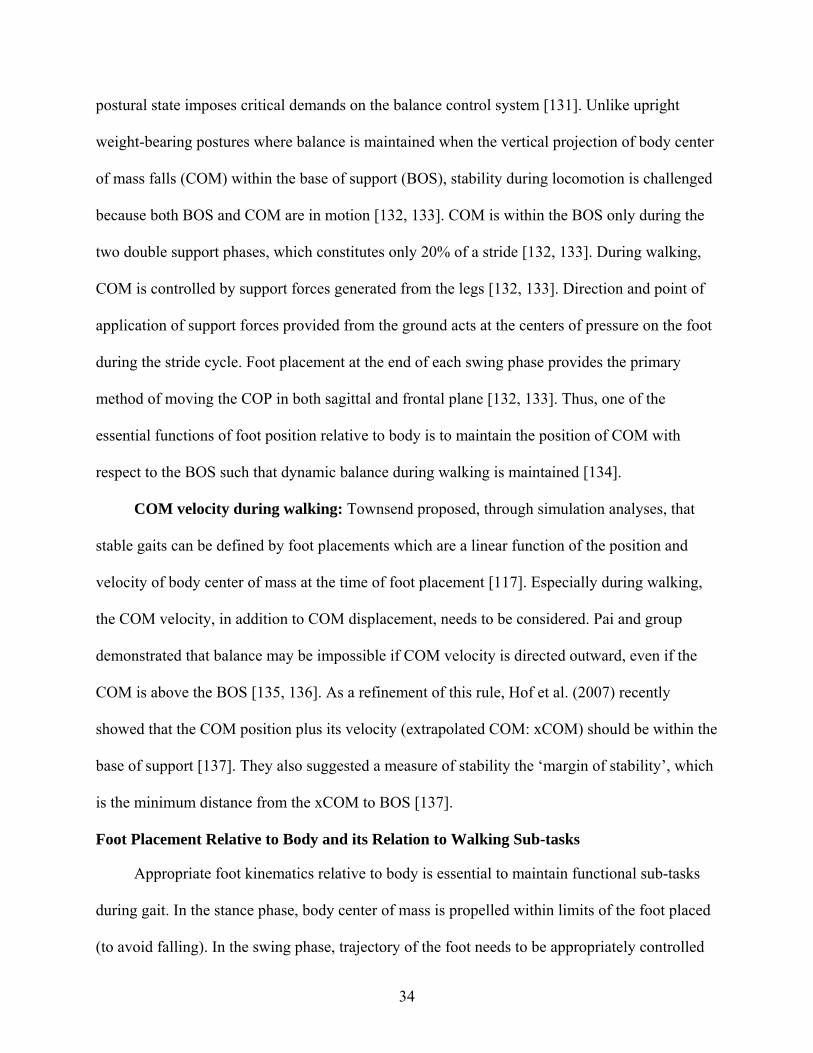
2-2. Division of a gait cycle into phases ...................................................................................44
2-3. Methodology for collection of spatiotemporal characteristics during walking using an instrumented mat (GAITRite)............................................................................................45
2-4. Illustration of ground reaction forces exerted by the limbs and typical force curves........46
2-5. Variability (in stride time) during walking and its relation to risk for falls.......................47
2-6. Power profiles in swing phase of a healthy gait cycle .......................................................48
3-1. Illustration of horizontal GRF impulses ............................................................................65
3-2. Comparison of GRFs between the paretic and non-paretic legs for subjects walking with differing SLR .............................................................................................................66
3-3. Relationship between step length ratio and Propulsion Paretic.............................................67
3-4. Relationship between step length asymmetry, walking speed and hemiparetic severity...............................................................................................................................68
3-5. Change in speed, cadence and individual step lengths in subjects walking at different SLR [SLR > 1.1 (n = 21), 0.9 < SLR < 1.1 (n = 21), SLR < 0.9 (n = 4)]..........................69
4-1. Differences in temporal variability between healthy (n = 22) and participants with hemiparesis (n = 94) at Self-selected (SS) walking speeds ...............................................84
4-2. Differences in spatial variability between healthy (n = 22) and participants with hemiparesis (n = 94) at Self-selected (SS) walking speeds ...............................................85
4-3. Differences in temporal variability in hemiparetic participants based on their performance on clinical assessments .................................................................................86
4-4. Differences in spatial variability in hemiparetic participants based on their performance on clinical assessments .................................................................................87
5-1. Illustration of marker positions for kinematic data collection and the SIMM model generated ..........................................................................................................................106
5-2. Calculation of anterior-posterior and medial-lateral foot placements relative to pelvis..107
5-3. Foot placement relative to pelvis during hemiparetic and healthy gait ...........................108

12
5-4. Relationship between anterior foot placement asymmetry relative to pelvis and step length asymmetry in participants with hemiparesis.........................................................109
5-5. Relationship between step length asymmetry and anterior-posterior foot placement relative to pelvis in participants with hemiparesis...........................................................110
5-6. Relationship between paretic and non-paretic lateral foot placement asymmetry relative to pelvis and percent weight supported on the paretic leg ..................................111
6-1. An individual participant walking on the split belt treadmill as kinematic, kinetic and EMG data were recorded .................................................................................................134
6-2. Illustration of variables used in the study ........................................................................135
6-3. Frequency distribution of step-to-step variability in step lengths....................................136
6-4. Non-paretic AP impulse and Paretic hip impulse during paretic stepping in the asymmetrical sub-groups .................................................................................................137
6-5. Relationship between paretic hip impulse in early swing, non-paretic AP impulse in early and late swing in an individual participant taking longer paretic steps than non-paretic...............................................................................................................................139

13
Abstract of Dissertation Presented to the Graduate School of the University of Florida in Partial Fulfillment of the Requirements for the Degree of Doctor of Philosophy
QUANTIFICATION OF ASYMMETRICAL STEPPING POST-STROKE AND ITS
RELATIONSHIP TO HEMIPARETIC WALKING PERFORMANCE
By
Chitra Lakshmi Kinatinkara Balasubramanian
August 2008 Chair: Steven A. Kautz Major: Rehabilitation Science
Asymmetrical stepping is a characteristic feature of hemiparetic walking and a result of
sensorimotor deficits post-stroke. Asymmetry measures (that is, relative performance of paretic
leg) may characterize hemiparetic gait better than overall gait performance measures (such as
gait speed) and can provide insights into underlying paretic leg impairments. Therefore, the
major purpose of this dissertation was to quantify the asymmetry in steps post-stroke and
understand its relationship to hemiparetic walking performance. Overall, four studies were
conducted. Persons with chronic hemiparesis and healthy controls walked overground and over a
split-belt instrumented treadmill as spatiotemporal, kinematic and kinetic data were collected.
Clinical assessments included lower-extremity Fugl-Meyer grading and Dynamic Gait Index
assessments.
In study one, step length asymmetry during walking was quantified. Results showed that
step length asymmetry related to propulsive force generation during hemiparetic walking.
Further, asymmetrical step lengths may not necessarily limit the self-selected walking speed
likely due to other compensatory mechanisms. We suggest that step length asymmetry can be
utilized as a clinical measure to evaluate asymmetrical stepping post-stroke.

14
In study two, step-by-step variability and its relation to asymmetrical stepping were
investigated. Results showed that increased spatiotemporal variability, asymmetry in swing and
pre-swing time variability and reduced width variability were related to severe hemiparesis,
asymmetrical stepping and poor balance. We suggest that step-by-step variability measures are
quantifiable markers of impaired walking performance post-stroke.
In study three, asymmetrical stepping was evaluated in a body reference frame. Results
showed that anterior-posterior and medial-lateral foot placements relative to body were
asymmetrical and this foot placement asymmetry related to step length asymmetry but not step
widths. Wider paretic foot placement relative to pelvis than non-paretic also related to reduced
paretic leg weight support and lateral instability, suggesting the clinical utility of medial-lateral
foot placement relative to pelvis as an outcome to quantify weight support during hemiparetic
walking.
In study four, mechanisms underlying step length generation were evaluated. Contralateral
anterior-posterior and hip impulses during swing explained the step length variability in the
majority of participants. However, relationship of the predictors to step lengths differed in the
asymmetrical sub-groups. This implies that mechanisms of step length generation were different
across persons showing differing step length asymmetry patterns. Based on these mechanisms,
we have proposed specific impairments and therapeutic strategies targeted towards these
impairments underlying asymmetrical stepping.

15
CHAPTER 1 INTRODUCTION
The American Heart Association reports approximately 700,000 cases of stroke or
cerebrovascular accident annually [1] . Stroke is the number-one cause of long-term disability
around the world [2] and is estimated to result in $30 billion in health care costs and lost
productivity each year [3]. As the most disabling chronic disease, the cumulative consequences
of stroke are often staggering for individuals, families, and the society [3, 4]. Hemiparesis
(unilateral movement dysfunction or weakness of one-half of the body) is commonly seen in
three-quarters of persons post-stroke [5]. The residual sensorimotor control deficits of a person
with post-stroke hemiparesis involves multiple impairments such as muscle weakness, abnormal
synergistic organization of movement, impaired force regulation, abnormal muscle tone,
impaired balance and sensory deficits [2, 5, 6]. Additionally, residual cognitive and visual
deficits contribute to the reduced functional mobility in this population [7, 8].
Regaining independent walking is the most often-stated goal for rehabilitation in patients
post-stroke [9]. Walking deficits in those who have sustained a stroke range from complete
immobility to independent mobility, with almost a third of stroke survivors showing severe
walking impairments [10]. Although post-stroke hemiparesis appears to reflect a single
diagnostic category, there is immense heternogenity in the walking performance post-stroke [11],
warranting a systematic characterization of walking performance deficits and underlying
impairments. Quantification of impairments that limit functional walking performance and
investigation of mechanisms underlying these impairments will directly assist in development of
targeted therapies to improve hemiparetic walking function.
Asymmetrical performance between lower extremities is a characteristic hallmark that is
unique to hemiparetic gait [12, 13]. While the asymmetrical nature of hemiparetic walking is

16
well documented in the literature [12-15], there is insufficient understanding of the underlying
mechanisms related to gait asymmetry. One of the primary reasons limiting an integrated
understanding of gait asymmetry post-stroke is the heterogeneity in asymmetrical patterns
among stroke patients primarily due to the diverse motor recovery processes and compensatory
mechanisms [16]. Furthermore, the relationship of gait asymmetry to functional performance is
unclear, primarily because functional performance has been traditionally evaluated using
walking speed [17]. Gait asymmetry is reported to show a weak relation to attained walking
speed implying that asymmetry may not limit the functional performance [5, 17-19]. However,
faster walking speeds in some persons showing severe asymmetry can be achieved by
compensatory strategies from the non-paretic leg, limiting the specific understanding of the
contribution of paretic leg performance to functional performance. While it can be argued that
compensations post-stroke are central to the walking performance due to altered circuitry and
limited ability after a neurological injury [18], it is essential to differentiate impairments from
compensations such that therapeutic strategies can be specifically designed to improve the
paretic leg performance.
Furthermore, there is no clear consensus in the literature regarding the clinical relevance of
evaluating gait asymmetry [5]. As a clinical measure, gait velocity reflects overall gait
performance but is limited in its value to evaluate post-stroke gait specific to paretic leg
impairments [14]. In turn, asymmetry measures (i.e., relative performance of the paretic leg) can
provide insights on the paretic leg performance in relation to the non-paretic leg. Therefore,
asymmetry measures could be developed as outcomes that specifically reflect the contribution of
the paretic leg towards functional walking. The aim of this dissertation was to systematically
quantify asymmetrical performance (specifically in stepping measures) during hemiparetic

17
walking, to explore underlying mechanisms and to understand how asymmetry might relate to
walking performance post-stroke. In particular, this dissertation will focus on stepping (spatial-
temporal) asymmetry. A step during walking is the final outcome of all events occurring in the
gait cycle [20]. Therefore, spatial-temporal characteristics of steps (such as step length, swing
time, etc.) can be used as quantifiable measures of walking performance reflective of underlying
gait processes [21]. Furthermore, stepping parameters can be easily recorded enhancing their
clinical utility as gait performance measures.
In this dissertation, four studies were conducted to quantify asymmetrical stepping and
understand its relationship to hemiparetic walking performance. In the first study, step length
asymmetry during walking was quantified and the relationship between spatial asymmetries and
hemiparetic walking performance was explained. In the second study, the step-by-step variability
in selected spatial and temporal characteristics of steps was evaluated and their relation to
stepping asymmetry and hemiparetic performance was explained. The third study of this
dissertation evaluated asymmetrical stepping in a body reference frame to gain insights regarding
asymmetrical foot placement relative to the body during hemiparetic walking. Finally, in the
fourth study of this dissertation, mechanisms related to initial conditions of the leg and swing
phase were investigated to explain step length generation during hemiparetic walking. The
overall purpose of studies in this dissertation was to provide a foundation for the development of
a framework to use asymmetry measures to assess walking impairments post-stroke. Specificity
in assessment of walking impairments will, in turn, facilitate the development of rehabilitation
strategies that are cost-effective and efficient.

18
CHAPTER 2 LITERATURE REVIEW
Introduction
The following literature review is composed of six main parts and provides the background
underlying specific aims of this dissertation study. Part one, is an overview of walking function
and describes walking deficits of persons who have sustained a stroke. In the second part,
literature related to motor control mechanisms in hemiparetic walking is presented. This section
presents background literature relevant to Study One (Chapter 3). In the third part, intra-subject
variability during walking is discussed in relevance to Study Two (Chapter 4) of this dissertation.
Part four describes literature related to foot placement during walking and forms the basis for
aims of Study Three (Chapter 5). In part five, pre-swing and swing phase control during walking
is discussed and this part focuses on the literature relevant to Study Four (Chapter 6) of this
dissertation.
Part 1: Overview of Walking Function
Neuromotor Control of Healthy Gait
Walking is essentially an inter-limb coordinated movement in which the limbs move in a
symmetrical alternating pattern such that the body can progress forward in a stable and efficient
manner [22, 23]. Human walking is remarkable in that the healthy locomotor system integrates
input from the motor cortex, cerebellum, and the basal ganglia, as well as synchronizes feedback
from visual, vestibular and proprioceptive sensors to produce carefully controlled motor
commands that result in coordinated muscle firings and limb movements [24]. Figure 2-1
demonstrates a model of walking from previous works [25, 26]. While the spinal pathways
(central pattern generators) can generate the basic locomotor rhythm, sensory inputs from higher

19
centers (through descending pathways as corticospinal tracts) and feedback from peripheral
mechanisms (afferent feedback) enable a rich variation in the basic locomotor rhythm.
Furthermore, the three major requirements for successful locomotion are suggested to be a)
progression, defined as the ability to generate a basic locomotor pattern that can move the body
in a desired direction; b) stability, defined as the ability to support and control the body against
gravity; c) adaptability, defined as the ability to meet the individual’s goals and the demands of
the environment [27].
Quantifying Gait: Phases in the Healthy Gait Cycle
Walking function is usually quantified as a Gait cycle. A Gait (Stride) cycle is defined as
the events occurring from foot strike of one limb to the foot strike of the ipsilateral limb [28, 29].
Each gait cycle is further divided into a stance phase (as when ipsilateral limb is on the ground)
and swing phase (as when ipsilateral limb is swinging with no contact on the ground) [29].
Stance and Swing phases of a gait cycle can be further sub-divided into different phases. Figure
2-2 presents these sub-divisions of a Gait cycle phase.
Walking Capacity after a Stroke
Stroke: incidence and consequences
O’Sullivan et al. (2000) has defined a stroke, or cerebrovascular accident (CVA), as “an
acute onset of neurological dysfunction due to an abnormality in cerebral circulation with
resultant signs and symptoms that correspond to involvement of 19 focal areas of the brain” [30].
The American Heart Association reports stroke as a common neurological event occurring in
700,000 people annually. Over 4 million people currently live with residual deficits [31]. Stroke
is the primary cause of long-term disability and is classified as one of the most disabling chronic
diseases. It has been estimated that one in five stroke survivors need help walking and seven out
of ten cannot return to their previous jobs [32]. Fifty one percent of stroke survivors are unable to

20
return to any type of work [33]. In particular; ability to return to work is primarily shown to
relate to walking function [34, 35].
Pathophysiological basis of the locomotor disorder post-stroke
The pathophysiological basis of walking disability after a stroke is damage to motor
neurons and pathways of the central nervous system caused by interruption of arterial blood
supply because of a hemorrhage (hemorrhagic stroke) or thrombus (ischemic stroke) usually on
one side of the brain [35]. Consequently, paresis (or paralysis) is observed in opposite half of the
body (hemiparesis) [36-38]. The types and degrees of disability that follow a stroke primarily
depend upon multiple factors such as location and size of brain lesion, severity of the lesion,
individual degree of spontaneous recovery, and the duration of stroke onset [39, 40].
Nonetheless, residual deficits are common after a stroke. Typical residual deficits after a stroke
include sensorimotor, cognitive and visual deficits, all of which can independently or in
combination result in reduced or impaired walking ability.
Motor control impairments of weakness (paresis) [41], loss of volitional movements of the
weaker or paretic side (opposite to lesion) or inappropriately graded muscle activations of the
weaker side affect locomotor performance immediately after a stroke [36, 39]. Impairments of
spasticity and changes in the mechanical properties of muscles further contribute to walking
disability, developing a few weeks after the initial insult [42]. Nonetheless, damage to the motor
control system and the residual impairments vary with the nature and extent of brain lesion [35].
Therefore, while there are some common motor control impairments that affect walking
performance after a stroke, several sub-groups within the population can be identified that
present differing motor control impairments.

21
Nature and rate of walking recovery
Mechanisms of recovery: Recovery following a stroke is a complex process involving
both spontaneous recovery and recovery due to the effects of a therapeutic intervention that are
usually difficult to separate [5]. In general, while the mechanisms of locomotor recovery after a
stroke are largely unknown, it is suggested that cortical and spinal reorganization [43], functional
compensation from existing pathways [44], new neuronal sprouting [44] and spinal and afferent
reflex modulation [45, 46] are potential mechanisms that contribute to functional locomotor
recovery.
Furthermore, motor recovery processes that underlie walking recovery specifically can be
explained (at least partially) by the step-wise recovery process earlier proposed by Twitchell and
colleagues [47]. Twitchell et al. (1951) argued that motor recovery follows a step-wise and
predictable sequence after an initial stage of areflexia and flaccid paralysis. After this initial
stage, reflexes return, become hyperactive, muscle tone increases and spasticity develops. In the
next stage, voluntary movement appears as part of stereotyped, reflexive flexor and extensor
muscle “synergies”, after which voluntary movement may be achieved “out of synergy”.
Finally, normalization of muscle tone and reflexes may occur.
Rate of recovery: Only 23 – 37 % of persons who have sustained a stroke are able to walk
independently during the first week [11], but there is a general agreement that 50 – 80 % of
survivors can walk at 3 weeks or at discharge [48], and by 6 months as many as 85 % of the
population can walk [49]. While it is generally assumed that walking function recovery plateaus
after 3 months, there is some evidence that recovery may continue up to 2 years (using gait speed
as the outcome measure) [50, 51]. Nonetheless, residual walking impairments last several
months to years after the acute onset. Further, these residual impairments limit walking
performance [52].

22
Walking disability in the chronic phase
While, in general, 85% of stroke survivors can walk by 6 months of stroke, the quality of
walking remains impaired amongst most patients. Walking after a stroke is characterized by slow
walking speed [53], poor endurance [54] and impaired muscle coordination [55, 56].
Specifically, the impaired muscle coordination after post-stroke hemiparesis results in the
characteristic asymmetrical nature of walking commonly referred to as ‘Hemiparetic Gait’.
Furthermore, impaired muscle coordination after a stroke significantly limits the walking ability
of persons and restricts their independent mobility about the home and community [57]. Further,
difficulty in walking is associated with limited ability to return to work [58] and deterioration in
the quality of life.
Risk for falls while walking: Persons who have sustained a stroke are at a high risk for
falling [59, 60]. Since gait and balance deficits are primary contributors to falls, risk for falling
further increases significantly in those stroke survivors who are ambulatory and have balance
deficits [61]. Consequently, a fall after a stroke compounds to the post-stroke disability. For most
patients with stroke, functional walking ability is rarely regained even at the end point of their
rehabilitation and several therapeutic interventions are aimed at maximizing walking recovery.
Nevertheless, there is a lack of targeted interventions to improve walking ability. In part, the
problem is because walking impairments are not specifically quantified [62]. Therefore,
quantification of walking impairments is necessitated to assist in development of focused
therapeutic strategies.
Part 2: Asymmetry in Spatiotemporal Step Characteristics and Ground Reaction Forces during Hemiparetic Walking
Inter- [63] and intra-limb [64] coordination deficits are commonly observed during post-
stroke hemiparetic walking. These coordination deficits along with sensorimotor and motor

23
control deficits result in the asymmetrical performance after stroke. In fact, asymmetry in motor
performance between the paretic and non-paretic legs is a characteristic feature of hemiparetic
gait [12, 65, 66].
In particular, spatiotemporal characteristics of steps and Kinetic (Ground Reaction Forces)
parameters during walking are commonly used to characterize both overall walking performance
and specifically asymmetrical performance. Spatiotemporal step characteristics and kinetic
parameters are most relevant to studies in this dissertation and therefore are reviewed below.
Spatiotemporal Characteristics of Steps
Spatial (i.e., length and width) and temporal (i.e., timing of events) characteristics of steps
are commonly examined since they represent the final outcome of collective motions that
contribute to walking [20, 67]. These parameters are also clinically relevant since they are both
easily observable and quantifiable. Figure 2-3 shows a common methodology for collecting
spatiotemporal (ST) parameters during gait using an instrumented walkway (GAITRite). Given
the clinical relevance of the ST parameters of steps, characterization of these parameters and
quantification of underlying mechanisms during hemiparetic gait can provide useful insights
regarding hemiparetic gait.
The most consistently reported spatiotemporal parameter is slower walking speed. In 17
studies reporting gait speed, the average speeds ranged from 0.23 ± 0.11 m/s [48] to 0.73 ± 0.38
m/s [11]. The attainable maximal speed is also limited by functional limitations imposed due to
the pathology of stroke [6]. Consistent with slower walking speeds, persons with hemiparesis
take shorter stride lengths and have lower cadence (number of steps taken per minute) compared
to age-matched healthy adults [13, 68]. Slower gait speed after a stroke is also associated with a
longer gait cycle duration [13, 68]. Further, the proportion of time spent in stance versus swing is

24
also altered on both paretic and non-paretic sides, when compared to healthy adults walking at
normal speeds [5, 13, 16].
While, gait speed or other unilateral measures reflect overall gait performance; asymmetry
in ST parameters of steps can reveal deficits in motor coordination between the paretic and non-
paretic legs and the performance of the paretic leg relative to the non-paretic. Literature specific
to spatiotemporal asymmetry during hemiparetic gait is reviewed in the following paragraphs.
Temporal asymmetry
Asymmetries in temporal parameters of steps in persons who have sustained a stroke are
well documented [12, 13] and have been consistently related to disturbances in motor
coordination [5]. In particular, it is reported that persons after a stroke spend longer time bearing
weight on the stance phase of the non-paretic leg than paretic [16]. Further, stance phase of both
paretic and non-paretic sides is longer in duration and occupies a greater portion of the full gait-
cycle [5] as compared to both age-matched and speed-matched healthy adults [69].
Similarly, it is reported that persons after a stroke spend longer time swinging their paretic
leg, likely because they spend longer time bearing weight on the non-paretic leg (i.e., longer
stance time) [15]. This asymmetry in swing time is reported to be a significant predictor of
hemiparetic walking performance (since it strongly correlates with stages of motor recovery,
walking speed and falls) [13, 15]. Furthermore, a greater proportion of cycle time is spent in
double support phase of the gait cycle during hemiparetic gait. Particularly, of the two double
support phases, relatively greater time is spent in the second double support of the paretic gait
cycle (paretic pre-swing phase) than the non- paretic [5]. Further, Dequervain et al. (1996)
reported that the paretic pre-swing phase was markedly prolonged for those persons who had
very slow gait velocities [70]. Specifically, it is suggested that this prolonged paretic pre-swing
duration indicates a poor progression of hip flexion during swing phase of patients with slow gait

25
velocity [69, 70]. In summary, several aspects of temporal asymmetry are well characterized in
the literature and temporal asymmetry has been consistently related to poor motor performance
during hemiparetic walking.
Spatial asymmetry
While temporal asymmetry is well characterized and the direction of asymmetry is
consistently reported in the literature, direction of spatial asymmetry varies across studies. It has
earlier been reported that, after a stroke, patients may walk with either relatively longer paretic
steps or longer non-paretic steps [19, 65, 69]. In a study by Kim et. al. (2003), considerable
variability in step length asymmetry was observed in a sample of 28 chronic stroke survivors.
While 14 of these 28 participants walked with longer paretic steps than non-paretic, 14 others
walked with relatively longer non-paretic steps. Dettman et al. (1987) and Hsu et al. (2003)
reported that while, on an average persons with stroke walked with longer paretic than non-
paretic steps, step length patterns were inconsistent within sub-groups of the population [65, 71].
Thus, it is unclear whether persons within the hemiparetic population walk with one or the other
pattern or both.
Furthermore, reasons for the variability in step length asymmetry patterns and relationship
of these variable patterns to walking performance are unexplained. For example, Kim et al.
(2003) hypothesized that the variability in patterns of step length asymmetry may be due to
compensatory strategies that increase or decrease the step length of either paretic or non-paretic
limb [19]. However, they were unable to advance the discussion since they found a non-
significant relationship between step length symmetry and symmetry in vertical ground reaction
forces. Further, in a recent review article, Lamontagne and colleagues [53] suggest that an
inconsistency in the direction of asymmetries between paretic and non-paretic legs is the result of
differences in walking ability in the subjects, but they do not specifically report these differences.

26
Another reason for insufficient understanding of the affect of step length asymmetry on
hemiparetic walking performance is that the relationship between step length asymmetry and
walking speed is not well documented in the current literature. For instance, shorter stride
lengths (bilaterally) have been related to slower walking speed and thereby poor walking
performance [70], and yet a non-significant relationship has been suggested between step length
asymmetry and walking speed [19]. Since kinetic characteristics represent the underlying causes
for the kinematic and spatiotemporal patterns [72], it might be useful to examine the kinetic
characteristics to quantify the step length asymmetry.
Ground Reaction Forces in Hemiparetic Gait
Ground reaction forces (GRFs), as measured by force platforms, reflect the net vertical and
shear forces acting on the surface of the platform [73]. Forces are exerted by the limbs (due to
muscle activity) on the ground while a person walks and is recorded as the equal and opposite
reaction force exerted by the force platforms in response (Figure 2-4). Mathematically, GRFs are
the algebraic summation of the mass-acceleration products of all body segments while the foot is
in contact with the platform [73]. The net GRF has three components: Vertical, Horizontal and
Mediolateral. The vertical force has a characteristic double-hump (first related to weight
acceptance and the second related to push-off), (Figure 2-4). The horizontal force has a negative
phase in the first half of stance (indicating a net deceleration or braking of the body) and a
positive phase in the second half (indicating a net acceleration or propulsion of the body
forward), (Figure 2-4).
The vertical force curve is shown to be variable across subjects and most commonly has an
initial low peak. Carlsoo et al. (1974) reported three different patterns of Vertical GRFs: 1) first
peak during heel contact and second during push-off, 2) pattern showing continuous plateau, 3)
pattern showing single peak in midstance [74]. Kim et al (2003) further showed that the

27
symmetry in vertical GRFs is accompanied by symmetry in temporal parameters but not in the
symmetry of distance variable [19]. This is expected since the vertical GRFs primarily act on the
vertical acceleration of the center of mass and symmetry in distance variables are likely related
to a horizontal component of the GRF (i.e., Anterior-Posterior GRF). Conversely, Mediolateral
GRFs during hemiparetic walking have not been systematically reported. Rogers and associates
study on voluntary leg flexion movements in the hemiparetic persons provides some insight into
the relevance of the M-L forces to stepping [75]. The results of their study revealed asynchrony
and reversals in usual directions of lateral forces, suggesting the inter-limb coordination deficits
in this population.
In a recent study, A-P GRFs during hemiparetic walking was quantified for the first time
[76]. Bowden et al. (2006) showed that anterior (propulsion) forces by the paretic leg are reduced
compared to the propulsive forces by the non-paretic leg [76]. In this study, a measure from the
A-P forces was developed that quantified the coordinated output of the paretic limb to the task of
body propulsion during walking. This measure was referred to as paretic propulsion (Pp), which
represented the percentage of total propulsion generated by the paretic leg during walking. Pp
was also found to correlate with both walking speed and hemiparetic severity.
Relevance of the Reviewed Literature to Study One
Overall, current evidence suggests that persons after a stroke walk with different patterns
of step length asymmetry that may be unrelated to the attained walking speed. However, these
spatial asymmetries are not quantified and it is unclear how the different asymmetrical patterns
relate to post-stroke hemiparetic walking performance and why asymmetry in step lengths may
not necessarily limit the attained walking speed. Therefore, study one of this dissertation aimed
at quantifying the step length asymmetry and explaining its relation to hemiparetic walking
performance.

28
Part 3. Intra-Subject Variability during Walking
While variability during walking exists both between individuals (inter-subject) and within
individuals (intra-subject), intra-subject variability in the performance of tasks has received less
attention [77]. Intra-subject variability during walking is the variation observed in an individual’s
walking performance (i.e., variability in steps for individual participants). No two steps during
walking are exactly similar and there is some natural variability from step to step [78]. Walking
variability can be quantified using spatiotemporal, kinematic, kinetic and EMG characteristics.
Motor Control and Gait Variability
Significance of gait variability: theoretical approach
Walking is a rhythmical inter-limb coordinated task and it is suggested that pattern
generators located in the spinal cord generate the basic motor rhythm during walking [79]. These
pattern generators are considered to be closely coupled for walking movements, suggesting little
variability (stability) in the pattern of walking. Nevertheless, walking movements are not strictly
rhythmical and emerge as a consequence of the interaction of neural and mechanical dynamic
systems, pattern generators, modulation from supraspinal neural system and afferent modulation
[80, 81]. These multiple modulation in the neuromuscular system may induce variability in
walking movements. Walking, specifically, is an example of flexible coordination where stability
co-exists with the abundant variability in movements [82-84]. Further, the degree of the
variability has also been linked to the health of a biological system [78, 85], suggesting that
impairments in gait might alter the variability. In summary, coordination patterns like walking
are highly flexible, being simultaneously stable and variable.
Role of variability during walking
The traditional approach in motor control is to consider intra-subject variability as an index
of noise in the sensorimotor system [86]. More recently, positive aspects of movement variability

29
have been proposed [87-89]. Such perspectives suggest that variability in movement constitutes a
pattern of stimulation. This pattern of stimulation provides task-relevant information about the
dynamical interaction between a person and the environment [88]. There is also some indication
that intra-subject motor variability can well predict performance of motor tasks and that
variability is essential for many aspects of motor performance [86]. Furthermore, stride-to-stride
variability in gait parameters might reflect the inherent flexibility in the locomotor system [90]
and therefore might be a requisite for adaptability.
Step-by-Step Variability in Spatiotemporal Characteristics
Gait variability is most commonly quantified as variability in spatiotemporal (ST)
characteristics of steps. The concept of variability within the ST parameters, its quantification
and relation to falls risk is presented in Figure 2-5. Stride-to-stride variability in stepping patterns
during walking is consistently reported to be low in healthy persons [91, 92] during free
unperturbed walking at natural walking speeds. Kinetic and EMG variability is also reported to
be low in healthy gait [93, 94], although higher than variability in ST parameters of steps.
The magnitude or degree of variability is commonly reported, using parameters like
standard deviation (SD) [95, 96] and coefficient of variation (CV) [97, 98]. However, recent
studies suggest the use of measures that can quantify not only the magnitude of variability, but
also the structure of variability (e.g. fractal dynamics of gait rhythm) [99, 100]. In Study two of
this dissertation, only the magnitude of variability will be evaluated.
SD reflects the absolute variation of a parameter while CV, is the variability computed
relative to the mean of the distribution [CV= standard deviation / mean]. SD and CV are
expected to correlate because they are mathematically derived similarly (i.e., CV is defined from
SD). SD and CV are also reported to be correlated in patient populations [101]. There is no clear

30
consensus in the literature regarding the measure suited to quantify variability and there are few
reports on reliability and validity of each of these measures.
Advantages and disadvantages of gait variability measures: SD is reported to be
unrelated to the mean of the parameter distribution [102] and therefore, might better quantify the
absolute variation across parameters or when comparisons are made within variables across
persons. In cases where comparisons of variability are made across parameters, CV might be
more advantageous since it normalizes the variation in reference to the individual mean of each
parameter distribution [86]. However, extremely low parameter means can drive the CVs to
infinity and thereby, suggest spuriously large variations.
Step Variability as Quantifiable Markers of Impaired Walking
Increased or decreased variability is commonly reported in populations with gait
abnormalities like elderly fallers [103, 104], older frail adults [105] and persons with neuro-
degenerative diseases (e.g, Parkinson’s disease) [106, 107], suggesting that gait variability
strongly associates with gait impairments. It is also suggested that alteration in gait variability is
specific to pathology and that healthy aging might not alter gait variability [108].
Step variability and its relation to gait impairments: Altered gait variability has been
strongly related to walking impairments and is suggested to be a quantifiable biomechanical
marker to evaluate impaired performance [77]. Increased gait variability has been related to
slower gait speed and poor cognitive status in adult fallers [77, 96, 109]. Similarly, central
nervous system impairments (like cognitive functioning and motor performance) have been
related to increased stance time variability [110], while decreased step width variability has been
related to sensory impairments and balance deficits during walking [104, 110, 111]. Gait
variability is also suggested to predict mobility disability [110]. Increased gait variability has
also been related to risk for falls, implying that excess variability in steps might relate to balance

31
impairments [101]. Further, there is a strong suggestion in the literature that altered (increased or
decreased) variability in steps is directly related to dynamic balance impairments since altered
variability has consistently shown to predict the risk for both past and future falls and those falls
specific to walking [77, 96, 101, 103].
Direction of alteration in gait variability: Motor control theories (like older hierarchical
models and more recent dynamical systems theories) support both views of increased and
decreased step variability as being beneficial to walking. While older motor control theories
suggest that increased motor variability is reflective of decreased motor skill, more recently
positive aspects of movement variability have been proposed [86]. It is suggested that stride-to-
stride variability in gait parameters might reflect the inherent abundance of the locomotor system
and therefore might be a requisite for adaptability [90].
Variability in step characteristics like step length, swing time, stride time and stance time
is consistently reported to increase during impaired gait [96, 98, 103, 106, 112]. However, there
is no clear consensus on the direction of alteration in step width variability and studies report
both increase [91, 112] and decrease in step width variability [96, 98, 113] in populations with
altered gait patterns. For example, while results of the study in healthy elderly population
reported that step width variability increased [95], Brach et al. (2001) and Maki et al. (1997)
reported that older adults with a history of falls show decreased step width variability [96, 98].
Brach et al. (2005) also showed that there is an optimal variability in step width that might be
required and that either too little or too much variability might be related to falls risk [104]. One
of the reasons for the inconsistency in the literature regarding step width variability is due to the
differences in the way step width is defined across studies, population groups tested and the
testing environment [114] [96].

32
Relevance of Reviewed Literature to Study Two
While alterations in step characteristics during walking are frequently reported (as shorter
step lengths, spatiotemporal asymmetries), characterization of gait variability may provide
quantifiable measures to evaluate additional aspects of impaired performance (like dynamic
balance and risk for falls) post-stroke. Further, in the stroke population, it is unclear whether
there would be an asymmetry in step variability and how this might relate to walking
performance. With the current suggestion in literature regarding the association between step
variability and walking impairments, it seems that characterization of variability in step
characteristics will provide insights into motor and balance control mechanisms in a stroke
population. Further, investigation of the relationship between stepping asymmetry and step
variability would help determine those persons with asymmetry showing specific performance
deficits (as evaluated by their step variability). Therefore, study two of this dissertation
characterized the step-by-step variability in ST characteristics and explained its relation to
hemiparetic walking performance.
Part 4. Foot Placement in a Body Reference Frame
One of the essential tasks during gait is appropriate positioning of the foot relative to the
body [115]. Especially, placement of the foot at the end of swing phase serves to establish a
stable base of support such that the body can progress forward efficiently during walking.
Therefore, foot placement is closely related to trunk/upper body movements and vice versa.
Biomechanical models of trunk movements and foot positions/placements during walking have
been earlier presented [114, 116-119]. However, assumptions of these models are validated
mainly in healthy young subjects and not in neurologically impaired populations. Investigation
of foot placement in a body reference frame (i.e., relative to the body) in a hemiparetic
population can directly assist in examination of parameters underlying generation of a step.

33
Defining Foot Placement Relative to Body
Note that spatiotemporal characteristics of steps that were discussed earlier in this literature
review specifically refer to kinematics of one foot as defined relative to the other foot (e.g., the
spatiotemporal parameter of step length is defined as anterior distance from the leading foot to
the trailing foot). Specifically, ‘Foot placement’ refers to the position of the foot in a step relative
to the body. For example, anterior foot position at heel strike relative to the body indicates the
instance at which foot was placed anterior to the body in a step.
Control of Foot during Gait
While basic limb movements are primarily determined by central pattern generators [79],
animal studies suggest that movements of the foot during gait are further fine-tuned and
regulated by cortical control [120, 121]. The cortical influences on foot during walking
contribute to the adaptability of the gait pattern [122, 123]. It is widely accepted that the
coordination of multiple degrees of freedom involved in locomotion is constrained by the central
nervous system through a small number of behavioral units [79, 124-126]. In human walking,
studies also indicate that while control of foot is implemented by ankle, knee and hip rotations,
the dynamics of the foot are centrally coded to generate the coordinated movements of stance
and swing phase [127, 128]. David Winter proposed that foot kinematics is a precisely controlled
sensorimotor task and is under the multisegmental motor control of both stance and swing phase
[127, 128]. Control of the foot during gait can also be understood within the premise of the
motor equivalence theory, where a given invariant task goal (as foot clearance or foot trajectory)
can be achieved through variable means [129, 130].
Body Center of Mass Position and Velocity: Postulated Link to Foot Placement
Approximately two-thirds of our body mass (head, arm, trunk), which dominates the
calculation of the center of mass position, is precariously balanced over the two legs. Such a
34
postural state imposes critical demands on the balance control system [131]. Unlike upright
weight-bearing postures where balance is maintained when the vertical projection of body center
of mass falls (COM) within the base of support (BOS), stability during locomotion is challenged
because both BOS and COM are in motion [132, 133]. COM is within the BOS only during the
two double support phases, which constitutes only 20% of a stride [132, 133]. During walking,
COM is controlled by support forces generated from the legs [132, 133]. Direction and point of
application of support forces provided from the ground acts at the centers of pressure on the foot
during the stride cycle. Foot placement at the end of each swing phase provides the primary
method of moving the COP in both sagittal and frontal plane [132, 133]. Thus, one of the
essential functions of foot position relative to body is to maintain the position of COM with
respect to the BOS such that dynamic balance during walking is maintained [134].
COM velocity during walking: Townsend proposed, through simulation analyses, that
stable gaits can be defined by foot placements which are a linear function of the position and
velocity of body center of mass at the time of foot placement [117]. Especially during walking,
the COM velocity, in addition to COM displacement, needs to be considered. Pai and group
demonstrated that balance may be impossible if COM velocity is directed outward, even if the
COM is above the BOS [135, 136]. As a refinement of this rule, Hof et al. (2007) recently
showed that the COM position plus its velocity (extrapolated COM: xCOM) should be within the
base of support [137]. They also suggested a measure of stability the ‘margin of stability’, which
is the minimum distance from the xCOM to BOS [137].
Foot Placement Relative to Body and its Relation to Walking Sub-tasks
Appropriate foot kinematics relative to body is essential to maintain functional sub-tasks
during gait. In the stance phase, body center of mass is propelled within limits of the foot placed
(to avoid falling). In the swing phase, trajectory of the foot needs to be appropriately controlled

35
such that foot positioning at the end of the swing phase is appropriately timed and placed. Foot
placement relative to body is also related to minimization of energy, conservation of forward
momentum or compensation for some musculoskeletal deficit [118]. Therefore, given the
importance of appropriate kinematics of the foot to maintain smooth and efficient locomotion, it
seems that investigation of foot kinematics during hemiparetic walking will serve as a tool to
investigate the unique impairments in this population.
Balance during gait, involves controlling movement of the whole body COM relative to
the BOS (often defined as the area enclosed between the foot placements) [132]. Thus, as
explained earlier, one of the essential roles of foot placement during gait is believed to be in
determining a new base of support at each step and thereby, maintaining the dynamic balance
during walking. Foot placements relative to the body and its relationship to the maintenance of
walking balance have earlier been explained in healthy gait [116-119].
Redfern and Schuman in 1994 postulated that foot placement requires symmetry of the
limbs with respect to the pelvis at heel contact such that the body center of mass is placed
equidistant from both feet during double support, creating a stable support base during the
transition to the next step [118]. Mackinnon et al. (1993) and Townsend MA (1981) showed that
the most important factor affecting frontal whole body balance is the mediolateral foot placement
relative to the center of mass established at initial contact [116, 134]. Therefore, these studies
suggest that foot placement relative to body is closely related to dynamic balance during gait.
Relevance of Reviewed Literature to Study Three
Post-stroke, quantifying where the foot is placed relative to body could provide a deeper
understanding of the mechanisms of hemiparetic walking than is possible when foot kinematics
alone are known (as when it is defined relative to other foot). For example, in persons who take
asymmetrical step lengths (relatively longer or shorter paretic step lengths), it is unclear whether

36
their foot placements relative to pelvis (or trunk) would also be asymmetrical. Further, since the
above literature review suggested that foot placement relative to body is also related to motor
and dynamic balance control mechanisms during walking, we expected that investigation of foot
placement relative to body would provide insights into motor control impairments during
hemiparetic walking. Therefore, study three of this dissertation quantified asymmetrical stepping
post-stroke in a body reference frame and explained its relationship to hemiparetic walking
performance measures.
Part 5. Pre-Swing and Swing Phase during Hemiparetic Gait
During walking, pre-swing of gait precedes the generation of a step and swing phase
occurs as the leg is stepping. Therefore, it is likely that several parameters (muscle activity,
kinetics and kinematics) that determine the pre-swing and swing phase of walking directly affect
where the foot is placed in the step. Consequently, investigation of mechanisms underlying the
generation of the pre-swing and swing phase during hemiparetic walking are likely to enable the
evaluation of the underlying causes of generation of stepping.
Introduction to Pre-Swing and Swing Phase during Gait
In healthy gait, pre-swing phase occupies 10% of the gait cycle and is more commonly
referred to as the second double support [67]. Swing phase occupies 40% of the gait cycle and
begins as the foot takes-off from the ground and ends when the foot strikes the ground again [20,
67]. Essential function of the pre-swing phase is to propel the trunk forward in preparation of leg
swing initiation [138, 139]. Essential functions of the swing phase include limb clearance from
the floor, advancement and forward progression of the leg and positioning the foot at the end of
swing phase in preparation for stance phase weight-bearing [20, 67].
Swinging motion of the leg is often likened to the unforced swinging of a compound
pendulum, suggesting that swing phase is a rather passive phenomenon [140, 141]. Furthermore,

37
activity in the leg muscles during swing is low [142, 143] and joint torques in the hip, knee and
ankle are also small in the swing phase relative to the stance of walking [144]. Nevertheless,
while joint torques are small in the swing phase they cannot be disregarded [145-147].
Furthermore, muscle activity is consistently reported during the swing phase of walking
suggesting the active constraints during swing [139, 148, 149]. Most importantly, precise
trajectory of the swinging limb and adequate clearance of the limb need to be planned and
optimized for efficient locomotion [128, 150]. It is also suggested that the swing phase of
walking is under fine regulation by the higher cortical centers in the central nervous system (that
are mediated by spinal and interneuronal networks) [151].
Kinematic Characteristics during Pre-Swing and Swing Phase
Pelvis excursions: Increased pelvic hiking during swing [152] to clear the paretic foot and
large lateral pelvis displacements [153] related to impaired side-to-side balance [154] are most
commonly reported in hemiparetic gait. Dequervain et al. (1996) also reported that the pelvis was
retracted at terminal swing in eleven of the 12 participants with slow gait speed and posteriorly
tilted throughout swing [70].
Hip excursions: Decreased pre-swing hip extension (bilaterally), decreased paretic hip
flexion (attributed primarily to slower speed) in mid-swing and at terminal swing have been
consistently observed in hemiparetic gait [16, 70]. Dequervain et al. (1996) also reported that
there was a delay in initiation of paretic hip flexion at toe-off and progression of paretic hip
flexion during swing, especially in those persons walking at extremely slow walking speeds [70].
Paretic hip circumduction to clear the foot is also commonly reported in persons with stroke [18].
Paretic hip is also shown to be excessively abducted and externally rotated during the swing
phase [152].

38
Knee excursions: Knee flexion at pre-swing and during swing phase is crucial for toe
clearance, which is the primary function of swing phase during gait [155]. In hemiparetic gait,
reduced paretic knee flexion during swing [16, 156, 157] is most commonly observed. Reduced
paretic knee flexion at pre-swing [69] and slow progression of paretic knee flexion during the
swing phase [70] have also been observed.
Ankle excursions: In hemiparetic gait, paretic ankle plantarflexion during pre-swing and
ankle dorsiflexion during swing [16, 70, 152, 156] are substantially reduced. Further, Kim et al.
(2004) reported that the paretic ankle remains in a relatively plantarflexed position even during
terminal swing [18]. Paretic ankle plantarflexion at toe-off is reported to be reduced, especially,
in those persons with stroke walking at slower walking speeds [70].
Kinetic Characteristics during Pre-Swing and Swing phase
Moments, Powers, Angular velocities
Even in healthy gait, moments, joint torques and powers are substantially reduced in the
swing phase compared to the stance. Therefore, most studies on healthy and hemiparetic gait
report either peaks or averages in these kinetic characteristics. This limits the understanding of
kinetic characteristics specifically in the swing phase of hemiparetic gait. There is general
consensus that most moments and power bursts are reduced in amplitude throughout the gait
cycle in persons with stroke compared to both age-matched [157] and speed-matched healthy
adults [158, 159]. Further, the reductions are reported to be greater on the paretic side than non-
paretic [158, 159].
There is much variation in the kinetic (see appendix for definition of kinetics) profiles of
persons with stroke [18]. In general, different kinetic strategies can be used to achieve similar
kinematic outcomes, increasing the challenge in the quantification of sub-groups that might have
specific strategies within the stroke population [160].

39
Hip, knee, ankle power bursts during swing: In healthy gait, power bursts in the swing
phase involve the A2 ankle burst (by concentric plantarflexor activity) during pre-swing and
early swing, K3 knee burst (by concentric extensor activity) during pre-swing and early swing,
K4 knee burst (by eccentric flexor activity) and H3 hip burst (by concentric flexor activity)
occurring in pre-swing and early swing [94, 131, 161]. See Figure 2-6 for explanation of these
power profiles. In hemiparetic gait, it is observed that A2 burst is substantially reduced on the
paretic side in slow walkers [5]. Whereas, for those who walk fast, K3 burst is reported to be
even greater than normal on the non-paretic side [5]. Similar to the A2 burst, H3 burst is reported
to be considerably reduced on the paretic side [5]. Therefore, the amplitude of these kinetic
variables seems to be positively scaled to the gait speed or functional capacity of persons with
stroke [158, 159, 162, 163].
Inter-compensations between hip and ankle powers: Slow walkers especially present
with a marked reduction in pre-swing ankle push-off (A2) and early swing hip pull-off (H3)
[159] on both paretic and non-paretic sides. Contrarily, persons walking at faster walking speeds
or higher functional capacities show less reduction in these power bursts and even present with
larger positive work by bilateral hip extensors in early stance (H1) and by early swing paretic hip
flexors (H3) [158, 159]. The greater magnitude of hip bursts (H1 and H3) can assist in
propulsion, compensating for the reduction in ankle push-off (A2) in persons with stroke who
walk fast [158, 159]. Similarly, larger K3 burst is reported in the fast walkers [158, 159]. Thus,
several kinetic asymmetries are accentuated between limbs in the fast walkers, suggesting that
locomotor capacity is not necessarily recovered through ‘normalization’ of kinetic profiles but
may be directly related to compensatory mechanisms [53]. In the literature, this result is usually
interpreted to mean that symmetry should not be a primary focus for rehabilitation [5, 18, 53].

40
However, investigation and differentiation of impairment from compensation is essential to
retrain function maximally. Identification of impairment, on the other hand, will assist in
normalization of some of the underlying kinetics (e.g., improving the paretic ankle plantarflexor
force generation to improve paretic ankle power burst).
Angular velocity of knee in pre-swing determines knee flexion during swing: With
regards to angular velocity, dynamic simulations of swing phase in healthy gait performed in the
absence of muscle joint torques approximated normal knee kinematics by selecting the initial
angular velocities and positions alone [140, 164]. This suggests that the initial angular velocity is
an important determinant of normal knee kinematics during swing. Further, Piazza and Delp
(1996) found that the amount of knee flexion achieved during swing is decreased by either
increasing hip flexion velocity or decreasing knee flexion velocity at pre-swing [145]. In
hemiparetic gait, Chen et al. (2005) showed that persons with stroke showed impaired paretic
swing initiation that they characterized as inadequate paretic limb propulsion in pre-swing,
reduced paretic knee flexion at toe-off and mid-swing [69].
Interjoint coordination during swing phase
Shemmell and associates (2007) recently showed that dynamic torques generated across
hip, knee and ankle are tightly coupled during swing phase of normal gait and that a single
kinetic time series can describe the pattern of torque production at each joint during this phase
[165]. They proposed that such a flexible inter-joint coupling might serve to simplify the control
of the swing phase by the CNS. Inter-joint coordination during swing is also revealed indirectly
through studies, which report that an increase in hip flexor moment during swing also increases
knee flexion [166]. Some inter-joint coordination is also expected given that bi-articular muscles
that span two joints are physiologically capable of affecting segments further distally. Further,

41
the complex inter-segmental dynamics of the body can also explain the inter-joint coordination
of kinetics in the swing phase [167, 168].
Muscle Activity during Pre-Swing and Swing Phase
Pre-swing and swing phase muscle activity in healthy gait: Although low, muscle
activity is consistently reported in swing phase of healthy gait. In general, hip flexors have
shown to dominate swing phase [169-171]. Specifically, Nene et al. (1999) and Neptune et al.
(2001) show that rectus femoris (RF) is responsible for swing initiation [139, 148]. Furthermore,
medial gastrocnemius (MG) is also suggested to aid in swing initiation [148]. On the other hand,
Gotschall and Kram (2005) based on their novel methodology of application of external forces
during treadmill walking, showed that while both iliopsoas (IP) and RF initiate and propagate
swing, ankle extensors do not directly contribute to swing initiation [172]. Further, indirect
evidence of specific contributions of muscular activity in swing phase is revealed in the study by
Goldberg et al. (2003) where they evaluate muscles that influence knee flexion velocity in the
pre-swing phase (knee flexion velocity directly influences knee kinematics during swing) [173].
Goldberg et al. (2003) in their study conclude that while MG and IP directly contribute to swing
by increasing the knee flexion velocity in pre-swing, vastii, RF and soleus decrease knee flexion
velocity thereby reducing knee flexion in swing [173]. Further, Winter DA (1992) suggested that
Tibialis anterior (ankle dorsiflexor) were specifically required during mid-swing for limb
clearance, whereas biarticular hamstrings (long head of biceps femoris) decelerates the limb in
terminal swing to prepare it for weight acceptance [128].
Pre-swing and swing phase muscle activity in hemiparetic gait: There are much fewer
reports on muscle activity in pre-swing and swing phase of hemiparetic gait. In general, large
interindividual variability is observed in the EMG patterns that characterize muscle activity in
individual patients. Den Otter et al. (2007) reports that paretic TA activity significantly increases

42
in the swing phase of persons with stroke compared to healthy persons [174]. Further, since
EMG activity can be observed as premature activation, abnormal coactivation or as
compensatory or adaptive coactivation, it is difficult to suggest whether observed muscle activity
is a sign of impaired motor control or adaptive behavior to promote functional walking.
Nevertheless, association of EMG activity to walking performance might provide insights into
the role of observed activity.
Relevance of Reviewed Literature to Study Four
Overall, the above literature review suggests that several studies have reported kinematic,
kinetic characteristics and muscle activity during pre-swing and swing of hemiparetic gait.
Nevertheless, a holistic picture of control strategies in hemiparetic pre-swing and swing phase
are lacking, primarily because pre-swing and swing phase dynamics have not been correlated
with walking performance after hemiparesis. It is likely that events during the pre-swing and
swing phase determine where the foot is placed in the step. Thus, patterns observed in these
phases during hemiparetic gait might explain the underlying reasons for the variability in
stepping asymmetry. Therefore, in study four of this dissertation specific pre-swing and swing
phase variables were used to explain step length variability. Specifically, selected kinematic and
kinetic variables corresponding to initial conditions of the leg, swing phase and contralateral
stance phase (occurring at the same instance as swing phase) explained step length generation
during hemiparetic gait.

43
Figure 2-1. A simplified model demonstrating neural control of gait
The central pattern generators in the spinal cord generates the locomotor rhythm that is modified by afferent information from the higher centers and the periphery. Abbreviations: CST – Corticospinal Tract.
44
Figure 2-2.Division of a gait cycle into phases
The gait cycle is divided into stance (0 – 60%) and swing (60-100%) phase. The stance phase can be further sub-divided into two double support phases (10% each) and a single support phase (40%). Source: http://www.vard.org/mono/gait/gaitcov.htm

45
Figure 2-3.Methodology for collection of spatiotemporal characteristics during walking using an
instrumented mat (GAITRite)
GAITRite is an electronic walkway with sensors embedded within it that record the spatial and temporal characteristics of steps as a person walks over it. A sample walk that was recorded by GAITRite is presented in this Figure. Note the parameters generated by the software.

46
Figure 2-4. Illustration of ground reaction forces exerted by the limbs and typical force curves
This Figure illustrates the 3-D forces applied to the ground from the legs (Fx, Fy, Fz) and the measured Ground reaction forces (Rx, Ry, Rz). The plots on the bottom demonstrate these GRF curves from the right (red) and left (blue) legs normalized to the body weight of the person for the three force components [Vertical GRF (Rz), AP - Anterior-posterior GRF (Ry), ML- Medial-Lateral GRF (Rx)].

47
Figure 2-5. Variability (in stride time) during walking and its relation to risk for falls
Source: Hausdorff, J. M. (2005), Gait variability: methods, modeling and meaning. J Neuroengineering Rehabil, 2, 19

48
Figure 2-6. Power profiles in swing phase of a healthy gait cycle
The swing phase begins at approximately 60% of the gait cycle. The arrows show the power bursts in hip (H3), knee (K3) and ankle (A2) during swing phase of healthy gait. Red is right leg and blue is left leg.

49
CHAPTER 3 RELATIONSHIP BETWEEN STEP LENGTH ASYMMETRY AND WALKING
PERFORMANCE IN SUBJECTS WITH CHRONIC HEMIPARESIS
Introduction
The asymmetrical nature of hemiparetic walking is well documented in persons who have
sustained a stroke, [12, 13, 175] with the asymmetries in spatiotemporal, kinematic and kinetic
parameters of walking related to disturbances in motor coordination [5]. Specifically, asymmetry
in spatiotemporal parameters have been commonly used in the clinic to examine the walking
patterns in patients who have experienced a stroke [19]. Previous studies [13, 176] have reported
that temporal (swing time) asymmetry is a significant predictor of hemiparetic walking
performance since it strongly correlates with stages of motor recovery, walking speed and falls.
However, the relationship between spatial (step length) asymmetry and hemiparetic walking
performance is unclear.
It has earlier been reported that, after a stroke, patients may walk with either relatively
longer paretic steps or longer non-paretic steps [19, 65, 71]. Therefore, consistent patterns of step
length asymmetry have not been observed. Moreover, the reasons for the variability in step
length asymmetry patterns and the relation of the variable patterns with walking performance
have not yet been explained. For instance, in the study by Kim et al. (2003), considerable
variability in step length asymmetry was observed in a sample of 28 chronic stroke survivors
[19]. While 14 of these subjects walked with longer paretic steps than non-paretic, 14 others
walked with relatively longer non-paretic steps. Consequently, they hypothesized that the
variability in the patterns of step length asymmetry may be due to compensatory strategies that
increase or decrease the step length of either the paretic or non-paretic leg. However, they were
unable to advance the discussion since they found a non-significant relationship between step
length symmetry and symmetry in vertical ground reaction forces. Further, other studies indicate

50
that; on an average, individuals who have sustained a stroke walk with relatively longer paretic
steps [65, 71]. Therefore, neither consistent patterns of step length asymmetry have been
observed nor have the asymmetrical patterns been characterized. Further, the relationship
between step length asymmetry and walking speed is not well documented in the current
literature. This may be another reason for insufficient understanding of the affect of step length
asymmetry on hemiparetic walking performance. For instance, shorter stride lengths (bilaterally)
have been related to slower walking speed and thereby poor walking performance [70], and yet a
non-significant relationship has been suggested between step length asymmetry and walking
speed [19]. Overall, current evidence suggests that persons after a stroke may walk with different
patterns of step length asymmetry that may be unrelated to the attained walking speed. However,
it is not clear how the different asymmetrical patterns relate to post-stroke hemiparetic walking
performance and why asymmetry in step lengths may not necessarily limit the attained walking
speed.
We propose that correlating the asymmetry observed in step lengths with propulsive
ground reaction forces (GRFs) during walking can provide a basis to evaluate different
asymmetrical patterns and their effect on hemiparetic walking performance. Propulsive GRFs
represent the net forces generated by the legs to accelerate (propel) the body’s center-of-mass
forward. The propulsive GRFs quantify forward propulsion during walking, which is an essential
requirement of locomotion along with body support [27]. In our recent work, we have shown that
the paretic leg propulsive GRFs can provide a quantitative measure of the coordinated output of
the paretic leg during hemiparetic walking [76]. Specifically, we found that the percentage of
propulsive forces generated by the paretic leg (Propulsion Paretic) can quantify the contribution of
the paretic leg to the coordinated task of forward propulsion during walking. In our present

51
study, we hypothesized that the Propulsion Paretic would correlate with asymmetry observed in
step lengths since generation of a step requires forces exerted by the legs to propel the body’s
center-of-mass. Further, we suggest that correlating the asymmetry observed in step lengths with
propulsive GRFs during walking can help understand the relationship between spatial asymmetry
and walking performance after a stroke.
Therefore, the primary purpose of our study was to explore the correlation between step
length asymmetry and propulsive forces in an attempt to quantify the affect of spatial asymmetry
on post-stroke hemiparetic walking performance. Further, we investigated how asymmetrical
step lengths may be related to hemiparetic severity (as rated by Brunnstrom staging), walking
speed, vertical GRFs and other spatiotemporal walking parameters (walking speed, swing time,
pre-swing time and ability to change speed) to gain a holistic understanding of the relationship
between asymmetrical step lengths and hemiparetic walking performance.
Methods
Participants
We recruited 49 subjects with chronic hemiparesis [42 men, 7 women; ages = 62.7 ± 10.2
(SD) years; time since stroke = 4.25 ± 3.67 (SD) years; affected side – left = 25, right = 24] were
recruited at the Palo Alto Department of Veterans Affairs Medical Center. The data presented in
this study were collected as part of a larger study that investigated the links between gait
characteristics and bone density in chronic stroke survivors [177]. Inclusion criteria were: at
least 6-12 months post stroke, unilateral weakness, and the ability to walk 10 meters in 50
seconds or less without manual assistance. Subjects were allowed to use their assistive devices
(AFO and/or Cane) during the testing. Subjects were excluded from the study if they had any
orthopedic or neurological conditions in addition to the stroke, had more than one CVA incident

52
and were unable to provide informed consent. Brunnstrom motor recovery stages were used to
determine the severity of hemiparesis for the subjects [178]. Subjects varied in their ability to
perform voluntary movements within and outside of flexor and extensor synergy patterns (as
assessed clinically by Brunnstrom staging). Based on their Brunnstrom stage, three groups of
subjects with differing hemiparetic severity were identified. Subjects in the ‘Severe hemiparesis’
group (Brunnstrom stage 3, n=19) were limited to movements within the synergy patterns (e.g.,
only basic limb flexion or extension synergies can be performed voluntarily). Subjects in the
‘Moderate hemiparesis’ group (Brunnstrom stages 4-5, n=20) were able to produce some
movement combinations outside of the synergy patterns. Subjects in the ‘Mild hemiparesis’
group (Brunnstrom stage 6, n=10) were able to produce both isolated joint movements and
movements in synergy patterns. All participants in the study signed a written informed consent
and the Stanford Administrative Panel on Human Subjects in Medical Research approved the
protocol.
Procedures
The subjects walked separately over the GAITRite and force platforms at their self-
selected and fastest safe speeds to collect the spatiotemporal parameters and GRFs, respectively.
GAITRite (CIR Systems, Inc) is a portable instrumented electronic walkway 4.3 meter long and
is a valid and reliable system for measuring spatiotemporal parameters [179]. Force platforms
(Advanced Medical Technology, Inc) embedded across a 10 m walkway were used to collect
three-dimensional GRFs during the gait cycle. Before testing, clear explanations were provided
to the subjects regarding the importance of walking in their natural manner during the testing and
avoidance of targeting the force plates. During GAITRite data collection, the GAITRite was
placed over the force plates. However, the force plate data was not collected while subjects were
walking on the GAITRite. Subjects started walking 5-6 steps before the GAITRite and stopped

53
5-6 steps after passing the GAITRite to get constant speed data over the mat and avoid the
effects of acceleration and deceleration. Subjects walked a total distance of 10 meters over the
GAITRite. Three good walking trials, each at self-selected and fastest safe speeds, were collected
over the GAITRite. Some subjects were asked to walk 1 or 2 more trials due to problems like
tripping during walking. The number of trials collected for the force plate data were variable and
depended on whether both or at least one leg were determined by visual inspection to have had
adequate contact on the force platforms. GRF data were acquired at 200 Hz and the horizontal
and vertical forces (normalized to the individual’s body weight) were used for analyses. A
therapist provided close supervision during the walking trials. Subjects were allowed to take rests
between trials if they needed to. Walking speed was calculated by the GAITRite and no
estimates of speed were used from the force plate trials.
Data Analyses
GAITRite data: We analyzed all the collected trials (3 for each speed). The data from
individual trials were averaged together to determine the spatiotemporal variables for each
participant. Spatiotemporal variables included in this study were self-selected and fastest walking
speed, step lengths, swing times and pre-swing times (time spent in double support phase of gait
cycle). Paretic and Non-paretic step length, swing time and pre-swing time data were averaged
only from the trials of self-selected walking speed. Subjects’ self-selected walking speed were
categorized as: speed < 0.4 m/s (household ambulatory); 0.4 – 0.8 m/s (limited community); and
speed > 0.8 m/s (community ambulatory) [180]. Step length asymmetry was quantified using a
step length ratio (SLR), which was defined as the Paretic step length [181] divided by the Non-
paretic step length [181]. The fastest safe walking speed data were utilized to calculate the
percentage change (from self-selected to fastest safe speeds) in walking speed, cadence, paretic
step lengths, and non-paretic step lengths.

54
Force plate data: We collected a minimum of 4 trials and a maximum of 15 trials to
assure adequate contact on the force platforms to determine the ground reaction force patterns for
each participant. The GRF values that were analyzed for individual participants were variable
and depended on the number of trials with good foot contacts on the force platforms. Good foot
contacts were determined if both legs made contact with the force platforms in entirety. When
possible, multiple good foot contacts were averaged to generate ground reaction force values, but
in one participant, only one trial could be analyzed.
Raw anterior - posterior and vertical GRF data were normalized to body weight and
processed using a custom Matlab program. Note that anteriorly directed forces are propulsive
(positive) and posteriorly directed forces are braking (negative) (Figure 3-1). The impulse for
each leg was calculated as the time integral of the GRF (the area under the GRF curve) :
Ixl = ∫ GRFxdt (Equation 1)
where I = Impulse, force component x= v (vertical), p(propulsive) or b (braking) and leg l
= p (paretic) or n (non-paretic). Paretic propulsion (Pp) was then calculated from the propulsive
impulse:
PP (%) = Ipp / (Ipp + Ipn) * 100
Statistical Analyses
A paired sample t-test was used to test whether the differences between the paretic and
non-paretic step length were statistically significant. Relationships between the step length
asymmetry (SLR), GRFs and walking speed were characterized using Pearson’s correlation
coefficient (r) and that between SLR and hemiparetic severity using the non-parametric
Spearman’s correlation coefficient (ρ). For other walking variables included in the study,
descriptive analyses were conducted to understand their relationship with the asymmetrical
patterns. All statistical analyses were performed with SPSS 12.0 software.

55
Results
The walking variables were collected at the self-selected walking speeds for all subjects
and at the fastest safe speeds for 46 subjects. Data were not collected for 3 subjects at their
fastest speeds due to safety concerns. Nineteen of the 49 subjects used a mobility aid [i.e., a cane
or an ankle foot orthosis or both] to ambulate. Paired sample t-tests revealed that the paretic step
lengths were significantly different from the non-paretic step lengths (p = .0001). Therefore, step
length asymmetry was characterized and three patterns of step length asymmetry were identified.
The symmetrical group were defined as subjects with SLR between 0.9 to 1.1 [SLR = 1 ± 0.1
(10%) SD]. Asymmetrical groups were those with SLR > 1.1 (longer paretic steps than non-
paretic) and SLR < 0.9 (longer non-paretic steps than paretic).
Relationship between Step Length Asymmetry (SLR) and GRFs
Correlation analysis revealed a strong negative correlation between SLR and Pp with Pp
explaining 62 % (r = 0.785, p < 0.001) of variance in step length asymmetry (Table 3-1).
Subjects that demonstrated impaired paretic leg propulsion (Pp) and increased non-paretic leg
propulsion walked asymmetrically with longer paretic steps than non-paretic [Figure 3-2, top
tracing]. In contrast, subjects generating symmetrical GRFs with the two legs walked nearly
symmetrically [Figure 3-2, middle tracing]. Subjects generating relatively proportionate or
greater Pp walked asymmetrically with longer non-paretic steps than paretic. However, the
greater Pp generated by these subjects walking with longer non-paretic steps was lesser in
magnitude compared to those walking symmetrically. Refer to Figure 3-2 and compare the Pp
between GRF curves of the bottom and middle tracing.
Asymmetrical group with longer paretic step lengths than non-paretic (n = 16):
Subjects that generated the least paretic propulsion (Pp < 20%) walked with relatively longer

56
paretic step lengths. Five of these 16 subjects generated 5% or less Pp and walked with the
longest paretic steps relative to the non-paretic leg (SLR > 1.5) (Figure 3-3).
Asymmetrical group with longer non-paretic step lengths than paretic (n = 4): There
were only 4 subjects who were classified as asymmetric and walked with relatively longer non-
paretic step lengths. Three of these four subjects generated substantial propulsive forces with the
paretic leg (Pp > 55%; however one subject generated only 25% Pp).
Symmetrical group (n = 23): Twenty-three subjects walked symmetrically. Seventeen of
these 23 subjects generated almost symmetrical propulsive forces (Pp = 35 – 57 %) and the rest
generated lesser paretic leg propulsion (Pp = 15 – 30%).
Only 10 of 49 subjects in the study population generated a net braking impulse in the pre-
swing (normally propulsive) phase of the gait cycle and these 10 subjects walked at SLR > 1.1,
with 5/10 subjects walking at SLR > 1.5. Nine of these 10 subjects used a mobility aid for
ambulation and only one subject walked independently. We separately analyzed the data for
subjects who used a mobility aid from those who did not to investigate whether the relationship
between step length asymmetry and paretic leg propulsion changed by using a mobility aid.
Subjects walking with a mobility aid generated less Pp in comparison to those who walked
without one. However, the relationship between SLR and Pp was not different for those who did
or did not use a mobility aid.
With respect to the vertical GRF, all subjects (irrespective of their step length asymmetry
pattern) supported a greater percentage of body weight on the non-paretic leg than the paretic leg
during the two double support phases in the gait cycle. However, moderate correlations (r = -
0.447, p < .001) were found only between SLR and percentage of body weight supported on the
paretic leg during the pre-swing phase of the paretic leg (Table 3-1).

57
Relationship between Asymmetrical Step Lengths, Hemiparetic Severity and Walking Speed
While SLR correlated weakly with walking speed (r = -0.351, p < .05), a stronger
correlation existed between SLR and hemiparetic severity (ρ = -.526, p < .001) (Table 3-1).
Eleven out of the 19 subjects with severe hemiparesis walked asymmetrically with relatively
longer paretic steps than non-paretic and yet walked at differing walking speeds (Figure 3-4).
Note that 4 subjects with severe hemiparesis that walked asymmetrically with longer paretic
steps generated much less paretic leg propulsion (Pp < 25%) and yet walked at speeds greater
than 0.8 m/s (community ambulatory) [180], (Figure 3-4). In contrast, the 3 subjects (Figure 3-4)
with mild hemiparesis (Stage 6) who walked symmetrically or asymmetrically (with longer non-
paretic steps) generated much greater paretic leg propulsion (Pp ≥ 45%) and yet walked at slower
speeds between 0.4 – 0.8 m/s (limited community ambulatory) [180].
Relationship between Step Length Asymmetry, Time Spent in Pre-Swing and Swing Time
Only 8 of 49 subjects spent greater than 20% of cycle time during the paretic pre-swing
phase (compared to 10-20% cycle time in their non-paretic pre-swing). These 8 subjects walked
asymmetrically with longer paretic steps than non-paretic. With respect to swing time, only 2 of
49 subjects spent greater time swinging their paretic than the non-paretic leg. Subjects walking
at SLR > 1.1, on an average, spent the greatest time swinging their paretic leg.
Relationship between SLR, Change in Gait Speed and Parameters That Contribute to Change in Speed
Absolute mean differences were evaluated for these analyses. Subjects walking
symmetrically increased paretic and non-paretic step lengths and cadence at faster walking
speeds. In contrast, those walking asymmetrically at SLR > 1.1 had little increase in their paretic
step length at the faster walking speeds even though they increased their cadence as much as the
symmetrical group (Figure 3-5).

58
Discussion
Relationship between Step Length Asymmetry and Propulsive Forces during Hemiparetic Walking
Step length asymmetry during walking is related to propulsive forces generated by persons
with hemiparesis. Our data revealed that subjects generating relatively lesser propulsive forces
with the paretic leg walked asymmetrically with longer paretic steps than non-paretic (SLR >
1.1) On the other hand, subjects walking symmetrically (0.9 < SLR < 1.1) generated near
symmetrical propulsive forces with the two legs. In Figure 3-2 comparison of PP between
subjects with SLR > 1.1, 0.9 < SLR < 1.1 and SLR < 0.9 indicates that there may be distinct
differences in paretic leg propulsion between subjects with different patterns of step length
asymmetry.
To our knowledge, there is little direct evidence for the mechanisms that control step
length in normal and hemiparetic walking. However, indirect evidence for the control of step
length during walking is provided by a few studies. Varraine et al. (2000) suggests two potential
controlling mechanisms for intentionally lengthening a stride in healthy individuals: control of
trunk progression and control of leg trajectory [182]. In their study, subjects were able to
lengthen their stride by generating greater propulsive forces. The increased propulsive forces
enabled the trunk to progress further forward and thereby, generate a longer step. Additionally,
subjects took a longer step by holding the leg longer in the swing phase. Further, recent studies
have highlighted the causal relationships between muscle activity in pre-swing and the resulting
swing leg trajectory [148, 183, 184]. These studies indicate that kinematics of the leg in its pre-
swing phase affect trajectory of the leg in its swing phase and thereby, magnitude of the step
length. This implies that the leg producing greater forward propulsion in pre-swing might take
the longer step length. However, the results from our study suggest the opposite. We showed that
59
persons generating impaired paretic leg propulsion walked with a relatively longer paretic step.
These persons generating impaired paretic leg propulsion also generated relatively greater non-
paretic propulsion, likely to compensate for the lesser paretic leg propulsion. For example, in
Figure 3-2, compare the relative contributions of non-paretic propulsion in the top and middle
GRF tracings. These results suggest that a high SLR (i.e., paretic step length > non-paretic step
length) is in large part the result of the relatively greater non-paretic leg propulsion. For instance,
greater forward propulsion by the non-paretic leg in its stance phase will cause the trunk,
including the pelvis to move forward. This forward motion of the pelvis will increase with
increased propulsion and can cause the swinging paretic leg to move forward relative to the
ground even if it moves little relative to the pelvis. Therefore, greater non-paretic leg propulsion
is one mechanism for the longer paretic steps (high SLR). Further, persons with high SLR also
spent a longer time swinging their paretic leg than others who walked with symmetrical steps.
Therefore, one might hypothesize either/both greater non-paretic leg propulsion or a longer
paretic swing phase as potential candidates to explain the mechanisms underlying a relatively
longer paretic step length.
The strong relationship between the patterns of step length asymmetry and propulsive
force asymmetry might suggest a mechanical relation between step length and propulsive force.
For example, if the leg were to be an inverted pendulum, the generation of horizontal forces
would be directly related to the position of the foot relative to the body’s center-of-mass.
Specifically, foot placement anterior to the center-of-mass (as during heel strike) would induce a
braking force and foot placement posterior to the center-of-mass (as in pre-swing phase) would
induce a propulsive force. In this sense, an asymmetry in the placement of the feet may induce
asymmetrical propulsive forces when the foot is placed more anterior to the center-of-mass than

60
posterior. However, the inability to place the foot further behind the center-of-mass than
forwards (as with longer paretic steps than non-paretic) suggests specific impairments underlying
the asymmetrical step lengths. For example, the inability to achieve adequate hip extension may
limit the propulsive forces exerted during the terminal stance. Furthermore, during the terminal
stance of the paretic stride the paretic foot is likely posterior to the body’s center-of-mass and yet
there is no propulsive force generated (see Figure 3-2, top tracing). Therefore, it is more likely
that there may be an active reduction in propulsive force generation. The active reduction in
propulsive force generated in the pre-swing may, in turn, suggest impaired uniarticular ankle
plantarflexor activity [148]. On the contrary, in the participants walking with relatively shorter
paretic steps (SLR < 0.9), the greater paretic propulsive force generation suggests that plantar
flexors may be providing reasonable propulsion. Stepping, however, depends not only on the
ability of the plantarflexors to propel the body forward but also on the ability of the hip flexors
to generate power to the swinging leg [184]. Therefore, having shorter paretic steps relative to
non-paretic steps may indicate an inability to advance the paretic leg due to impaired swing
initiation by the hip flexors. In addition to direct mechanical effects of foot placement on
propulsive force generation, it is likely that the mechanisms underlying asymmetrical steps
reflect distinct muscular impairments that determine the observed patterns of step length
asymmetry during hemiparetic walking. Future studies targeted at investigating the underlying
muscular impairments shall further determine the underlying causes for high SLR. Yet, the
strong relationship between SLR and propulsion can be utilized in the clinic as a tool to
distinguish persons in their ability to generate propulsive forces. Beyond simply promoting
symmetry, SLR can be utilized to develop individual goals that train propulsive force production,

61
equalize bilateral biomechanical involvement by improving hip extension, or promote paretic
step initiation.
Relationship between Step Length Asymmetry, Walking Speed and Hemiparetic Severity
We were also able to investigate the relationship between walking speed, hemiparetic
severity and asymmetry in step lengths. A weak relationship between step length asymmetry and
walking speed was observed, indicating that asymmetrical patterns need not necessarily limit the
attained walking speed. However, hemiparetic severity (as rated by Brunnstrom staging) seemed
to predict step length asymmetry since the majority of subjects with severe hemiparesis walked
asymmetrically at SLR > 1.1. Furthermore, differences in Pp between the persons with mild and
severe hemiparesis were unrelated to the attained walking speed. For example, in Figure 3-4,
four subjects with severe hemiparesis had impaired Pp and yet they were walking at speeds > 0.8
m/s. In contrast, three subjects with mild hemiparesis generated greater Pp and yet walked at
slower speeds between 0.4-0.8 m/s. The weak relation between Pp and walking speed indicates
that other compensatory mechanisms could help some persons to attain a relatively functional
walking speed. Quantification of these compensatory mechanisms may be difficult when speed
alone is the outcome measure since walking speed is the net outcome of the two legs. However,
asymmetrical step lengths might indicate compensation in those persons walking with a high
SLR and faster walking speeds compared to those walking with a high SLR and slower walking
speeds. This is because subjects with relatively longer paretic steps would have lesser paretic leg
propulsion, and if they continue to walk at faster speeds they might accomplish these speeds via
compensatory strategies. For example, one of the ways to attain a faster speed (i.e., acceleration
of the body’s center-of-mass) would be to generate greater propulsive forces with the non-paretic
leg that serves to accelerate the center-of-mass forward. Other compensations can also arise from

62
the paretic leg itself or from the trunk (e.g., forward lean) to attain relatively functional walking
speeds despite decreased propulsive force with the paretic leg.
Relationship between Step Length Asymmetry, Paretic Pre-Swing Time and Vertical GRFs
Furthermore, we were able to determine the relationship between step length asymmetry,
other spatiotemporal parameters and vertical GRFs. The evidence that impaired paretic leg
function prolongs the paretic pre-swing phase supports our finding that persons walking at SLR
> 1.1 supported less weight on the paretic leg during the pre-swing phase. This finding thereby
increases the need to develop compensatory strategies to overcome these deficits [70]. In
particular, note that in our study we allowed participants to walk naturally as they would in the
community and 19 persons used some mobility aid for ambulation even during the testing.
Although persons walking with a mobility aid generated less Pp in comparison to those who
walked without one, the relationship between SLR and PP did not change while analyzing only
the data for those subjects who used an aid or those who did not. This corroborated our
hypothesis that a high SLR was related to specific problems in propelling the body forward with
the paretic leg. However, the high SLR may neither necessarily limit the attained speed nor may
substantially limit persons from changing their walking speeds. As revealed in Figure 3-5,
compared to the symmetrical group persons with high SLR seemed to primarily increase their
speed by increasing cadence with much less increase in the paretic step lengths. This indicates
that persons walking with asymmetrical step lengths may utilize different strategies to increase
their walking speeds. Further, even though the subjects with SLR > 1.1 walked with relatively
longer paretic steps than non-paretic at their self-selected walking speeds, they were unable to
change the paretic step length as much as the non-paretic when changing their speed.

63
Conclusions
We were able to provide some insights into the relationship between asymmetrical step
lengths and hemiparetic walking performance. Asymmetry in step lengths strongly relates to the
propulsive forces generated by the paretic leg. Greater non-paretic leg propulsion to offset the
impaired paretic propulsion is likely one of the mechanisms for the high SLR (paretic step length
> non-paretic step length). Despite mechanical relations between foot placement and force
generation that are expected, we believe that there are additional muscular impairments
underlying the asymmetrical patterns. However, further research is warranted to confirm this.
Yet, the strong relationship between SLR and propulsion can be utilized in the clinic as a
measure to evaluate the propulsive forces generated by the paretic leg. We were also able to
provide a basis to evaluate the different asymmetrical patterns by correlating the asymmetry
observed in step lengths with propulsive GRFs during hemiparetic walking. Moreover, the
relationship between SLR, speed and hemiparetic severity indicates that SLR, when used along
with speed as an outcome measure, can help understand compensatory strategies that some
persons (who are asymmetrical and yet walk at faster speeds) use to offset the lesser propulsive
force ability of the paretic leg. The relationship between SLR and other spatiotemporal walking
parameters further reveals how asymmetrical step lengths may affect hemiparetic walking. In
summary, we propose that SLR is a promising tool that rehabilitation therapists might use to
further the understanding of hemiparetic walking performance. Clinically, this would enable the
identification of walking impairments in hemiparetic individuals and tailor locomotor retraining
specifically to address the root causes of impaired ambulation for each individual.

64
Table 3-1. Correlation between SLR and walking variables

65
Figure 3-1. Illustration of horizontal GRF impulses
Positive values (shaded area) represent propulsion. Negative values (unshaded area) represent braking. Paretic leg is the bold curve and non-paretic leg is the light curve. Ipp – Propulsive impulse by the paretic leg is the shaded area under the bold curve; Ipn -Propulsive impulse by the non-paretic leg is the shaded area under the light curve; Ibp - Braking impulse by the paretic leg is the unshaded area under the bold curve; Ibn - Braking impulse by the non-paretic leg is the unshaded area under the light curve.

66
Figure 3-2. Comparison of GRFs between the paretic and non-paretic legs for subjects walking with differing SLR
Abbreviations: PHS = paretic heel strike, NTO = non-paretic toe off, NHS = non-paretic heel strike, and PTO = paretic toe off. Positive values (shaded area) represent propulsion, and the positive area under the curve is the propulsive impulse. Subject walking with SLR = 1.47 (i.e, SLR > 1.1) generates decreased paretic leg propulsion (PP). In contrast, the subject walking at SLR = 0.98 (i.e., 0.9 < SLR < 1.1) generates symmetrical propulsive impulse and the subject walking with SLR = 0.68 (i.e., SLR < 0.9) generates relatively greater paretic leg propulsion, PP (although low in magnitude).
SLR = 1.47
Gait Speed = 0.71 m/s
Severe hemiparesis
SLR = 0.98
Gait Speed = 0.75 m/s
Mild hemiparesis
SLR = 0.68
Gait Speed = 0.52 m/s
Mild hemiparesis

67
Figure 3-3. Relationship between step length ratio and Propulsion Paretic
Abbreviations: Propulsion Paretic = paretic leg propulsion (in %), P = Paretic leg, NP = Non-paretic leg. Solid vertical line indicates symmetric steps (SLR = 1), vertical dashed lines indicate the SLR subdivisions at SLR = 0.9 and SLR = 1.1. Solid horizontal line indicates symmetric propulsive force generation by the paretic leg (PP = 50%), horizontal dashed lines indicate differing levels of paretic leg propulsion (10%, 30% and 70 % PP).

68
Figure 3-4. Relationship between step length asymmetry, walking speed and hemiparetic severity
Abbreviations: P = Paretic leg, NP = Non-paretic leg. Solid vertical line indicates symmetric steps (SLR = 1), vertical dashed lines indicate the SLR subdivisions at SLR = 0.9 and SLR = 1.1. Horizontal dashed lines indicate sub-divisions of walking speeds (< 0.4 m/s – household walkers, 0.4 - 0.8 m/s – limited community walkers, > 0.8 m/s – community walkers). Note that subjects with different SLR walk at all levels of walking speeds, yet majority of those with severe hemiparesis walk asymmetrically at SLR > 1.1.

69
Figure 3-5. Change in speed, cadence and individual step lengths in subjects walking at different
SLR [SLR > 1.1 (n = 21), 0.9 < SLR < 1.1 (n = 21), SLR < 0.9 (n = 4)]
Abbreviations: P = Paretic, N = Non-Paretic. Subjects walking with SLR > 1.1 increase their speed by primarily increasing their cadence, with little increase in the paretic step length.

70
CHAPTER 4 VARIABILITY IN SPATIOTEMPORAL STEP CHARACTERISTICS AND ITS
RELATIONSHIP TO WALKING PERFORMANCE POST-STROKE
Introduction
Gait variability, defined as fluctuations in gait characteristics from one step to the next, is
reportedly low during walking [108]. However, increased or decreased variability is commonly
reported in populations with gait abnormalities like elderly fallers [103, 104], older frail adults
[105] and persons with neuro-degenerative diseases (e.g, Parkinson’s disease) [106, 107],
suggesting that gait variability strongly associates with gait impairments. Increased gait
variability has been related to risk for falls, implying that excess variability in steps might relate
to balance impairments [101]. Similarly, central nervous system impairments (like cognitive
functioning and motor performance) have been related to increased stance time variability [110],
while decreased step width variability has been related to sensory impairments and balance
deficits during walking [104, 110, 111]. Gait variability is also suggested to predict mobility
disability [110]. Therefore, current evidence suggests that gait variability is related to walking
impairments and can be used as quantifiable biomechanical markers to evaluate impaired
performance.
In persons with post-stroke hemiparesis, neuromuscular and sensorimotor impairments can
influence the generation of a smooth coordinated walking pattern resulting in gait and balance
deficits that impair walking performance. Walking performance post-stroke is commonly
characterized using average gait characteristics [53]. However, measures of gait variability may
provide a sensitive assessment of the motor control system performance reflective of additional
aspects of impaired performance. Nonetheless, gait variability has not been evaluated as
measures of walking performance in the post-stroke hemiparetic population. Specifically, it is
unknown whether variability in paretic steps differs from non-paretic steps, whether the

71
variability in steps might relate to severity of hemiparesis, and how gait variability might be
associated with measures of impaired hemiparetic performance suggesting that a systematic
characterization of gait variability is warranted in this population.
Therefore, the purpose of this study was 1) to evaluate whether gait variability differs in
persons with post-stroke hemiparesis by comparing their variability patterns with a similarly-
aged healthy population and 2) to determine if measures of gait variability may be indicative of
impaired walking performance by investigating the association between gait variability and
clinical assessments that evaluate impaired hemiparetic performance.
Methods
Participants
Ninety-four participants (Age = 61.4 ± 11.4 years, 69 men, 51 left-side hemiparesis,
Walking speed = 0.63 ± 0.32 m/s) with chronic hemiparesis and twenty-two similarly aged
healthy subjects (Age = 66.2 ± 10.0 years, 6 men, Walking speed = 1.29 ± 0.21 m/s) participated
in this study (refer to Table 1 for participants’ demographics). Seventy participants with
hemiparesis and the healthy control subjects were part of an ongoing study at the VA-UF Human
Motor Performance Laboratory, Gainesville, FL. Twenty-four participants with hemiparesis had
participated in a larger gait study at the Palo Alto Medical Center and unreported data from these
participants were retrospectively used for analyses. All participants signed a written informed
consent. University of Florida Institutional Review Board and Stanford Administrative Panel on
Human Subjects in Medical Research approved the protocols.
Participants were at least 6 months post-stroke, had unilateral weakness, could walk 10 m
in 50 seconds or less without assistance from another person and had no severe perceptual,
cognitive or cardiovascular impairments contraindicative to walking. Subjects were excluded if
they had other neurological conditions in addition to stroke, had more than one cerebrovascular

72
accident, or were unable to provide informed consent. Healthy participants (serving as similarly-
aged controls) were excluded if they had orthopedic or neurological disorders that influenced
their walking pattern.
Procedures
All participants walked at their self-selected speeds over an instrumented walkway
(GAITRite) to record spatiotemporal step characteristics. GAITRite is valid and reliable for
measuring spatiotemporal characteristics [179]. All aspects of data collection at the two facilities
were similar. Participants began walking 2m in front of the GAITRite, continued walking 2m
after the mat (overall distance ~ 10m) to get constant speed data, and used their assistive devices
(if any) during walking. All participants completed at least two walking trials (average = 3.4,
range = 2 – 5 trials). Number of trials varied across some participants because a) many
participants with hemiparesis were unable to walk more than 2 trials due to fatigue and low
functional performance, and b) some participants walking fast completed more number of trials
(4 – 5 trials) so that the effective number of steps were increased for comparative analyses.
Hemiparetic performance was evaluated using step length asymmetry index and clinical
assessments. The asymmetry in step lengths during hemiparetic walking was evaluated using an
asymmetry index called the Paretic step ratio (PSR), which is calculated as Paretic step length/
(Paretic + Non-paretic step length) and expressed as a percentage. Asymmetry in the hemiparetic
participants was characterized based on symmetry ranges calculated from the similarly-aged
healthy participants in this study and the asymmetric groups were defined as follows: “Longer”
paretic steps than non-paretic (PSR > 0.525), “Shorter” paretic steps than non-paretic (PSR <
0.475) and “Symmetric” step lengths (0.475 ≤ PSR ≤ 0.525).

73
Clinical assessments in sub-sets of the population were available for analyses. Eighty-one
study participants underwent Lower-extremity Fugl-Meyer (LE-FM) evaluations, which is a
valid [71] and reliable [185] scale to evaluate hemiparetic severity. Only synergy items (22-
point) of LE-FM were utilized to grade hemiparetic severity similar to earlier studies [186].
Severity of hemiparesis was graded as: severe (0 – 14: perform only within-synergy movements),
moderate (15 – 18: perform movements combining synergy) and mild (19 – 22: perform
movements out of synergy). Dynamic gait index (DGI) evaluated dynamic balance in thirty-two
study participants. DGI rates performance of 8 walking-related tasks on an ordinal scale (0-3)
(e.g., the ability to change speed and direction while walking, obstacle negotiation during
walking, etc.). DGI is valid and reliable to evaluate dynamic balance in ambulatory persons with
chronic stroke [187]. Performance on DGI was graded as: DGI score ≤ 19 (poor balance
performance), DGI score > 19 (good balance performance) [188]. Only subsets were available
for LE-FM and DGI assessments since a) only participants in the Gainesville facility underwent
DGI assessments and b) since participants in the Gainesville study were part of a larger gait
study, some participants were unable to complete these clinical assessments due to insufficient
time.
Data Analyses
All collected footfalls from all trials were analyzed. This methodology to evaluate gait
variability in clinically impaired populations is similar to earlier works [104, 110, 189-191].
Average number of footfalls collected and analyzed per subject was 25 steps (range = 12 – 42
steps) for the hemiparetic population and 13 steps (range = 9 - 20 steps) for the control
population collected from all trials. Note that, for the same average number of trials, three
hemiparetic participants took many more steps than other study participants (48, 50 and 65

74
steps). The results did not differ when these participants were removed from the analyses
compared to when they were included in the analyses. Therefore, these participants’ data were
included in the study. The number of steps collected and analyzed in this study is similar to that
reported in earlier works [91, 92, 98, 104, 110, 111, 192] that have assessed step variability and
the relationship of the spatiotemporal variability to falls risk, CNS impairments, gait speed and
mobility disability [98, 104, 110, 193].
Swing time, pre-swing (double-support) time, stride time, step length and stride width were
selected for analyses based on a) literature review that suggests their importance in evaluating
walking impairments post-stroke [70, 194], and b) evidence that the chosen variables have earlier
revealed meaningful conclusions on walking impairments in gait variability studies of clinically
relevant populations [101, 189, 195]. Stance and step time were not calculated since the aim was
also to select mutually independent variables for analyses. Refer to Table 4-1 for definitions of
calculated variables. Both stance and step times include variables that were independently
calculated in the study [i.e., stance time is the two-double support phases plus single stance time
(proportional to the contralateral swing time) and step time is the swing time plus pre-swing
time]. Variability was quantified using the standard deviation in spatiotemporal characteristics
across steps.
Statistical Analyses
Kolomogorov-Smirnov tests revealed departures from normality for spatiotemporal
characteristics in participants with hemiparesis. To allow for the use of parametric statistical
processing, the data were log10 transformed to achieve normality. Dependent t-tests revealed that
there was no difference in variability between right and left legs for healthy participants in step
length (p = .32), swing time (p = .51) and pre-swing time (p = .22) variability. Therefore, a one-
way ANOVA tested differences in step length, swing and pre-swing time variability between
75
paretic, non-paretic and healthy (left) leg. Results did not differ when the right leg of the healthy
participants were used in the analyses. For stride time and stride width, independent t-tests were
conducted to test differences between population groups (hemiparetic and healthy). Note that
since stride time and stride width were calculated using both right and left steps, there was only
one factor (population) and only paretic strides were analyzed to avoid redundant steps in the
analyses.
To test differences in variability across severity and PSR groups a 3 (group) x 2 (leg)
Mixed ANOVA (repeated on leg factor) was conducted for step length, swing time, pre-swing
time variability and a one-way ANOVA for stride time and width variability. To test differences
across DGI groups a 2 (group) x 2 (leg), Mixed ANOVA (repeated on the leg factor) was
performed for step length, swing time, pre-swing time variability and an independent t-test for
stride time and stride width variability. When significant effects were detected, post-hoc pairwise
comparisons were performed using Bonferroni-adjusted t-tests. All statistical analyses were
conducted in SPSS (version 13.0).
Results
Differences in Step Variability between Healthy and Hemiparetic Walking
Variability in step length, swing, pre-swing and stride time was increased in participants
with hemiparesis compared to healthy control subjects, while stride width variability (p = .153)
was not changed in hemiparetic walking (Figures 4-1 and 4-2). However, if only the slower
walkers (speed < 0.4m/s) were compared to controls, then width variability was significantly
reduced (p = .038).
For between-leg comparisons, swing time variability was greater in paretic steps than non-
paretic and there was a trend for paretic pre-swing (PPS) time to show greater variability

76
compared to non-paretic pre-swing (NPS) time (p = .065, Figure 4-1). There was no difference in
the variability between paretic and non-paretic step lengths (Figure 4-2).
Association between Step Variability, Clinical Assessments and Asymmetry Index
Differences in variability across the three groups (determined by the assessments) for each
spatiotemporal characteristic are presented below. Additionally refer to Figure 4-3 and Figure 4-
4 for presentation of differing patterns of spatiotemporal variability within the severity,
asymmetrical and DGI groups and Table 4-2 for the mean variability across-groups.
Swing time variability, Main effects (ME) of Group and Leg were significant across
severity (p<.01), asymmetrical (p<.01) and DGI groups (p≤.02). Paretic steps showed greater
variability than the non-paretic steps across all groups, with greatest between-leg differences in
persons with severe and moderate hemiparesis, those taking Longer paretic steps and showing
poor balance performance (DG1 ≤ 19).
Pre-swing time variability, ME of both Group and Leg were significant across severity
(p<.01) groups, ME of leg (p<.001) was significant across asymmetrical groups and ME of group
was significant across DGI. PPS showed greater variability than NPS in the severe and moderate
groups and across asymmetrical groups. Both PPS and NPS showed greater variability in persons
showing poor balance performance compared to those showing good balance performance.
Stride time variability differed across severity groups (p < .0001). Severe and moderate
groups showed greater stride time variability than the mild group (p < .003), but did not differ
from each other (p > .05, Table 4-2). Stride time variability differed across asymmetrical groups
(p = .023) but post-hoc tests showed that asymmetrical groups showed only a trend (of greater
variability) to differ from the symmetrical group (p ≤ .109). Stride time variability (p = .007) was
greater in persons showing poor balance performance (DGI ≤ 19), (Table 4-2, Figure 4-3).

77
Step length variability showed a trend to differ across severity groups (p = .069) and
asymmetrical groups (p = .094). However, ME of group and leg were significant for step length
variability (group: p = .026, leg: p = .03) across DGI groups (p≤.03), with the non-paretic leg
showing greater variability than the paretic leg.
Stride width variability showed a trend to differ across severity groups (p = .045) but did
not differ across the asymmetrical or DGI groups (p > .95).
Discussion
Differences in Step Variability between Healthy and Hemiparetic Participants
We found that, similar to other populations with gait deficits [111, 190, 196], variability in
all spatiotemporal characteristics (except stride width) increased in persons with post-stroke
hemiparesis compared to healthy controls (Figure 4-1, 4-2). While increased variability has been
related to gait deficits in impaired populations [106, 111, 190, 196], our study is the first to
report between-leg differences in step variability. We found between-leg differences in swing
and pre-swing time variability suggesting a direct association between underlying paretic leg
impairments and step variability. Paretic swing time variability was greater than the non-paretic
leg and this difference in variability between-legs was greatest for persons showing most
impaired performance (severe and moderate hemiparesis, asymmetrical steps and those at risk
for falling as predicted by lower DGI scores) (Figure 4-3, 4-4). Increased step variability
specifically in the paretic leg might relate to the neuromuscular impairments after a hemiparetic
stroke, such as altered neural inputs to the paretic spinal half-centers, altered effects of afferent
feedback to the paretic leg and impaired inter-limb coordination during walking. Furthermore,
PPS variability showed a trend to be greater than NPS. Prolonged time in PPS has been related to
impaired progression during hemiparetic walking [70]. The increased variability in PPS relative
to NPS suggests that the neuromotor deficits in this phase may limit hemiparetic walking

78
performance. Step length variability did not differ between-legs but was greater during
hemiparetic walking compared to healthy. It is likely that spatial variables such as step length
(that determine the base of support during gait) are inherently more tightly coordinated between-
legs than temporal variables such that step-to-step variation in one leg is counter-balanced by
variation in the other leg to maintain steady-state walking. Furthermore, stride time variability
was also increased during hemiparetic walking compared to healthy. Increased stride time
variability is reported to be strongly related to falls risk [101, 103], suggesting that increased
variability post-stroke might relate to poor dynamic balance.
Relationship between Hemiparetic Step Variability and Impaired Performance Post-Stroke
To test the use of gait variability measures as markers of impaired performance, we wanted
to investigate the relationship between step variability and hemiparetic performance. This
relationship also provided insights on potential mechanisms underlying the variability patterns.
For example, the ability to produce independent voluntary movements of the paretic leg is
related to motor recovery of the paretic leg and is graded using the LE – FM (higher score
greater recovery). The inverse relation between hemiparetic severity and step variability suggests
that variability might decrease as motor recovery progresses. Similarly, greater step length
asymmetry (both Longer paretic and Shorter paretic groups) has been related to motor control
impairments [194]. In support of this hypothesis, our results revealed that both asymmetrical
groups presented with greater swing time variability compared to the symmetrical group but did
not differ from each other. Moreover, the association between step variability and hemiparetic
performance is revealed in the relation between DGI scores and variability (Figure 4-3, 4-4).
Since DGI has been used to evaluate dynamic balance [187] (lower score lower balance), the
inverse relation between DGI scores and step variability suggests that persons showing greater
step variability might have poor dynamic balance. Specifically, DGI scores less than equal to 19

79
are reported to identify persons at risk for falling [188] and participants with hemiparesis in our
study with scores less than equal to 19 exhibited greater step variability.
While the overall increased step variability was related to impaired performance (lower LE
– FM score, greater asymmetry and lower DGI score), the pattern across the sub-groups was not
consistent for all spatiotemporal parameters (e.g. between-leg differences in pre-swing time
variability was observed across severity groups but not across DGI groups). Since the stroke
population is immensely heterogeneous, we expected the spatiotemporal step variability patterns
would differ across sub-groups of participants suggesting that specific spatiotemporal measures
are more strongly associated with particular aspects of hemiparetic performance. For instance,
between-leg differences in swing time variability were significant across all sub-groups of
participants (severity, asymmetry and DGI groups) suggesting that between-leg differences in
swing time variability were most strongly related to impaired hemiparetic performance (as
measured by severity, asymmetry and DGI). Stride time variability differed across all sub-
groups. In comparison, for step length variability, there were no differences between-legs when
considering the hemiparetic population as a group. However, in persons at risk for falling, paretic
variability was increased relative to non-paretic; suggesting that step length differences between-
legs might be unmasked in the most impaired persons. Nonetheless, the relatively small sample
size of the DGI subgroups could have potentially influenced these results.
While step variability in different spatiotemporal parameters varied across sub-groups of
participants in combination, variability in the spatiotemporal parameters seemed to robustly
predict impaired hemiparetic performance. For instance, a participant having markedly increased
PPS variability (black-bold arrow in Figure 4-3), increased paretic step length and reduced width
variability (black-bold arrow in Figure 4-4) shows impaired hemiparetic walking performance.

80
The inferences from other measures, however, were inconsistent (poor balance performance
(DGI = 8), moderate hemiparetic severity, symmetric steps). Similarly, another participant had
good balance performance (DGI = 22) but walked asymmetrically with much longer paretic
steps, again indicating the contrasting inferences on performance as predicted by these measures.
This person had markedly increased stride time variability and reduced width variability (red
arrow in Figure 4-4). Overall, these examples exhibit a marked increase of variability in one or
other spatiotemporal characteristic and reduced variability in stride widths, suggesting that
although poor hemiparetic performance was not consistently evident across all clinical
assessments, gait variability robustly identified impaired walking performance.
Unlike other spatiotemporal characteristics, stride width variability was reduced in the
slower walkers when compared to controls. Stride width is calculated in the frontal plane unlike
other spatiotemporal characteristics that are sagittal plane measures, suggesting an inherent
difference in control of this parameter. Furthermore, in population groups susceptible to falls
(such as elderly fallers, persons with Parkinson’s disease and community dwelling elderly),
width variability is reported to be reduced and this reduction in variability is shown to predict
falls [104, 107, 189]. In our study, we also observed that participants showing markedly reduced
width variability walked with wide strides. A wider step provides a wider base of support for
side-to-side motion of the center of mass and might be accompanied by a reduction in variability
of medio-lateral foot placement to ensure that steps are consistently wide. Therefore, it is likely
that observed reduction in width variability is compensatory to maintain stability. Decreased
width variability in comparison to increased variability in other spatiotemporal characteristics
implies that altered variability might be specific to step characteristics and should not be
generalized.

81
Study Limitations
There were some limitations in our study. Data was collected from a limited number of
steps that could have influenced the accuracy of our results [95]. However, a major strength of
our methodology was the ability to measure spatial variables as well. Methodologies that
capture hundreds of steps are based on recording temporal characteristics only [104].
Furthermore, despite the fewer number of steps collected in our study, observed patterns of gait
variability were consistent with those observed in other impaired populations [101, 106, 111].
Further, use of the GAITRite based protocol is clinically relevant and therefore, our study results
have the potential to rapidly translate to the clinical settings. We also evaluated gait variability
using coefficient-of-variation (CV = standard deviation/mean) in step characteristics. Using CV
to evaluate variability may result in questionable conclusions of increased variability,
specifically when the mean value is of low magnitude. It is also likely that the differences in
stride variability could be due to differences in strategies (i.e., length-frequency combinations)
employed to achieve a certain speed [197]. Nonetheless, several studies have shown that stride
variability, could be independent of stride length and frequency [91, 189].
Furthermore, it is likely that the trial-to-trial variability in speed resulted in observed
changes in the variability. However, the speed variability did not differ (p = 0.268) between
hemiparetic and healthy participants, suggesting that the trial-to-trial speed variation did not
contribute to the observed patterns of gait variability. Slower walking speeds post-stroke are
likely to be associated with greater alterations in step variability. Yet, observed patterns of gait
variability cannot be solely attributed to effects of speed because if healthy persons walk at
slower speeds similar to persons with gait deficits, gait variability is likely to remain relatively
low during healthy gait even at the slower speeds [111]. In addition, while persons walking with
assistive devices showed overall greater step variability than those not using assistive devices,

82
the inverse relationship between variability and walking performance was apparent when we
evaluated the data for those using assistive devices separately from others who did not.
Conclusions
In conclusion, results of this study suggest that step variability is altered post-stroke
compared to healthy controls and relates to hemiparetic walking performance. Specifically,
between-leg differences in swing time and pre-swing variability, increased step length and stride
time variability and reduced width variability can be indicative of underlying sensorimotor
impairments post-stroke; suggesting these as quantifiable measures of impaired hemiparetic
performance. Future studies should investigate the underlying causes of altered variability and
the effect of therapeutic interventions on gait variability to further validate its use to assess
hemiparetic performance.
Table 4-1. Definitions of study variables STEP LENGTH (cm): measured along the line of progression, from the heel center of the current footprint to the heel center of the previous footprint on the opposite foot. PRE-SWING TIME (sec): Pre-swing (or double support) time occurs from opposite footfall first contact to support footfall last contact. SWING TIME (sec): time elapsed between the Last Contact of the current footfall to the First Contact of the next footfall of the same foot. STRIDE TIME (sec): time elapsed between the first contacts of two consecutive footfalls of the same foot. STRIDE WIDTH (cm): vertical distance from midline midpoint of one footprint to the line formed by midline midpoints of two footprints of the opposite foot.

83
Table 4-2. Step variability (expressed as standard deviation) within the hemiparetic population sub-divided based on their performance measures

84
Figure 4-1. Differences in temporal variability between healthy (n = 22) and participants with hemiparesis (n = 94) at Self-selected (SS) walking speeds
The box plots indicate the range in the data. The central horizontal line is the median of the sample. The length of the box indicates the inter-quartile range with the upper and lower boundaries of the box indicating the upper and lower quartile, respectively. Circles represent sample values that statistically indicate outlier or extreme values (by SPSS software). In impaired populations, these outlier values are true indicators of behavior and represent those persons showing excessive variability. * indicates statistically significant differences from healthy leg at p < .0001, # indicates statistically significant difference from non-paretic leg at p < .0001. Note that the statistical significance is based on the mean of the log-transformed values of the respective temporal characteristics. Variability in all temporal characteristics was increased during hemiparetic walking. Abbreviations: P – Paretic leg, N – Non-paretic leg, HC – Healthy control leg, H – Hemiparetic walking (value includes steps from both legs).

85
Figure 4-2. Differences in spatial variability between healthy (n = 22) and participants with
hemiparesis (n = 94) at Self-selected (SS) walking speeds
The box plots indicate the range in the data similar to Figure1. * indicates statistically significant differences from healthy leg at p < .0001 and the statistical significance is based on the mean of the log transformed values of the respective temporal characteristics. Variability in step length characteristics was increased during hemiparetic walking and that in stride width showed a trend to decrease during hemiparetic walking. Abbreviations: P – Paretic leg, N – Non-paretic leg, HC – Healthy control leg, H – Hemiparetic walking (value includes steps from both legs).

86
Figure 4-3. Differences in temporal variability in hemiparetic participants based on their performance on clinical assessments
The box plots indicate the range in the data similar to Figures 1. Blue represents paretic leg and Green represents non-paretic leg for swing time and pre-swing time variability. In general, poor performance is indicated by more severe hemiparesis (lower LE-FM scores), asymmetrical gait (longer or shorter paretic steps) and poorer balance performance (lower DGI scores)]. Note the between-leg differences in swing and pre-swing time in persons with moderate and severe hemiparesis, those walking asymmetrically and in persons showing poor balance performance. Note that while stride time variability differences were observed in sub-groups of the hemiparetic population, these have not been represented in the Figure.

87
Figure 4-4. Differences in spatial variability in hemiparetic participants based on their
performance on clinical assessments
The box plots indicate the range in the data similar to Figures 1. Blue represents paretic leg and Green represents non-paretic leg for step length variability. Note that stride width variability does not show a consistent trend to differ across the different sub-groups of the hemiparetic population.

88
CHAPTER 5 FOOT PLACEMENT IN A BODY REFERENCE FRAME DURING WALKING AND ITS
RELATIONSHIP TO HEMIPARETIC WALKING PERFORMANCE
Introduction
Foot placement during walking is commonly quantified using parameters that are
determined relative to the other foot during a step (e.g., step length and step width). Nonetheless,
foot placement closely relates to body movements [117, 118]. For instance, forward body
progression during walking requires controlling the movement of the body’s center-of-mass
relative to where the foot is placed. Similarly, dynamic stability during walking is established by
foot placement in a body reference frame (in relation to body movement). Specifically, by foot
placement in a body reference frame, we imply calculation of where the foot is placed relative to
the body during walking (and not relative to the other foot). For instance, step length in a body
reference frame can be calculated as the anterior distance between the leading foot center-of-
mass and the center-of-mass of the pelvis at heel strike. Patterns of foot placement relative to the
body are rarely investigated during gait. In some earlier studies, foot placement relative to body
was investigated during healthy gait and related to motor control during gait [116-119, 134].
However, foot placement relative to body has not been investigated in neurologically impaired
populations and specifically in an asymmetrical population such as stroke. The observations of
asymmetric foot and trunk kinematics in isolation [198, 199] suggests that foot placement
relative to body likely are asymmetric post-stroke but it is unclear whether persons with specific
motor control deficits would have particular patterns of where they place their foot relative to
body.
Post-stroke, quantifying where the foot is placed relative to body could provide a deeper
understanding of the mechanisms of hemiparetic walking than is possible when foot kinematics
alone are known (as when it is defined relative to other foot). For example, in persons who take

89
asymmetrical step lengths (relatively longer or shorter paretic step lengths), it is unclear whether
their foot placements relative to pelvis (or trunk) would also be asymmetrical. It is possible that,
in those persons who take longer paretic steps than non-paretic, while the paretic step is longer
relative to the other foot; relative to pelvis both feet are placed symmetrically. Furthermore, in
persons taking asymmetrical longer or shorter paretic steps than non-paretic, paretic and non-
paretic stride lengths are likely to be the same. This suggests that investigation of foot placement
relative to pelvis can reveal differential patterns of asymmetrical foot placement anterior or
posterior to the pelvis and help understand the specific motor control in such asymmetrical sub-
groups. Similarly, it is unclear whether there is any asymmetry in lateral foot placements relative
to pelvis and whether it relates to step width post-stroke. Therefore, in this study patterns of foot
placement relative to body were compared to step length asymmetry and step width to
investigate the relation between stepping in a body reference frame to stepping relative to the
other foot.
Furthermore, we expected that investigation of foot placement relative to body will provide
insights into forward progression, weight support and dynamic stability during hemiparetic
walking. Accurate foot placement in relation to the body during walking establishes a stable base
for the body to progress forward [118, 132]; implying that foot placement during walking is
closely related to forward progression. Furthermore, lateral balance of the body depends on the
mediolateral foot placement [134] suggesting that identification of persons with hemiparesis with
specific patterns of mediolateral foot placement can help determine their dynamic stability.
Mediolateral foot placement relative to the body can also influence the weight shifted and
supported on the legs since how far one places their foot relative to the body at ground contact
will influence the extent of body displacement. Therefore, we also investigated the relation

90
between mediolateral foot placement relative to body and weight supported on the leg to identify
persons with disturbances in weight shifting. Therefore, in this study, in addition to quantifying
foot placement relative to body during hemiparetic walking, the relationship between foot
placement relative to body and walking performance was explored. Walking performance was
quantified using step length asymmetry patterns, paretic propulsion, weight support and a
dynamic stability margin.
In summary, the purpose of this study was 1) to evaluate where the foot is placed relative
to the body during walking in a post-stroke population and, 2) to understand how foot placement
in the body reference frame relates to walking performance. Foot placement relative to body was
calculated in the anterior-posterior and medial-lateral directions during hemiparetic walking and
compared to patterns of foot placement in a similarly-aged healthy population (serving as
controls) walking at matched slow speeds. Inclusion of control subjects was deemed necessary to
compare the foot placement patterns in the hemiparetic gait to that of healthy gait. We
hypothesized that the measures of stepping performance (step lengths and step widths), forward
progression, weight support and dynamic stability would relate to the asymmetry in foot
placement relative to body such that investigation of foot placement in a body reference frame
will provide insights into essential requirements of locomotion and help better evaluate
asymmetric gait post-stroke.
Methods
Participants
Data were collected from thirty-nine participants with chronic hemiparesis (Age = 60.21 ±
12.32 years, 20 men, 19 left-side hemiparesis) and twenty age-matched healthy participants (Age
= 66.15 ± 10.03 years, 4 men) at the VA-UF Human motor performance laboratory, VA Medical
center at Gainesville Florida. Inclusion criteria for the participants with hemiparesis were:

91
hemiparesis secondary to a single onset unilateral stroke; ability to ambulate independently with
or without an assistive device over 10 m on a level surface; ability to walk on a regular basis at
least at home; absence of significant lower extremity joint pain and major sensory deficits;
absence of significant lower limb contractures and no significant cardiovascular or respiratory
symptoms contraindicative to walking. Participants from the study were excluded if they had any
orthopedic or neurologic conditions in addition to stroke, had significant musculoskeletal
problems other than stroke that limit hip and knee extension or ankle plantar flexion to neutral,
or were unable to provide informed consent. All participants in the study signed a written
informed consent and Institutional Review Board of University of Florida approved the protocol.
Procedures
Retro-reflective markers were attached to the participant to collect bilateral 3D kinematics
using a 12 camera VICON motion analyses system. Markers were attached to the head, trunk,
upper extremity, lower extremity and the feet. Clusters of reflective markers attached to rigid
bodies were also located on the pelvis, bilateral thighs, shanks and feet (Figure 5-1). A fixed
laboratory coordinate reference frame was created within the VICON system that was placed at
the left corner of the laboratory.
At the beginning of the test session, controls and participants with hemiparesis walked for
2-3 trials across a 12 ft long instrumented mat (GaitRite) at their self-selected walking speeds to
collect over ground spatiotemporal parameters of steps and estimate their overground walking
speeds. Gaitrite is a valid instrument to measure spatiotemporal parameters during walking
[179].
Subsequently, controls and participants with hemiparesis walked on an instrumented split-
belt treadmill (TECMACHINE) for three trials at their self-selected treadmill walking speed. In
case of participants with hemiparesis, the treadmill self-selected speeds were 10 – 30% slower

92
than the over ground self-selected speeds. Participants with hemiparesis completed three 30-
second walking trials without use of an assistive device or ankle-foot orthosis. A safety harness
mounted to the laboratory ceiling was worn across the shoulders and chest to protect the
participants in the event that they loose balance. Note, that no bodyweight was offloaded by the
harness. Additionally, a physical therapist closely guarded the participants as they walked over
the treadmill (although no manual support was provided by the therapist). For healthy
participants, treadmill speeds closely approximated their over ground speeds. Healthy
participants, in addition, walked at fixed slow speeds on the treadmill for a single trial at 0.3 m/s,
0.6 m/s, and 0.9 m/s to provide control data at speeds matched to the slower speeds of the
hemiparetic participants.
To optimize capture of steady state data on the treadmill, each subject walked for 10 s prior
to each of the 30 s of data collection. Three-dimensional GRFs were measured from each half of
the treadmill along with the kinematic data collection during the walking trials.
Data Analyses
Kinematic data: Raw kinematic data was low-pass filtered using a fourth-order zero-lag
Butterworth filter with a 10 Hz cutoff frequency. The joint center and anatomical trajectories was
fitted to an eight-segment musculoskeletal model generated using SIMM (MusculoGraphics,
Inc.) consisting of a trunk (including the mass of the torso, head and arms), pelvis and legs for
each subject (Figure 5-1 presents the SIMM model from an individual participants walking trial).
Each lower extremity consisted of a thigh, shank and foot. The anthropometrics and inertial
properties were based on that of de Leva [200]. Segmental center-of-mass (COM) calculations
were used to calculate the whole body COM. In this study, specifically pelvis COM was used to
reference the body.

93
Kinetic data: Three-dimensional GRFs were sampled at 2000 Hz. Ground reaction force
data was low-pass filtered using a fourth-order zero-lag Butterworth filter with a 20 Hz cutoff
frequency. The SIMM Motion Module (MusculoGraphics, Inc.) was used to perform a standard
inverse dynamics analysis to determine the inter-segmental joint moments. Kinetic data (GRFs
and joint moments) was normalized by subject body weight. Kinetic data was time normalized to
100% of the paretic leg gait cycle (paretic heel strike to paretic heel strike).
Calculation of study variables: All variables were calculated by averaging across all
complete gait cycles of each of the three trials. The number of steps that are used to calculate the
averages varied across subjects since they walked at different speeds.
Foot Placement and foot position variables: Anterior-Posterior (AP) and medial-lateral
(ML) foot placement and position variables relative to pelvis were calculated for individual legs.
The body was referenced at the pelvis COM (Figure 5-2). Calculation of initial foot placement
(calculated at ground contact in the 1st double support phase) and terminal foot position
(calculated as toe-off in the 2nd double support phase) in AP and ML direction is presented in
Table 5-1. The term foot position was used to distinguish these variables from foot placement
variables since the foot position variables describe how the body movement progressed in a
specific positioning of the foot relative to the body. Stepping relative to the other foot: Step
length and step widths were calculated for individual legs at the same instant as the variables
calculated in the body reference frame (Table 5-1). Stepping asymmetry, forward progression,
weight support and Dynamic stability: Step length asymmetry was quantified using a Paretic step
ratio [194], (Table5-1). Asymmetry in the hemiparetic participants was characterized based on
symmetry ranges calculated from similarly-aged healthy participants walking on the treadmill, as
follows: ‘Longer paretic’ steps than non-paretic (PSR > 55), ‘Shorter paretic’ steps than non-
94
paretic (PSR < 45) and ‘Symmetric’ step lengths (45 ≤ PSR ≤ 55). Forward progression was
quantified using paretic propulsion [76], (Table 5-1). Weight support was quantified by the
average vertical force supported on individual legs during the stance phases (Table 5-1).
Dynamic stability was evaluated by a Dynamic Stability Margin (DSM) similar to earlier studies
[201, 202], (Table 5-1). Specifically, we used the DSM that we calculated at the instance at
which the xCOM reached its maximum value in 1st double-support (DSMmax).
Statistical Analyses
For control subjects, right-left foot placements and positions were similar at all speeds (i.e.,
no between-leg asymmetry), in both AP and ML direction relative to pelvis (p < .001).
Therefore, only control (left) leg was used in the comparisons with participants post-stroke. To
compare foot placement and position relative to the body between controls and participants with
hemiparesis, a 3 (leg: paretic, non-paretic, control) x 2 (phase: foot-strike, foot-off) Mixed
ANOVA was conducted. Median foot placements of control participants at varying speeds were
compared to participants with hemiparesis walking at similar range of speeds in the statistical
analyses. Controls participants walked at 3 varying slow speeds: 0.3 m/s, 0.6 m/s and 0.9 m/s.
Therefore, the comparisons of hemiparetic participants were made for those persons walking less
than equal to these speed ranges. Note that each speed group consisted of different hemiparetic
participants walking at their self-selected speeds. Since median foot placements were used in the
analyses, number of controls was matched to that of the hemiparetic in each speed group.
Pearson correlations were conducted to evaluate the relationships between foot placements,
positions and walking performance measures. Quadratic relations were additionally explored for
each of the relationships but it did not improve the explanatory power significantly in any
relationship, therefore linear relationships have been presented.

95
Results
Quantifying Foot Placement Relative to the Pelvis
For control subjects, right-left foot placements and positions were similar at all speeds (i.e.,
no between-leg asymmetry), in both AP and ML direction relative to pelvis (p < .001).
Therefore, the left leg was used as the control leg in the comparisons with participants post-
stroke.
AP direction: In control participants, foot placement was anterior at ground contact (GC)
and foot position posterior at toe-off (TO) relative to pelvis, with the anterior placement showing
greater excursion than posterior at all the varying speeds (40 – 80 mm, p < .001), (Figure 5-3a).
The greater anterior excursion of the foot at GC than posterior at TO relative to pelvis is
operationally termed as between-phase asymmetry in this study to differentiate from between-leg
asymmetry. In participants with hemiparesis, the pattern of paretic and non-paretic foot
placement varied with their walking speeds.
Foot placement in slow walkers (≤ 0.3 m/s, n = 22) and controls walking at matched-
speeds: Both between-leg and between-phase asymmetry was observed in those hemiparetic
participants walking slowly. Median foot placements were anterior at GC and posterior at TO,
with the paretic foot being more anterior and less posterior than non-paretic (p=.003). There was
increased inter-subject variability in posterior paretic foot position at TO such that at least half
the participants in this group never positioned their foot posterior to the pelvis (Figure 5-3a). The
control foot showed greater excursion than both the paretic and non-paretic feet even at matched
slow speed (p<.001). However, the difference in anterior foot placement between control and
paretic feet was small (~30 mm).
Foot placement in Moderate (> 0.3m/s – 0.6 m/s, n = 12) and Fast walkers (> 0.6 m/s –
0.9m/s, n = 5) and controls walking at matched-speeds: For participants walking at moderate

96
(0.3 – 0.6 m/s) and fast (0.6 – 0.9 m/s) speeds there was no between-leg asymmetry but between-
phase asymmetry was apparent (GC – TO relative to pelvis = 6 – 10 cm), (p<.01), Figure 5-3a.
Further, for the fast walkers foot placement excursions were similar to that of Controls (p<.001),
excepting paretic anterior foot placement that was reduced.
ML direction: There was no between-phase asymmetry in foot placements in controls and
participants with hemiparesis (i.e., same ML distance at GC and TO). Therefore, lateral foot
placement at GC is presented. In participants with hemiparesis walking slow and at moderate
speeds, the paretic foot was placed lateral to pelvis compared to both non-paretic (difference
range = 30 – 70 mm) and speed-matched control (difference range = 49 - 74 mm) foot placement
(p < .001), (Figure 5-3b). Additionally, Paretic foot was lateral most compared to non-paretic in
the slow walkers. In the fast walkers (speed 0.6 – 0.9 m/s), paretic foot was significantly lateral
to the body only relative to speed-matched control foot placement and not non-paretic foot
placement (p< .01), (Figure 5-3b).
Relationship between Anterior-Posterior Foot Placements Relative to Pelvis, Step Length Asymmetry and Paretic Propulsion
Between-leg asymmetry (anterior foot placement relative to pelvis) and step length
asymmetry: Anterior foot placement asymmetry was associated with step length asymmetry (r =
.756, p< .001), suggesting that persons taking asymmetrical step lengths also place their feet
asymmetrically relative to pelvis (Figure 5-4). Nonetheless, asymmetry ranges in the two
reference frames differed. Note that persons severely asymmetric in the global reference frame
(PSR > 90%) showed similar patterns in both the reference frames, however persons showing
mild to moderate step length asymmetry (PSR = 60 – 80%) placed their paretic and non-paretic
feet more symmetrically with respect to the pelvis (asymmetry range in body reference frame =
55 – 60%), (Figure 5-4).

97
Anterior-posterior foot placement relative to pelvis and step length asymmetry:
Paretic foot placement at TO and non-paretic foot placement at GC strongly correlated with step
length asymmetry (PSR) even after controlling for walking speed (Figure 5-5). Note in Figure 5-
5, participants taking relatively long paretic steps (PSR > 70%) positioned their paretic foot
anterior (opposite to the expected pattern) at TO. Similarly, participants’ taking relatively shorter
paretic steps (PSR ≤ 40%) positioned their paretic foot much less posteriorly at TO relative to the
symmetric group.
Between-leg asymmetry and paretic propulsion: Asymmetrical anterior foot
placements relative to pelvis and step length asymmetry were each negatively associated to
paretic propulsion (r = -.584 and r = -.520, respectively), suggesting that both between-leg
anterior foot placement asymmetry in body reference frame and step length asymmetry related to
percent propulsion generated by the paretic leg.
Relationship between Medial-Lateral Foot Placements Relative to Pelvis, Step Widths, Paretic Weight Support and Dynamic Stability Margin
Lateral foot placement asymmetry relative to pelvis, step widths and percent weight
supported on the paretic leg: There was no difference in paretic and non-paretic step widths
during hemiparetic walking (p = .732) and no relation between step width and either percent
weight borne on the paretic leg (r = .244, p = .135) or lateral foot placements (r = .235, p = .150).
However, lateral foot placement was asymmetric and was negatively associated to the percent
weight supported on the paretic leg (Figure 5-6).
Lateral foot placement asymmetry relative to pelvis, step widths and dynamic
stability margins: Pearson correlations controlling for walking speed revealed that Lateral foot
placement asymmetry was positively associated to paretic DSMmax (r = .548, p < .001);
suggesting that the wider paretic foot placement relative to pelvis than non-paretic foot
98
placement is related to the wider paretic stability margin. Step width was positively associated
with both paretic and non-paretic DSMmax (r = .520, p=.001 and r=.360, p= .024; respectively)
suggesting that overall a wider step was related to greater stability margin on both paretic and
non-paretic legs.
Discussion
The results of this study show that foot placement in a body reference frame is asymmetric
in AP and ML directions during hemiparetic walking and this asymmetry related to hemiparetic
walking performance.
Anterior-Posterior Foot Placement Relative to Pelvis and its Relationship to Step Length Asymmetry and Forward Progression
Between-phase asymmetry: Overall, relative to pelvis the foot was placed more anterior
at GC and less posterior at TO in both controls and participants with hemiparesis at all speeds.
Further, participants post-stroke showed greater between-phase asymmetry in the paretic leg than
non-paretic legs and also greater asymmetry than controls walking at matched slow speeds. The
excursions of the foot were also greater in AP direction for controls even at the matched slow
speeds indicating that slower walking speeds alone cannot explain the AP asymmetry in the
hemipaertic participants. Further, note that paretic posterior foot position at TO specifically
showed increased inter-subject variability (See Figure 5-3a, speeds ≤ 0.3 m/s) suggests that there
were persons who never positioned their paretic foot posterior to the pelvis and others who
positioned it posterior and yet these two groups were walking at similarly slow walking speeds.
Further, we correlated the posterior foot position at TO to step length asymmetry because
we hypothesized that the inter-subject variability in posterior foot position would be well
explained by relating the AP foot placements to step length asymmetry and could further help
explain the motor control impairments in the asymmetrical groups. Reduced posterior paretic

99
foot position at TO and anterior non-paretic foot placement at GC relative to pelvis strongly
correlated with step length asymmetry. Specifically, in persons taking ‘Longer paretic’ steps than
non-paretic (PSR > 55%), the paretic posterior foot position was either reduced or anterior
relative to the pelvis suggesting that paretic leg orientation at pre-swing phase was opposite than
that expected (posterior positioning) in this phase. Therefore, while these persons with ‘Longer
paretic’ steps had good stepping ability evidenced by the greater paretic anterior foot placement
relative to pelvis than non-paretic (see Figure 5-4), an inability to achieve a more posterior
paretic foot position at TO suggests impaired paretic leg extension in the ‘Longer paretic’ group.
A flexed leg orientation at TO versus extended in the paretic pre-swing phase can reduce the
mechanical advantage of an extended extremity to propel the trunk forward. This observation is
supported by the evidence that the ‘Longer paretic’ group shows reduced paretic propulsion
[194].
In support of our explanation, we would expect that in the ‘Shorter paretic’ group the
posterior paretic foot position would be relatively greater compared to the ‘Longer paretic’ group
since these persons show good paretic propulsion. While all participants in the Shorter paretic
group positioned their paretic foot posterior relative to pelvis (Figure 5-5), in the severely
asymmetric (PSR < 40%), the posterior foot position relative to pelvis was much reduced similar
to some persons in the ‘Longer paretic’ group. Therefore, we additionally investigated their foot
position relative to the trunk COM to evaluate if compensatory trunk lean might be the
mechanism utilized to propel the body forward. Relative to the trunk, paretic foot position was
much posterior at TO (showing similar excursion as anterior non-paretic foot placement at GC).
Since the foot placement relative to trunk depends not only on where the foot is placed but where
the trunk is positioned, it is possible that at least some of these persons in the ‘Shorter paretic’

100
group generate good body forward progression during the paretic pre-swing phase by flexing the
trunk forward and thereby creating a mechanically advantageous position for the propulsive
ground reaction forces generated from the paretic leg to propel the body forward. Therefore, by
investigating the foot placement relative to the trunk (in addition to pelvis), compensatory
strategies could be diagnosed.
Between-leg asymmetry in anterior foot placements: We also correlated anterior foot
placement asymmetry to step length asymmetry (Figure 5-4) to understand the relation between
foot placement in a body reference frame to stepping relative to the other foot. Overall, stepping
asymmetry in the two reference frames were correlated (for example, persons taking Longer
paretic steps relative to non-paretic were also placing their paretic foot more anterior relative to
pelvis). However, the symmetry range in the body reference frame was narrower than step length
symmetry range and some persons who were asymmetric taking Longer paretic step lengths than
non-paretic (PSR = 55 -65%) were symmetric in the body reference frame. Interestingly, others
who were taking symmetrical step lengths were actually asymmetric relative to pelvis taking
shorter paretic steps than non-paretic. The ability to place the foot further anterior to the pelvis
suggests good stepping ability and the observation that the borderline symmetric persons actually
took shorter paretic steps relative to pelvis suggests their impaired paretic stepping ability.
Therefore, we suggest that since some persons [mildly asymmetric (longer paretic) and
symmetric] step lengths changed their asymmetry in a translating body reference frame,
additional investigation of foot placement pattern relative to pelvis might be necessary to classify
them as symmetric or asymmetric.
In summary, by relating the foot placement and position relative to the pelvis to step length
asymmetry we are able to propose some underlying motor control mechanisms in the

101
asymmetrical groups. ‘Longer paretic’ group showed poor forward body progression likely due
to altered initial conditions of the leg in their pre-swing phase, whereas the ‘Shorter paretic’
group showed poor stepping ability due to the inability to place the paretic foot further anterior to
the pelvis. Further, the good forward progression at least in some participants in the ‘Shorter
paretic’ group might be compensatory from leaning the trunk forward in the pre-swing phase of
their paretic gait cycle.
Medial-Lateral Foot Placement Relative to Pelvis and its Relationship to Weight Supported on Paretic Leg and Dynamic Stability Margin
There was no difference in ML foot placement at GC and TO (i.e. no between-phase
asymmetry). However, between-legs, the paretic foot was placed wider relative to pelvis
compared to non-paretic and speed-matched control in participants with hemiparesis walking at
slow and moderate speeds. Further, this lateral foot placement asymmetry between-leg decreased
with increasing walking speed during hemiparetic walking (Figure 5-3b). Furthermore, we found
that the lateral foot placement asymmetry was strongly correlated with both weight support and
paretic dynamic stability margin. We quantified the percent weight supported on paretic leg as
the percentage of Vertical Ground reaction force on the paretic leg during stance compared to the
both legs. Overall paretic leg supported lesser weight compared to non-paretic evidenced by the
lower percentages than 50 (Figure 5-6). This weight-bearing asymmetry is consistently reported
in the post-stroke population [19, 154]. However, the relationship between lateral foot placement
and weight supported on the legs has not yet been reported in this population.
While we expected that weight supported on the leg would be related to lateral foot
placement, our results specifically show that the asymmetry in lateral foot placement relative to
pelvis (i.e., wider paretic steps relative to pelvis than non-paretic) related to the weight supported
on the paretic leg during stance. On the other hand, step widths were unrelated to the paretic

102
weight support suggesting that investigation of lateral foot placement asymmetry relative to
pelvis specifically revealed the impaired paretic leg weight support in persons taking wider
paretic steps relative to body. Therefore, we suggest that close observation of the lateral paretic
foot placement relative to the body in comparison to lateral non-paretic foot placement can
provide useful insights to the clinicians regarding the amount of weight supported on the paretic
leg.
Moreover, we found that the lateral foot placement asymmetry specifically related to the
dynamic stability margin on the paretic side. We calculated the dynamic stability margin
specifically for each foot (at initial contact) as the ML distance between xCOM and foot COM at
the instance when xCOM reached its maximum value in 1st double-support (Table 5-1). Foot
placements at heel-strike have earlier shown to be a linear function of COM displacement and
velocity and shown to be the most important factor defining stable gaits [116, 117, 134]
suggesting the importance of foot placement to dynamic stability. Specifically, in this study we
chose to use DSMmax since it physiologically relates to the point of maximum instability. We
also calculated DSM at other instances: first instance of ground-contact (DSM-GC) and at every
20% of 1st double-support. Evaluation of DSM at every 20% of the gait cycle revealed that there
was no significant difference between DSM values as the 1st double-support phase progressed
suggesting that the DSM doesn’t change substantially across the double-support phase. Further,
DSM-GC and DSMmax revealed the same pattern relative to foot placement, although
correlations were stronger for DSMmax and foot placement. Note that, we did not use the entire
area enclosed between foot placements (i.e., base of support) to define the DSM since we wanted
to investigate how foot placement on individual legs affected the margin established at each foot
placement. We found that wider paretic foot placement relative to pelvis than non-paretic

103
specifically related to wider stability margin established on the paretic side. However, there was
no relation between the lateral foot placement asymmetry and the non-paretic stability margin
suggesting that the wider paretic foot placement relative to non-paretic may specifically establish
a wider stability margin at paretic foot placement. As expected, step width related to both paretic
and non-paretic stability margins indicating that a wider step in general related to a wider
stability margin. A wider margin specifically on one side can predispose lateral instability since
the COM was closer to the margin of the base of support on one side than other. Since there was
no relation between step width and lateral foot placement asymmetry, persons taking wider steps
may have a wider or narrower margin on the paretic side relative to non-paretic and it may be
difficult to identify those persons with lateral instability. Further, while the wider step on the
paretic side related to decrease weight support it increased the stability margin on the paretic side
indicating that ML asymmetry might be compensatory to increase the dynamic stability.
Therefore, we suggest that lateral foot placement relative to pelvis is a useful outcome measure
to quantify both paretic leg weight support and dynamic stability.
Limitations
There are some limitations in this study. The current study was conducted over the
treadmill and foot placement relative to body might differ overground. Nonetheless, it is
expected that while absolute foot placement (in isolation) might be altered (i.e., longer versus
shorter step lengths) while walking overground, its relation to the body movements remain
consistent suggesting the functional relevance of foot placement relative to body. This
hypothesis could be tested in future studies by exploring the step-by-step variability in foot
placement relative to body and whether this changes from treadmill to overground walking. Hip
and knee kinematics were not explored in the current study. Since the foot is under multi-
segmental and end-point control, it is expected that the foot kinematics relative to body will be

104
the end result of different combinations of hip and knee kinematics such that investigation of
foot kinematics relative to body might be a relatively easy method to understand post-stroke
walking from a control model viewpoint.
Conclusions
Post-stroke gait is asymmetric when quantifying foot placement relative to pelvis in both
AP and ML directions. We suggest that for the AP direction, characterizing stepping relative to
the other foot (i.e., step length) was appropriate as outcomes to quantify asymmetrical
performance and forward progression because stepping relative to the other foot and stepping in
a body reference frame were associated. Nonetheless, since some borderline asymmetrical (PSR
= 55 – 65%) and other symmetrical persons show differing performance in the translating
reference frame, it may be additionally useful to investigate foot placement relative to pelvis in
these persons. Further, we could understand motor control mechanisms in the asymmetrical sub-
groups (impaired initial conditions in the ‘Longer paretic’ group versus impaired stepping ability
in the ‘Shorter paretic’ group) by investigating the foot position patterns relative to pelvis. For
the ML direction, we suggest using foot placement relative to pelvis as an outcome to
characterize hemiparetic performance. A wider foot placement of the paretic foot relative to
pelvis than non-paretic can quantify the reduced weight supported on the paretic leg and lateral
instability. Overall, we were able to better evaluate asymmetrical performance during
hemiparetic walking by investigating foot placement and position in a body reference frame that
was not revealed when investigating stepping relative to other foot. Therefore, we suggest that
biomechanical analyses quantifying stepping performance in impaired populations should
investigate foot placement in a body reference frame (especially in the ML direction) to
understand motor control during gait.

105
Table 5-1. Definition of study variables Foot placement and position relative to body Anterior-Posterior AP Foot placement relative to pelvis: Distance in AP direction from foot COM to pelvis COM at the initial foot placement (ground-contact in the 1st double-support). AP Foot position relative to pelvis: Distance in AP direction from foot COM to pelvis COM at the terminal foot position (toe-off in the 2nd double-support phase). Medial-Lateral ML Foot placement relative to pelvis: Distance in ML direction from foot COM to pelvis COM at the initial foot placement (ground-contact in the 1st double-support). ML Foot position relative to pelvis: Distance in AP direction from foot COM to pelvis COM at the terminal foot position (toe-off in the 2nd double-support phase). Stepping relative to the other foot Step length: Distance in AP direction from leading mid-foot to trailing mid-foot at the the initial foot placement (ground-contact in the 1st double-support). Step width: Distance in ML direction from leading mid-foot to trailing mid-foot at the the initial foot placement (ground-contact in the 1st double-support). Walking performance measures Step length asymmetry: calculated as a Paretic step ratio (PSR = Paretic step length / (Paretic + Non-paretic step length) and expressed as a percentage. Paretic propulsion: Paretic propulsive impulse / (Paretic + Non-paretic propulsive impulse). Percent weight supported on the paretic leg: Paretic average vertical force / (Paretic + Non-paretic average vertical force) expressed as a percentage. Dynamic stability margin: ML Distance between the extrapolated COM (xCOM = COM displacement + COM velocity) and foot COM.

106
Figure 5-1. Illustration of marker positions for kinematic data collection and the SIMM model generated

107
Figure 5-2. Calculation of anterior-posterior and medial-lateral foot placements relative to pelvis
This figure presents the foot placement and position variables calculated relative to pelvis. These variables were calculated as the AP and ML distance between foot COM and pelvis COM. Note, the yellow arrows present the step length and step width calculated relative to other foot.
Anterior foot placement relative to pelvis
Posterior foot position relative to pelvis
Lateral foot placement relative to pelvis
Anterior-Posterior Medial-Lateral

108
a. Anterior-Posterior foot placement relative to pelvis
b. Medial-Lateral foot placement relative to pelvis
Figure 5-3. Foot placement relative to pelvis during hemiparetic and healthy gait
Abbreviations: GC – Ground contact at 1st double-support (initial foot placement), TO – Toe-off at 2nd double-support (terminal foot position), P- Paretic foot, N-Non-paretic foot, C-Control foot. The box plots indicate the range in the data. The central horizontal line is the median of the sample. The length of the box indicates the inter-quartile range with the upper and lower boundaries of the box indicating the upper and lower quartile, respectively. Circles represent sample values that statistically indicate outlier or extreme values (by SPSS software).

109
Figure 5-4. Relationship between anterior foot placement asymmetry relative to pelvis and step
length asymmetry in participants with hemiparesis
This figure shows the relationship between asymmetry in foot placements relative to pelvis (body reference frame) and step length asymmetry (relative to the other foot). The vertical dashed lines indicate the step length symmetry ranges (45 ≤ PSR ≤ 55) and the horizontal dashed lines indicate symmetry ranges in the body reference frame (46 ≤ PSR ≤ 54) calculated similarly from healthy controls. Persons above the range take “Longer paretic” steps than non-paretic and those below the range take “Shorter paretic” steps than non-paretic. Note that, four persons (black arrow) taking longer paretic than non-paretic step lengths placed their paretic and non-paretic feet symmetric with respect to the pelvis. On the other hand, three persons (red arrow) who were taking symmetric step lengths place their paretic foot closer to pelvis than non-paretic (i.e. shorter paretic steps in the body reference frame).
Step length asymmetry % (PSR)
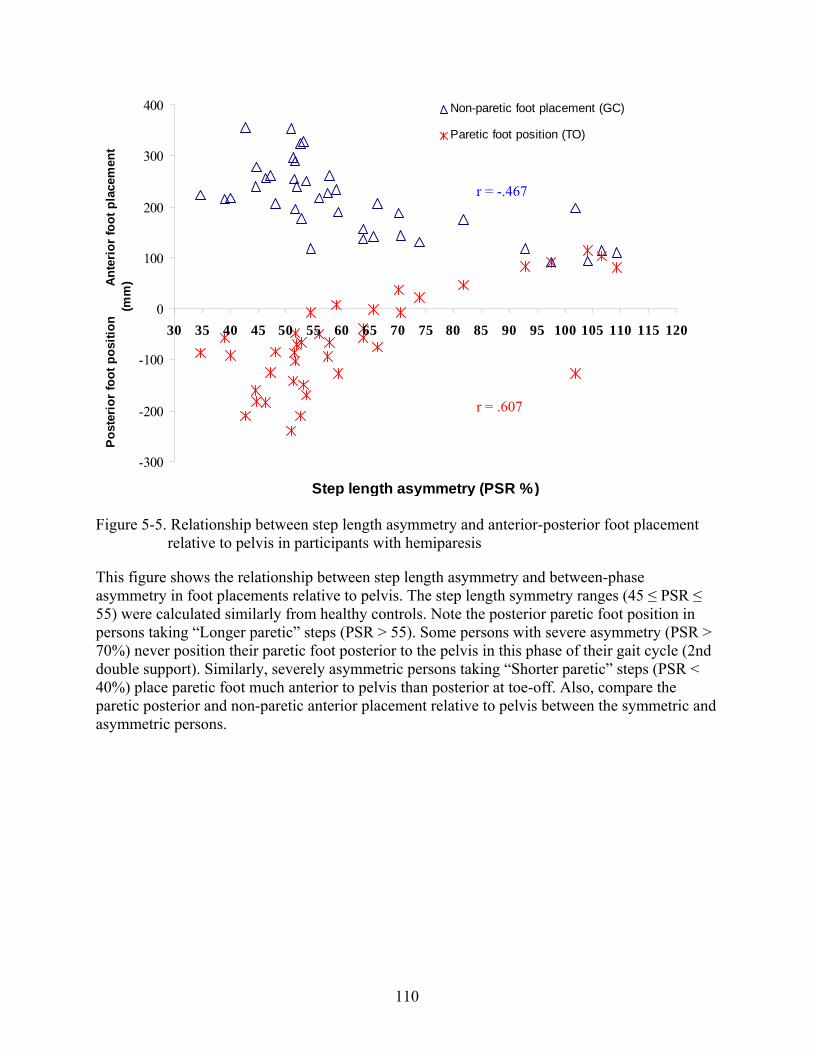
110
-300
-200
-100
0
100
200
300
400
30 35 40 45 50 55 60 65 70 75 80 85 90 95 100 105 110 115 120
Step length asymmetry (PSR %)
Pos
terio
r fo
ot p
ositi
on
A
nter
ior
foot
pla
cem
ent
(mm
)Non-paretic foot placement (GC)
Paretic foot position (TO)
Figure 5-5. Relationship between step length asymmetry and anterior-posterior foot placement
relative to pelvis in participants with hemiparesis
This figure shows the relationship between step length asymmetry and between-phase asymmetry in foot placements relative to pelvis. The step length symmetry ranges (45 ≤ PSR ≤ 55) were calculated similarly from healthy controls. Note the posterior paretic foot position in persons taking “Longer paretic” steps (PSR > 55). Some persons with severe asymmetry (PSR > 70%) never position their paretic foot posterior to the pelvis in this phase of their gait cycle (2nd double support). Similarly, severely asymmetric persons taking “Shorter paretic” steps (PSR < 40%) place paretic foot much anterior to pelvis than posterior at toe-off. Also, compare the paretic posterior and non-paretic anterior placement relative to pelvis between the symmetric and asymmetric persons.
r = .607
r = -.467

111
0.43
0.44
0.45
0.46
0.47
0.48
0.49
0.5
0.51
0.52
0.53
0.4 0.45 0.5 0.55 0.6 0.65 0.7 0.75
Lateral foot placement asymmetry
Ave
rage
wei
ght s
uppo
rted
on p
aret
ic le
g
Figure 5-6. Relationship between paretic and non-paretic lateral foot placement asymmetry
relative to pelvis and percent weight supported on the paretic leg
Note that greater lateral foot placement asymmetry (i.e., paretic foot placed wider relative to pelvis than non-paretic foot placement relative to pelvis) lesser the weight supported on the paretic leg during the stance phase.
r = -0.560**

112
CHAPTER 6 EVALUATION OF STEP LENGTH GENERATION DURING POST-STROKE
HEMIPARETIC WALKING USING A NOVEL METHODOLOGY OF STEP-BY-STEP VARIABILITY IN GAIT DATA
Introduction
While hemiparetic walking is asymmetric, the underlying mechanisms responsible for step
length generation during walking are not clearly understood in this population. Step lengths are
reported to be shorter, asymmetric and variable from step to step during hemiparetic walking
compared to healthy walking [5, 18, 69, 198]. Shorter step lengths are commonly associated to
the slower walking speeds post-stroke [53]. Nonetheless, it is likely that underlying sensorimotor
and muscular impairments post-stroke directly influence the attained step lengths beyond
changes due to the slower walking speeds. In particular, step lengths are also asymmetric during
hemiparetic walking with the direction of asymmetry being inconsistent. Reports suggest that
there are a greater number of persons taking longer paretic steps than non-paretic and few take
relatively shorter paretic steps than non-paretic [69, 194]. A sub-category of persons also walk
with relatively symmetric steps [194]. The inter-subject variability in step length asymmetry
suggests that the underlying neuromotor mechanisms controlling paretic step lengths could vary
within these sub-groups of the hemiparetic population. Furthermore, there is considerable
variability in step lengths on a step-by-step basis within individual stroke participants, with
greater step-to-step variability reported in the more severe participants (unpublished data). This
suggests that evaluation of the neuromotor mechanisms controlling step length generation needs
to account for the subject-specific step-by-step variability in step length generation. Therefore, in
this study, mechanisms of step length generation during hemiparetic walking were evaluated
using a novel methodology that incorporates this within-subjects step-by-step variability in step
lengths.

113
Several potential contributing factors are likely to affect attained step lengths. Current
evidence indicates that step length generation can be influenced primarily by the: 1) initial
conditions at the initiation of swing phase of the ipsilateral leg, 2) biomechanics of the early
(primarily accelerating) and late swing phase (primarily decelerating) of the ipsilateral leg, and
3) contralateral stance leg ground reaction forces during its early and late single-support phase
(usually braking and propulsive, respectively, in healthy subjects), occurring simultaneously with
the ipsilateral swing phase.
Initial conditions of the leg (e.g. kinematics, kinetics and muscle activity in the pre-swing
phase) are suggested to define the resulting swing leg trajectory [173]. For instance, dynamic
simulations of swing phase in healthy gait performed in the absence of muscle joint torques
approximated normal knee kinematics by selecting the initial angular velocities and positions
alone [164, 203], implying that the initial angular velocity is an important determinant of
kinematics during swing. Initial conditions prior to swing also provide the energy to the
swinging leg [204, 205]. Therefore, the strong influence of initial conditions on the ipsilateral
swing phase of the gait cycle, can indirectly affect where the leg is placed at the end of the swing
phase. Nonetheless, while the initial conditions of the leg prior to swing phase should be partially
predictive of swing phase characteristics, swing phase muscle activity is likely to either augment
the leg flexion during swing (presumably by leg flexors) or decelerate the leg to terminate the
swing (e.g., hamstrings muscle activity). Therefore, events occurring specifically during swing
phase of the gait cycle can independently control the eventual step length. In support, Varraine et
al. (2003) showed that when healthy participants were asked to voluntarily modulate their step
lengths, they lengthened the time the leg was held in the swing phase [182]. Consequently, they
proposed that controlling the swinging leg trajectory by altering the swing phase parameters

114
enabled the healthy participants to step longer. Therefore, while initial conditions prior to swing
phase can indirectly control step lengths (by its influence on the swing phase), events during the
swing phase present potentially direct mechanisms that can control step lengths. Lastly,
contralateral stance leg ground reaction forces occurring at the same instance as ipsilateral swing
phase can influence step length generation. Recent work showed a strong negative relationship
between propulsive force asymmetry and step length asymmetry that highlights the causal
relationships between ground reaction forces and step lengths [194]. In particular, the finding
that persons who take longer paretic steps than non-paretic generate lesser paretic leg propulsion;
suggests that the greater compensatory non-paretic leg propulsion might be causing the trunk to
progress further forward as the paretic leg is stepping, thereby resulting in the relatively longer
paretic steps. Overall, current literature suggests several potential indirect and direct mechanisms
related to the initial conditions of the leg, swing phase and contralateral stance phase that might
influence step length generation.
In this study, we selected kinematic and kinetic measures that independently describe each
of these phases of the hemiparetic gait cycle. Leg orientation at toe-off, pelvis velocity at toe-off
and ankle joint center velocity at toe-off determined the initial state of the leg and body before
the leg begins to swing. Hip Impulse in early and late swing and corresponding contralateral
Anterior-posterior (AP) ground reaction force (GRF) impulses were chosen to represent the
events in the ipsilateral swing phase and corresponding contralateral stance phase, respectively.
We hypothesized that the kinematic and kinetic measures that describe each of these phases of
the hemiparetic gait cycle would relate to step lengths and explain step length variability within-
subjects. In particular, we hypothesized that contralateral AP GRF impulses would be a strong
predictor of step length variability in majority of persons. Whereas, hip impulse in ipsilateral

115
swing will be a strong predictor of step length variability in persons taking longer paretic steps
than non-paretic. Regression models were built for individual subjects using gait data from each
step because we wanted to evaluate the kinematic and kinetic parameters that best predicted the
step length variability within-subjects. In summary, the purpose of this study was to
comprehensively evaluate the underlying mechanisms of step length generation during
hemiparetic gait by determining the predictors that explain the step length (step-by-step)
variability within-subjects.
Methods
Participants
Participants were a convenience sample of thirty-eight persons with chronic hemiparesis
(Average Age = 60.21 ± 12.32 years, 20 men, 19 left-side hemiparesis) and twenty similarly-
aged healthy participants (Age = 66.15 ± 10.03 years, 4 men) evaluated at the VA-UF Human
motor performance laboratory, VA Medical center at Gainesville Florida. Table 6-1 presents the
individual subject characteristics for the hemiparetic participants. Healthy subjects’ data were
used to calculate the step length symmetry ranges for the hemiparetic participants. Inclusion
criteria for the participants were: hemiparesis secondary to a single onset unilateral stroke; ability
to ambulate independently with or without an assistive device over 10 m on a level surface;
ability to walk on a regular basis at least at home; absence of significant lower extremity joint
pain and major sensory deficits; absence of significant lower limb contractures and no significant
cardiovascular or respiratory symptoms contraindicative to walking. Participants from the study
were excluded if they had any orthopedic or neurologic conditions in addition to stroke, had
significant musculoskeletal problems other than stroke that limit hip and knee extension or ankle
plantar flexion to neutral, or were unable to provide informed consent. All participants in the

116
study signed a written informed consent and Institutional Review Board of University of Florida
approved the protocol.
Procedures
Retro-reflective markers were attached to the participant to collect bilateral 3D kinematics
using a 12 camera VICON motion analyses system. Markers were attached to the head (top, left,
right, front and back), trunk (C7, T10, clavicle, sternum and right scapula), upper extremity
(bilateral shoulders, elbows and wrists), lower extremity (bilateral knees and ankles) and the feet
(tip of the toes, left and right side of forefoot, midpoint of forefoot and calcaneus). Clusters of
reflective markers attached to rigid bodies were also located on the pelvis, bilateral thighs,
shanks and feet. A fixed laboratory coordinate reference frame was created within the VICON
system that was placed at the left corner of the laboratory.
At the beginning of the test session, controls and participants with hemiparesis walked for
2-3 trials across a 12 ft long instrumented mat (GaitRite) at their self-selected walking speeds to
collect over ground spatiotemporal parameters of steps and estimate their overground walking
speeds.
Subsequently, participants with hemiparesis walked on an instrumented split-belt treadmill
(TECMACHINE) for three trials at their self-selected treadmill walking speed. The treadmill
self-selected speeds were 10 – 30% slower than that over ground for participants with
hemiparesis. All participants completed three 30-second walking trials without use of an
assistive device or ankle-foot orthosis. A safety harness mounted to the laboratory ceiling was
worn across the shoulders and chest to protect the participants in the event that they loose
balance. Note, that no bodyweight was offloaded by the harness. Additionally, a physical
therapist closely guarded the participants as they walked over the treadmill (although no manual
support was provided by the therapist). To optimize capture of steady state data on the treadmill,

117
each subject walked for 10 s prior to each of the 30 s of data collection. Three-dimensional
Ground Reaction Forces (GRFs) were measured from each half of the treadmill along with
kinematic data that were collected during the walking trials. Refer to Figure 6-1 showing a
participant walking on the treadmill as kinematic and kinetic data were collected.
Data Analyses
Kinematic data: Raw kinematic data was low-pass filtered using a fourth-order zero-lag
Butterworth filter with a 10 Hz cutoff frequency. The joint center and anatomical trajectories was
fitted to an eight-segment musculoskeletal model generated using SIMM (MusculoGraphics,
Inc.) consisting of a trunk (including the mass of the torso, head and arms), pelvis and legs for
each subject. Each lower extremity consisted of a thigh, shank and foot. The anthropometrics and
inertial properties were based on that of de Leva [200]. Joint positions and velocities were
calculated within the SIMM Motion Module. The kinematic variable calculated in this study
included the Leg orientation at toe-off that was defined as the angle between the vector from the
pelvis COM to the foot COM and vertical. Leg orientation is negative when the foot is posterior
to the pelvis (Figure 6-2).
Kinetic data: Three-dimensional GRFs were sampled at 2000 Hz. Ground reaction force
data was low-pass filtered using a fourth-order zero-lag Butterworth filter with a 20 Hz cutoff
frequency. The SIMM Motion Module (MusculoGraphics, Inc.) was used to perform a standard
inverse dynamics analysis to determine the inter-segmental joint moments. Kinetic data (GRFs
and joint moments) were normalized by subject body weight and to 100% of the paretic leg gait
cycle (paretic heel strike to paretic heel strike). Kinetic data included the pelvis velocity at toe-
off, ankle joint center velocity at toe-off, Hip impulse and AP impulse (Figure 6-2). Hip impulse
was calculated as the time integral of the hip moment during early swing and late swing. Positive
moment indicated flexor moments and negative moments indicated extensor moments. AP

118
impulse was calculated as the time integral of the AP GRF during the single-support phase of the
contralateral leg occurring at the same instance as the ipsilateral swing phase (Figure 6-2).
Positive impulses denoted propulsive (anterior) impulse and negative impulses denoted braking
(posterior) impulse.
Sub-division of the gait cycle: The stance phase of the gait cycle was subdivided into
Bins to correspond with: the first double support phase following heel strike (Bin1), the first 50%
of single leg stance (Bin 2), the second 50% of single leg stance (Bin 3) and the second double
support phase during paretic pre-swing (Bin 4). Bins 1 through 4 were defined from GRF
records. Additionally, the swing phase was sub-divided into two phases: the first 50% of swing
phase (Bin 5) and the second 50% of swing phase (Bin 6). The last instance of Bin 4 of stance
phase was toe-off and the initial condition variables were calculated at this instance. The early
and late hip impulses were calculated in Bin 5 and Bin 6 of swing phase. The early and late
contralateral AP impulses were calculated in Bin 2 and Bin 3 of stance phase.
Statistical Analyses
Stepwise Regression: Stepwise model-building techniques for regression designs with a
single dependent variable are described elsewhere [206]. The basic procedures involve (1)
identifying an initial model, (2) iteratively stepping, that is, repeatedly altering the model at the
previous step by adding or removing a predictor variable in accordance with the ‘stepping
criteria’, and (3) terminating the search when stepping is no longer possible given the ‘stepping
criteria’, or when a specified maximum number of steps has been reached.
In this study, step length was the dependent variable and the selected kinematic and kinetic
variables were the independent variables. A stepwise regression model was used to select critical
predictors (from the 7 hypothesized variables) that could account for the variability in step
lengths for individual participants and indicate how much variance in step length was explained

119
by these predictors (indicated by the R2 values). Two regression models were built for each
participant’s data to predict paretic and non-paretic step length variability each. Therefore,
overall 76 regression models were built for the 38 study participants. The step-wise regression
was conducted by pooling individual steps from all trials together for individual participants.
Note that for each participant different numbers of steps were analyzed (see Table 6-2 for the
minimum number of steps analyzed) since each participant walked at their self-selected speed at
a specific cadence. Only data from good steps of the participant were utilized (i.e., in the event
that there was a crossover of a step these data were deleted for this step and the corresponding
step). For some participants, there was a difference of 2-3 steps between paretic and non-paretic
legs that depended on which leg took the first and last step.
The ‘stepping criteria’ for this study was a significant relationship between the predictor
variable and step length at p < .05. The chosen predictors could best explain the generated step
lengths since they covaried (related) with step lengths on a step-by-step basis. That is; greater or
lesser value of the critical predictor variable that was chosen related to longer or shorter step
length in an individual participant and therefore explained the variability in step length
generation in an individual participant. Entry p value for the stepwise regression model was set at
less than 0.05 and removal p value was set at less than 0.10.
Determination of step length asymmetry: Step length asymmetry groups were determined
based on the overground asymmetrical patterns in healthy control participants using a Paretic
step ratio [PSR = Paretic step length/(Paretic + Non-paretic step length)] and expressed as a
percentage [194]. Asymmetry in the hemiparetic participants was characterized based on
symmetry ranges calculated from similarly-aged healthy participants, as follows: ‘Longer
120
paretic’ steps than non-paretic (PSR > 52.5), ‘Shorter paretic’ steps than non-paretic (PSR <
47.5) and ‘Symmetric’ step lengths (47.5 ≤ PSR ≤ 52.5).
Results
Average gait characteristics for individual participants with hemiparesis are presented in
Table 6-2. There was no difference in step-by-step variability between paretic and non-paretic
step lengths (p = .752). Majority of participants had paretic and non-paretic step length
variability less than 5 cm (Figure 6-3).
In general, greater variability was explained for the non-paretic step lengths than paretic
for individual participants (compare the difference in R2 values for individual participants in
Tables 6-3 and 6-4). The explanatory power of the models was also unrelated to the absolute
magnitude of step-by-step variability (standard deviation) in paretic and non-paretic step lengths
(p = .233). There were 2 participants for whom no predictor variables could explain the paretic
step length variability at p < .05. In comparison, there was no participant with unexplained non-
paretic step length variability.
Predictors of Step Length Variability and the Differences in Selected Predictor Variables across the Asymmetrical Sub-Groups
Shorter paretic group
For the paretic step length models, non-paretic AP impulse in late swing (APImp LS) was
the most commonly selected variable related to paretic step lengths (Table 6-3). Further, it
showed a positive association with step lengths wherever it was chosen. However, the non-
paretic APImp LS occurring during paretic stepping were braking forces for several participants
in this group (see Figure 6-4). Note that Paretic Hip Impulse in early and late swing was not
selected as a predictor variable related to paretic step length variability in this group of
participants.

121
For the non-paretic step length models, paretic APImp LS was the most commonly
selected variable related to non-paretic step lengths (Table 6-4). The paretic APImp LS occurring
during non-paretic stepping was propulsive in this phase. Unlike for the paretic step length
models, non-paretic Hip Impulse in early and late swing showed a significant positive relation to
non-paretic step lengths in 3/6 participants. Specifically, the non-paretic hip impulse was flexor
in these participants.
Symmetric group
For the paretic step length models, non-paretic APImp LS (in 7/10 participants) and paretic
leg orientation at toe-off (in 6/10 participants) were the most commonly selected variables
related to variability in individual participants. While non-paretic APImp LS was positively
related to paretic step lengths (Table 6-3), paretic LO was negatively related to step lengths.
Further, non-paretic APImp LS was propulsive in all but one participant (H12) and paretic leg
orientation was extension in all participants.
For the non-paretic step length models, non-paretic ankle joint center (AJC) velocity at toe-
off (7/10 participants), non-paretic Hip Impulse in early swing and paretic APImp LS (6/10
participants) were most commonly selected variables that related to non-paretic step length
variability. Further, all these variables were positively related to non-paretic step lengths.
Specifically, hip impulse was flexor in early swing and paretic AP impulse was primarily
propulsive in late swing.
Longer paretic group
For the paretic step length models, paretic hip impulse in early swing and non-paretic AP
impulse in early swing (APImp ES) were the most commonly selected variables that related to
paretic step length variability (12/22 participants selected these variables). Note that, APImp in
this group was more commonly selected in the early swing than late compared to the Shorter and

122
Symmetric persons where APImp LS was more commonly selected (Table 6-3). However,
paretic hip impulse in early swing showed a stronger relation with paretic step length in
participants in this group compared to those selectively in the Shorter paretic group (indicated in
Table 6-3 by significant relations between, also refer to Figure 6-5).
Both paretic hip impulse in early swing and non-paretic APImp ES were positively related
to paretic step lengths (Figure 6-5). Note that paretic hip impulse in early swing was flexor in all
participants. Non-paretic APImp ES was primarily propulsive in this phase in majority of the
participants (only 2/22 showed entirely braking in this phase compared to most participants in
Shorter paretic group who showed braking forces, Figure 6-4).
For the non-paretic step length models, paretic APImp LS and non-paretic hip impulse in
early swing were most commonly selected as predictors that related to non-paretic step length
variability (15/22 participants showed significant relations for both of these variables). Both
predictors were positively related to non-paretic step lengths. Non-paretic hip impulse was
primarily flexor. Paretic APImp LS was primarily braking in 10/22 participants where it showed
a significant relationship. Non-paretic AJC velocity at toe-off (14/22 participants) was also
among the commonly selected predictors that related to non-paretic step length variability.
Discussion
The purpose of this study was to comprehensively evaluate the mechanisms underlying
step length generation during hemiparetic gait by determining those variables that strongly relate
to step length variability within-subjects. While recent work suggests potential mechanisms that
might be related to step lengths during hemiparetic gait [194], there has been no systematic
investigation to understand mechanisms underlying step length generation during hemiparetic
walking at a self-selected pace. To improve walking outcomes after a hemiparetic stroke,
rehabilitation therapists commonly focus on increasing the step lengths. Determining the most

123
significant predictors that relate to step-by-step variability in step lengths post-stroke, can
provide insights on those parameters that can be targeted to change step lengths (i.e., increase
step lengths or even reduce step length asymmetry).
Overall, the range of variance explained by the regression models suggested that our
hypotheses that the events occurring during a) the initial conditions prior to ipsilateral swing
phase, b) ipsilateral swing phase, and c) contralateral stance phase relates to step lengths. Our
current methodology (of individual subject regression models) enabled us to determine several
mechanisms underlying step length generation and also helped us to delineate differential
mechanisms in sub-groups of this asymmetrical population. Specifically, within-subject analyses
as used in our study is specific to our study question where we want to understand kinematic and
kinetic variables that relate to step lengths in individual participants.
Contralateral Stance Leg Ground Reaction Force (AP Impulse during Ipsilateral Swing) is a Significant Predictor of Step Length Variability
In majority of participants, contralateral AP impulse (propulsion mostly) occurring at the
same instance as ipsilateral swing was the most commonly selected variable that was related
positively to step length variability, suggesting that an increase in the contralateral AP impulse
resulted in a longer ipsilateral step length in individual participants (Table 6-3, 6-4). However,
sub-groups showing asymmetrical performance showed a difference in selection of either
contralateral AP impulse during its early versus late phase. In persons taking ‘Symmetric’ and
‘Shorter paretic’ steps, non-paretic AP impulse during late non-paretic single-support phase
related strongly to paretic step lengths. Contrarily, in persons taking ‘Longer paretic’ steps
several persons showed a strong relation between non-paretic AP impulse in the early phase and
paretic step lengths (Figure 6-5). Further, since compared to the ‘Shorter paretic’ and
‘Symmetric’ group, persons in this group primarily showed non-paretic leg propulsion in its

124
early stance phase, it is likely that persons taking longer paretic steps show additional increased
non-paretic propulsive impulse that begins sooner in the gait cycle (Figure 6-4). This greater
non-paretic leg propulsive impulse might be propelling the trunk further forward early during
paretic leg swing phase resulting in the paretic leg stepping longer than the non-paretic.
Specifically, since impaired paretic leg propulsion can be compensated by increased non-paretic
leg propulsion, persons in the ‘Longer paretic’ group show greater compensatory non-paretic leg
propulsion to offset the reduced paretic leg propulsion [194]. Therefore, while increased non-
paretic leg propulsion in general related to a longer step length; greater compensatory non-
paretic leg propulsion that begins sooner resulted in a relatively longer paretic step than non-
paretic in the ‘Longer paretic’ group. Further, note that compared to the non-paretic leg
propulsion being selected more in early stance than late; the paretic leg propulsion is selected
more in late stance than early and is also primarily braking in nature suggesting the reduced
paretic leg propulsion in the ‘Longer paretic’ group.
Ipsilateral Hip Impulse in Early Swing is a Significant Predictor of Step Length Variability in Persons taking Longer Paretic than Non-Paretic Steps
Hip impulse during initial swing showed a strong relationship to step lengths. It was
selected as a significant predictor explaining paretic step length variability specifically in the
‘Longer paretic’ group of participants and as an important predictor explaining non-paretic step
length variability in majority of participants. Note that in participants taking ‘Shorter paretic’
steps, paretic hip impulse did not significantly explain paretic step length variability (Table 6-3).
Whereas, in participants taking ‘Longer paretic’ steps and ‘Symmertic’ steps, hip impulse in
initial swing was one of the important variables (Longer paretic > Symmetric) chosen by the
regression models. Furthermore, the hip impulse was primarily flexor during early swing (Figure
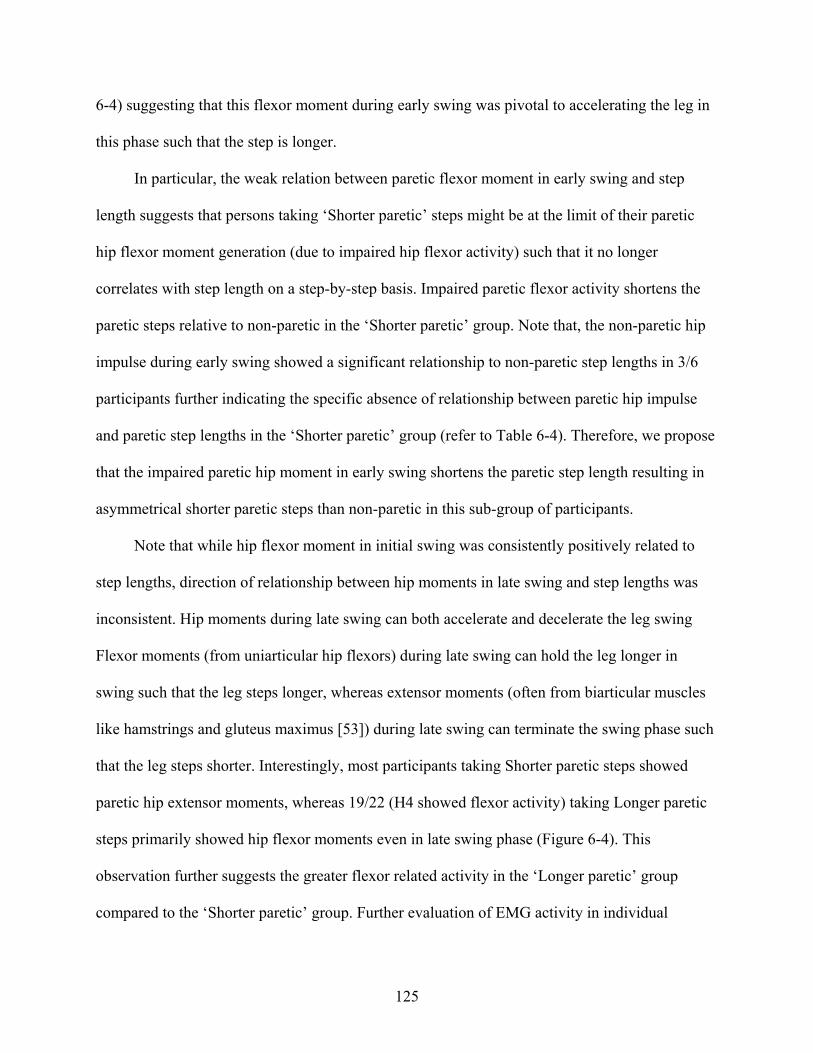
125
6-4) suggesting that this flexor moment during early swing was pivotal to accelerating the leg in
this phase such that the step is longer.
In particular, the weak relation between paretic flexor moment in early swing and step
length suggests that persons taking ‘Shorter paretic’ steps might be at the limit of their paretic
hip flexor moment generation (due to impaired hip flexor activity) such that it no longer
correlates with step length on a step-by-step basis. Impaired paretic flexor activity shortens the
paretic steps relative to non-paretic in the ‘Shorter paretic’ group. Note that, the non-paretic hip
impulse during early swing showed a significant relationship to non-paretic step lengths in 3/6
participants further indicating the specific absence of relationship between paretic hip impulse
and paretic step lengths in the ‘Shorter paretic’ group (refer to Table 6-4). Therefore, we propose
that the impaired paretic hip moment in early swing shortens the paretic step length resulting in
asymmetrical shorter paretic steps than non-paretic in this sub-group of participants.
Note that while hip flexor moment in initial swing was consistently positively related to
step lengths, direction of relationship between hip moments in late swing and step lengths was
inconsistent. Hip moments during late swing can both accelerate and decelerate the leg swing
Flexor moments (from uniarticular hip flexors) during late swing can hold the leg longer in
swing such that the leg steps longer, whereas extensor moments (often from biarticular muscles
like hamstrings and gluteus maximus [53]) during late swing can terminate the swing phase such
that the leg steps shorter. Interestingly, most participants taking Shorter paretic steps showed
paretic hip extensor moments, whereas 19/22 (H4 showed flexor activity) taking Longer paretic
steps primarily showed hip flexor moments even in late swing phase (Figure 6-4). This
observation further suggests the greater flexor related activity in the ‘Longer paretic’ group
compared to the ‘Shorter paretic’ group. Further evaluation of EMG activity in individual

126
participants and similar model building using EMG activity to explain step length variability can
help implicate the specific muscles responsible for these observed kinetic relationships.
Ankle-Joint Center Velocity at Toe-Off is a Significant Predictor of Non-Paretic Step Length Variability
Ankle joint center velocity at toe-off was significantly positively related to non-paretic step
length variability in majority of participants, suggesting that greater AJC velocity at toe-off
accelerates the foot forward into swing. Contrarily, AJC velocity was not as commonly selected
to explain paretic step length variability. AJC velocity at toe-off will be affected by ankle
excursion (plantarflexion) at toe-off, ankle muscle paresis, spasticity, increased antagonist
coactivation and increased passive stiffness [207]. This indicates that the paretic impairments
commonly observed in majority of participants post-stroke can affect the AJC angular velocity at
toe-off. Therefore, paretic AJC velocity at toe-off was not as strongly related to step lengths
since majority of hemiparetic participants might be at the limit of their paretic AJC velocity (due
to impaired capacity). It is also possible that while there is little variation in AJC velocity within-
subjects, there would be considerable variation between-subjects and would contribute
significantly to between-subject variation in step lengths.
Leg Orientation at Toe-Off and Pelvis Velocity at Toe-Off and their Contribution to Explaining Step Length Variability
Leg orientation at toe-off was the second most commonly selected predictor variable that
was significantly related to paretic step lengths in participants taking ‘Symmetric’ steps. Note
that, while it is expected that leg orientation would be negative at toe-off, there were seven
hemiparetic participants (all taking Longer paretic steps than non-paretic) with the leg oriented
anterior to pelvis in this phase (i.e., showing positive values for paretic leg orientation for all
steps that they walked) and four others who showed positive values for at least half of the steps
that they took. Posterior leg orientation implies an extended leg at toe-off. Selection of paretic

127
leg orientation specifically in the symmetric group suggests that these persons might be attaining
appropriate leg extension that would acts to direct the ground reaction forces appropriately to
propel the trunk forward at the terminal stance phase. Pelvis velocity at toe-off was significantly
related to step lengths only in few participants; suggesting that the velocity of the body during
the initial conditions prior to ipsilateral swing was not a strong predictor of step lengths.
Within-Subjects Regression Models
The within-subjects regression methodology as used in our study is different from
conventionally used methodology where average data for individual subjects are used to build
one regression model. Within-subject analyses as used in our study are specific to our study
question where we want to determine parameters that influence the step length variability in
individual participants. Since each participant walks at their self-selected speed and at a pre-
determined cadence that differs across participants, grouping all subjects’ data would confound
the results if we want to determine those predictors that significantly relate to step-by-step
variability in step lengths. For instance, when we averaged the data for individual subjects and
ran one regression model to understand paretic step length generation between-participants, the
predictor variable that related to between-subjects were leg orientation at toe-off that was
negatively related to step length and hip impulse in early swing that was positively related to step
lengths. This result suggests that longer or shorter paretic step length between-participants
related to how their leg was oriented at toe-off and hip impulse in early swing. While this
information is valuable to understand why some persons take longer steps than others, in order to
effect changes in individual patients' performances, it would be more essential to understand
which predictor variables resulted in an increase or decrease in step length.
Such an approach of individual-subject analyses has been highlighted in earlier work
[163]. Olney et al. (1994) in their attempt to understand the most critical variables that predict

128
walking speed suggested that the regression analysis done on the subjects deviations from their
averages (i.e., the within-subject analyses) is more appropriate if the aim were to understand
what variables can affect individual persons performance. They suggested that their within-
subjects regression analyses were appropriate because it shows that the walking speed of a
subject increases with appropriate changes in the chosen predictor variables. They also
acknowledged that on the other hand between-subject analyses were more appropriate if the aim
were to determine those variables that predict the walking speeds of different subjects. The
individual-subject regression analyses as used in our study accounted for the step-by-step
variability in the initial conditions, swing phase and contralateral stance phase mechanisms that
control step lengths and therefore, provide strong evidence for mechanisms of step length
generation.
Limitations
Gait variables are expected to be correlated. This quality of the variables is described as
"multicollinearity." Although multicollinearity can be a problem in some regression modeling, it
does not interfere in our study because 1) we tried to select relatively independent variables; 2)
we only had 7 predictor variables, and 3) Stepwise procedures mitigate against the retention of
highly correlated predictor variables. It is possible that the step-by-step variability in step lengths
was directly related to the explanatory power of the models; suggesting that increased or
decreased model variance could be simply due to increased or decreased step variability.
Nonetheless, we found that there was no significant relationship between the step-by-step
variability in step lengths and the variance explained by both the paretic and non-paretic
regression models indicating the model’s specificity in selecting those variables that best related
to paretic step lengths. Further, extrinsic sources of error might have increased the step
variability (i.e., differences in marker placement from subject to subject). However, since we

129
used a within-subjects design these sources of variation were minimal. It is possible that there are
other predictors that relate to step length variability (e.g. knee and ankle moments during initial
conditions and during swing, pelvic displacements specifically at the initial conditions prior to
swing). Studies are warranted to systematically consider other predictors that might relate to step
length variability.
Conclusions
Use of an individual-subjects design incorporating step-by-step variability in gait data
helped us to determine the specific mechanisms that relate to step length generation. Based on
chosen predictors that relate to step lengths, we are able to propose specific mechanisms that
affect step length generation. Knowledge of these mechanisms, in turn, highlights rehabilitation
strategies that can be targeted specifically to affect step lengths and improve walking outcomes
post-stroke. In the sub-group of persons taking ‘Longer paretic’ steps than non-paretic, we
suggest that improving paretic leg propulsion would increase the non-paretic step length that
would reduce their asymmetry. On the other hand, in the sub-group taking ‘Shorter paretic’ steps
than non-paretic, improving the paretic hip flexor activity could lengthen the paretic steps and
reduce their asymmetry. Future studies should evaluate EMG muscle activity and its relation to
step length variability to support and further explain the current proposed mechanisms
underlying step length generation during hemiparetic walking.

130
Table 6-1. Subject characteristics
Note that Fugl-meyer grading is based on scores from lower-exremity fugl-meyer scale (synergy portion only – maximum score = 22). Severe ≤ 14, Moderate = 15 – 18, Mild ≥ 19.
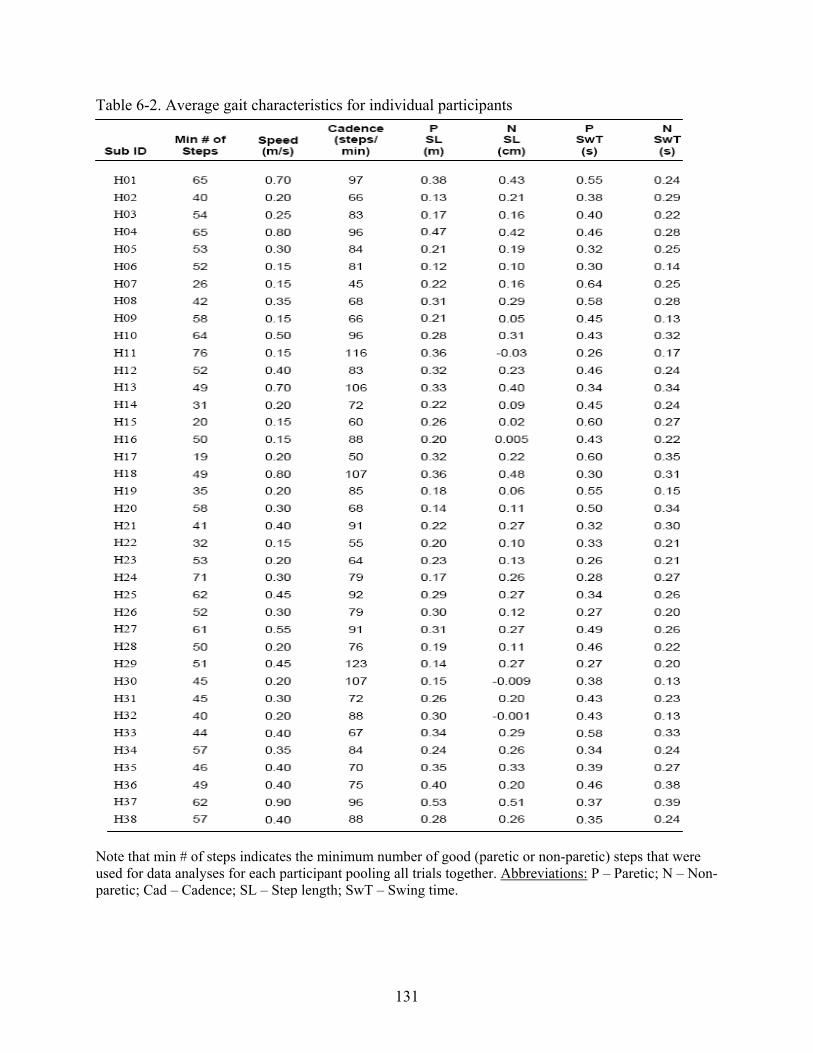
131
Table 6-2. Average gait characteristics for individual participants
Note that min # of steps indicates the minimum number of good (paretic or non-paretic) steps that were used for data analyses for each participant pooling all trials together. Abbreviations: P – Paretic; N – Non-paretic; Cad – Cadence; SL – Step length; SwT – Swing time.
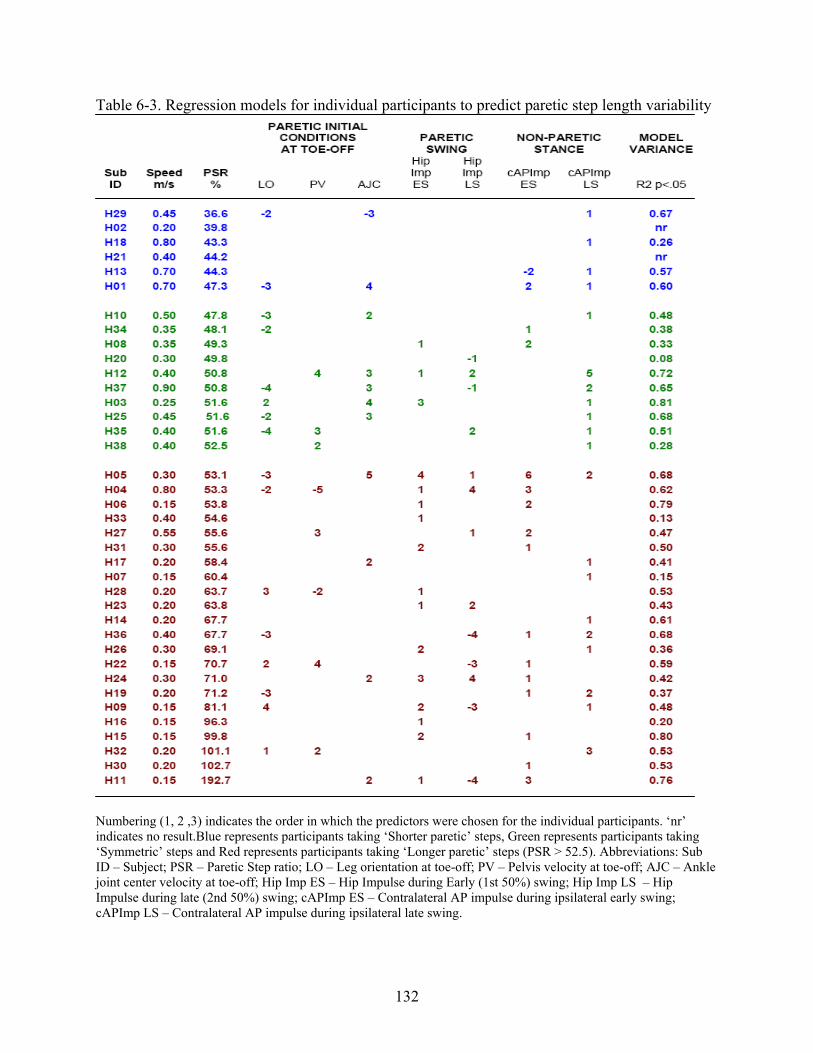
132
Table 6-3. Regression models for individual participants to predict paretic step length variability
Numbering (1, 2 ,3) indicates the order in which the predictors were chosen for the individual participants. ‘nr’ indicates no result.Blue represents participants taking ‘Shorter paretic’ steps, Green represents participants taking ‘Symmetric’ steps and Red represents participants taking ‘Longer paretic’ steps (PSR > 52.5). Abbreviations: Sub ID – Subject; PSR – Paretic Step ratio; LO – Leg orientation at toe-off; PV – Pelvis velocity at toe-off; AJC – Ankle joint center velocity at toe-off; Hip Imp ES – Hip Impulse during Early (1st 50%) swing; Hip Imp LS – Hip Impulse during late (2nd 50%) swing; cAPImp ES – Contralateral AP impulse during ipsilateral early swing; cAPImp LS – Contralateral AP impulse during ipsilateral late swing.

133
Table 6-4. Regression models for individual participants predicting non-paretic step length variability
Numbering (1, 2 ,3) indicates the order in which the predictors were chosen for the individual participants. ‘nr’ indicates no result.Blue represents participants taking ‘Shorter paretic’ steps, Green represents participants taking ‘Symmetric’ steps and Red represents participants taking ‘Longer paretic’ steps (PSR > 52.5). Abbreviations: Sub ID – Subject; PSR – Paretic Step ratio; LO – Leg orientation at toe-off; PV – Pelvis velocity at toe-off; AJC – Ankle joint center velocity at toe-off; Hip Imp ES – Hip Impulse during Early (1st 50%) swing; Hip Imp LS – Hip Impulse during late (2nd 50%) swing; cAPImp ES – Contralateral AP impulse during ipsilateral early swing; cAPImp LS – Contralateral AP impulse during ipsilateral late swing.

134
Figure 6-1.An individual participant walking on the split belt treadmill as kinematic, kinetic and
EMG data were recorded

135
Figure 6-2. Illustration of variables used in the study
Kinematic and Kinetic profile is illustrated from one step during walking for an individual participant. Note that all variables are normalized to the gait cycle. Red line indicates toe-off. Leg orientation, Pelvis velocity and Ankle joint center velocity calculated at toe-off were the initial condition variables. Hip impulse and Contralateral AP impulse during initial (1st 50%) and late (2nd 50%) swing were the swing phase variables calculated. Note that the impulse is calculated as the area under force curve. Raw profile for the Hip moment and AP GRF are not presented. The AP impulse presented in the figure is from the contralateral leg that is occurring at the same instance as the ipsilateral swing phase.

136
1.201.000.800.600.400.20Paretic step length standard deviation (m)
20
15
10
5
0
Num
ber o
f sub
ject
s
MEAN = 0.36 m
1.201.000.800.600.400.20
Non-paretic step length standard deviation (m)
20
15
10
5
0
Num
ber o
f sub
ject
s
MEAN = 0.40 m
Figure 6-3. Frequency distribution of step-to-step variability in step lengths.

137
A. Non-paretic AP Impulse
Figure 6-4. Non-paretic AP impulse and Paretic hip impulse during paretic stepping in the asymmetrical sub-groups
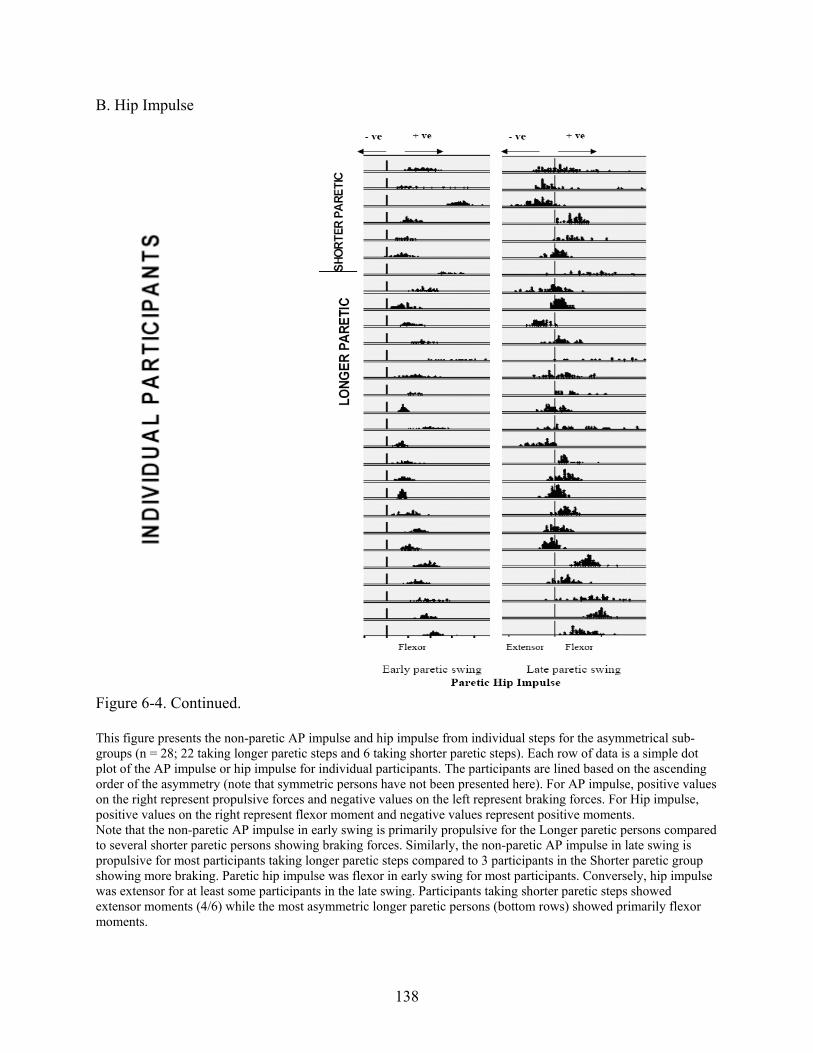
138
B. Hip Impulse
Figure 6-4. Continued. This figure presents the non-paretic AP impulse and hip impulse from individual steps for the asymmetrical sub-groups (n = 28; 22 taking longer paretic steps and 6 taking shorter paretic steps). Each row of data is a simple dot plot of the AP impulse or hip impulse for individual participants. The participants are lined based on the ascending order of the asymmetry (note that symmetric persons have not been presented here). For AP impulse, positive values on the right represent propulsive forces and negative values on the left represent braking forces. For Hip impulse, positive values on the right represent flexor moment and negative values represent positive moments. Note that the non-paretic AP impulse in early swing is primarily propulsive for the Longer paretic persons compared to several shorter paretic persons showing braking forces. Similarly, the non-paretic AP impulse in late swing is propulsive for most participants taking longer paretic steps compared to 3 participants in the Shorter paretic group showing more braking. Paretic hip impulse was flexor in early swing for most participants. Conversely, hip impulse was extensor for at least some participants in the late swing. Participants taking shorter paretic steps showed extensor moments (4/6) while the most asymmetric longer paretic persons (bottom rows) showed primarily flexor moments.

139
0
0.5
1
1.5
2
2.5
3
3.5
4
0.22 0.27 0.32 0.37
Paretic step length (m)
Pare
tic H
ip im
puls
e in
ear
ly s
win
g
0
0.001
0.002
0.003
0.004
0.005
0.006
0.007
0.008
0.009
0.01
0.22 0.27 0.32 0.37
Paretic step lengths (m)N
on-p
aret
ic A
P im
puls
e
Early swing
Late swing
Figure 6-5. Relationship between paretic hip impulse in early swing, non-paretic AP impulse in early and late swing in an individual participant taking longer paretic steps than non-paretic
PSR – 69.8 Speed – 0.30 m/s

140
CHAPTER 7 CONCLUSIONS: INTEGRATING THE FINDINGS
The asymmetrical nature of hemiparetic gait is extensively documented [12-15]. Yet, there
is considerable disagreement in the literature regarding the clinical relevance of evaluating
asymmetrical gait post-stroke. This disagreement stems from two conflicting suggestions in the
literature. Some authors report that gait symmetry should be an ideal objective in walking
rehabilitation post-stroke due to the apparently asymmetrical nature of hemiparetic walking [12,
208, 209]. While others highlight that since compensatory strategies can promote functional
performance, normalization of movement patterns should not be the primary focus of gait
rehabilitation [5, 18]. We suggest that, while gait symmetry need not be the primary focus for
walking rehabilitation, gait asymmetry should be evaluated to identify the unique paretic leg
motor deficits and to understand how the paretic leg impairments might limit functional walking
performance.
This dissertation aimed at quantifying gait asymmetry, understanding its relationship to
walking performance and investigating mechanisms underlying gait asymmetry. Specifically,
stepping asymmetry was investigated since spatiotemporal characteristics of steps are the final
outcomes of all events occurring in the gait cycle. Further, since the stepping measures can be
easily recorded, transition of our results to clinical settings can be easily facilitated.
Step Length Asymmetry during Hemiparetic Walking
While temporal asymmetry is well understood [13], step length asymmetry is not well
quantified and its relation to hemiparetic walking performance is unclear. Therefore, in study one
of this dissertation, we primarily quantified the step length asymmetry patterns during
hemiparetic walking and proposed some underlying mechanisms in the asymmetrical sub-
groups. We were able to quantify the step length asymmetry patterns using a step length

141
asymmetry ratio and by relating the step length asymmetry to propulsive forces asymmetry. Our
results also showed that while step length asymmetry related to hemiparetic severity, it did not
limit the attained walking speed highlighting other compensatory strategies to achieve the
functional walking speeds. Our findings also suggested differing motor control mechanisms (i.e.,
ability to change speeds, weight supported on paretic leg) in persons showing different step
length asymmetry patterns. Future work is encouraged to understand the specific sensorimotor
impairments related to the step length asymmetry patterns and evaluate whether walking
rehabilitation directed at these impairments can improve walking outcomes post-stroke.
Step Variability during Hemiparetic Walking
Study two of this dissertation investigated step variability to determine how gait variability
might relate to asymmetrical walking post-stroke and whether measures of variability can be
used as markers of impaired performance. Gait variability is shown to be strongly associated
with motor and balance control during walking and suggested to be a quantifiable biomechanical
marker to evaluates walking impairments [77]. Our results revealed that increased variability in
most spatiotemporal characteristics and reduced width variability related to poor performance
outcomes (severe hemiparesis, asymmetrical gait and poor balance). Specifically, results showed
an asymmetry in swing and pre-swing time step variability in participants with the most impaired
performance. There was no difference in step length variability between paretic and non-paretic
steps, suggesting that the step length asymmetry patterns are relatively consistent from step to
step during hemiparetic walking. Specifically since step variability is shown to strongly predict
the risk for falling [98, 103], the finding that the asymmetrical groups showed greater step
variability than the symmetrical persons suggests the dynamic balance impairments in these
persons. Future research is warranted to determine specific thresholds of step variability to
further validate the use of variability measures as performance markers.

142
Asymmetrical Stepping in a Body Reference Frame Post-Stroke
In study three of this dissertation, stepping asymmetry was quantified in a body reference
frame. Literature shows that asymmetry in steps and asymmetry in body movements are
investigated in isolation [11, 199]. Nonetheless, since foot placement (during stepping) closely
relates to body movements, it might be essential to investigate asymmetry in foot placement
relative to body (rather than in isolation). Our results showed that post-stroke anterior-posterior
and medial-lateral foot placements were asymmetrical relative to body and that this asymmetry
related to step length asymmetry but not step widths. Wider paretic foot placement relative to
pelvis than non-paretic also related to reduced paretic leg weight support and lateral instability,
encouraging the clinical utility of medial-lateral foot placement relative to pelvis. Since foot
placement relative to body can be associated to forward progression and dynamic balance [132,
133], investigation of stepping asymmetry in a body reference frame also helped us propose
underlying mechanisms of stepping asymmetry. Future studies are encouraged to evaluate the
underlying kinematics of hip and knee to develop an integrated understanding of stepping in the
asymmetrical groups.
Step Length Generation during Hemiparetic Walking
In study four of this dissertation, mechanisms of step length generation during hemiparetic
walking were evaluated using a novel methodology that incorporated the step-by-step variability
in step lengths. Literature suggests several potential indirect and direct mechanisms relates to
step length [173, 182, 194] but there is no clear consensus on predictors that relate to step length
generation. Results revealed that contralateral anterior-posterior and hip impulses during swing
explained the step length variability in majority of participants. Relation of these predictors to
step lengths differed based on step length asymmetry patterns, implying differential mechanisms
of step length generation across the sub-groups of persons showing differing step length

143
asymmetries. Compared to persons taking shorter paretic steps or symmetric steps, persons
taking longer paretic steps showed early stance phase non-paretic leg propulsion, suggesting
increased non-paretic propulsive impulse beginning sooner in the gait cycle. In participants
taking shorter paretic steps, paretic hip impulse in initial swing was not strongly related to paretic
step lengths unlike persons in other groups for whom hip flexor impulse was a strong predictor
of paretic step lengths. Based on these observations, we suggest that in persons taking longer
paretic steps than non-paretic, improving paretic leg propulsion would increase the non-paretic
step length and reduce their asymmetry. While in persons taking shorter paretic steps than non-
paretic, improving the paretic hip flexor activity could lengthen the paretic steps and reduce their
asymmetry. Future studies should evaluate EMG muscle activity and its relation to step length
variability to support and further explain the current proposed mechanisms underlying step
length generation in the step length asymmetry groups.
Summary
Our findings suggest that stepping asymmetry is a clinically relevant measure to evaluate
paretic leg performance post-stroke. We propose step length asymmetry, asymmetry in swing
and pre-swing time step variability and medial-lateral foot placement relative to the pelvis as
outcomes of asymmetrical walking performance. Our findings also suggest differential motor
control mechanisms in persons walking with differing step length asymmetry patterns.
Results of this dissertation highlight the need to evaluate gait asymmetry post-stroke which
would, in turn, enable us to differentiate physiological restitution from compensation during
walking. Clinically, specificity in evaluation would help to tailor locomotor retraining
specifically to address the root causes of impaired ambulation for each individual.

144
APPENDIX A LOWER EXREMITY FUGL-MEYER SCALE
TEST ITEM SCORING CRITERIA Achilles 1. Reflex activity
Patellar (KNEE FLEXION) 0-No reflex activity can be elicited 2-Reflex activity can be elicited
2. Within synergy
Hip flexion (FLEXOR SYN – HIP FLEX) Knee flexion (FLEXOR SYN – KNEE FLEX)
a. Flexor synergy (in supine) (FLEXOR SYN)
Ankle dorsiflexion (FLEXOR SYN – ANKLE DF)
0-cannot be performed at all 1-partial motion 2-full motion
Hip extension (EXTENSOR SYN – HIP EXT) Hip adduction (EXTENSOR SYN – HIP ADD) Knee extension (EXTENSOR SYN – KNEE EXT)
b. Extensor synergy (in sidelying)
(EXTENSOR SYN)
Ankle plantarflexion (EXTR SYN – ANKLE PF)
0-no motion 1-weak motion 2-almost full strength comapred to normal
Knee flexion beyond 90 (COMBINE SYN – KNEE FLEX)
0-no active motion 1-from slightly extended position, knee can be flexed, but not beyond 90 2-knee flexion beyond 90
3. Movement combining synergies (in sitting: knees free of chair) (COMBINE SYN)
Ankle dorsiflexion (COMBINE SYN – ANKLE DF)
0-no active flexion 1-incomplete active flexion 2-normal dorsiflexion
Knee flexion (OUT OF SYN – KNEE FLEX)
0-knee cnnot flex without hip flexion 1-knee begins flexion without hip flexion, but does not reach to 90, or hip flexes during motion 2-full motion as described
4. Movement out of synergy (in standing, hip at 0) (OUT OF SYN)
Ankle dorsiflexion (OUT OF SYN – ANKLE DF)
0-active motion 1-partial motion 2-full motion
5. Normal reflexes (sitting)
Knee flexors Patellar Achilles
0-at least 2 of the 3 phasic reflexes are markedly hyperactive 1-one reflex is hyperactive, or at least 2 reflexes are lively 2-no more than one reflex is lively and none are hyperactive
Tremor
0-marked tremor 1-slight tremor 2-no tremor
Dysmetria
0-pronounced or unsystematic dysmetria 1-slight or systematic dysmetria 2-no dysmetria
6. Coordination/speed (supine : heel to opposite knee; 5 repititions in rapid succession)
Speed
0-acticity is more than 6 seconds longer than unaffected side 1-(2-5) seconds longer than unaffected side 2-less than 2 seconds difference

145
APPENDIX B DYNAMIC GAIT INDEX SCALE
Gait level surface _____ Instructions: Walk at your normal speed from here to the next mark (20’) Grading: Mark the lowest category that applies. (3) Normal: Walks 20’, no assistive devices, good sped, no evidence for imbalance, normal gait pattern (2) Mild Impairment: Walks 20’, uses assistive devices, slower speed, mild gait deviations. (1) Moderate Impairment: Walks 20’, slow speed, abnormal gait pattern, evidence for imbalance. (0) Severe Impairment: Cannot walk 20’ without assistance, severe gait deviations or imbalance. Change in gait speed _____ Instructions: Begin walking at your normal pace (for 5’), when I tell you “go,” walk as fast as you can (for 5’). When I tell you “slow,” walk as slowly as you can (for 5’). Grading: Mark the lowest category that applies. (3) Normal: Able to smoothly change walking speed without loss of balance or gait deviation. Shows a
significant difference in walking speeds between normal, fast and slow speeds. (2) Mild Impairment: Is able to change speed but demonstrates mild gait deviations, or not gait deviations but
unable to achieve a significant change in velocity, or uses an assistive device. (1) Moderate Impairment: Makes only minor adjustments to walking speed, or accomplishes a change in speed
with significant gait deviations, or changes speed but has significant gait deviations, or changes speed but loses balance but is able to recover and continue walking.
(0) Severe Impairment: Cannot change speeds, or loses balance and has to reach for wall or be caught. Gait with horizontal head turns _____ Instructions: Begin walking at your normal pace. When I tell you to “look right,” keep walking straight, but turn your head to the right. Keep looking to the right until I tell you, “look left,” then keep walking straight and turn your head to the left. Keep your head to the left until I tell you “look straight,“ then keep walking straight, but return your head to the center. Grading: Mark the lowest category that applies. (3) Normal: Performs head turns smoothly with no change in gait. (2) Mild Impairment: Performs head turns smoothly with slight change in gait velocity, i.e., minor disruption to
smooth gait path or uses walking aid. (1) Moderate Impairment: Performs head turns with moderate change in gait velocity, slows down, staggers
but recovers, can continue to walk. (0) Severe Impairment: Performs task with severe disruption of gait, i.e., staggers outside 15” path, loses balance, stops, reaches for wall. Gait with vertical head turns _____ Instructions: Begin walking at your normal pace. When I tell you to “look up,” keep walking straight, but tip your head up. Keep looking up until I tell you, “look down,” then keep walking straight and tip your head down. Keep your head down until I tell you “look straight,“ then keep walking straight, but return your head to the center. Grading: Mark the lowest category that applies. (3) Normal: Performs head turns smoothly with no change in gait. (2) Mild Impairment: Performs head turns smoothly with slight change in gait velocity, i.e., minor disruption to
smooth gait path or uses walking aid. (1) Moderate Impairment: Performs head turns with moderate change in gait velocity, slows down, staggers
but recovers, can continue to walk. (0) Severe Impairment: Performs task with severe disruption of gait, i.e., staggers outside 15” path, loses balance, stops, reaches for wall.

146
Dynamic Gait Index continued…. Gait and pivot turn _____ Instructions: Begin walking at your normal pace. When I tell you, “turn and stop,” turn as quickly as you can to face the opposite direction and stop. Grading: Mark the lowest category that applies. (3) Normal: Pivot turns safely within 3 seconds and stops quickly with no loss of balance. (2) Mild Impairment: Pivot turns safely in > 3 seconds and stops with no loss of balance. (1) Moderate Impairment: Turns slowly, requires verbal cueing, requires several small steps to catch balance
following turn and stop. (0) Severe Impairment: Cannot turn safely, requires assistance to turn and stop. Step over obstacle ____ Instructions: Begin walking at your normal speed. When you come to the shoebox, step over it, not around it, and keep walking. Grading: Mark the lowest category that applies. (3) Normal: Is able to step over the box without changing gait speed, no evidence of imbalance. (2) Mild Impairment: Is able to step over box, but must slow down and adjust steps to clear box safely. (1) Moderate Impairment: Is able to step over box but must stop, then step over. May require verbal cueing. (0) Severe Impairment: Cannot perform without assistance. Step around obstacles _____ Instructions: Begin walking at normal speed. When you come to the first cone (about 6’ away), walk around the right side of it. When you come to the second cone (6’ past first cone), walk around it to the left. Grading: Mark the lowest category that applies. (3) Normal: Is able to walk around cones safely without changing gait speed; no evidence of imbalance. (2) Mild Impairment: Is able to step around both cones, but must slow down and adjust steps to clear cones. (1) Moderate Impairment: Is able to clear cones but must significantly slow, speed to accomplish task, or
requires verbal cueing. (0) Severe Impairment: Unable to clear cones, walks into one or both cones, or requires physical assistance. Steps _____ Instructions: Walk up these stairs as you would at home, i.e., using the railing if necessary. At the top, turn around and walk down. Grading: Mark the lowest category that applies. (3) Normal: Alternating feet, no rail. (2) Mild Impairment: Alternating feet, must use rail. (1) Moderate Impairment: Two feet to a stair, must use rail. (0) Severe Impairment: Cannot do safely. TOTAL SCORE: ___ / 24 Adapted from: Herdman SJ. Vestibular Rehabilitation. 2nd ed. Philadelphia, PA: F.A.Davis Co; 20

147
LIST OF REFERENCES
1. American-Heart-Association. 2002 Heart and Stroke Statistical Update. http://www.americanheart.org/downloadable/heart/HS_State_02.pdf. Accessed 12 March 2008. Dallas, Texas.
2. Duncan PW, Stason WB, Adams HP, Adelman AM, Alexander DN, Bishop DS, Diller L,
Donaldson NE, Grager CV, Holland AL. Post-Stroke Rehabilitation: Clincal Practice Guideline. 1995. Rockville, Maryland.
3. Han B, Haley WE. Family caregiving for patients with stroke. Review and analysis.
Stroke 1999;30(7):1478-85. 4. Stineman MG, Maislin G, Fiedler RC, Granger CV. A prediction model for functional
recovery in stroke. Stroke 1997;28(3):550-6. 5. Olney SJ, Richards C. Hemiparetic gait following stroke. Part I: Characteristics. Gait &
Posture 1996;4:136-48. 6. Nadeau S, Arsenault AB, Gravel D, Bourbonnais D. Analysis of the clinical factors
determining natural and maximal gait speeds in adults with a stroke. Am J Phys Med Rehabil 1999;78(2):123-30.
7. Bowen A, Lincoln NB, Dewey M. Cognitive rehabilitation for spatial neglect following
stroke. Cochrane Database Syst Rev 2002;(2):CD003586. 8. Mercier L, Audet T, Hebert R, Rochette A, Dubois MF. Impact of motor, cognitive, and
perceptual disorders on ability to perform activities of daily living after stroke. Stroke 2001;32(11):2602-8.
9. Bohannon RW, Andrews AW, Smith MB. Rehabilitation goals of patients with
hemiplegia. Int J Rehabil Res 1988;11:181-83. 10. Dobkin BH. Clinical practice. Rehabilitation after stroke. N Engl J Med
2005;352(16):1677-84. 11. von Schroeder HP, Coutts RD, Lyden PD, Billings E, Jr., Nickel VL. Gait parameters
following stroke: a practical assessment. J Rehabil Res Dev 1995;32(1):25-31. 12. Wall JC, Turnbull GI. Gait asymmetries in residual hemiplegia. Arch Phys Med Rehabil
1986;67(8):550-3. 13. Brandstater ME, de Bruin H, Gowland C, Clark BM. Hemiplegic gait: analysis of
temporal variables. Arch Phys Med Rehabil 1983;64(12):583-7.

148
14. Patterson KK, Parafianowicz I, Danells CJ, Closson V, Verrier MC, Staines WR, Black SE, McIlroy WE. Gait asymmetry in community-ambulating stroke survivors. Arch Phys Med Rehabil 2008;89(2):304-10.
15. Titianova EB, Tarakka IM. Asymmetry in walking performance and postural sway in
patients with chronic unilateral cerebral infarction. J Rehabil Res Dev 1995;32(3):236-44. 16. Chen CL, Chen HC, Tang SF, Wu CY, Cheng PT, Hong WH. Gait performance with
compensatory adaptations in stroke patients with different degrees of motor recovery. Am J Phys Med Rehabil 2003;82(12):925-35.
17. Griffin MPO, S.J.; McBride, I.D. The role of symmetry in gait performance of stroke
subjects with hemiplegia. Gait & Posture 1995;3:132-42. 18. Kim CM, Eng JJ. Magnitude and pattern of 3D kinematic and kinetic gait profiles in
persons with stroke: relationship to walking speed. Gait Posture 2004;20(2):140-6. 19. Kim CM, Eng JJ. Symmetry in vertical ground reaction force is accompanied by
symmetry in temporal but not distance variables of gait in persons with stroke. Gait Posture 2003;18(1):23-8.
20. Craik R, Dutterer L. Spatial and temporal characteristics of foot fall patterns. In: Gait
Analysis: Theory and Application. 1995. Editors: Craik R,Oatis C. Mosby-Year Book, St. Louis, Missouri. 143-58.
21. Mizrahi J, Susak Z, Heller L, Najenson T. Variation of time-distance parameters of the
stride as related to clinical gait improvement in hemiplegics. Scand J Rehabil Med 1982;14(3):133-40.
22. Prokop T, Berger W, Zijlstra W, Dietz V. Adaptational and learning processes during
human split-belt locomotion: interaction between central mechanisms and afferent input. Exp Brain Res 1995;106(3):449-56.
23. Sadeghi H, Allard P, Prince F, Labelle H. Symmetry and limb dominance in able-bodied
gait: a review. Gait Posture 2000;12(1):34-45. 24. Hausdorff JM. Gait dynamics, fractals and falls: Finding meaning in the stride-to-stride
fluctuations of human walking. Hum Mov Sci 2007;26(4):555-89. 25. Zehr EP. Neural control of rhythmic human movement: the common core hypothesis.
Exerc Sport Sci Rev 2005;33(1):54-60. 26. Whelan PJ. Control of locomotion in the decerebrate cat. Prog Neurobiol
1996;49(5):481-515.

149
27. Shumway-Cook A, Woollacott M. Motor Control: Theory and Practical Applications. 2001. Lippincott Williams and Wilkins; Philadelphia.
28. Craik R, Oatis C. Gait Analysis: Theory and Application.1995. Mosby-Year Book;
St. Louis, Missouri. 29. Perry J. Chapter 2 - Phases of gait. In: Gait Analysis: Normal and Pathological Function.
1992. Editor: Perry J. Slack; Thorofare, New Jersey. 9. 30. O' Sullivan SB, Schmitz TJ. Physical Rehabilitation - Assessment and Treatment. 2000.
4th Edition. Davis Company; Philadelphia. 1168. 31. American-Heart-Association. American-Heart-Association: Heart Disease and stroke
statistics - 2003 update. 2003. Dallas, Texas. 32. Kannel WB, Wolf PA, Verter J, McNamara PM. Epidemiologic assessment of the role of
blood pressure in stroke. The Framingham study. JAMA 1970;214(2):301-10. 33. Black-Schaffer RM, Osberg JS. Return to work after stroke: development of a predictive
model. Arch Phys Med Rehabil 1990;71(5):285-90. 34. Goldie PA, Matyas TA, Kinsella GJ, Galea MP, Evans OM, Bach TM. Prediction of gait
velocity in ambulatory stroke patients during rehabilitation. Arch Phys Med Rehabil 1999;80(4):415-20.
35. Richards CL, Malouin F, Dean C. Gait in stroke: assessment and rehabilitation. Clin
Geriatr Med 1999;15(4):833-55. 36. Knutsson E, Richards C. Different types of disturbed motor control in gait in hemiparetic
patients. Brain 1979;102(Pt 2):405-30. 37. Richards C, Malouin F, Wood-Dauphinee S. Gait velocity as an outcome measure of
locomotor recovery after stroke. In: Gait Analysis: Theory and Applications. 1995. Editors: Craik R,Oatis C. Mosby-Year Book, St. Louis, Missouri.355-64.
38. Sahrmann SA, Norton BJ. The relationship of voluntary movement to spasticity in the
upper motor neuron syndrome. Ann Neurol 1977;2(6):460-5. 39. Alexander MP. Stroke rehabilitation outcome. A potential use of predictive variables to
establish levels of care. Stroke 1994;25(1):128-34. 40. Thirumala P, Hier DB, Patel P. Motor recovery after stroke: lessons from functional brain
imaging. Neurol Res 2002;24(5):453-8. 41. Sahrmann SA, Norton BJ. The relationship of voluntary movement to spasticity in the
upper motor neuron syndrome. Ann Neurol 1977;2(6):460-5.

150
42. Dietz V, Berger W. Interlimb coordination of posture in patients with spastic paresis. Impaired function of spinal reflexes. Brain 1984;107(Pt 3):965-78.
43. Teasell R. Stroke recovery and rehabilitation. Stroke 2003;34(2):365-6. 44. Barbeau H, Fung J. The role of rehabilitation in the recovery of walking in the
neurological population. Curr Opin Neurol 2001;14(6):735-40. 45. Wolpaw JR, Carp JS. Adaptive plasticity in spinal cord. Adv Neurol 1993;59:163-74. 46. Bouyer LJ, Whelan PJ, Pearson KG, Rossignol S. Adaptive locomotor plasticity in
chronic spinal cats after ankle extensors neurectomy. J Neurosci 2001;21(10):3531-41. 47. Twitchell TE. The restoration of motor function following hemiplegia in man. Brain
1951;74(4):443-80. 48. Burdett RG, Borello-France D, Blatchly C, Potter C. Gait comparison of subjects with
hemiplegia walking unbraced, with ankle-foot orthosis, and with Air-Stirrup brace. Phys Ther 1988;68(8):1197-203.
49. Wade DT, Wood VA, Heller A, Maggs J, Langton Hewer R. Walking after stroke.
Measurement and recovery over the first 3 months. Scand J Rehabil Med 1987;19(1):25-30.
50. Richards CL, Malouin F, Wood-Dauphinee S, Williams JI, Bouchard JP, Brunet D. Task-
specific physical therapy for optimization of gait recovery in acute stroke patients. Arch Phys Med Rehabil 1993;74(6):612-20.
51. Richards CL, Malouin F, Dumas F, Tardiff D. Gait velocity as an outcome measure of
locomotor recovery after stroke. In: Gait Analysis: Theory and Applications. 1995. Editors: Craik R,Oatis C. Mosby-Year Book, St. Louis, Missouri. 355-64.
52. Keenan MA, Perry J, Jordan C. Factors affecting balance and ambulation following
stroke. Clin Orthop 1984 182):165-71. 53. Lamontagne A, Stephenson JL, Fung J. Physiological evaluation of gait disturbances post
stroke. Clin Neurophysiol 2007;118(4):717-29. 54. Dean CM, Richards CL, Malouin F. Walking speed over 10 metres overestimates
locomotor capacity after stroke. Clin Rehabil 2001;15(4):415-21. 55. Kautz SA, Brown DA. Relationships between timing of muscle excitation and impaired
motor performance during cyclical lower extremity movement in post-stroke hemiplegia. Brain 1998;121(Pt 3):515-26.

151
56. Reisman DS, Wityk R, Silver K, Bastian AJ. Locomotor adaptation on a split-belt treadmill can improve walking symmetry post-stroke. Brain 2007;130(Pt 7):1861-72.
57. Higginson JS, Zajac FE, Neptune RR, Kautz SA, Delp SL. Muscle contributions to
support during gait in an individual with post-stroke hemiparesis. J Biomech 2006;39(10):1769-77.
58. Wagenaar RC, Meijer OG, van Wieringen PC, Kuik DJ, Hazenberg GJ, Lindeboom J,
Wichers F, Rijswijk H. The functional recovery of stroke: a comparison between neuro-developmental treatment and the Brunnstrom method. Scand J Rehabil Med 1990;22(1):1-8.
59. News: Strokes Can Strike at Balance., in Health on the Net Foundation. 1993. 60. Nyberg L, Gustafson Y. Patient falls in stroke rehabilitation. A challenge to rehabilitation
strategies. Stroke 1995;26(5):838-42. 61. Harris JE, Eng JJ, Marigold DS, Tokuno CD, Louis CL. Relationship of balance and
mobility to fall incidence in people with chronic stroke. Phys Ther 2005;85(2):150-8. 62. Roberts L, Counsell C. Assessment of clinical outcomes in acute stroke trials. Stroke
1998;29(5):986-91. 63. Kautz SA, Patten C. Interlimb influences on paretic leg function in poststroke
hemiparesis. J Neurophysiol 2005;93(5):2460-73. 64. Daly JJ, Sng K, Roenigk K, Fredrickson E, Dohring M. Intra-limb coordination deficit in
stroke survivors and response to treatment. Gait Posture 2007;25(3):412-8. 65. Hsu AL, Tang PF, Jan MH. Analysis of impairments influencing gait velocity and
asymmetry of hemiplegic patients after mild to moderate stroke. Arch Phys Med Rehabil 2003;84(8):1185-93.
66. Mizrahi J, Susak Z, Heller L, Najenson T. Objective expression of gait improvement of
hemiplegics during rehabilitation by time-distance parameters of the stride. Med Biol Eng Comput 1982;20(5):628-34.
67. Perry J. Chapter 20 - Stride analysis. In: Gait Analysis: Normal and Pathological
Function. 1992. Editor: Perry J. Slack; Thorofare, New Jersey. 431. 68. Nakamura R, Handa T, Watanabe S, Morohashi I. Walking cycle after stroke. Tohoku J
Exp Med 1988;154(3):241-4. 69. Chen G, Patten C, Kothari DH, Zajac FE. Gait differences between individuals with post-
stroke hemiparesis and non-disabled controls at matched speeds. Gait Posture 2005;22(1):51-6.

152
70. De Quervain IA, Simon SR, Leurgans S, Pease WS, McAllister D. Gait pattern in the early recovery period after stroke. J Bone Joint Surg Am 1996;78(10):1506-14.
71. Dettmann MA, Linder MT, Sepic SB. Relationships among walking performance,
postural stability, and functional assessments of the hemiplegic patient. Am J Phys Med 1987;66(2):77-90.
72. Kerrigan DC. Introduction/Prologue on gait Analysis in the science of rehabilitation.
Journal of Rehabilitation Research and Development 1998;Monograph 002(xiii-xv). 73. Winter DA. Chapter 4: Kinetics. In: The Biomechanics and Motor Control of Human
Gait: Normal, Elderly and Pathological. 1991. Editor: Winter DA. Waterloo Biomechanics. 35.
74. Carlsoo S, Dahlof AG, Holm J. Kinetic analysis of the gait in patients with hemiparesis
and in patients with intermittent claudication. Scand J Rehabil Med 1974;6(4):166-79. 75. Rogers MW, Hedman LD, Pai YC. Kinetic analysis of dynamic transitions in stance
support accompanying voluntary leg flexion movements in hemiparetic adults. Arch Phys Med Rehabil 1993;74(1):19-25.
76. Bowden MG, Balasubramanian CK, Neptune RR, Kautz SA. Anterior-posterior ground
reaction forces as a measure of paretic leg contribution in hemiparetic walking. Stroke 2006;37(3):872-6.
77. Hausdorff JM. Gait variability: methods, modeling and meaning. J Neuroengineering
Rehabil 2005;2:19. 78. Buzzi UH, Stergiou N, Kurz MJ, Hageman PA, Heidel J. Nonlinear dynamics indicates
aging affects variability during gait. Clin Biomech (Bristol, Avon) 2003;18(5):435-43. 79. Grillner S. Control of locomotion in bipeds, tetrapods, and fish. In: Handbook of
Physiology.1981.Editor: Brooks V. American Physiological Society; Bethesda, Maryland. 1179-236.
80. Taga G, Yamaguchi Y, Shimizu H. Self-organized control of bipedal locomotion by
neural oscillators in unpredictable environment. Biol Cybern 1991;65(3):147-59. 81. Abbas JJ, Chizeck HJ. Neural network control of functional neuromuscular stimulation
systems: computer simulation studies. IEEE Trans Biomed Eng 1995;42(11):1117-27. 82. Baker G, Gollub J. Chaotic Dynamics. 1996: Cambridge University Press, New York. 83. Allgood K, Sauer T, Yorke J. Chaos: An Introduction to Dynamical Systems. 1997.
Springer; New York.

153
84. Li TY, Yorke JA. Period three implies chaos. Am Math Mon 1975;82:985. 85. Dingwell JB, Cusumano JP, Sternad D, Cavanagh PR. Slower speeds in patients with
diabetic neuropathy lead to improved local dynamic stability of continuous overground walking. J Biomech 2000;33(10):1269-77.
86. Newell K, Corcos D. Variability and Motor Control. 1993. Human Kinetics; Champaign,
Illinois. 87. Thelen E, Smith L. A Dynamic Systems Approach to the Development of Cognition and
Action. 1994. MIT Press; Cambridge, Maschuesttes. 359. 88. Riccio G. Information in movement variability about the qualitative dynamics of posture
and orientation. In: Variability and Motor Control. 1993. Editors: Newell K, Corcos D. Human Kinetics; Champaign, Illinois. 317.
89. Shinbrot T, Ott E, Grebogi C, Yorke JA. Using chaos to direct trajectories to targets.
Phys Rev Lett 1990;65(26):3215-18. 90. Latash M. There is no motor redundancy in human movements. There is motor
abundance. Motor Control 2000;4(3):259-60. 91. Grabiner PC, Biswas ST, Grabiner MD. Age-related changes in spatial and temporal gait
variables. Arch Phys Med Rehabil 2001;82(1):31-5. 92. Sekiya N, Nagasaki H, Ito H, Furuna T. Optimal walking in terms of variability in step
length. J Orthop Sports Phys Ther 1997;26(5):266-72. 93. Masani K, Kouzaki M, Fukunaga T. Variability of ground reaction forces during
treadmill walking. J Appl Physiol 2002;92(5):1885-90. 94. Winter DA, Crago PE. Biomechanics and Neural Control of Posture and Movement.
2001. 2nd Edition. Editor: Winter JM, Crago PE. Spriger. 95. Owings TM, Grabiner MD. Variability of step kinematics in young and older adults. Gait
Posture 2004;20(1):26-9. 96. Maki B. Gait changes in older adults: predictors of falls or indicators of fear. J Am
Geriatr Soc 1997;45(11):1406. 97. Kesler A, Leibovich G, Herman T, Gruendlinger L, Giladi N, Hausdorff JM. Shedding
light on walking in the dark: the effects of reduced lighting on the gait of older adults with a higher-level gait disorder and controls. J Neuroengineering Rehabil 2005;2:27.
98. Brach JS, Berthold R, Craik R, VanSwearingen JM, Newman AB. Gait variability in
community-dwelling older adults. J Am Geriatr Soc 2001;49(12):1646-50.

154
99. Hausdorff JM, Purdon PL, Peng CK, Ladin Z, Wei JY, Goldberger AL. Fractal dynamics of human gait: stability of long-range correlations in stride interval fluctuations. J Appl Physiol 1996;80(5):1448-57.
100. Goldberger AL, Amaral LA, Hausdorff JM, Ivanov P, Peng CK, Stanley HE. Fractal
dynamics in physiology: alterations with disease and aging. Proc Natl Acad Sci U S A 2002;99(Suppl 1):2466-72.
101. Hausdorff JM, Rios DA, Edelberg HK. Gait variability and fall risk in community-living
older adults: a 1-year prospective study. Arch Phys Med Rehabil 2001;82(8):1050-6. 102. Moe-Nilssen R, Aaslund MK, Helbostad JL. Reproducibility of variability. Proceedings
in: International Conference for Gait and Posture Research. 2007. Burlington, Vermont. 103. Hausdorff JM, Edelberg HK, Mitchell SL, Goldberger AL, Wei JY. Increased gait
unsteadiness in community-dwelling elderly fallers. Arch Phys Med Rehabil 1997;78(3):278-83.
104. Brach JS, Berlin JE, VanSwearingen JM, Newman AB, Studenski SA. Too much or too
little step width variability is associated with a fall history in older persons who walk at or near normal gait speed. J Neuroeng Rehabil 2005;2:21.
105. Herman T, Giladi N, Gurevich T, Hausdorff JM. Gait instability and fractal dynamics of
older adults with a "cautious" gait: why do certain older adults walk fearfully? Gait Posture 2005;21(2):178-85.
106. Hausdorff JM, Cudkowicz ME, Firtion R, Wei JY, Goldberger AL. Gait variability and
basal ganglia disorders: stride-to-stride variations of gait cycle timing in Parkinson's disease and Huntington's disease. Mov Disord 1998;13(3):428-37.
107. Schaafsma JD, Giladi N, Balash Y, Bartels AL, Gurevich T, Hausdorff JM. Gait
dynamics in Parkinson's disease: relationship to Parkinsonian features, falls and response to levodopa. J Neurol Sci 2003;212(1-2):47-53.
108. Gabell A, Nayak US. The effect of age on variability in gait. J Gerontol 1984;39(6):662-
6. 109. Hausdorff JM, Doniger GM, Springer S, Yogev G, Simon ES, Giladi N. A common
cognitive profile in elderly fallers and in patients with Parkinson's disease: the prominence of impaired executive function and attention. Exp Aging Res 2006;32(4):411-29.
110. Brach JS, Studenski S, Perera S, Vanswearingen JM, Newman AB. Stance time and step
width variability have unique contributing impairments in older persons. Gait Posture 2008;27(3):431-9.

155
111. Webster KE, Merory JR, Wittwer JE. Gait variability in community dwelling adults with Alzheimer disease. Alzheimer Dis Assoc Disord 2006;20(1):37-40.
112. Owings TM, Grabiner MD. Step width variability, but not step length variability or step
time variability, discriminates gait of healthy young and older adults during treadmill locomotion. J Biomech 2004;37(6):935-8.
113. Charlett A, Weller C, Purkiss AG, Dobbs SM, Dobbs RJ. Breadth of base whilst walking:
effect of ageing and parkinsonism. Age Ageing 1998;27(1):49-54. 114. Bauby CE, Kuo AD. Active control of lateral balance in human walking. J Biomech
2000;33(11):1433-40. 115. Ayyappa E. Normal human locomotion, Part 1:Basic concepts and terminology. J
Prosthet Orthot 1997;9:10 -17. 116. Townsend MA. Dynamics and coordination of torso motions in human locomotion. J
Biomech 1981;14(11):727-38. 117. Townsend MA. Biped gait stabilization via foot placement. J Biomech 1985;18(1):21-38. 118. Redfern MS, Schumann T. A model of foot placement during gait. J Biomech
1994;27(11):1339-46. 119. Zijlstra W, Hof AL. Displacement of the pelvis during human walking: experimental data
and model predictions. Gait Posture 1997;6:249-62. 120. Drew T, Prentice S, Schepens B. Cortical and brainstem control of locomotion. In: Brain
Mechanisms for the Integration of Posture and Movement. 2004. Editors: Mori S, Stuart DG,Wiesendanger M. Elsevier; Amsterdam. 251-61.
121. Beloozerova IN, Sirota MG. The role of the motor cortex in the control of vigour of
locomotor movements in the cat. J Physiol 1993;461:27-46. 122. Patla AE, Prentice SD. The role of active forces and intersegmental dynamics in the
control of limb trajectory over obstacles during locomotion in humans. Exp Brain Res 1995;106(3):499-504.
123. Patla AE, Rietdyk S, Martin C, Prentice S. Locomotor Patterns of the Leading and the
Trailing Limbs as Solid and Fragile Obstacles Are Stepped Over: Some Insights Into the Role of Vision During Locomotion. J Mot Behav 1996;28(1):35-47.
124. Bizzi E, Tresch MC, Saltiel P, d'Avella A. New perspectives on spinal motor systems.
Nat Rev Neurosci 2000;1(2):101-8.

156
125. Pearson KG, Collins DF. Reversal of the influence of group Ib afferents from plantaris on activity in medial gastrocnemius muscle during locomotor activity. Journal of Neurophysiology 1993;70(3):1009-17.
126. Rossignol S. Neural control of stereotypic limb movements. In: Handbook of Physiology,
Section 12. Exercise: Regulation and Integration of Multiple Systems. 1996. Editor: Sheperd J. American Physiological Society. 173-216.
127. Hurmuzlu Y, Basdogan C, Carollo JJ. Presenting joint kinematics of human locomotion
using phase plane portraits and Poincare maps. J Biomech 1994;27(12):1495-9. 128. Winter DA. Foot trajectory in human gait: a precise and multifactorial motor control task.
Phys Ther 1992;72(1):45-53. 129. Lacquaniti F. Central representations of human limb movement as revealed by studies of
drawing and handwriting. Trends Neurosci 1989;12(8):287-91. 130. Hebb O. Organization of Behavior. 1949: Wiley; New York. 131. Winter DA, Patla AE, Frank JS, Walt SE. Biomechanical walking pattern changes in the
fit and healthy elderly. Phys Ther 1990;70(6):340-7. 132. Patla AE. Strategies for dynamic stability during adaptive human locomotion. IEEE Eng
Med Biol Mag 2003;22(2):48-52. 133. Woollacott MH, Tang PF. Balance control during walking in the older adult: research and
its implications. Phys Ther 1997;77(6):646-60. 134. MacKinnon CD, Winter DA. Control of whole body balance in the frontal plane during
human walking. J Biomech 1993;26(6):633-44. 135. Pai YC, Patton J. Center of mass velocity-position predictions for balance control. J
Biomech 1997;30(4):347-54. 136. Patton JL, Pai Y, Lee WA. Evaluation of a model that determines the stability limits of
dynamic balance. Gait Posture 1999;9(1):38-49. 137. Hof AL, van Bockel RM, Schoppen T, Postema K. Control of lateral balance in walking.
Experimental findings in normal subjects and above-knee amputees. Gait Posture 2007;25(2):250-8.
138. Zajac FE, Neptune RR, Kautz SA. Biomechanics and muscle coordination of human
walking. Part I: Introduction to concepts, power transfer, dynamics and simulations. Gait and Posture 2002;16:215-32.

157
139. Nene A, Mayagoitia R, Veltink P. Assessment of rectus femoris function during initial swing phase. Gait Posture 1999;9(1):1-9.
140. Mochon S, McMahon TA. Ballistic walking. J Biomech 1980;13(1):49-57. 141. McGeer T. Passive dynamic walking. The International Journal of Robotics Research
1990;9:62-82. 142. Basmajian JV. Electromyographic investigation of spasticity and muscle spasm.
Physiotherapy 1976;62(10):319-23. 143. Crowninshield RD, Brand RA. A physiologically based criterion of muscle force
prediction in locomotion. J Biomech 1981;14(11):793-801. 144. DeVita P. The selection of a standard convention for analyzing gait data based on the
analysis of relevant biomechanical factors. J Biomech 1994;27(4):501-8. 145. Piazza SJ, Delp SL. The influence of muscles on knee flexion during the swing phase of
gait. Journal of Biomechanics 1996;29(6):723-33. 146. Whittlesey SN, van Emmerik RE, Hamill J. The swing phase of human walking is not a
passive movement. Motor Control 2000;4(3):273-92. 147. Selles RW, Bussmann JB, Wagenaar RC, Stam HJ. Comparing predictive validity of four
ballistic swing phase models of human walking. J Biomech 2001;34(9):1171-7. 148. Neptune RR, Kautz SA, Zajac FE. Contributions of the individual ankle plantar flexors to
support, forward progression and swing initiation during walking. J Biomech 2001;34(11):1387-98.
149. Meinders M, Gitter A, Czerniecki JM. The role of ankle plantar flexor muscle work
during walking. Scand J Rehabil Med 1998;30(1):39-46. 150. Nakamura M, Mori M, Nishii J. Trajectory planning for a leg swing during human
walking. In: 2004 IEEE International Conference on Systems, Man and Cybernetics. 2004. 784.
151. Dietz V. Do human bipeds use quadrupedal coordination? Trends Neurosci
2002;25(9):462-7. 152. Kuan TS, Tsou JY, Su FC. Hemiplegic gait of stroke patients: the effect of using a cane.
Arch Phys Med Rehabil 1999;80(7):777-84. 153. Dodd KJ, Morris ME. Lateral pelvic displacement during gait: abnormalities after stroke
and changes during the first month of rehabilitation. Arch Phys Med Rehabil 2003;84(8):1200-5.

158
154. De Bujanda E, Nadeau S, Bourbonnais D, Dickstein R. Associations between lower limb impairments, locomotor capacities and kinematic variables in the frontal plane during walking in adults with chronic stroke. J Rehabil Med 2003;35(6):259-64.
155. Gage JR. Surgical treatment of knee dysfunction in cerebral palsy. Clin Orthop Relat Res
1990;253:45-54. 156. Lehmann JF, Condon SM, Price R, deLateur BJ. Gait abnormalities in hemiplegia: their
correction by ankle-foot orthoses. Arch Phys Med Rehabil 1987;68(11):763-71. 157. Kerrigan DC, Karvosky ME, Riley PO. Spastic paretic stiff-legged gait: joint kinetics.
Am J Phys Med Rehabil 2001;80(4):244-9. 158. Teixeira-Salmela LF, Nadeau S, McBride I, Olney SJ. Effects of muscle strengthening
and physical conditioning training on temporal, kinematic and kinetic variables during gait in chronic stroke survivors. J Rehabil Med 2001;33(2):53-60.
159. Olney SJ, Griffin MP, Monga TN, McBride ID. Work and power in gait of stroke
patients. Arch Phys Med Rehabil 1991;72(5):309-14. 160. Mulroy S, Gronley J, Weiss W, Newsam C, Perry J. Use of cluster analysis for gait
pattern classification of patients in the early and late recovery phases following stroke. Gait Posture 2003;18(1):114-25.
161. Winter DA. Chapter 4: Kinetics. In: The Biomechanics and Motor Control of Human
Gait: Normal, Elderly and Pathological. 1991. Editor: Winter DA. Waterloo Biomechanics. 47.
162. Nadeau S, Gravel D, Arsenault AB, Bourbonnais D. Plantarflexor weakness as a limiting
factor of gait speed in stroke subjects and the compensating role of hip flexors. Clin Biomech 1999;14(2):125-35.
163. Olney SJ, Griffin MP, McBride ID. Temporal, kinematic, and kinetic variables related to
gait speed in subjects with hemiplegia: a regression approach. Phys Ther 1994;74(9):872-85.
164. Mena D, Mansour JM, Simon SR. Analysis and synthesis of human swing leg motion
during gait and its clinical applications. J Biomech 1981;14(12):823-32. 165. Shemmell J, Johansson J, Portra V, Gottlieb GL, Thomas JS, Corcos DM. Control of
interjoint coordination during the swing phase of normal gait at different speeds. J Neuroengineering Rehabil 2007;4:10.
166. Riley PO, Kerrigan DC. Torque action of two-joint muscles in the swing period of stiff-
legged gait: a forward dynamic model analysis. J Biomech 1998;31(9):835-40.

159
167. Zajac FE, Neptune RR, Kautz SA. Biomechanics and muscle coordination of human walking. Part II: Lessons from dynamical simulations and clinical implications. Gait Posture 2003;17(1):1-17.
168. Zajac F, Gordon M. Determining muscle's force and action in multi-articular movement.
Exerc Sport Sci Rev 1989;17:187-230. 169. Hill AV. The mechanics of active muscle. Proc R Soc Lond B Biol Sci 1953;141:104 -17. 170. Winter DA. Biomechanics and Motor Control of Human Movement. 1990. Wiley-
Interscience; New York. 171. Andersson EA, Nilsson J, Thorstensson A. Intramuscular EMG from the hip flexor
muscles during human locomotion. Acta Physiologica Scandinavica 1997;161:361-70. 172. Gottschall JS, Kram R. Energy cost and muscular activity required for propulsion during
walking. J Appl Physiol 2003;94(5):1766-72. 173. Goldberg SR, Ounpuu S, Delp SL. The importance of swing-phase initial conditions in
stiff-knee gait. J Biomech 2003;36(8):1111-6. 174. Den Otter AR, Geurts AC, Mulder T, Duysens J. Abnormalities in the temporal
patterning of lower extremity muscle activity in hemiparetic gait. Gait Posture 2007;25(3):342-52.
175. Turnbull GI, Charteris J, Wall JC. A comparison of the range of walking speeds between
normal and hemiplegic subjects. Scand J Rehabil Med 1995;27(3):175-82. 176. Titianova EB, Tarkka IM. Asymmetry in walking performance and postural sway in
patients with chronic unilateral cerebral infarction. J Rehabil Res Dev 1995;32(3):236-44. 177. Worthen LC, Kim CM, Kautz SA, Lew HL, Kiratli BJ, Beaupre GS. Key characteristics
of walking correlate with bone density in individuals with chronic stroke. J Rehabil Res Dev 2005;42(6):761-8.
178. Brunnstrom S. Movement Therapy in Hemiplegia: A Neurophysiological Approach.
1970. Hagerstown: Harper and Row. 179. Bilney B, Morris M, Webster K. Concurrent related validity of the GAITRite walkway
system for quantification of the spatial and temporal parameters of gait. Gait Posture 2003;17(1):68-74.
180. Perry J, Garrett M, Gronley JK, Mulroy SJ. Classification of walking handicap in the
stroke population. Stroke 1995;26(6):982-89.

160
181. Studenski S, Perera S, Wallace D, Chandler JM, Duncan PW, Rooney E, Fox M, Guralnik JM. Physical performance measures in the clinical setting. J Am Geriatr Soc 2003;51(3):314-22.
182. Varraine E, Bonnard M, Pailhous J. Intentional on-line adaptation of stride length in
human walking. Exp Brain Res 2000;130(2):248-57. 183. Anderson FC, Goldberg SR, Pandy MG, Delp SL. Contributions of muscle forces and
toe-off kinematics to peak knee flexion during the swing phase of normal gait: an induced position analysis. J Biomech 2004;37(5):731-7.
184. Zajac FE, Neptune RR, Kautz SA. Biomechanics and muscle coordination of human
walking. Part II: Lessons from dynamical simulations and clinical applications. Gait and Posture 2003;17:1-17.
185. Duncan PW, Propst M, Nelson SG. Reliability of the Fugl-Meyer assessment of
sensorimotor recovery following cerebrovascular accident. Phys Ther 1983;63(10):1606-10.
186. Kautz SA, Brown DA. Relationships between timing of muscle excitation and impaired
motor performance during cyclical lower extremity movement in post-stroke hemiplegia. Brain 1998;121(Pt 3):515-26.
187. Jonsdottir J, Cattaneo D. Reliability and validity of the dynamic gait index in persons
with chronic stroke. Arch Phys Med Rehabil 2007;88(11):1410-5. 188. Shumway-Cook A, Baldwin M, Polissar NL, Gruber W. Predicting the probability for
falls in community-dwelling older adults. Phys Ther 1997;77(8):812-9. 189. Maki BE. Gait changes in older adults: predictors of falls or indicators of fear. J Am
Geriatr Soc 1997;45(3):313-20. 190. Niechwiej-Szwedoa E, Innessa E, Howeb J, Jaglala S, McIlroya W, Verrier M. Changes
in gait variability during different challenges to mobility in patients with traumatic brain injury. Gait Posture 2007;25(1):70-77.
191. Rosano C, Brach J, Studenski S, Longstreth WT, Jr., Newman AB. Gait variability is
associated with subclinical brain vascular abnormalities in high-functioning older adults. Neuroepidemiology 2007;29(3-4):193-200.
192. Katz-Leurer M, Rotem H, Lewitus H, Keren O, Meyer S. Relationship between balance
abilities and gait characteristics in children with post-traumatic brain injury. Brain Inj 2008;22(2):153-9.

161
193. Brach JS, Studenski SA, Perera S, VanSwearingen JM, Newman AB. Gait variability and the risk of incident mobility disability in community-dwelling older adults. J Gerontol A Biol Sci Med Sci 2007;62(9):983-8.
194. Balasubramanian CK, Bowden MG, Neptune RR, Kautz SA. Relationship between step
length asymmetry and walking performance in subjects with chronic hemiparesis. Arch Phys Med Rehabil 2007;88(1):43-9.
195. Frenkel-Toledo S, Giladi N, Peretz C, Herman T, Gruendlinger L, Hausdorff JM. Effect
of gait speed on gait rhythmicity in Parkinson's disease: variability of stride time and swing time respond differently. J Neuroeng Rehabil 2005;2:23.
196. Crenshaw SJ, Royer TD, Richards JG, Hudson DJ. Gait variability in people with
multiple sclerosis. Mult Scler 2006;12(5):613-9. 197. Danion F, Varraine E, Bonnard M, Pailhous J. Stride variability in human gait: the effect
of stride frequency and stride length. Gait Posture 2003;18(1):69-77. 198. Chen G, Patten C, Kothari DH, Zajac FE. Gait deviations associated with post-stroke
hemiparesis: improvement during treadmill walking using weight support, speed, support stiffness, and handrail hold. Gait Posture 2005;22(1):57-62.
199. Tyson SF. Trunk kinematics in hemiplegic gait and the effect of walking aids. Clin
Rehabil 1999;13(4):295-300. 200. de Leva P. Adjustments to Zatsiorsky-Seluyanov's segment inertia parameters. J Biomech
1996;29(9):1223-30. 201. Hof AL, Gazendam MG, Sinke WE. The condition for dynamic stability. J Biomech
2005;38(1):1-8. 202. Moraes R, Allard F, Patla AE. Validating determinants for an alternate foot placement
selection algorithm during human locomotion in cluttered terrain. J Neurophysiol 2007;98(4):1928-40.
203. Mochon S, McMahon TA. Ballistic walking: an improved model. Mathematical
Biosciences 1980;52:241-60. 204. Chen G, Patten C. Joint moment work during the stance-to-swing transition in
hemiparetic subjects. J Biomech 2008;41(4):877-83. 205. Neptune RR, Zajac FE, Kautz SA. Muscle force redistributes segmental power for body
progression during walking. Gait Posture 2003;19(2):194-205. 206. Portney LG, Watkins MP. Foundations of Clinical Research: Applications to Practice.
1995. 2nd Edition.Prentice-Hall.

162
207. Lamontagne A, Malouin F, Richards CL, Dumas F. Mechanisms of disturbed motor control in ankle weakness during gait after stroke. Gait Posture 2002;15(3):244-55.
208. Hesse SAJ, M.T., Schreiner, C; Mauritz, K-H. Gait symmetry and functional walking
performance in hemiparetic patients prior to and after a 4-week rehabilittaion program. Gait & Posture 1993;1:166-71.
209. Dewar ME, Judge G. Temporal asymmetry as a gait quality indicator. Med Biol Eng
Comput 1980;18(5):689-93.

163
BIOGRAPHICAL SKETCH
Chitra Lakshmi K.Balasubramanian received her Bachelor in Physical Therapy from
College of Allied Health Sciences, Manipal Academy of Higher Education, Karnataka, India.
She worked for one year imparting physical therapy to adults and children with disabilities in
New Delhi, India.
Her strong interest in an interdisciplinary approach to rehabilitation encouraged her to
pursue the Rehabilitation Science Doctoral program at University of Florida. She was funded by
the Alumni fellowship for four years of her graduate education and from an National Institutes of
Health research grant for the final eight months of her doctoral education. Her research
employed biomechanical measures to understand asymmetrical nature of walking in persons who
have had a stroke and she was guided under the expert tutelage of Dr. Steve Kautz.
In the near future, Chitra plans to use her doctoral education to actively pursue teaching
and research in neurologically impaired populations. She is specifically interested in developing
a scientific framework that will aid in designing efficient rehabilitation strategies to improve
walking function. In the long-term, she plans to return to India and aims to establish a strong
foundation for rehabilitation education and related research and facilitate development of a
common academic structure in rehabilitation.