Embed Size (px)
Citation preview

THE INFLUENCE OF NATURAL AGRICULTURAL LABORATORY SETTINGS ON STRESS AND ATTENTION LEVELS OF HIGH SCHOOL STUDENTS
By
ANNA J. WARNER
A DISSERTATION PRESENTED TO THE GRADUATE SCHOOL OF THE UNIVERSITY OF FLORIDA IN PARTIAL FULFILLMENT
OF THE REQUIREMENTS FOR THE DEGREE OF DOCTOR OF PHILOSOPHY
UNIVERSITY OF FLORIDA
2018

© 2018 Anna J. Warner

To my students, past, present, and future, who continue to inspire me

4
ACKNOWLEDGMENTS
Without the support and direction of numerous individuals, this dissertation and
the completion of my doctoral program would not have been possible or enjoyable. I
thank God for having a plan for me that is greater than I could ever imagine for myself.
When I faced the decision to leave my career and return to graduate school He
challenged me to step out of the boat and trust in him. That step of faith has been life
changing. Without the gifts he has blessed me with and the loving supportive people He
has surrounded me with, none of this would be possible.
I would like to thank my family for their continued love and support in everything I
do. No matter how far away, I can always count on them to encourage me and root for
me. Allen Warner, my father, has instilled in me the love and pride of hard work. He has
truly led by example. I value each piece of wisdom, perspective, and advice of my
mother Kate has offered throughout this process. My sister Katie Rae is my number one
cheerleader. Being her older sister and knowing she looks up to me has always been
my motivation to do the best I could in everything I do. She is also my direct line to what
practicing agriscience teachers are facing each day. Although my grandparents were
not around to go on this journey with me, the lessons I have learned from Bill and
Wanda Warner continue to guide each step I take. My dog Mia has been my emotional
support dog, even if unofficially, and an awesome travel companion.
I have also been blessed with a family away from home - my Florida Family who
has supplied endless hugs support, and distractions. Thank you Jennifer, Jazmyne,
Stephanie, Ken, Joseph, Peter, Daniel, and Sarah for always making me feel loved and
put a smile on my face.

5
Dr. Stacy A. Gartin, my undergraduate advisor at West Virginia University, was
the first person to see me as a professor. I am thankful for his vision and his continued
support of my education and experiences within the field of agricultural education. He
has taught me so many valuable lessons, which will continue to inform my practice.
Without the phone call from Dr. Brian Myers and his encouragement, I would still
be teaching. As my advisor and committee chair, he has guided me, challenged my
thinking, and given me room and opportunities to grow. I appreciate him allowing me the
space and time to struggle through the challenges, so I could build my skills and
confidence as a researcher.
I would also like to thank my committee members for shaping my graduate
school experience and research in their own unique ways. Dr. Ed Osborne has a
supportive way of asking questions and pushing deeper thinking. Dr. Andrew Thoron
always had an open door and was willing to discuss whatever issue or idea I was
struggling to work through on my own. Dr. Heidi Radunovich added valuable expertise
in the field of stress and youth. I also appreciate her input and advice as a female
faculty member and mentor. In addition to my committee, Dr. Glen Israel and Mr. James
Colee provided me guidance with the analysis of my data.
Additionally, I would like to thank the rest of the faculty and staff in the
department sharing their knowledge and advice through my time in the department. My
cohort has been a source of encouragement, support, comic relief, and valued
friendship. I could always count on Taylor Ruth, Sarah LaRose, and Blake Colclasure to
understand when the struggle was real. My fellow graduate students have offered
unique perspectives and built long-lasting memories. Renee Wilson, Kimbrell Hines,

6
and Jessica Jacob have become dear friends and were vital to my well-being through
this process. Thank you, girls! I do not know how I would have finished without you, our
workouts, meals, and girl time. My Destiny Church family and Deborah’s Daughters
group have supported my spiritual growth and development during this experience. I am
truly thankful to everyone who has offered me support, direction, and encouragement
throughout this amazing journey! You have all been a blessing to me.

7
TABLE OF CONTENTS page
ACKNOWLEDGMENTS .................................................................................................. 4
LIST OF TABLES .......................................................................................................... 10
LIST OF FIGURES ........................................................................................................ 11
LIST OF ABBREVIATIONS ........................................................................................... 12
ABSTRACT ................................................................................................................... 13
CHAPTER
1 INTRODUCTION .................................................................................................... 15
Prevalence of Stress ............................................................................................... 15
Impacts of Stress on Students ................................................................................ 16 Attention .................................................................................................................. 18 Role of Nature on Well-being .................................................................................. 19
Research Problem .................................................................................................. 21 Purpose and Objectives .......................................................................................... 21
Significance of Study .............................................................................................. 22 Definition of Terms .................................................................................................. 23
Limitations ............................................................................................................... 25 Assumptions ........................................................................................................... 26
Chapter Summary ................................................................................................... 26
2 LITERATURE REVIEW .......................................................................................... 28
Theoretical Framework ........................................................................................... 28
Stress Reduction Theory .................................................................................. 29 Attention Restoration Theory ............................................................................ 30
Directed attention ....................................................................................... 31
Directed attention fatigue ........................................................................... 31 Characteristics of restorative environments ............................................... 31
Interaction of Stress and Attention ................................................................... 35 Conceptual Model ................................................................................................... 37 Previous Research ................................................................................................. 37
Restorative Learning Environments ................................................................. 38 Agricultural laboratories ............................................................................. 38
Nature as a Restorative Environment ........................................................ 41 Restorative Effects ........................................................................................... 44
Affective stress recovery ............................................................................ 44 Cognitive attention restoration ................................................................... 48 Physical recovery ....................................................................................... 51

8
Buffering effect ........................................................................................... 52
Chapter Summary ................................................................................................... 53
3 METHODS .............................................................................................................. 55
Objectives and Hypotheses .................................................................................... 55 Research Design .................................................................................................... 56 Population and Sample ........................................................................................... 58 Instrumentation ....................................................................................................... 62
Perceived Stress Scale (PSS) .......................................................................... 63 Necker Cube Pattern Control Test ................................................................... 66 Content Knowledge Tests ................................................................................ 68
Procedures and Data Collection ............................................................................. 68
Development of Instructional Materials and Training ........................................ 68 Instruction ......................................................................................................... 70
Data Analysis .......................................................................................................... 70
Objective 1 ....................................................................................................... 71 Objective 2 ....................................................................................................... 71
Objective 3 ....................................................................................................... 74 Objective 4 ....................................................................................................... 77 Objective 5 ....................................................................................................... 80
Chapter Summary ................................................................................................... 82
4 RESULTS ............................................................................................................... 87
Overview ................................................................................................................. 87 Participation Rate, Limitations, and Reliability ........................................................ 88
Results by Objective ............................................................................................... 89 Objective 1 ....................................................................................................... 89
Objective 2 ....................................................................................................... 91 Objective 3 ....................................................................................................... 94 Objective 4 ....................................................................................................... 95
Objective 5 ....................................................................................................... 96 Summary ................................................................................................................ 98
5 CONCLUSIONS AND RECOMMENDATIONS ..................................................... 106
Overview ............................................................................................................... 106
Purpose, Objectives, and Hypotheses ........................................................... 106
Methods.......................................................................................................... 107 Summary of Findings ............................................................................................ 107 Conclusions, Discussion, & Implications ............................................................... 109
Objective 1 ..................................................................................................... 109 Objective 2 ..................................................................................................... 110
Objective 3 ..................................................................................................... 116 Objective 4 ..................................................................................................... 120 Objective 5 ..................................................................................................... 122

9
Recommendations ................................................................................................ 124
Practitioner Recommendations ...................................................................... 124
Researcher Recommendations ...................................................................... 126
APPENDIX
A TEACHER PROPOSAL EMAIL ............................................................................ 128
B SEMI-HARDWOOD LESSON PLAN .................................................................... 130
C PLANT NUTRIENTS & DEFFICIENCIES LESSON PLAN ................................... 140
D INSTRUMENTATION INSTRUCTIONS ................................................................ 146
E NECKER CUBE PATTERN CONTROL TEST ...................................................... 148
F DEMOGRAPHIC INFORMATION ......................................................................... 151
G INFORMED STUDENT ASSENT ......................................................................... 152
H INFORMED PARENT CONTSENT ...................................................................... 154
LIST OF REFERENCES ............................................................................................. 156
BIOGRAPHICAL SKETCH .......................................................................................... 164

10
LIST OF TABLES
Table page 3-1 Counterbalanced, Randomized Subjects, Pretest-Posttest Control Group
Design ................................................................................................................ 83
3-2 Gender and race of students by school for 2015-2016 school year .................... 83
3-3 Variance and reliability findings of 3 versions of PSS ......................................... 84
3-4 Norm table for the PSS 10 from L. Harris Poll gathered information on 2, 387 respondents in the U.S. ...................................................................................... 84
3-5 Cronbach’s alpha scores for Perceived Stress Scale ......................................... 84
3-6 PSS test-retest reliability using Pearson’s Correlation ........................................ 84
3-7 Instruction and data collection schedule ............................................................. 85
3-8 Necker Cube mean scores, standard deviations, three standard deviations, and acceptable range values .............................................................................. 85
3-9 Necker Cube, extreme values removed ............................................................. 85
4-1 Demographic characteristics of participants ....................................................... 99
4-2 Mean Day 1 Pretest PSS scores of agriscience students based on demographic data ............................................................................................. 101
4-3 Percentage of students who showed no change, a decrease, or an increase in stress by treatment ....................................................................................... 102
4-4 Percentage of students who showed no change, a decrease, or an increase in attention by treatment ................................................................................... 102

11
LIST OF FIGURES
Figure page 2-1 Conceptual Model for the Study of Restorative Learning Environments on
Academic Performance (Adapted from Kaplan, 1995) ....................................... 54
3-1 Necker Cube with possible orientations .............................................................. 86
4-1 GLM profile plot of PSS difference scores by time and treatment order ........... 103
4-2 GLM profile plot for the estimated marginal means of attention difference scores by day and treatment order ................................................................... 104
4-3 GLM profile plot for the estimated marginal means of content knowledge scores by day and treatment order ................................................................... 105

12
LIST OF ABBREVIATIONS
ANOVA Analysis of variance
DAF Directed Attention Fatigue
PSS Perceived Stress Scale

13
Abstract of Dissertation Presented to the Graduate School of the University of Florida in Partial Fulfillment of the Requirements for the Degree of Doctor of Philosophy
THE INFLUENCE OF NATURAL AGRICULTURAL LABORATORY SETTINGS ON
STRESS AND ATTENTION LEVELS OF HIGH SCHOOL STUDENTS
By
Anna J. Warner
May 2018
Chair: Brian E. Myers Major: Agricultural Education and Communication
As stress levels among students increase, students ill-equipped to manage
stress suffer from decreased physical, emotional, and mental health, limiting their ability
to perform at their highest capacity. Furthermore, students experience directed attention
fatigue, hindering their efforts at school, home, and work. The purpose of this study was
to determine the influence of natural agricultural laboratory settings on stress and
attention levels of high school students.
The Stress Reduction Theory and Attention Restoration Theory provided the
theoretical base for this study and the conceptual framework of restorative learning
environments. This study was completed with students enrolled in secondary
horticulture programs at two high schools in the state of Florida. It used a quasi-
experimental, counterbalanced, randomized subjects, pretest-posttest, control group
design to investigate the objectives of the study. The perceived Stress Scale-10 (PSS)
and the Necker Cube Pattern Control Test were utilized to collect data. Descriptive
statistics, T-tests, and general linear mixed models were used to analyze the data
collected.

14
The demographic data identified areas in which the agriscience student
population was not reflective of the overall school population. Agriscience students in
this study were found to have stress levels equivalent to students in the control group.
Generally the stress of the agriscience students was higher than the PSS norms, but
followed similar trends. Significant differences were found in the stress levels between
males and females and between 9th grade students and 10th and 11th grade students.
Stress decreased as time outside increased. A significant change in stress did not exist
among those student taught in a natural agricultural laboratory setting and an
agriscience classroom, while a significant change did exist in attention. A higher
percentage of students taught in the natural agricultural laboratory saw no change or an
increase in attention, while a higher percentage of students taught in the agriscience
classroom saw a decrease in attention. A significant difference in content knowledge
scores did not exist between the learning environments.
Practitioners should utilize natural agricultural laboratory environments for
instruction to contribute to the restoration of student attention. Researchers should
continue to pursue this line of inquiry.

15
CHAPTER 1 INTRODUCTION
Chapter 1 will describe the prevalence of stress in America and the impacts of
that stress on students. Additionally, the chapter will differentiate directed attention from
fascination and highlight the draws on student attention, which can lead to directed
attention fatigue. Finally, Chapter 1 will discuss the physical and psychological benefits
of nature on well-being.
Prevalence of Stress
Overall stress levels in the United States (US) have been increasing, and the
millennial generation has reported higher than average stress levels (American
Psychological Association [APA], 2015). States have reported many students
experiencing high levels of stress (Unni, 2016), and these teenagers have been
suffering from unhealthy levels of stress (APA, 2014). Nationally, over 80% of teens
across the US have reported moderate to extreme levels of stress in the past year, with
over a quarter of students having reported experiencing extreme stress (Jayson, 2014).
Students have reported experiencing even higher levels of stress than the average adult
during the school year (APA, 2014). Specifically, teen girls have reported higher levels
of stress and more stress symptoms than teen boys, which aligns with gender trends in
adults.
Chronic stress has been an issue growing among many subgroups of high
school youth (Leonard, Gwadz, Ritchie, Linick, Cleland, Elliott, & Gretherl, 2015). Over
one-third of students in California and Colorado have reported feeling chronic sadness
or hopeless feelings (Austin, Polik, Hanson, & Zheng, 2016; Colorado Department of
Public Health and Environment [COPHE], 2015). Over a third of students have reported

16
an increase in stress levels over the past year, and even more expect their stress level
to increase over the next year (APA, 2014).
Student stress has stemmed from friends, work, family, time management, and
the college admission process (Jayson, 2014). Teens most commonly identified school
as a source of stress, with 83% of students having identified school as a somewhat or
significant source of stress (APA, 2014). Almost 60% of teens surveyed also cited
difficulty in managing multiple activities as another somewhat or very significant source
of stress. Additionally, teen girls have reported social pressures, such as, appearance
as a significant stressor (APA, 2014).
Impacts of Stress on Students
While some stress known as eustress has been shown to be helpful, extreme
stressors have pushed many people to surpass levels of eustress and reach a
dangerous level of stress know as distress (Alter, 2013). Stress can lead to decreased
physical and emotional health as well as decreased lifespans (Jayson, 2014), yet
students have tended to be less aware than adults of these impacts (APA, 2014).
Teens have reported physical and emotional symptoms of stress at equivalent levels
as adults, including 40% who felt irritable or angry, 36% who were nervous or anxious,
and 36% who were tired, with girls reporting higher levels of these symptoms than boys
(APA, 2014).
Student physical health has been shown to be compromised due to stress,
leading to headaches, poor sleeping habits, indigestion, a weakened immune system,
exhaustion, inflammation, and more frequent and severe viral infections (APA, 2014).
Stress has also impacted health behaviors, such as unhealthy eating patterns, loss of
sleep, and increased sedentary activities, which can lead to chronic illness and

17
negatively influence quality of life. Emotionally, students have reported feeling irritable,
angry, nervous, anxious, sad, depressed, and overwhelmed. While anxiety is a normal
and sometimes helpful reaction to stress, 25.1% of youth ages 13-18 experience
lifetime prevalence of anxiety disorders, which are excessive and difficult to control
(National Institute of Mental Health [NIMH], 2017). Another 5.9% of youth have been
found to have a lifetime prevalence of severe anxiety disorders. In 2015, 3 million
adolescents experienced a major depressive episode, and over 8.5 million adolescents
between the ages of 12 and 17 received mental health services that year (Center for
Behavioral Health Statistics and Quality [CBHSQ], 2016). These impacts of stress have
been found to last through college and into adulthood (APA, 2014; Leonard et al., 2015;
Jayson, 2014).
Stress can impact a students’ ability to perform at their highest capacity
(Novotney, 2014), affecting their performance at home, school, and work (APA, 2014).
Stress has also been found to hinder academic success, negatively impact mental
health, and lead to engagement in risky behaviors (Leonard et al., 2015). In a 2014
study, 10% of teens cited stress as a cause for earning grades lower than their
potential (APA, 2014). Additionally, 40% of students admitted to neglecting home
responsibilities, and 21% reported avoiding school and work obligations due to stress.
A third of students confessed stress has led to procrastination. Furthermore, a quarter
of students have snapped at others, and 17% have canceled social plans despite
having recognized the importance of good relationships with friends.
Students have been unsure of effective stress management techniques and have
not been using effective coping methods to deal with their stress (APA, 2014; Jayson,

18
2014). Most teens have turned to sedentary activities, such as videogames, internet,
and movies, when stressed, regardless of the benefits associated with physical stress
management techniques (APA, 2014). Leonard et al. (2015) underscored the need to
decrease perceived stress and increase adaptive coping in the student population. The
2014 Stress in America report also highlighted the need to help students cope with
stress and recommended that schools, homes, and communities create opportunities
and tools for youth to learn how to appropriately manage their stress (APA, 2014).
Kaplan (1995) noted that stress and directed attention interact to lead to impaired
performance.
Attention
Attention has been defined as the mechanism used to select stimuli relevant to
the required behavior (Reynolds, Gottlieb, & Kastner, 2008). It has been used to
overcome the brain’s limitations to engage in multiple cognitive processes at any given
time. Attention takes two forms: fascination, which occurs naturally and does not
require effort, and directed attention, which occurs in the absence of fascination when
the body uses energy to inhibit distractions and focus on the required task (Clay, 2001;
DeYoung, 2010; Kaplan, 1995). Directed attention has been vital to everyday
productivity, efficiency, and decision making of adults and youth (Bagot, 2003;
DeYoung, 2015). Shah, Shah, & Saleem (2015) found that students’ level of attention
directly impacted their academic achievement. Specifically, school-aged children have
relied on directed attention for concentration, problem solving, planning, and responding
appropriately (Bagot, 2003).
However, since directed attention requires effort from the brain to suppress
competing stimuli, it leads to directed attention fatigue (DAF) after prolonged use

19
(DeYoung, 2010; Kaplan, 1995). Current society has created a culture requiring
prolonged attention, thus causing DAF. Symptoms of DAF include impulsivity,
distractibility and irritability (Clay, 2001).
Multitasking has been shown to divide attention (APA, 2006) and has led to
directed attention fatigue (DeYoung, 2010; Shows, Albinssons, Ruseva, & Waryold,
2016). In a literature review, Alkahtani and colleagues found evidence of an increase in
multitasking in educational environments, due the advances in communication
technologies (Alkahtani, Ahmad, Darmoul, Samman, Al-zabidi, & Matraf, 2016). These
multitasking behaviors in the classroom have been associated with decreased
academic performance. Although directed attention fatigue and stress can interact to
lead to impaired performance (Kaplan, 1995), supportive environments have been
shown to reduce the occurrence of DAF, while restorative environments help recover
directed attention (DeYoung, 2010; Kaplan, 1995).
Role of Nature on Well-being
Despite having historically evolved in natural settings (Price-Mitchell, 2014), the
world has been experiencing a major wave of urban growth, which has led to over half
of the population living in cities (Hodson, 2016) – a trend that is expected to continue.
Many American children spend less time in nature than in the past (Price-Mitchell, 2014)
and have not experienced direct interactions with nature on a daily basis (Charles &
Louv, 2009), which has led to nature deprivation (University of Minnesota, 2016). The
Nature Conservancy (2011) poll found only about 10% of American teens have spent
time outside daily. The decrease in time spent in nature has been attributed to several
factors including, decreases in discretionary time, increased concern for safety
outdoors, increases in time spent using multiple forms of media, changes in

20
relationships with nature, more sedentary lifestyles, declining access to public spaces to
play, more time spent inside, and less walking and biking to school (Charles & Louv,
2009). This decrease in time spent in nature has created a disconnect between the
natural and cognitive world (Price-Mitchell, 2014) and impacts future engagement and
conservation efforts (Natural Conservancy, 2011; Pergams & Zaradic, 2006).
Humans have gained diverse, complex, and substantial benefits from nature,
and reduced contact with nature has been shown to have negative effects on the mental
and physical health and recovery of individuals (Balmford & Bond, 2005). Nature
stimulates the production of neurotransmitters, such as serotonin, dopamine, and
oxytocin, which promote positive feelings (Rose, 2017). Moreover, green spaces have
been linked to improved mental health and lower instances of mental health problems,
such as depression and mood disorders (Gilbert, 2016). Nature provides the
psychological recuperative benefits of stress reduction and the capacity to restore
attention (Kaplan, 1995). In addition to increasing emotional well-being, nature has been
found to contribute to physical well-being by lowering heart rate, blood pressure, muscle
tension, pain discomfort, and stress hormones (University of Minnesota, 2016). Nature
has even been shown to build community among neighbors. Many studies have
documented the restorative effects of nature on attention (Kaplan, 1995; Hartig, Evans,
Jamner, Davis, & Garling, 2003; Tennessen & Cimprich, 1995), personal reactions and
mood (Sugimoto, Fujita, & Mattson, 2004), stress (Hartig et al., 2003), recovery (Ulrich,
1984), and higher order thinking (Atchley, Strayer, & Atchley, 2012).
The outcomes of this research have resulted in a trend to use natural
experiences to promote health (Williams, 2016). Some physicians have begun to

21
prescribe time in nature to patients. Additionally, policy makers have taken notice of the
growing evidence the benefits of nature and will be able to use it to design health
interventions. Some countries have begun promoting spending time in nature as a part
of their public health policies (Alter, 2015; Williams, 2016). South Korea, which has
three healing forests and offers a degree in forest healing, provides one example of the
new focus on health promoting natural experiences (Williams, 2016).
Research Problem
The problem under investigation in this study was high school students
experience chronic stress, which leads to decreased physical health, mental health, and
directed attention, negatively impacting their school work and educational achievement.
Environments with elements of nature have been shown to have restorative benefits
(Kaplan, 1995), and have the potential to address extreme stress levels (APA, 2014)
and directed attention fatigue (Alkahtani et al., 2016; Shows, et al., 2016) experienced
by students today. However, adults and youth alike have been less likely to interact with
nature (Hodson, 2016; Price-Mitchell, 2014), which has prohibited them from benefitting
from the restorative benefits of nature (Gilbert, 2016; University of Minnesota, 2016).
While many agricultural laboratory settings contain natural and restorative elements, a
gap in the literature exists about the impact of these natural agricultural laboratory
settings on the stress and directed attention of high school students.
Purpose and Objectives
The purpose of this study was to determine the influence of natural agricultural
laboratory settings on stress and attention levels of high school students. The following
objectives were used to guide this study:
1. Describe the demographic characteristics of the participants in this study;

22
2. Identify the stress levels experienced by high school agriculture students;
3. Determine if a difference in the change of student stress levels exists between students instructed in the classroom setting and those instructed in a natural agricultural laboratory setting;
4. Determine if a difference in the change of student attention capacity exists between students instructed in the classroom setting and those instructed in a natural agricultural laboratory setting; and
5. Determine if a difference in student content knowledge exists between students instructed in the classroom setting and those instructed in a natural agricultural laboratory setting.
Significance of Study
This study will have value to students, agriscience teachers, and researchers.
Maslow (1943) outlined a hierarchy of needs for motivation – physiological, safety, love,
esteem, and self-actualization. He claimed individuals must meet their most basic needs
before they can focus on achieving higher order needs. As students have continued to
face mounting levels of chronic stress (APA, 2014; Leanord et al., 2015; Jayson, 2014;
Unni, 2016), they have faced threats to their safety needs, as outlined by Maslow’s
Hierarchy of Needs. According to Maslow, cognitive capacities are devoted to meeting
the most prominent needs in an individual’s life. Thus, if students focus on achieving
their health and well-being safety needs, their cognitive capacities will be devoted to
meeting this need rather than to learning (Maslow, 1943). This current research project
explored an opportunity to reduce student stress. A reduction in stress levels has been
shown to lead to increased physical and mental health and well-being (Gilbert, 2016;
Rose, 2017; University of Minnesota, 2016), consequently allowing mental capacities to
be used in meeting higher-level needs or learning. In addition, this study examined how
the same approach could increase student attention levels. The reduction of stress and
increase in attention have been connected to positive impacts on student learning and

23
achievement, which have prolonged effects into adulthood (Kaplan, 1995; Leonard,
2015).
Chronic stress and directed attention fatigue have been barriers to learning.
Agriscience teachers and school administrators have been given the opportunity to
benefit from a way to minimize stress and directed attention fatigue through the use of
restorative environments in natural agricultural laboratory settings. Reduction of these
barriers has the potential to result in increased student achievement, directly impacting
teacher evaluations. Additionally, the findings of this study may provide additional
evidence to justify the importance of an agricultural education program in schools.
In addition to promoting this field of research and adding to the body of
knowledge of restorative environments in the school setting, this study addressed
research priorities of the National Research Agenda for Agricultural Education (Roberts,
Hareder, & Brashears, 2016). Specifically, this research addressed Research Priority 4
and 5 by investigating how programs can meet the evolving needs of students and
contribute to educational initiatives.
For policy makers concerned about overcoming the challenges associated with a
more urban community, reducing student stress, increasing student achievement, or
promoting health initiatives aimed at decreasing health inequities, this research
provided the first known data to demonstrate the role agricultural education programs
can play to meet those needs.
Definition of Terms
The following terms were defined and operationalized for the purpose of this
study:

24
Anxiety – a reaction to stress, which may turn into a disorder if it becomes excessive and difficult to control (NMHI, 2017).
Attention – the mechanism used to select stimuli relevant to the required behavior
(Reynolds, et al., 2008). Being away – the physical or conceptual removal from a normal environment and
routine (DeYoung, 2010; Kaplan, 2001). Compatibility – an alignment of environmental opportunities and an individual’s purpose
or inclinations (DeYoung, 2010; Kaplan, 2001). Chronic Stress – stress which is experienced consistently for an extended period of time
(APA, 2017). Directed attention – “the capacity to inhibit or block competing stimuli or distractions
during purposeful activity” (Tennessen & Cimprich, 1995, p. 77). For this study directed attention was measured by the Necker Cube Pattern Control test.
Directed attention fatigue – mental exhaustion occurring after prolonged mental effort
(Kaplan, 1995). Fascination – a form of attention which requires no effort to inhibit competing stimuli and
is resistant to fatigue (Kaplan, 1995). Extent – having enough magnitude and coherence for an individual to become
immersed and remain engaged” (Kaplan, 2001; Tennessen & Cimprich, 1995). Natural agricultural laboratory setting – any area in the school setting in which “students
interact with the materials to observe and understand the natural world” (Hofstein & Mamlok-Naaman, 2007, p. 105), which supports agricultural classroom instruction (Osborne, 1994), and which includes elements of nature. For this study, this term was operationalized as a school greenhouse.
Physiological stress – the response of the autonomic nervous system to a threatening
or harmful stimulus (Kaplan, 1995). Psychological stress – "focus on a cognitive appraisal of whether the individual has the
resources necessary to deal with a given challenge” (Kaplan, 1995, p. 176). Restorative experiences (also referred to as restorative environments) – “opportunities
for reducing the fatigue of directed attention” (Kaplan, 1995, p. 172). Restorative learning environment – a learning environment which encompasses all 4
restorative characteristics: being away, fascination, extent, and compatibility as

25
defined by Kaplan, 1995). In this study, the natural agricultural laboratory setting, specifically the greenhouse, was used to operationalize this term.
Stress – “a negative emotional experience accompanied by predictable biochemical,
physiological and behavioral changes” (Baum, 1990, p. 653). Student attention – will be operationalized as directed attention.
Limitations
The use of a purposive sample limits the generalizability of these results (Ary,
Jacobs, Sorensen, & Walker, 2010). Moreover, this study only assessed short-term
effects of the natural agricultural laboratory on stress and attention. Longitudinal data is
required to make any inferences on the long-term impact of restorative learning
environments on students.
Several limitations exist in the counterbalanced design (Ary et al., 2010;
Campbell & Stanley, 1963). A successful counterbalance design requires equivalence
of learning material for each replication, which is difficult to ensure (Ary et al., 2010).
Additionally, the effect of the treatment could impact future treatments resulting in a
carryover effect, which is difficult to identify.
The main threat to internal validity in the counterbalanced design is the
interaction of selection and other internal threats, such as maturation (Ary et al., 2010;
Campbell & Stanley, 1963). Threats to external validity include the fact that this design
does not allow for the control of multiple treatment interface and may also be impacted
by interaction of testing and treatment, interaction of selection and treatment and
reactive arrangements.
Validity and reliability of the stress measures were limited because of the self-
report nature of the responses (Ary et al., 2010). These self-report responses were
subject to social desirability bias and reference bias. Furthermore, practice effects

26
threaten the validity and reliability of the attention measure. A control group was
established to help account for the practice effect. Repeated use of instruments could
cause students to become bored with the instruments (Ary et al., 2010). Violations of
statistical assumptions may impact parameter estimates, standard error and confidence
intervals, test statistics, and significance values, which can bias the conclusions made
(Field, 2013; Keith, 2006).
Assumptions
This research was based upon the following assumptions:
1. Participants will answer the survey questions truthfully.
2. Changes in stress and attention levels will be at least partially due to exposure to the
natural agricultural laboratory setting.
Chapter Summary
Chapter 1 provided an overview of the prevalence of stress in the US, specifically
in the student population. US youth have been experiencing stress at similar levels as
adults and have reported their stress levels are growing, leading to the potential of
chronic stress. While various sources have been shown to contributed to the stress
experienced by students, school has been identified as the most significant factor.
The chapter overviewed the negative consequences of stress to students, which
include both physical and mental health issues. Furthermore, students have not been
successful at managing their stress. These issues have prevented students from
working at their highest capacity and have led to compromised performance at school,
home, and work.
In addition to obstacles with stress, students have been facing challenges with
attention. While school has required students to rely on their ability to inhibit stimuli to

27
focus on the task at hand, students have resided in a culture that drains their directed
attention. For example, multitasking in the classroom with communication technologies
has contributed to an overuse of student directed attention, leading to directed attention
fatigue. Directed attention fatigue impedes academic achievement and prevents
students from completing tasks such as concentrating, problem solving, planning, and
responding appropriately.
While research has found that natural environments provide restorative
characteristics that could address student stress and attention issues, youth have been
spending less time in nature, which has hindered them from taking advantages of these
benefits. Researchers have recognized the need to address student stress and have
called upon schools and communities to help students manage their stress.
Despite this call to action, no research has investigated the role natural
agricultural laboratory settings could play in addressing student stress and attention
levels, which is the research problem this study aimed to explore. The purpose of this
study was to determine the relationship of natural agricultural laboratory settings on the
stress and attention levels of high school students. The results of this study provided
evidence to support a technique agriscience teachers could use to address student
stress and attention levels, thus leading to increased student achievement. Additionally,
it has provided evidence to justify the benefits of agricultural education programs and
added to the body of literature regarding restorative environments and agricultural
laboratories.
Chapter 2 will provide the theoretical framework and conceptual model which
guided the study, as well as the pertinent literature related to the study.

28
CHAPTER 2 LITERATURE REVIEW
As the prevalence of high stress levels has grown and the interaction with natural
environments has decreased, negative impacts to the mental and physical health and
attention capacity of students have been documented. These negative consequences
provide barriers for student success in school, because the lower level safety needs of
students are not being met. This chapter introduces the theoretical framework for this
study and proposes a conceptual model for the study of restorative learning
environments in the agriscience classroom. Existing research presented in relation to
the research problem identified in Chapter 1 and theoretical and conceptual frameworks
presented in this chapter.
Theoretical Framework
Stress Reduction Theory and Attention Restoration Theory served as the
theoretical base for this study. Ulrich and colleagues (Ulrich, Simons, Losito, Fiorito,
Miles, & Selzon, 1991) highlighted, many different theoretical perspectives that have
been used to explain stress reduction in natural, unthreatening environments, which
have stress recovery implications. These theories including cultural/learning, arousal,
overload, and evolutionary explanations. However, they noted a lack of theories that
addressed restoration. Research around these conceptualizations has focused on
aesthetic preferences with little attention paid to physiological and emotional responses.
Stress Reduction Theory (Ulrich, 1983) and Attention Restoration Theory (Kaplan &
Kaplan, 1989) address the restorative impact of nature (Ulrich et al., 1991).

29
Stress Reduction Theory
Ulrich (1983) proposed the stress reduction theory. This theory is a psycho-
evolutionary theory that emphasizes the physiological and psychological connections to
natural environments since those are the environments in which humans have evolved
(Berto, 2014). Ulrich (1983) acknowledges that aesthetic preference is part of the
affective response to natural environments but also highlights emotional and
physiological arousal to these settings as part of the response. Physiological stress
drives individuals towards a restorative environment (Berto, 2014). The initial response
to an environment influences conscious processing, physiological response, and
behaviors which follow (Ulrich, 1983) and plays a critical role in determining the
influence of that environment on restoration (Ulrich, 1983; Ulrich et al., 1991). If the
initial response is associated with positive affect, then the experience is likely to be
restorative. If, however, the initial response is connected to negative responses to
natural stimuli, like snakes or heights, then the experience is non-restorative or even
stressful. The multimodal response adjusts for the situation and determines approach-
avoidance behavior, which promotes survival.
After being exposed to stress, exposure to a non-threatening natural environment
initiates an immediate and unconscious response of the nervous system (Ulrich, 1983;
Ulrich et al., 1991). This parasympathetic response is designed to counteract the body’s
natural sympathetic stress responses, such as increased heart rate and higher cortisol
levels, and return the body to a state of homeostasis. During the parasympathetic
response, heart and respiration rates decline, stress hormones decrease, and the body
returns to normal functioning. This response provides restoration to the body including
an increase in positive emotion and positive changes in physiological responses to

30
stress. Sustained attention at moderately high levels has also been associated with
these changes. These positive changes have been found to occur quickly after
exposure to natural settings.
Adjusting appropriately to a favorable, natural environment is important in
providing a break from stress and allowing the body to restore energy for future
behavior (Ulrich, 1983; Ulrich et al., 1991). Following a stressor, natural environments
contribute to restoration by leading to an increase in positive emotions and a decrease
in physiological arousal within minutes (Ulrich et al., 1991). The effects of restorative
environments are more pronounced in individuals who exhibit a higher stress level and
arousal state than others (Ulrich, 1983). However, individuals who are unstressed and
at a normal arousal state may still reap the benefits of these restorative environments
maintaining interest and appropriate arousal levels.
Attention Restoration Theory
Attention restoration theory is considered a psycho-functionalist theory (Berto,
2014). The functionalist perspective highlights the predisposition humans have to
attend to and respond positively to natural settings, which were beneficial to survival
during evolution. The attention restoration theory focuses on how natural environments
influence the cognitive and psychological resources of individuals (Kaplan, 1995). It
defines directed attention and explains the process and impact of directed attention
fatigue. Reducing mental fatigue is fundamental to restoration in this theory (Kaplan &
Talbot, 1983) and drives individuals towards restorative environments (Berto, 2014).
The theory defines the characteristics of a restorative environment that contribute to
recovery from mental fatigue (Kaplan, 1995; Kaplan & Talbot, 1983).

31
Directed attention
Directed attention stems from the idea of “voluntary attention” discussed by
James (1892) (Kaplan, 1995). Directed attention is required when a particular stimulus
requires attention but does not naturally attract it (Kaplan, 1995). Therefore, effort is
required to inhibit distractions by suppressing competing stimuli. Since directed
attention requires effort, it is susceptible to fatigue.
Directed attention fatigue
Sustained mental effort can cause directed attention fatigue (Kaplan, 1995).
Kaplan (1995) explained that the ability to focus for a long period would have been a
major evolutionary limitation, which would have put individuals at risk for surprises.
Additionally, stimuli, which were vital to survival, such as animals, fire, caves, and blood,
were and still are fascinating to humans.
Today’s society requires individuals to exert effort to maintain directed attention
on daily tasks, creating the ideal circumstances for directed attention fatigue (Kaplan,
1995). When directed attention becomes fatigued, individuals struggle to concentrate
and complete mental work (Kaplan & Talbot, 1983). Additionally, they become irritable.
Kaplan (1995) proposed that directed attention impacts selection, inhibition, fragility,
perception, thought, action, and feeling. Directed attention fatigue contributes to human
error (Kaplan, 1995), ineffectiveness (Berto, 2014; Kaplan, 1995), and reduced
competence (Berto, 2014).
Characteristics of restorative environments
While sleep provides one avenue of recovery from directed attention fatigue, it
alone is insufficient (Kaplan, 1995). The body needs another way to restore directed
attention by allowing it to rest. Restorative environments can provide the necessary

32
break to allow directed attention to be resorted. Restorative environments contain four
characteristics: being away, fascination, extent, and compatibility (Kaplan, 1995; Kaplan
& Talbot, 1983).
Being away. Kaplan and Talbot (1983) explained being away in three ways.
First, being away is described as being removed from a distraction whether in a distant
location or a quiet, distraction-free location. A second definition of being away is a break
from ordinary work. The final explanation of getting away is resting from the pursuit of a
specific purpose, which could provide a break from mental effort. Kaplan (1995) noted
that being away requires a conceptual change, rather than a physical change, because
moving to a new location while contemplating the same cognitive struggle would not
provide the desired effects. Being away could encompass any one or a combination of
these definitions (Kaplan & Talbot, 1983). Although a combination of these descriptions
would provide stronger effects, being away alone does not provide a total restorative
experience.
Natural settings, such as lakes, mountains, and countrysides, have served as
common destinations for long-term restorative breaks, such as vacations (Kaplan,
1995). However, Kaplan (1995) noted that distant settings are not required to be away.
In fact, natural settings accessible in urban areas provide the opportunity for individuals
to rest their directed attention.
Fascination. Likened to “involuntary attention,” which was coined by James
(1982), fascination occurs when attention is effortless (Kaplan, 1995; Kaplan & Talbot,
1983). Since involuntary attention does not require effort, it is not susceptible to fatigue
(Kaplan, 1995). While a variety of stimuli can spark fascination, natural elements, such

33
as animals, water, vegetation, and scenery, attract effortless attention (Hartig et al.,
1991; Hartig et al., 2003; Kaplan, 1995; Kaplan & Talbot, 1983; Ulrich et al., 1991).
Content differences in natural versus urban settings account for the differences in
restoration and attention rather than, the amount of stimulation in the environment
(Ulrich et al., 1991).
Fascination contributes to restoration, because it prevents boredom (Kaplan &
Talbot, 1983). At the same time fascination allows the mind to rest from the everyday
stress and pressure inflicted by voluntary attention, which requires effort. Kaplan (1995)
distinguished between hard and soft fascination. Watching a car race is a form of hard
fascination, while walking in nature is a form of soft fascination. Soft fascination also
allows for reflection, which can provide additional benefits for recovering from directed
attention fatigue.
Although fascination plays a vital role in restorative environments, fascination
alone is an inadequate description of a restorative environment (Kaplan, 1995; Kaplan &
Talbot, 1983; Ulrich et al., 1991). Kaplan & Talbot (1983) explained that elements of
fascination can be connected to challenging work, providing only a brief break for
directed attention. Additionally, unrelated fascinating elements fail to engage the
fascination process; hence, fascinating stimuli need to be connected to engross
attention effortlessly. Ulrich and colleagues (1991) noted that fascination is a prominent
feature of many non-restorative and stress-inducing environments, such as those with
snakes or blood.
Extent/Coherence. For fascination to be engaged, the environment must
provide “a domain of larger scope to anticipate, explore, and contemplate” (Kaplan &

34
Talbot, 1983, p. 189). This setting needs to be large enough, rich enough, and
consistent enough to create a feeling of “another world” (Kaplan, 1995; Kaplan & Talbot,
1983). Coherence can be categorized into pattern coherence, distance coherence, and
higher-level coherence (Kaplan & Talbot, 1983). Pattern coherence is the simplest for
and deals with the interrelatedness of salient elements, which provides continuity.
Distance coherence occurs at a conceptual level and allows individuals to imagine the
continuation of the “world” beyond what is seen. Even small natural environments can
offer complex features that make the setting feel vast (Kaplan, 1995; Kaplan & Talbot,
1983). Finally, higher-level coherence expands the idea of extent beyond the physical
environment to a personal intuition about the “other world” (Kaplan & Talbot, 1983).
Compatibility. In addition to being away, fascination, and coherence,
compatibility between the environment and the individual’s propensity is needed
(Kaplan & Talbot, 1983). Since cognitive activity and actions are influenced both by an
individual’s objectives and by environmental restraints or demands, restorative
environments boast a setting in which both the individual’s goals and the environmental
characteristics support each other. A compatible environment allows for ease in
completing the necessary tasks (Kaplan, 1995).
Compatible environments are responsive, providing immediate feedback, and
require less discernment when problems are encountered (Kaplan, 1995). Nature is
particularly compatible with human intent, based on evolutionary development within
nature. People tend to enter nature with intentions to pursue patterns, such as
locomotion and observation, which are designed to be completed in natural
environments; thus, the environment is compatible with their inclinations.

35
Interaction of Stress and Attention
Hartig and colleagues (1991) highlighted three main differences in the stress
recovery theory and the attention restoration theory. The first difference regards the
initial response to the environment. In the stress recovery theory, the initial response is
autonomic affective, meaning an immediate emotional response triggered by the bodies
autonomic nervous system. Conversely, in attention restoration theory, the initial
response is cognitive. The second difference deals with the focus on the type of
response. Where the stress recovery theory concentrates on emotional, mental, and
physiological components of response, the attention restoration theory is concerned
with attention deficits. Finally, the stress recovery theory relies on reduction of arousal
for restoration, and the attention restoration theory relies on the replenishing of the
capacity to pay attention. However, the stress recovery theory does recognize the
renewal of attention capacity as a result of reducing arousal.
A view of restoration focused purely on attention does not adequately address
the emotional, physiological, and cognitive strains individuals experience during
activities which require directed attention (Ulrich et al., 1991). Stress recovery theory
and attention restoration theory diverge on their main source of restoration (Berto; 2014;
Hartig & Evans, 1993). Stress recovery theory focuses on restoration stemming from
physiological stress. Whereas, attention restoration theory highlights recovering
attention capacity as the source of restoration. However, Berto (2014) acknowledged
that these two theories are complementary. While elevated psychological arousal and
negative emotions of the stress reduction theory can occur in the absence of mental
fatigue, and vice versa, they often occur together. Directed attention fatigue can be
precursor condition which increases vulnerability to stress or an aftereffect of stress.

36
Kaplan (1995) proposed a framework which would integrate the restorative benefits of
nature. This framework connected stress and attention.
Kaplan (1995) cited two factors which contribute to stress: harm and resource
inadequacy. He argued that directed attention is indeed a psychological resource based
upon the fact that it is vital to performance, is pervasive, and is vulnerable to depletion
and inadequacy. Additionally, he contended that “insufficient attentional resources will
be an antecedent to stress” (Kaplan, 1995, p. 178). Kaplan proposed three paths,
depicted in gray in the conceptual model in Figure 2-1, which outline stress and
attention interactions leading to impaired performance.
The first path acknowledges that a task demand leads to a decline in resources
that triggers a stress response and impairs performance (Kaplan,1995). In this path,
resource deficiencies are a precursor to stress. The second path begins with a stress
response that causes a severe distraction leading to a decline in resources resulting in
impaired performance. Stress is the precursor to resource deficiency in this path. In the
third path, aversive stimuli cause both a stress response and resource decline
simultaneously, which consequently lead to impaired performance. Kaplan (1995)
warned against jumping to conclusions about causal factors, stress or directed attention
fatigue. Additionally, he cautioned that because directed attention fatigue takes longer
to develop, it also takes longer to restore.
Other researchers have also suggested a connection between stress and
attention. Research has shown that increases in negative emotions, decreases in
cognitive performance (Holding, 1983), and physiological responses from multiple body
systems (Frankenhauser, 1980) accompany mental fatigue (Ulrich et al., 1983). Hartig

37
and colleagues (1991) suggested “the physiological and attentional restoration process
may complement one another, manifesting in different kinds of outcomes that emerge at
different rates and persist to differing degrees” (p. 121). Ulrich et al. (1991) suggested
that since stress has an impact on behavioral manifestations, restoration could lead to
increased functioning. They recommended research on how natural settings impact
performance levels.
Conceptual Model
After a thorough literature review, the researcher developed a conceptual
framework for the study of restorative environments in educational settings (See Figure
2-1). This conceptual model depicts the relationships among stress, attention, and
restorative environments and their influence on academic performance. The conceptual
model outlines the three causal linkages (in gray) between stress and attention that lead
to impaired performance as proposed by Kaplan (1995). Acting as a barrier to the
impaired performance is a restorative environment distinguished by the four
characteristics of a restorative environment, as described by Kaplan & Talbot (1983).
The impact of the restorative environment is reflected in affective and cognitive
responses, which provide restoration in the form of increased attentional capacity and
reduced arousal, which can lead to increased academic performance.
Previous Research
Restoration can be hindered or supported by everyday environments (Hartig et
al., 2003). In a literature review on restorativeness, Berto (2014) found that while natural
environments tended to have more restorative effects than urban settings, restorative
experiences were not exclusive to natural environments, and restorative qualities could
be found in some urban environments. The quick onset of stress restoration in natural

38
environments suggested that short-term contact with nature could provide valuable
results in everyday contexts (Hartig et al., 1991; Ulrich et al., 1991).
Restorative Learning Environments
Little research has been done specifically on restorative learning environments.
However, some research has been completed on agricultural laboratory settings,
specifically the greenhouse, which has been chosen to operationalize the natural
agriculture laboratory setting used as the restorative environment for this study.
Additionally, researchers have investigated nature as a restorative environment.
Agricultural laboratories
Laboratory instruction has been recognized as a vital part of high quality
agricultural education programs at all levels and can take place in many indoor and
outdoor settings (Phipps, Osborne, Dyer, & Ball, 2008). The use of agricultural
laboratories is engrained in the basic philosophy of agricultural education (Phipps et al.,
2008; Shoulders & Myers, 2012).
Shoulders and Myers (2012) reported that agriscience teachers have a wide
variety of laboratory settings available to them. Laboratory facilities reported included:
agricultural mechanics, greenhouse, landscaping area, garden, aquaculture tank/pond,
livestock/equine facility, field crops, biotechnology/science laboratory, forest plot, food
science laboratory, bursary/orchard/grove, turf grass management area, small
animal/veterinary laboratory, meats laboratory, apiary, and vineyard. Over half of the
respondents reported using most of their laboratory facilities more than once per week
and many laboratory facilities were used one or more times a day.
Laboratories in urban schools were correlated with higher frequency of use than
laboratories in rural settings (Shoulders & Myers, 2012). Shoulders and Myers (2012)

39
also found positive correlations between the use of certain laboratory settings and
positive perceptions of student learning. The authors noted that some laboratory
settings were associated with greater preparation requirements while other laboratory
settings were associated fewer preparation requirements.
Over 72% of agriculture teachers reported having a greenhouse laboratory
(Shoulders & Myers, 2012). Of the 140 teachers reporting they had a greenhouse
facility, 40 used it more than once a day, 58 used it once a day, and 28 used it once a
week. Only 13 teachers reported using their greenhouse facility once a month or less.
A study focused on examining the greenhouse facilities and use in secondary
agriculture programs in Arizona reported similar findings (Franklin, 2008). This study
reported that 76% of Arizona agriculture teachers had a greenhouse facility.
Approximately two-thirds of teachers reported using their greenhouse all year long or
while school was in session another 7% reported using their greenhouse only during
certain growing seasons or with certain units. Finally, 15.8% reported not using their
greenhouse at the current time due to maintenance issues, renovations, or building
projects.
The Arizona greenhouse facilities ranged in size from 240 square feet to 3,600
square feet with the means size being 1,300 square feet (Franklin, 2008). Most of these
facilities (86% or greater) had fans, cooling systems, ventilation, and heating. Many of
them, (51% - 68%) also had irrigation, misters, sensor controls lighting, and fertilizer
injection systems. Less than a quarter of teachers, reported having facilities with
retractable shade clothes or bottom heat.

40
Arizona agriculture teachers reported using their greenhouse facilities for
classroom instruction (95%), student SAE’s (81%), fundraising (73%), recruitment/public
relations (64%), career development event training (57%), FFA activities (42%), and
agriscience fair/student research (33%) (Franklin, 2008). Additionally, Shoulders and
Myers (2013) noted that agriculture teachers utilized laboratories to facilitate
experiential learning stages in their lessons. While nearly half of the respondents
reported using three of the four experiential learning stages in the laboratory setting,
activities that were considered concreate experiences were most frequently planned,
and active experimentation was implemented in the laboratory with the least frequency.
Additionally, teachers were more likely to require students grasp information through
concrete experiences or abstract conceptualization, with very few requiring students to
transform information through reflective observation or active experimentation.
Within agricultural education, researchers have investigated the impact of
laboratory instruction on content knowledge, science process skills, and attitudes
towards subject matter (Myers & Dyer, 2006; Rotherberger & Stewart, 1995). Arizona
agriculture teachers agreed that they were able to use the greenhouse to address 12
plant science standards in addition to math and science standards in their instruction,
and felt they could not effectively teach plant science without a greenhouse (Franklin,
2008). Investigative laboratory instruction and subject matter instruction were found to
be more effective in increasing student content knowledge and science process skills
than prescriptive laboratory instruction, regardless of learning style (Myers & Dyer,
2006). After a 15-lesson unit on poinsettia production, students who were taught the
lesson and had access to a greenhouse laboratory experience raising poinsettias in

41
conjunction with the instruction had higher content knowledge scores than students who
received the same lesson without a greenhouse laboratory experience. (Rotherberger &
Stewart, 1995). However, the laboratory experience did not significantly influence the
attitude of students towards poinsettia production subject matter.
Nature as a Restorative Environment
Natural environments provide more restorative impacts than outdoor urban or
indoor relaxation environments (Hartig et al., 1991). Hartig and colleagues reported the
findings of two field experiments. The first study compared the effects of an extended
wilderness backpacking trip to other vacations or no vacation. Participants completed
pretest and posttest instruments, as well as a follow-up posttest 21 days after the
treatment to measure affect and cognitive performance before engaging in 4-7 days of
vacation or normal activity. This study supported prolonged wilderness experiences as
restorative experiences.
Study two employed an experimental design to determine the effects of a nature
walk, an urban walk, and a relaxation condition affect and cognitive function (Hartig et
al., 1991). Initial data on affect, proofreading, and physiological measurements was
taken prior to the treatments. On a different day participants were completed a 40-
minute session of Stroop testing and binary classification task to induce cognitive
fatigue. Participants then spent 40 minutes in their randomly assigned relaxation
treatment. Following the treatment, physiological measurements were collected.
Additionally, participants completed the perceived restorativeness scale, affective
instruments, and a proofreading task. Participants in a natural environment reported
higher perceived restorativeness scores, based on being away, fascination,
coherence/extent, and compatibility, of that environment than did participants who took

42
an urban walk or relaxed indoors. Test results confirmed the hypothesis that the natural
environment would provide a more restorative experience than the two comparison
environments.
The Hartig et al. (1991) study also corroborated the Kaplan and Talbot’s (1983)
belief that being away does not provide a fully restorative experience. Results indicated
that being away was not adequate enough to produce restorative effects alone (Hartig
et al., 1991). Individuals who were “away” on non-wilderness vacations, in study one,
and a new urban outdoor walking area or relaxation area, in study two, were less
restored than those individuals in other “away” yet natural environments.
Natural environments do not need extreme properties to have an impact on well-
being; common, everyday environments, even in urban settings, can have an impact
(Hartig et al., 1991; Ulrich et al., 1991). These “restorative experiences may also have
proactive effects, preparing people to better cope with the stress and strain of daily life”
(Hartig et al., 1991, p. 15).
Hartig et al. (1991) found participants’ scores of perceived restorativeness of an
environment were correlated with increased overall happiness scores, decreased
Zuckerman Inventory of Personal Reactions (ZIPERS) anger/aggression scores,
increased ZIPERS positive effect scores, and increased proofreading performance. The
authors noted that with improvement of the restorativeness scale, researchers would be
able to evaluate the restorativeness of specific natural environments and elements and
compare the importance of the different restorative elements.
McMahan and Estes (2015) performed a meta-analysis to determine the effect of
natural environments on emotional well-being. The findings of their meta-analysis

43
indicated a moderate effect size for an increase in positive affect and a small effect size
for the decrease in negative affect. McMahan and Estes found that the effect size
associated with an increase in positive affect was moderated by age of participants,
type of exposure to nature (natural vs. laboratory), instrument of affect, and location of
study based upon the country where the study was performed. Studies which used
older samples had larger effect sizes. Larger effect sizes were found when participants
were exposed to real nature rather than laboratory simulations of nature. However, the
type of environment, managed versus wild, did not have a significant difference on
effect size.
Since all of the studies included in the meta-analysis relied on short duration of
exposure to nature, the authors concluded that small doses of nature provided positive
benefits to subjective well-being (McMahan & Estes, 2015). Specifically, brief exposure
to natural environments were associated with high levels of positive emotions and lower
levels of negative affect in compassion to comparative conditions. While contact with
real natural environments provides the most benefit to individuals, virtual nature still
provided significant increases in positive affect can and can provide an alternative when
it is difficult for individuals to be exposed to real natural environments. The authors
indicated a need for more research to investigate the effects of longer duration
exposure to natural environments.
Atchley et al. (2012) investigated the impacts of nature on higher-order thinking
such as creative problem solving. The study used a pre-post design and the Remote
Associates Test (RAT) of creative thinking and problem solving to assess the effects of
prolonged exposure to natural environments without technology. Participants were

44
randomly assigned to a pre-hike group or an in-hike group. Pre-hike participants took
the RAT test the morning prior to beginning a 4-6-day wilderness backpacking trip. The
in-hike group completed the RAT test on the morning of their 4th day of hiking. The in-
hike group scores showed a 50% increase in performance from the pre-hike scores.
The researchers concluded that the immersive natural setting teamed with the
disconnection from electronic devices provided a measureable cognitive advantage to
participants by increasing higher-order cognitive function. However, the researchers
acknowledged an inability to attribute these benefits to specifically to the exposure to
nature or the decreased exposer to technology. Additionally, there is not enough
evidence to determine if one factor had a more significant effect than the other.
Restorative Effects
Many studies have examined the effects of natural environments in terms of
affective stress recovery, cognitive attention restoration, and physical recovery.
Increased confidence in the merit of these studies and their results has been provided
by the fact that the studies have boasted the convergence of multiple measures of
stress and attention recovery, such as self-reports, physiological measures, and
performance tasks (Hartig et al., 1991; Hartig et al., 2003; Ulrich et al., 1991).
Additionally, the role of nature as a moderator of stress has been explored (Wells &
Evans, 2003).
Affective stress recovery
Natural settings provide physical and psychological restoration (Hartig et al.,
1991; Hartig et al., 2003; Ulrich et al., 1991) Ulrich et al. (1991) exposed undergraduate
students to a stressful situation by showing two, consecutive 10-minute video tapes on
workplace accidents with graphic footage of the accidents. Following being exposed to
45
the stressor, participants were assigned to one of six recovery conditions in which they
watched 10 minutes of video footage from one of the following conditions: nature –
vegetation, nature – water, urban – heavy traffic, urban – light traffic, urban – many
pedestrians, or urban – few pedestrians. Both continuous physiological and pre-post,
self-report psychological measures were collected from participants. Ulrich et al.
contended recovery from stress occurs faster and more completely in natural
environments when compared to urban environments. They implied that responses to
natural environments engage the parasympathetic system responsible for returning the
body to a pre-stress state and maintaining energy sources, while responses to urban
environments do not engage the parasympathetic system. In fact, urban environments
elicited mild sympathetic responses, which require energy and tax the physical
components of the body to mobilize the body for response to stressful situations, thus
causing a non-restorative response. Ulrich and colleagues tentatively concluded that as
positive emotions increase, autonomic but not somatic arousals decrease.
Hartig and colleagues (2003) corroborated the Ulrich et al. (1991) study by
documenting decreasing blood pressure for individuals both sitting and walking in
natural environments and increasing blood pressure levels for individuals sitting and
walking in urban environments. These findings were contradicted by results from Hartig
et al. (1991), which found no significant differences in heart rate or blood pressure
readings. However, the authors recognized a limitation of these data in that the final
assessment occurred 50 minutes after the tasks, and previous research had shown
physiological rates to return to baseline rates within 10 minutes.

46
Greater psychological restoration has been shown in natural settings when
compared to urban settings (Ulrich et al., 1991). Ulrich found that feelings of anger and
fear were lower, while positive affect was greatly increased. The affect scores were
better than the initial base-line scores, which indicated the prominent effects of the
natural setting. Hartig et al. (1991) study two provided additional support of these
findings by reporting increased Overall Happiness scores and positive affect ZIPERS
scores and decreased anger/aggression ZIPERS scores. Results from Hartig et al.
(2003) affirmed these findings as well. Similar patterns of anger and aggression scores,
which increased in urban environments and decreased in natural environments, were
described. The researchers also implied that the anger experienced in the urban
environment could impede the restoration process.
Conversely, Hartig et al. (1991) study one did not find an increase in positive
emotions upon return of those in a wilderness backpacking experience, but instead
found a slightly depressed mood. These findings, combined with the blood pressure
trends between those hiking in natural and urban environments, which diverged during
the first half of the walk and then converged during the latter half of the walk, (Hartig et
al., 2003) may be accounted for by a negative anticipation for returning from the trip or
walk (Hartig et al., 1991; Hartig et al., 2003). However, long-term follow-up results
showed a reversal of the initial reaction of depression for those who backpacked
through nature (Hartig et al., 1991).
In a study comparing the restoration effects and stress relief of four activities in
forest and park settings, participants were asked to rate the severity of headaches, level
of stress, and feelings of well-balancedness they experienced upon arriving at the forest

47
or park and at the current state when being interviewed at the location (Hansamann,
Hug, & Seeland, 2007). Participants indicated work and school related responsibilities to
be the major source of their stress. Although participants reported low severity of
headaches upon arriving at the location, 14 cases of headaches decreased in severity
and only one increased in severity. The researchers reported a significant reduction in
headache severity across all locations (park, forest edge, and forest interior).
Participants reported a significant increase in feeling well-balanced from when they
arrived at their location and there were no significant differences among location. The
same was true of reported stress levels, which also started at a low level. Stress
difference and well-being difference measures were calculated and positive values
indicated that restoration occurred during the time spent in each environment.
A significant interaction effect was found between restorative outcome and the
pre-level wellbeing and stress scores (Hansamann et al., 2007). The more stressed and
the less well-balanced the participants were at pre-visit, the greater the restorative
experiences they encountered. Additionally, the restorative outcomes increased as
duration of the stay in the restorative environment increased. Location did not provide a
significant main effect. When additional activity variables, taking a walk, relaxing, and
observing nature, were added to the model, no significant effects were found, but
previous results remained stable indicating robust results. However, the activity variable
of practicing sports was found to be significant and related to higher restorative
outcomes. Although this study provided evidence of decreased stress and increased
well-being from all three restorative environments, the length of these improvements
and long term effects was not known.

48
Participants in a rehabilitation program for stress disorders recognized the value
of the garden environment to their recovery (Adevi & Mårtensson, 2013). They
“described the garden as a useful environment for acute stress relief” (Adevi &
Mårtensson, 2013, p. 235). Additionally, they acknowledged the garden as a laboratory
to practice strategies that can improve their everyday functioning and increase their
well-being.
Cognitive attention restoration
When comparing stress recovery in natural and urban environments, Ulrich et al.
(1991) found cardiac responses that indicated greater attention in natural environments.
This attention stemmed from natural fascination. Both studies reported by Hartig and
colleagues (1991) credited natural environments for providing more cognitive restoration
from mental fatigue, as indicated by improved proofreading performance, than non-
wilderness vacations and regular daily activity reported in study one and urban walking
or indoor relaxation environments reported in study two. The authors acknowledged that
part of the restorative capacity of natural environments stemmed from the ability to
recover attentional capacity from the mental fatigue caused by everyday environmental
demands, such as noise and crowding (Hartig et al., 1991). Hartig et al. (2003)
corroborated these findings. After walking in assigned environments for 20 minutes,
participants performed slightly better on the Necker Cube test for attention in natural
environments, and participants in urban environments performed worse when compared
to baseline data (Hartig et al., 2003).
Tennessen & Cimprich (1995) investigated if the degree of naturalness of the
view from the dormitory window was associated with the capacity of residents to direct
attention. Directed attention capacity was measured using the following tests: Digit

49
Span Forward, Digit Span backward, Symbol Digit Modalities Test, Necker Cube
Pattern Control Test, and the Attentional Function Index. The view from each room was
rated from all natural to all built on a 4-point scale. Results from the Symbol Digit
Modalities Test, the Necker Cube Pattern Control Test, and the Attentional Function
Index showed significant increases in directed attention capacity for those with a more
natural view. While the other measures of attention did not have significantly different
results, the pattern of means all showed residents with all natural views performed
better on the measures of directed attention capacity than those with other views. The
authors underscored that even minimal exposure to nature, such as a window view,
provided some beneficial effects to directed attention capacity.
Cimprich & Ronis (2003) built on these findings to determine if natural restorative
environment interventions could maintain or improve the capacity of newly diagnosed
women with breast cancer to direct attention from pre-surgical to postsurgical periods.
Attention capacity was measured using digit span forward, digit span backward, trail
making A, trail making B, and Necker cube patter control tests at both a pretreatment
visit and a postsurgical follow-up visit. The intervention group was instructed to spend a
minimum of 120 minutes each week in natural environments and record how they spend
their time in a daily log. Participants in the control group used a daily log to track how
they spent their relaxation time and the amount to time they spent relaxing. The
pretreatment attention scores were positively correlated with education and negatively
correlated with age. The postsurgical attention scores indicated that individuals in the
intervention group had significantly higher directed attention capacity than the control
group. The authors highlighted that the natural environment activities were “modest and

50
generally easy to perform” (Cimprich & Ronis, 2003, p. 290). At the same time, the use
of these activities before treatment could prevent or counteract directed attention fatigue
in patients during surgical treatment and recovery.
Berto (2005) reported a series of three experiments which tested the effects of
restorative environments on attention. The first experiment sought to verify if restorative
environments could enhance attention task performance. Undergraduate students
completed the sustained attention to response test (SART) to initiate cognitive fatigue.
Then half of the students viewed a series of restorative pictures and the other half
viewed a series of non-restorative pictures before completing the SART again. The
means of d-prime (sensitivity to detection of the target), reaction times, number of
correct responses, and number of incorrect responses were compared between groups
for the initial SART testing to ensure similar groups, and no significant differences were
found. Participants who viewed restorative environments showed significant increases
in their performance of d-prime, reaction times, and number of correct responses.
Conversely, the non-restorative group saw no significant improvement in scores.
However, the non-restorative groups did have significant improvement in the number of
incorrect responses where the restorative group did not. When the scores of the second
SART were compared, the restorative group outperformed the nonrestorative group in
reaction time. The author concluded that the restorative environment renewed the
attention capacity of participants to a sufficient degree for the posttest while the non-
restorative pictures did not.
The second experiment reported by Berto (2005) followed the same procedure
as experiment number one but showed geometric patterns. The results were compared

51
with the experiment one data to determine if different effortless material, geometric
patterns, could provide a restorative effect. No significant differences were found when
comparing the mean scores of d-prime, reaction times, number of correct responses,
and number of incorrect responses between the first and second SART testing sessions
for the geometric shapes. When this data were compared to data from experiment one,
a significant difference was found between groups. The restorative group was found to
have the greatest number of correct responses and the fastest reaction times. These
results indicated that the geometric patterns did not provide restorative benefits;
however, they also did not overload the attentional capacity of participants.
The final experiment replicated experiment one but allowed the participants to
decide how long to view the pictures (Berto, 2005). A significant difference of viewing
time was found between restorative and non-restorative pictures by a difference of
1,934.44 milliseconds. All pictures were viewed for less than 15s which was the time
used for experiment one. Despite viewing the restorative pictures for less time,
significant improvements in performance were found between first and second SART
testing for sensitivity and correct responses for the restorative group. No significant
differences were reported for the non-restorative group. Additionally, looking at the non-
restorative pictures for less time did not have any effect on the attention capacity.
Physical recovery
Ulrich (1984) found that natural views in hospital rooms for patients recovering
from gall bladder surgery had a restorative influence, compared to rooms which faced a
brick wall. Patients who were assigned to the hospital rooms which provided a view of
trees were released from the hospital in fewer days, received fewer negative comments

52
recorded on their charts, took fewer doses of strong pain relief medication, and had
slightly less minor complications following surgery.
Buffering effect
Berto’s (2014) literature review acknowledged that nature’s effect on stress
recovery and directed attention fatigue restoration may have more than direct effects.
Nature has been shown to have an indirect effect as a moderator. This nature acts as a
buffer against the impacts of stressful events. Wells and Evans (2003) analyzed data
from rural students in grades 3-5. The researchers used the naturalness scale to
evaluate the residential environment of each student. In addition, they collected
information on the stressful life events students had experienced, the children’s’
psychological distress as rated by their parents, and a self-reported rating of each
child’s wellbeing through a self-worth instrument. The researchers found that children
with higher socioeconomic status and children with more nature near their homes
experienced significantly lower levels of psychological distress.
While children who faced more stressful life events, had greater psychological
distress, the presence of nearby nature acted as a buffer to the impact of the stressful
life events on children distress levels (Wells & Evans, 2003). The influence of stressful
life events on psychological distress was less for students with higher levels of nature
exposure and more for students with less exposure to nature. This finding held true for
both parent and student reports of distress. The researchers noted that since the
research was completed in a rural setting, they expect the results are conservative and
they predict that replication in urban settings would uncover even stronger buffering
effects of nearby nature.

53
Chapter Summary
The Stress Reduction Theory and Attention Restoration Theory provide a
framework to study how natural, restorative learning environments can influence the
stress and attention of students. The interaction of stress and directed attention fatigue
have been theorized to lead to additional stress responses and impaired performance.
However natural environments with characteristics of fascination, being away,
compatibility, and extent have been shown to provide restorative effects to stress and
attention. While most of the existing literature has been conducted in medical and
environmental psychology fields, the research has documented the positive impacts of
restorative environments to the physical health, mental health, and cognitive attention.
Through this study, the researcher investigated how these theories could be applied in
agricultural laboratories and what the influences of these laboratories would be on
student stress and attention.

54
Figure 2-1. Conceptual Model for the Study of Restorative Learning Environments on Academic Performance (Adapted from Kaplan, 1995)

55
CHAPTER 3 METHODS
Chapter 1 overviewed the pervasiveness of stress in the US and the negative
outcomes of stress in students. The impacts of stress paired with directed attention
fatigue ultimately compromise student performance at school. The purpose of this study
was to determine the effects of a natural agricultural laboratory setting on the stress and
attention levels of high school students.
Chapter 2 provided the theoretical and conceptual frameworks that guided the
study, as well as the pertinent research related to the study. The Stress Reduction
Theory (Ulrich, 1983) and Attention Restoration Theory (Kaplan, 1995) directed this
study. The conceptual model (Figure 2-1) depicted how restorative learning
environments can act as a barrier to impaired academic performance caused by
increased stress and directed attention fatigue by providing affective and cognitive
restoration, which lead to enhanced academic performance instead.
Chapter 3 specifies the methods used to address the research objectives of this
study. The chapter will explain the research design, population and sample,
instrumentation, procedures, data collection, and data analysis. Additionally, the chapter
will explain how threats to validity and reliability were addressed.
Objectives and Hypotheses
The following research objectives were developed to guide this study:
1. Describe the demographic characteristics of the participants in this study;
2. Identify the stress levels experienced by high school agriculture students;
3. Determine if a difference in the change of student stress levels exists between students instructed in the classroom setting and those instructed in a natural agricultural laboratory setting;

56
4. Determine if a difference in the change of student attention capacity exists between students instructed in the classroom setting and those instructed in a natural agricultural laboratory setting; and
5. Determine if a difference in student content knowledge exists between students instructed in the classroom setting and those instructed in a natural agricultural laboratory setting.
The following research hypotheses were developed based on the research
objectives.
H1: Students receiving instruction in a natural agricultural laboratory setting will have a greater decrease in stress levels compared to students receiving instruction in the classroom setting.
H2: Students receiving instruction in a natural agricultural laboratory setting will have a greater increase in attention scores than students receiving instruction in the classroom setting.
H3: Students receiving instruction in a natural agricultural laboratory setting will have higher content knowledge scores than students receiving instruction in the classroom setting.
Research Design
This research used a quasi-experimental design. Experimental research requires
random assignment of subjects to experimental and control groups (Ary et al., 2010).
However, in education research, randomly assigning participants to treatment groups is
often not possible (Ary et al., 2010; Campbell & Stanley, 1963). In cases in which
randomization is not possible, quasi-experimental designs allow researchers to
manipulate independent variables and pursue hypothesis testing. Campbell and Stanley
(1963) noted that quasi-experimental designs are “well worth employing where more
efficient probes are unavailable” (p. 35, emphasis in original). Since researchers lack full
control in quasi-experimental research, they need to be cognizant of the threats to
internal and external validity and address the threats during interpretation (Ary et al.,
2010; Campbell & Stanley, 1963).

57
Like experimental research, quasi-experimental studies rely on the systematic
manipulation of the independent variable to determine its influence on the dependent
variables, while controlling for extraneous variables that could also affect the dependent
variable (Ary et al., 2010). In this study, the learning environment was the manipulated
independent variable. The dependent variables of interest were student stress level,
attention capacity, and content knowledge.
Specifically, this study utilized a counterbalanced, randomized subjects, pretest-
posttest control group design (See Table 3.1; Ary et al., 2010). Counterbalanced
designs use a series of replications to expose all groups to all treatments in different
orders thereby increasing experimental control (Ary et al., 2010; Campbell & Stanley,
1963). This design allows any differences which may exist between groups to be
rotated, so pre-existing differences cannot influence the results. However, this design
presents several limitations. The counter balanced design is susceptible to carryover
effect and requires equivalence in complexity of learning material. Finally, the
researchers need to be aware that students can become bored with repeated testing.
To limit carryover effect and prevent students from becoming bored, the researcher
chose pretest instruments that would minimize these threats, as well as allowing a
minimum of one week between treatments. Additionally, a control group of students in
another class offered at the same time in the same school was used to account for the
practice effect of the stress and attention measures. The researcher worked with the
teachers from the schools involved to identify lessons of equivalent complexity. The
instructional materials developed were reviewed by a panel of experts to verify the
equivalence in complexity, as well.

58
The research design employed in this study controlled for the following threats to
internal validity: history, maturation, pretesting, instrumentation, statistical regression,
differential selection, experimental mortality, interaction of selection with other threats,
and subject effects (Ary et al., 2010). Experimenter effects were controlled by using
standardized procedures and trained individuals to administer the experimental
treatments. Additionally, the researcher was able to observe each experimental
treatment to ensure instructional plans were being implemented as designed, thus
verifying the fidelity of treatment. The threat of diffusion was addressed by taking
posttest stress and attention measures before the two groups interacted following
treatment. Additionally, trained instructors were instructed not to discuss the procedures
or class outcomes with each other until debriefing after all treatment sessions had
concluded. Diffusion was a limiting factor in this study due to the delayed posttest of the
content knowledge assessment. The pretest in the design presented a threat to external
validity, in that the pretest and treatment could interact, only allowing results to be
generalized to those who have been pretested (Ary, et al., 2010). Possible concerns
impacting external validity in counterbalanced designs include, interaction for testing
and treatment, interaction of selection and treatment and reactive arrangements of the
multiple treatment interface (Ary et al., 2010; Campbell & Stanley, 1963). These
limitations need to be considered and addressed during the interpretation of results.
Population and Sample
The population for this study was secondary agriscience students enrolled in
horticulture programs or coursework. From this population, two schools were selected
as a purposive sample based on the horticulture program they offered, their natural
agricultural laboratory resources, their differences in the surrounding communities, and

59
proximity to the research team. Purposive sampling allows the researcher to select
cases that are typical or representative of the population in which probability sampling is
difficult or impossible to achieve (Ary et al., 2010). Since non-probability sampling was
utilized, this study is limited by the inability to generalize the findings beyond the
sample. However, readers may compare this sample to other samples and draw their
own conclusions about generalizability.
Both schools offered a Horticulture Science and Services pathway, which
requires students to take Agriscience Foundations, Introductory Horticulture 2,
Horticulture Science 3, Horticulture Science and Services 4, Horticulture Science and
Services 5, and Horticulture Science and Services 6 (Florida Department of Education
[FDOE], 2017a). For this study, students enrolled in Agriscience Foundations,
Introductory Horticulture 2, and Horticulture Science 3 were included.
School A was a high school located in a community of 2,760, which is classified
as an Urban Cluster between 2,500-50,000 people (U.S. Census Bureau, 2016). It
serves a more rural community and was surrounded by farmland. Table 3-2 provides
the gender and race data for the school. Just over 51% of students were male FDOE,
2017b). The majority of students were white (61.9%) with smaller Black, Hispanic, and
multi-racial minorities. Less than 10 students were American Indian or Asian.
This agricultural classroom was a large room with the dimensions of 57 feet by
62 feet. The front half of the room (57 feet by 33 feet) contained a teacher’s lab table,
white board, and projector screen along the front wall. Students were seated two to a
table facing the front wall spanning approximately two-thirds of the length of the room.
Two agricultural mechanic-style laboratory tables were off to the left of the student

60
seating areas and were where the students performed the propagation activity for the
first lesson. In addition to the front of the room, students had a view through windows to
an agricultural mechanics classroom and two office areas. The remainder of the room
had several science-style laboratory tables. Students in the participating classes did not
use this back area of the classroom. It was reserved for the biotechnology classes.
The greenhouse structure was 30 feet by 60 feet. The walls were polycarbonate .
Inside there were five greenhouse tables extending horizontally from the walls along
each side with an aisle down the center. The greenhouse temperature was controlled
and ranged from 70 F to 79 F throughout day one. The greenhouse was mostly filled
with poinsettias; however, they were arranged to allow space for students to work at the
end of each of the greenhouse tables towards the center aisle. Cooler outdoor
temperatures resulted in cooler temperatures in the greenhouse on day two with
temperature ranging from 64 F to 70 F. About half of the poinsettias from the first day
were gone.
Based upon estimates from the U.S. Census Bureau, School B is located in a city
with a population of 59,253 in 2016, which classifies it as an Urbanized Area of over
50,000 people (U.S. Census Bureau, 2016). This school served an urban community
and was surrounded by apartment complexes and housing. A summary of students by
gender and race/ethnicity for the 2015-2016 school year is included in Table 3-2. School
B had an equal percentage of male and female students (FODE, 2017b). White
students accounted for 46% of the population followed by Black students (29.1%),
Hispanic/Latino (13.7%), multiracial, (5.8%), and Asian (4.5%). Less than 10 students
were American Indian.

61
The agricultural classroom was 27 feet by 26 feet. The front of the classroom had
a white board, projector screen, and bulletin boards on either side. A teacher’s desk
was located in the front left corner when facing the front of the room. Individual student
desks with attached chairs were located in rows facing the front of the room. A fish tank
was located in the back of the classroom. An attached room had agricultural mechanic-
style laboratory tables where students completed the propagation activity on day one.
The natural agricultural laboratory setting was located approximately 300 feet
from the agricultural classroom and took students approximately two minutes of walking
to arrive there. This was a 30 feet by 50 feet shade house area. Two rows of
greenhouse tables covered by shade cloth were filled with plants. Students worked at a
third row of tables, which were clear. The area was surrounded by some raised beds
and was close to a fence and wood line that separated the school grounds from a
neighboring apartment complex. Since this area was not enclosed, the temperature
fluctuated more with the outdoor temperature. Day one the temperatures ranged from
64 F with warm sun in the morning to 75 F and overcast in the afternoon. Students did
not make any comments about the temperature. On day two, it was mostly sunny with
temperatures ranging from 49 F to 66 F. Most students were dressed appropriately for
the temperatures; however, one student in the first class was only wearing a t-shirt and
commented about being a cold. On both days during some afternoon class periods,
students from other classes would be in the surrounding area caring for the plants.
In between the day one and day two, School B experienced two events that had
the potential to impact student stress and attention levels. A student from the school
was shot and in front of a house across from the school. Additionally, two students died
62
in a car accident. The teacher at this school noted that some of the agriculture students
were close to one of the three people who died in these events.
Of the 183 students enrolled in Agriscience Foundations, Introductory
Horticulture 2 and Horticulture Sciences 3 in the schools, 86 students completed and
submitted the IRB parental consent and student assent forms and were present for both
days of instruction, resulting in a 47% participation rate. Of these students, 44 were
assigned to the group 1, treatment first, and 42 were assigned to the group 2, treatment
second. Additionally, at each school a non-agriculture teacher granted permission for
the researcher to distribute the stress and attention instruments to test for practice
effect. The teacher in School A taught AVID and Spanish. The School B teacher taught
remedial math. Fifty-three of the possible 123 students (43%) submitted a parent
consent and student assent form, were present for the entire class period, and were not
enrolled in one of the experimental and comparison groups. These students were
assigned to group 3, control.
Instrumentation
Three established instruments were utilized in this study to measure stress level
and directed attention. When choosing instrumentation for stress and attention
variables, the researcher looked for instruments that were appropriate for the age
range, could be administered to the whole group simultaneously, could be completed
quickly, were a measure of the current state of participants, and could be used to
measure immediate effects. The Perceived Stress Scale (PSS) was administered to
measure stress (Cohen, 1994). Attention was measured using the Necker Cube Pattern
Control Task (see Appendix D). Additionally, two content knowledge assessments were

63
designed to measure content knowledge of semi-hardwood propagation (see Appendix
B) and plant nutrients (see Appendix C).
Perceived Stress Scale (PSS)
The initial 14-item PSS (PSS 14) was developed to use with community samples
(Cohen, Kamarck, & Mermelstein, 1983; Cohen & Williamson, 1988). Both the items
and response options are easily understandable and general in nature making this
instrument suitable for individuals from a variety of subpopulations with at least a junior
high school education. The instrument was found to have adequate internal and test–
retest reliability with correlations to multiple self-report and behavior criteria. The test-
retest reliability was stronger over a short period of two days with substantial
correlations than over a longer period of six weeks with more moderate correlations.
Cohen and Williamson (1988) noted the predictive validity of the scale is expected to
decrease quickly after four to eight weeks. Additionally, the PSS only takes a few
minutes to administer and is easily scored. This instrument was concluded to be a short
and easy “measure of the degree to which situations in one’s life are appraised as
stressful” (Cohen et al., 1983, p. 394).
Stress is not based exclusively on the intensity of the threat from a specific event
(Cohen & Williamson, 1988). Instead it is dependent on personal and contextual factors
such as available coping resources. Therefore, the PSS does not require participants to
appraise a specific situation, but rather asks broad questions allowing sensitivity for
nonoccurrence of events, ongoing life circumstances, carryover of stress from events
experienced by family and friends, and apprehension for future events.
Cohen and Williamson (1988) used a probability sample of the United States to
provide psychometric evidence of reliability and validity of the PSS 14 as well as two

64
shorter versions, the PSS 10 and the PSS 4. The PSS 14 was the original instrument
designed by Cohen and colleagues (1983). During the psychometric evaluation of this
scale, Cohen and Williamson (1988) created the PSS 10 by dropping items 4, 5, 12,
and 13 from the original scale due to their low factor loadings. Additionally, they tested a
more abbreviated version the PSS 4, which had been used in follow-up interviews in
previous studies (Cohen, 1986; Cohen et al., 1983). The PSS 4 utilized items number 2,
6, 7, and 14 from the original instrument.
Table 3-3 provides a summary of their factor analysis and reliability findings for
the three PSS. The PSS 10 explained a higher percentage of the variance and provided
a higher internal reliability than the other two scales. Furthermore, correlations between
the PSS 10 and other measures of stress, health, health service utilization, health
behaviors, life satisfaction, and help seeking were equivalent to the PSS 14. For these
reasons, Cohen and Williamson (1988) recommended the PSS 10 for use in future
research; however, they did acknowledge that the PSS 4 would be suitable in
circumstances requiring a very brief measurement of perceived stress. A more recent
review of psychometric evidence of the PSS supported the recommendations of Cohen
and Williamson (1988) and recognized the PSS 10 as the superior form of the scale to
use (Lee, 2012).
For the purposes of this study, the PSS 10 was used to measure perceived
stress of participants. The wording for each prompt was changed from, “In the last
month,” to “Currently,” to assess the short-term changes in stress experienced by
students. This instrument was pilot tested with a sample from the population and found
to have suitable reliability. The PSS score was calculated by reverse coding responses

65
to items four, five, seven, and eight, the positively stated items, and summing the
responses across all scale items (Cohen, 1994; Cohen & Williamson, 1988). Table 3-4
provides a portion of the norm table for the PSS 10 from the Cohen and Williamson
(1988) study.
Cronbach’s alpha was utilized to determine the reliability of the PSS (Field,
2013). The scale was found to have strong internal consistency with Cronbach’s alpha
scores ranging from 0.871 to 0.916. Table 3-5 provides a list of all the Cronbach’s alpha
results.
Pearson’s Product-Moment Correlation was used to assess the test-retest
reliability of the PSS. Test-retest was run between day one pretest and posttest, day
two pretest and posttest, day one and two pretest, and day one and two posttest. Before
running the analysis, the data were evaluated to ensure it met the assumptions for the
test.
Assumptions one and two were met through the study design. Both variables
were continuous and the variables were paired (Field, 2013). Scatter plots were used to
assess assumptions three and four. A linear relationship was found between the
variables being compared, and no outliers were identified. Bivariate normality,
assumption five, was evaluated using the property that both variables will be normally
distributed if bivariate normality exists (Field, 2013). PSS scores for each variable were
normally distributed as assessed by Shapiro-Wilk’s test (p > .05) with the exception of
Day 2 pretest scores (p = 0.037; Field, 2013). Visual assessment of Q-Q Plots showed
normality across all the variables. Additionally, normality was assessed for the data
when separated into students receiving the treatment and those in the non-ag control

66
group. The control group did not meet the requirements for normality as assessed by
the Shapiro-Wilk’s test (p > .035); however, visual inspection of the Q-Q plots indicated
normality (Field, 2013).
Table 3-6 provides the test-retest reliability scores for each of the matchings
listed above. According to Cohen (1988) correlations over 0.5 indicate a large or strong
correlation. All correlations were greater than 0.73; therefore, a strong positive
correlation was found among all variables compared (Cohen, 1988). Furthermore, all
correlation coefficients were above the r = 0.70 level required to establish acceptable
reliability (Litwin, 2003). When the correlations were for the experimental and control
groups were compared. The test-retest reliability for the pretest/posttest of the PSS was
r = 0.80 for the experimental groups and r = 0.92 for the control students.
Necker Cube Pattern Control Test
The Necker Cube (see Figure 3-1) is a three-dimensional wire-framed cube
whose perceived orientation spontaneously reverses when viewed for more than a few
seconds (Cimprich, 1990; Hartig et al., 2003; Kaplan, 1995; Tennessen & Cimprich,
1995). Directed attention to one orientation will slow the rate in which the reversals
occur (Kaplan, 1995). Since maintaining focus on a particular orientation requires the
inhibition of the alternative orientation, the Necker Cube has been used as a measure of
directed attention (Cimprich, 1990; Kaplan, 1995; Tennessen & Cimprich, 1995). A
decreased ability to inhibit pattern reversals can be attributed to directed attention
fatigue (Hartig et al., 2003; Kaplan, 1995; Tennessen & Cimprich, 1995). Cimprich
(1990) stated that the Necker Cube “appears to be sensitive to subtle changes in
attention capacity over time” (p. 96). Additionally, Hartig et al. (2003) found the Necker
Cube to be effective at detecting differences after only 20 minutes of a given treatment.

67
The Necker Cube has been used in a variety of studies evaluating the impact of
environment on attention (Cimprich, 1990; Hartig et al., 2003; Kaplan, 1995; Sahlin,
Lindegård, Habzibajramovic, Grahn, Matuszczyk, & Ahborg, 2016; Tennessen &
Cimprich, 1995). Practice effects for the Necker Cube Pattern Control Test were found
when used with high school students (Beer, 1989).
To administer the Necker Cube Pattern Control task, participants were given a
sheet of paper with a Necker Cube drawing. The instructors gave an explanation of how
the perspective of the cube would shift along with a virtual demonstration from the
Environmental Psychology Lab at the University of Michigan (De Young, 2016), and
participants were given time to familiarize themselves with the shift in perspectives. The
research team made sure each participant reported that they were able to see the
perspective reversal. Baseline data were collected from participants by asking them to
look at the Necker Cube for 30 seconds and tally the number of times the pattern
spontaneously reversed. Then the instructor directed the participants to focus their
attention and hold the cube in a given perspective for as long as possible. Again,
participants tallied the reversals over a 30 second period to complete the pretest.
Following the treatment, students were again asked to hold the cube in the same
orientation for as long as possible and tally the number of times it reversed over a 30
second period. The Necker Cube scores are the percent reduction from the baseline
data to the holding conditions (Cimprich, 1993; Williams et al., 2000). A higher score
indicated a higher directed attention capacity. In order to determine the change in
directed attention capacity across the treatment, difference scores were calculated by
subtracting Necker Cube posttest from Necker Cube pretest each day. Positive

68
difference scores indicate an increased directed attention capacity, whereas, negative
scores denote a decrease directed attention capacity, or an increased directed attention
fatigue.
Content Knowledge Tests
The researcher developed two content knowledge tests designed to assess the
knowledge of students following each lesson. The assessments utilized multiple choice
and short answer questions aligned to the lesson objectives. The content knowledge
tests were reviewed by a panel of experts, including current high school agricultural
teachers and teacher education professors, to ensure content validity.
Procedures and Data Collection
A proposal was submitted to the University of Florida Institutional Review Board
(IRB-02) for approval of the study before any data were collected. Possible participants
were provided with the purpose of the study, the procedures for the study, the voluntary
nature of participation, and potential risks and benefits associated with the study
through an assent form (Appendix F) for student agreement to participate in the study
and an informed consent form (Appendix G) for parent permission to participate in the
study and. Students had to return a completed informed consent and assent form to
participate.
Development of Instructional Materials and Training
The researcher collaborated with the participating teachers to identify two
lessons of equivalent complexity that could be taught in both the classroom and the
greenhouse setting. The teachers selected Standard 14.0, “demonstrate plant
propagation techniques” (FDOE, 2017a, p. 15), benchmark 14.04, “demonstrate
propagating by sexual and asexual methods” (FDOE, 2017a, p. 15). The teachers

69
requested semi-hardwood prorogation be the technique taught. The second standard
identified by the teachers was 15.0, “identify growing media and fertilizers” (FDOE,
2017a, p. 15), benchmarks 15.02, “identify nutritional needs of plants” (FDOE, 2017a, p.
15) and 15.03, “identify symptoms of nutritional deficiencies and toxicities of plants”
(FDOE, 2017a, p. 15). The researcher developed a lesson plan and instructional
materials on semi-hardwood propagation (Appendix B) and plant nutrients and
deficiencies aligned to course standards, which could be delivered in both the
classroom and greenhouse settings. Additionally, the researcher created one content
knowledge assessment for each lesson that could be delivered to all participants. Once
the materials were created, they were reviewed by the participating teachers to ensure
proper alignment to course standards. Finally, the instructional materials and
assessments were reviewed by a panel of experts to confirm content validity and
equivalence of complexity.
Three agricultural education master’s degree students certified to teach high
school agriculture were recruited to serve as instructors and deliver the instruction
throughout the study. These instructors were given instruction in the content knowledge
and pedagogy of the lessons and observed the lesson taught by the researcher to
ensure equivalence of comprehension of the material they would be delivering and
instructional methods. The researcher answered any questions. The instructors were
told not to share any information on their instructional materials or experiences with the
other instructors, students, or others until the final debriefing following the collection of
all data.

70
Instruction
The schedule of instruction is outlined in Table 3-7. During the initial replication of
this study, the research team traveled to each school for one day. Students in each
class were randomly assigned to one of two groups. All students completed the pretest
assessments of attention and stress. Students in Group 1 received the experimental
treatment, which consisted of instruction in the greenhouse environment. Students in
Group 2 received the comparison treatment, which consisted of instruction in the
agriscience classroom. Two trained instructors from the research team delivered the
designed curriculum on semi-hardwood propagation. Following the treatment, all
students completed the posttest measures of attention and stress. The following day the
classroom teacher administered a content knowledge assessment to all students. The
research team debriefed over each break and at the end of the day to discuss any
issues that arose and to record qualitative observations about the implementation and
student feedback. The lead researcher kept a reflexive journal to record items
discussed (Harding, 2013; Yin, 2016).
For the second replication, the research team traveled to each school for a
second day. Students remained in their initial randomly-assigned groups. They followed
the same protocol using the nutrient deficiency lesson, except they were assigned to the
opposite treatment group from the initial visit. Instructors taught in the same
environment for each lesson to maintain consistency of instruction.
Data Analysis
The data collected entered into an Excel worksheet by the researcher and
imported into the Statistical Package for the Social Science (SPSS) 22.0 for Windows
for statistical analysis. To address threats to statistical conclusion validity, the
71
researcher chose tests of high power to detect relationships present. Additionally, all
assumptions for the statistical tests were checked and found to be met prior to running
the statistical analysis. Specific analysis performed to address each objective is
described below.
Objective 1
The first objective was describe the demographic characteristics of the
participants in this study. Descriptive statistics, including frequencies and means, were
utilized to report demographic characteristics of the sample. The data set was split
based upon group in order to provide a more detailed report of these demographics and
compare the groups.
Objective 2
Objective two aimed to identify the stress levels experienced by high school
agriculture students. The stress levels of students were determined by their day one
pretest scores on the PSS. The mean PSS score was calculated using SPSS and
reported with its standard deviation. Mean PSS scores were calculated based upon
demographic data to compare with the PSS norm data presented in Table 3-4.
Additionally, independent t-tests were utilized to indicate if there were statistical
differences in the stress levels of different groups of agriscience students including
males and females, School A and School B, group one and group two, as well as
agriscience and control students. Before performing the independent samples t-test,
assumptions were checked (Field, 2013).
The study design met the first three assumptions. The dependent variable was
the PSS score, which was a continuous variable. The independent variables were
categorical with two groups. Observations were independent of each other. Boxplots
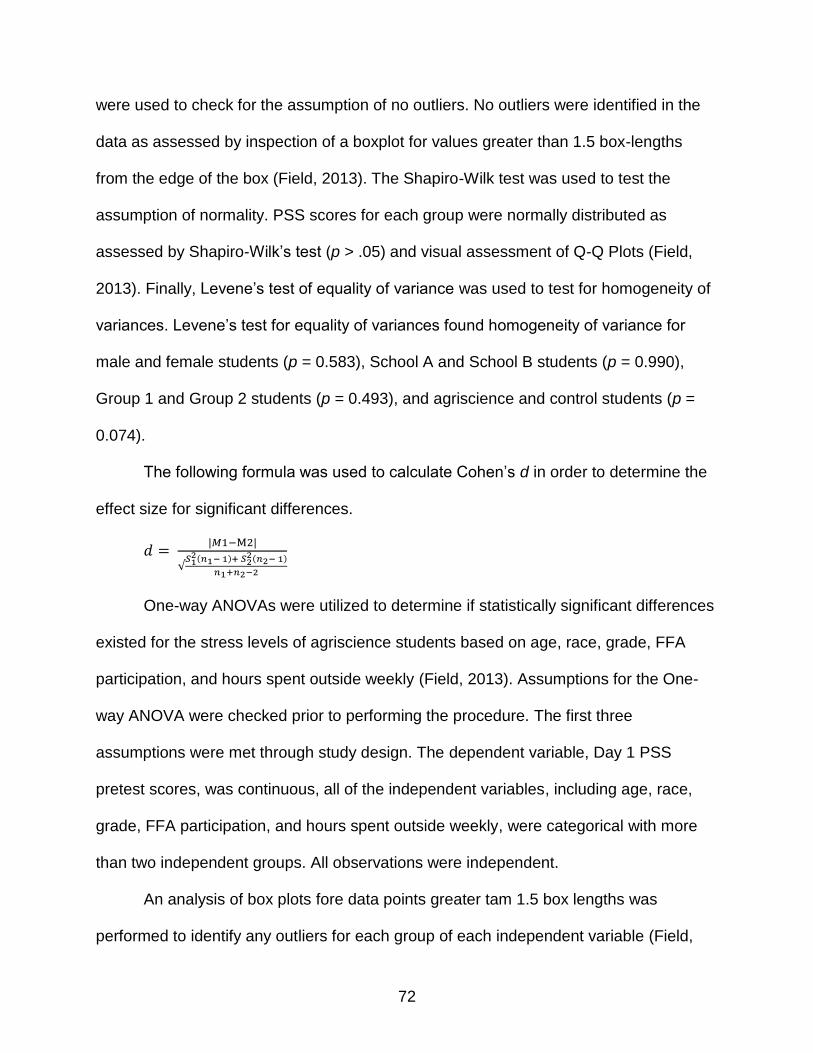
72
were used to check for the assumption of no outliers. No outliers were identified in the
data as assessed by inspection of a boxplot for values greater than 1.5 box-lengths
from the edge of the box (Field, 2013). The Shapiro-Wilk test was used to test the
assumption of normality. PSS scores for each group were normally distributed as
assessed by Shapiro-Wilk’s test (p > .05) and visual assessment of Q-Q Plots (Field,
2013). Finally, Levene’s test of equality of variance was used to test for homogeneity of
variances. Levene’s test for equality of variances found homogeneity of variance for
male and female students (p = 0.583), School A and School B students (p = 0.990),
Group 1 and Group 2 students (p = 0.493), and agriscience and control students (p =
0.074).
The following formula was used to calculate Cohen’s d in order to determine the
effect size for significant differences.
𝑑 = |𝑀1−M2|
√𝑆1
2(𝑛1− 1)+ 𝑆22(𝑛2− 1)
𝑛1+𝑛2−2
One-way ANOVAs were utilized to determine if statistically significant differences
existed for the stress levels of agriscience students based on age, race, grade, FFA
participation, and hours spent outside weekly (Field, 2013). Assumptions for the One-
way ANOVA were checked prior to performing the procedure. The first three
assumptions were met through study design. The dependent variable, Day 1 PSS
pretest scores, was continuous, all of the independent variables, including age, race,
grade, FFA participation, and hours spent outside weekly, were categorical with more
than two independent groups. All observations were independent.
An analysis of box plots fore data points greater tam 1.5 box lengths was
performed to identify any outliers for each group of each independent variable (Field,

73
2013). No outliers were found for age. One outlier was found in the other minority
category of race. Three outliers were identified in the 11th grade group for grade. One
outlier was located in the not at all active category of FFA participation, and one outlier
was detected in the 13-24 hours of the hours spent outside weekly variable. All outliers
were verified to ensure no data entry errors were made. Since, it was not possible to
determine if the errors were due to measurement errors or genuinely unique values, the
researcher decided to leave the values, as they were likely to represent unique values
(Field, 2013).
The Shapiro-Wilk’s test (p > 0.05) and visual inspection of the Q-Q plots were
used to determine if the PSS scores were normally distributed for each group of each
independent variable (Field, 2013). PSS scores were normally distributed for ages 14,
15, 16, 17, 18, and 19; grades 9th, 10th, 11th, and 12th; and FFA participation of not at all
active, somewhat active, active, and very active. PSS scores were normally distributed
for the 0-12 and 13-24 categories but was not met for the 25 or more group (p = 0.05).
For the race variable, normality was met in the white, Black, and Hispanic/Latino
groups, but not in the other minorities group (p = 0.03). Although the One-way ANOVA
is robust to normality deviations when sample sizes for each group are equal, it is less
robust for unequal groups (Lix, Keselman, & Keselman, 1996). Since the groups for
these two variables did not have equal sample sizes, the non-parametric test Kruskal-
Wallis H test was not appropriate because the race variable was neither continuous nor
ordinal (Laerd Statistics, 2015), and one of the previously identified outliers fell in the
other minorities group, the researcher removed that outlier and ran the normality tests
again. The new normality test indicated that the 25 or more group of the hours spent

74
outside weekly met the normality requirements with a Shapiro-Wilk test (p > 0.05). The
other minorities group became more normal with a Shapiro-Wilk test of p = 0.4 and the
data points on the Q-Q plot in closer alignment. Additionally, this group met the less
powerful Kolmogorov-Smirnov test for normality (p > 0.05, Field, 2013). The researcher
proceeded with the One-way ANOVA, noting the limitations of not meeting the
assumption of normality. These limitations include, inaccurate significance tests, and
less than optimal model parameters (Field, 2013).
Homogeneity of variance was tested using Levene’s test for equality of variance
(Field, 2013). Homogeneity of variance was found for age (p = 0.65), race, (p = 0.09),
grade (p = 0.45), FFA participation (p = 0.58), and hours spent outside weekly (p =
0.08). After all assumptions were met or accounted for, One-way ANOVAs were run for
each of the dependent variables. Where significant differences were found, Tukey post
hoc tests were used for multiple comparisons (Field, 2013). Since the groups were of
unequal sizes, the Tukey-Kramer statistic was reported (Laerd Statistics, 2015).
Additionally, models for significant difference were run as a univariate general linear
model to calculate the eta squared (2) effect size.
Objective 3
Objective three investigated whether a difference in student stress levels exists
between students instructed in the classroom setting and those instructed in a natural
agricultural laboratory setting. The research hypothesis related to this objective states,
students receiving instruction in a natural agricultural laboratory setting will have a
greater decrease in stress levels than students receiving instruction in the classroom
setting.
75
To determine the change in stress for each day, PSS difference scores were
calculated by subtracting PSS posttest scores for each day from PSS pretest score for
that day. In order to test the hypothesis, the data were structured into a long form format
and a univariate general linear mixed model was completed. The dependent variable
was the PSS difference score. The fixed variables were day, treatment order, and day-
treatment order interaction. Student ID was the random factor.
The data were checked to ensure it met the assumptions of general linear
models. The dependent variable was continuous. The PSS scores were normally
distributed (p > 0.05), as assessed by the Shapiro-Wilk’s test of normality on the
studentized residuals (Laerd Statistics, 2015). However, the PSS difference scores did
not meet the assumption of normal distribution in the group receiving the treatment first
as judged by the Shapiro-Wilk test, D(49) = 0.91, p < 0.01, but did meet the assumption
for those who received treatment second D(40) = 0.95, p = 0.07. The treatment first
group had positive skewness 1.13 SD = 0.34 and positive kurtosis of 2.35 SD = 0.67.
The treatment second group had positive skewness 0.74 SD = 0.37 and positive
kurtosis of 0.62 SD = 0.73. The Q-Q plots showed most of the data points along the line
of normality with a couple deviations for low and high scores. The PSS difference
scores were significantly not normal for Day1, D(56) = 0.93, p < 0.01, and Day 2, D(33)
= 0.90, p = 0.01. The Day 1 PSS differences scores had positive skewness of 1.0, SD =
0.32 and positive kurtosis of 2.5 SD = 0.63, while the Day 2 scores had a positive
skewness of 1.0 SD = 0.41 and positive kurtosis of 0.88 SD = 0.80. Since the general
linear model is robust to violations of normality, the data were analyzed without further
adjustments (Field, 2013; Keith, 2006).

76
A univariate regression was run with the PSS difference scores as the dependent
variable and day, treatment order, and day*treatment order as the fixed factors.
Predicted values, unstandardized residuals, standardized residuals, leverage values,
and Cook’s distance values were saved for further assumption checking. An analysis of
standardized residuals identified 3 cases with standardized residuals < -3.0 and one
case with a standardized residual >3.0, indicating possible outliers (Keith, 2006). These
cases were flagged to follow them through the tests for leverage and influence. No
cases were determined to have a leverage value > 0.2 or a Cook’s distance value > 1.
Since no leverage or influence issues were found and the PSS instruments of the
participant who had been flagged as an outlier and to ensure the scores were properly
calculated, the researcher decided not to eliminate any cases.
Bivariate correlations showed no significant correlations, signifying the
assumption of noncollinearity was met. Normality of errors was checked by creating a
histogram and Q-Q plot of the unstandardized residuals and checking the Shapiro-Wilk
test (Keith, 2006). The histogram showed normal distribution, however, the Q-Q plot
showed some extreme values at both the high and low ends. The residuals for the PSS
difference scores were statistically not normally distributed D(163) = 0.94, p <0.01, thus
violating an assumption and providing a limitation to the analysis. However, the general
linear model is robust to violations of normality (Field, 2013; Keith, 2006). Independence
of errors was analyzed by inspecting the boxplots of residuals for each group. No major
variations across the groups was identified. Homoscedasticity of errors was evaluated
by plotting the residuals against the predicted Y. Additionally the predicted variables
were binned and the variances of each group compared. The ratio of the highest group

77
to the lowest groups was 1.85, below the cutoff of 10, which indicates acceptable
homoscedasticity (Keith, 2006).
To provide additional explanation of the difference scores, the analysis was split
by treatment group to determine the changes associated with the PSS difference
scores, PSS pretest score minus PSS posttest score, each day with each environment.
A new variable was computed to categorize the change into three categories: no
change, decrease in attention, and increase in attention. Frequencies were completed
for these categories for each group for day.
Objective 4
Objective four sought to determine if a difference in student attention exists
between students instructed in the classroom setting and those instructed in a natural
agricultural laboratory setting. The research hypothesis developed for testing stated,
students receiving instruction in a natural agricultural laboratory setting will experience a
greater increase in attention scores than students receiving instruction in the classroom
setting. The null hypothesis tested was that there would be no difference in the change
of attention scores for students taught in the natural laboratory setting when compared
to students taught in the agriscience classroom.
Several extreme outliers were present in the initial dataset. The errors were not
due to data entry; however, the researcher was unable to determine if the errors were
due to measurement errors or genuinely unusual values (Keith, 2006; Laerd Statistics,
2015). Previous research using the Necker Cube removed outliers ± 3 𝑆𝐷 from the
mean (Jaggard, 2014). In order to address the outliers, the researcher determined the
mean and standard deviation for each of the Necker Cube pretest and posttest
variables. The researcher then calculated three times the standard deviation of each of

78
these scores (see Table 3-8) and identified and removed scores above this value. Table
3-9 outlines the number of extreme values and the extreme values removed from each
test.
For each day, Necker Cube posttest scores were subtracted from Necker Cube
pretest to determine the change in attention for each day. The data were structured into
a long form format and a univariate general linear mixed model was completed to test
the hypothesis. The dependent variable was the attention difference score. The fixed
variables were day, treatment order, and day*treatment order interaction. Student ID
was the random factor.
The data were checked to ensure it met the assumptions of general linear
models. The dependent variable was continuous. The Shapiro-Wilk test was used to
determine if attention scores met the assumption of normality (Field, 2013; Keith, 2006).
Attention difference scores in the group receiving the treatment the first day, D(49) =
0.84, p < 0.01, and the group receiving the treatment the second day, D(40) = 0.09, p <
0.01, were both significantly not normal. The treatment first group had negative
skewness -1.86 SD = 0.34 and positive kurtosis of 4.85 SD = 0.67. The treatment
second group had negative skewness -1.27 SD = 0.37 and positive kurtosis of 2.69 SD
= 0.73. The Q-Q plots showed most of the data points along the line of normality with a
couple deviations for low and high scores. The attention difference scores were not
normally distributed for Day 1, D(56) = 0.86, p < 0.01, or Day 2, D(33) = 0.90, p < 0.01.
The Day 1 attention differences scores had negative skewness of -1.82, SD = 0.32 and
positive kurtosis of 5.88 SD = 0.63, while the Day 2 scores had a negative skewness of
-1.15 SD = 0.41 and positive kurtosis of 1.45 SD = 0.80. Since the general linear model

79
is robust to violations of normality, the data were analyzed without further adjustments
(Field, 2013; Keith, 2006).
A univariate regression was run with the attention difference scores as the
dependent variable and day, treatment order, and day*treatment order as the fixed
factors. Predicted values, unstandardized residuals, standardized residuals, leverage
values, and Cook’s distance values were saved for further assumption checking. An
analysis of standardized residuals identified 4 cases with standardized residuals < -3.0,
indicating possible outliers (Keith, 2006). These cases were flagged to follow through
the tests for leverage and influence. An analysis of leverage and Cook’s distance values
resulted in no leverage values > 0.2 or Cook’s distance values > 1, indicating no cases
of extreme influence. Since influence was not an issue, the researcher decided not to
eliminate any of the outliers.
Bivariate correlations showed no significant correlations, signifying the
assumption of noncollinearity was met (Keith, 2006). Normality of errors was checked
by creating a histogram and Q-Q plot of the unstandardized residuals and checking the
Shapiro-Wilk test (Keith, 2006). The histogram showed a lightly negative skewed
distribution. Furthermore, the Q-Q plot showed several extreme values for low scores
and other data points not aligning with the line. The residuals for the attention difference
scores were statistically not normally distributed D(151) = 0.84, p <0.01. This violated
an assumption and provided a limitation to the analysis. However, the general linear
model is robust to violations of normality (Field 2013; Keith, 2006). Independence of
errors was analyzed by inspecting the boxplots of residuals for each group. No major
variations across the groups was identified. Homoscedasticity of errors was evaluated

80
by plotting the residuals against the predicted Y. Additionally, the predicted variables
were binned and the variances of each group compared. The ration of the highest group
to the lowest groups was 7.38, below the cutoff of 10, which indicates acceptable
homoscedasticity (Keith, 2006).
A new variable was computed to categorize the attention difference scores into
three change categories: no change, decrease in attention, and increase in attention.
The analysis was split by treatment group to determine the changes associated with
each environment. Frequencies were completed for these categories for each group for
day.
Objective 5
Objective 5 was to determine if a difference in student content knowledge exists
between students instructed in the classroom setting and those instructed in a natural
agricultural laboratory setting. The hypothesis stated, content knowledge scores
between students instructed in the in a natural agricultural laboratory setting will be
statistically significantly higher than students instructed in a classroom setting. A paired-
samples t-test was run to test the null hypothesis that content knowledge scores would
not be statistically significantly different based upon environment.
Data were checked to ensure it met the assumptions of the test. Assumptions
one and two were met through the study design. The dependent variable was a
continuous variable and the independent variable was categorical with two related
groups (Field, 2013). Assumption three was assessed through the use of boxplots. No
outliers were present as assessed by inspection of a boxplot for values greater than 1.5
box-lengths from the edge of the box (Laerd Statistics, 2015). Assumption four
normality, was met as determined by the Shapiro-Wilk’s test (p = 0.51) and visual

81
assessment of the Q-Q plots (Field, 2013). Cohen’s d was calculated to report effect
size by dividing the mean difference by the standard deviation for the difference using
the following equation,
𝑑 = 𝑀
𝑆𝐷 .
Additionally, the data were structured into a long form format and a univariate
general linear mixed model was completed to test the hypothesis. The dependent
variable was the content knowledge score. The fixed variables were day, treatment
order, and day*treatment order interaction. Participant ID was the random factor.
The data were checked to ensure it met the assumptions of general linear
models. The dependent variable was continuous. To determine if content knowledge
scores met the assumption of normality, the Shapiro-Wilk test was used (Field, 2013;
Keith, 2006). Content knowledge scores for the group receiving the treatment the first
day, D(49) = 0.96, p = 0.10, and the group receiving the treatment the second day,
D(40) = 0.95, p = 0.08, did not deviate significantly from normal. Inspection of the Q-Q
plots confirmed this with most of the data points along the line of normality with a couple
deviations for lower scores. The content knowledge scores were significantly not normal
on Day 1, D(56) = 0.95, p = 0.03, but did not deviate significantly form normal on Day 2,
D(33) = 0.94, p = 0.08. The day 1 content knowledge scores had positive skewness of
0.06, SD = 0.32 and negative kurtosis of -0.54 SD = 0.63. Since the general linear
model is robust to violations of normality, the data were analyzed without further
adjustments (Field, 2013; Keith, 2006).
A univariate regression was run with the content knowledge scores as the
dependent variable and day, treatment order, and day*treatment order as the fixed

82
factors. Predicted values, unstandardized residuals, standardized residuals, leverage
values, and Cook’s distance values were saved for further assumption checking. An
analysis of standardized residuals indicated, no outliers with standardized residuals < -
3.0 or > 3.0 (Keith, 2006). All leverage values were < 0.2, signifying no leverage issues.
None of the Cook’s distance values were > 1, denoting no cases of extreme influence.
A significant correlation was found between day and content knowledge (r = -
0.33, p = 0.01) violating the assumption of noncollinearity (Keith, 2006). Normality of
errors was checked by creating a histogram and Q-Q plot of the unstandardized
residuals and checking the Shapiro-Wilk test (Keith, 2006). The histogram illustrated a
normal distribution, which was verified by visual inspection of the Q-Q plot and the
Shapiro-Wilk test D(120) = 0.99, p = 0.32. Homoscedasticity of errors was evaluated by
plotting the residuals against the predicted Y. Additionally, the predicted variables were
binned and the variances of each group compared. The ration of the highest group to
the lowest groups was 2.66, below the cutoff of 10, which indicates acceptable
homoscedasticity (Keith, 2006).
Chapter Summary
This study used a counterbalanced, randomized subjects, pretest-posttest,
control group design to examine the impact of natural agricultural laboratory settings on
student stress levels and attention capacity. The population of interest was high school
agricultural education students enrolled in the horticulture programs. A sample of 136
(86 in the experimental groups and 50 in the control group) students who completed
IRB assent and consent policies from two Florida high schools was utilized to meet the
objectives of this research. After obtaining IRB approval, the Perceived Stress Scale,
the Necker Cube Pattern Control Test assessments were administered to all students to

83
provide baseline, pretest data. Researcher-developed instruction was delivered by
trained instructors to randomly assigned groups of students in each course. One group
received instruction in the classroom, and the other group received instruction in the
greenhouse. Following instruction, the students completed the same stress and
attention assessments as a posttest. The following day the teacher administered a
content knowledge posttest. The data were analyzed using descriptive statistics, paired
sample t-tests, and general linear models. Although the researcher took measures to
address threats to validity, the specific population limits generalizability beyond this
sample.
Table 3-1. Counterbalanced, Randomized Subjects, Pretest-Posttest Control Group Design (Ary et al., 2010)
Replication Pretest Experimental Treatments
Posttest Treatment Comparison Control
(R) 1 Y1 Group 1 Group 2 Y2
(R) 2 Y1 Group 2 Group 1 Group 3 Y2
Column mean
Column mean
Column mean
Note. Modified from (Ary et al., 2010). R = random assignment of subjects to group Y1 = Measure of dependent variables before treatment\ Y2 = Measure of dependent variables after treatment
Table 3-2. Gender and race of students by school for 2015-2016 school year (FDOE, 2017b)
School A N (%)
School B N (%)
Gender Male 285 (51.4) 858 (50.2) Female 269 (48.6) 852 (49.8)
Race White, Non-Hispanic 166 (61.9) 400 (46.0) Black, Non-Hispanic 51 (17.7) 238 (29.1) Hispanic/Latino 38 (15.9) 108 (13.7)

84
Multiracial, Non-Hispanic 12 (3.8) 54 (5.8) American Indian/ Alaskan Native <10 (<10) <10 (0.9) Asian, Non-Hispanic <10 (<10) 45 (4.5) Hawaiian, Pacific Islander 0 0
Table 3-3. Variance and reliability findings of 3 versions of PSS (Cohen & Williamson, 1988)
Test Total Variance (%) Internal Reliability ()
PSS 14 41.6 0.75
PSS 10 48.9 0.78
PSS 4 45.6 0.60
Table 3-4. Norm table for the PSS 10 from L. Harris Poll gathered information on 2, 387
respondents in the U.S. (Cohen & Williamson, 1988)
Category N M S. D.
Gender Male 926 12.1 5.9 Female 1406 13.7 6.6
Age 18-29 645 14.2 6.2 30-44 750 13.0 6.2 45-54 285 12.6 6.1 55-64 282 11.9 6.9 65 & Older 296 12.0 6.3
Race White 1924 12.8 6.2 Hispanic 98 14.0 9.9 Black 176 14.7 7.2 Other minority 50 14.1 5.0
Table 3-5. Cronbach’s alpha scores for Perceived Stress Scale
PSS Delivery Cronbach’s alpha
Day 1 pretest (n = 134) 0.871 Day 1 posttest (n = 136) 0.865 Day 2 pretest (n = 84) 0.916 Day 2 posttest (n = 84) 0.914
Table 3-6. PSS test-retest reliability using Pearson’s Correlation
Variables N r p
Day 1 Pretest to Day 1 Posttest 128 0.856 <0.01 Day 2 Pretest to Day 2 Posttest 82 0.914 <0.01 Day 1 Pretest to Day 2 Pretest 82 0.790 <0.01 Day 1 Posttest to Day 2 Posttest 81 0.731 <0.01

85
Table 3-7. Instruction and data collection schedule
Replication Lesson School A School B
Day 1 Semi-hardwood propagation 12/01/2017 12/04/2017
Day 2 Nutrient Deficiencies 12/07/2017 01/08/2018
Control N/A 12/07/2017 01/10/2018
Table 3-8. Necker Cube mean scores, standard deviations, three standard deviations, and acceptable range values
Variables M SD 3SD Acceptable Range
Day 1 Pretest 3.82 2.78 8.34 0 – 12 Day 1 Posttest 6.30 6.84 20.52 0 – 26 Day 2 Pretest 4.83 5.15 15.45 0 – 19 Day 2 Posttest 9.64 9.79 29.38 0 – 39
Table 3-9. Necker Cube, extreme values removed
Variables # Values Removed Values removed
Day 1 Pretest 1 19 Day 1 Posttest 3 44, 42, 29 Day 2 Pretest 2 42, 21 Day 2 Posttest 3 46, 43, 40

86
Figure 3-1. Necker Cube with possible orientations

87
CHAPTER 4 RESULTS
Overview
As students suffer from the impacts of elevated stress and directed attention
fatigue, restorative environments may provide an opportunity to counteract the impacts
of stress and increase attention capacity. The purpose of this study was to determine
the influence of natural agricultural laboratory settings on stress and attention levels of
high school students. The following research objectives were developed to guide this
study:
1. Describe the demographic characteristics of the participants in this study;
2. Identify the stress levels experienced by high school agriculture students;
3. Determine if a difference in the change of student stress levels exists between students instructed in the classroom setting and those instructed in a natural agricultural laboratory setting;
4. Determine if a difference in the change of student attention capacity exists between students instructed in the classroom setting and those instructed in a natural agricultural laboratory setting; and
5. Determine if a difference in student content knowledge exists between students instructed in the classroom setting and those instructed in a natural agricultural laboratory setting.
Based on the research objectives the following research hypotheses were
developed.
H1: Students receiving instruction in a natural agricultural laboratory setting will have a greater decrease in stress levels compared to students receiving instruction in the classroom setting.
H2: Students receiving instruction in a natural agricultural laboratory setting will have a greater increase in attention scores than students receiving instruction in the classroom setting.
H3: Students receiving instruction in a natural agricultural laboratory setting will have higher content knowledge scores than students receiving instruction in the classroom setting.

88
A counterbalanced pretest posttest control group design was used to investigate
these objectives and test the hypotheses. This chapter presents the findings of the
study from the results of the instrumentation. The chapter discusses participation rate
and measures taken to overcome the limitations of the study. It then presents the
demographic characteristics of the participants. Finally, the chapter addresses the
findings related to each objective.
Participation Rate, Limitations, and Reliability
Counterbalanced designs present several limitations (Ary et al., 2010; Campbell
& Stanley, 1963). A possible source of concern for internal validity in the
counterbalanced design is the interaction of selection and other internal threats, such as
maturation (Campbell & Stanley, 1963). Possible concerns impacting external validity in
counterbalanced designs include, interaction for testing and treatment, interaction of
selection and treatment and reactive arrangements. Additionally, the counterbalance
design does not provide the ability to control for multiple treatment interface (Campbell
& Stanley, 1963). Main effects appearing for group, occasion, or treatment may actually
be “a significant interaction of the complex form between the other two” (Campbell &
Stanley, 1963, p.51). Consequently, inferences on main effects need to be considered
based upon the plausibility of rival hypotheses.
A carryover effect of the treatment could impact future treatments (Ary et al.,
2010). This study was unable to assess if a carryover effect took place or prevent a
carryover effect from taking place. Equivalence of learning material for each replication
is required for counterbalanced designs (Ary et al., 2010). Although the researchers
worked with the teachers to identify units which addressed standards of equivalent
difficulty, students may view the difficulty of the standards differently than the teachers.

89
This concern was underscored by a student at School A who told one of the instructors
that the second lesson on nutrients was more stressful, because it required the students
to do more work with a less hands-on learning activity. Finally, participants in
counterbalanced design could become bored with the repeated use of instruments used
during the testing (Ary et al., 2010). This limitation was highlighted by several students
complaining about taking the same instruments multiple times. Additionally, some
students appeared not to put effort into answering all of the questionnaire questions
individually and simply circled the same response through the entire questionnaire.
For the experimental groups of agriscience students, a participation rate of 47%
was achieved with 86 of a possible 183 students submitting informed parental consent
forms, completing student assent forms, and participating in both days of the study. The
group receiving the treatment on Day 1 had 44 students, and the group receiving
treatment on Day 2 had 42 students. A participation rate of 43%, 53 out of a possible
123 students, was achieved for the control group of non-agriscience students.
The instruments used for this assessment were found to be reliable. The PSS
had an internal reliability ranging from = 0.87 to = 0.92 and a test-retest reliability
ranging from r = 0.73 to r = 0.91. The internal reliability for the Perceived
Restorativeness Scale Day 1 was = 0.91 and Day 2 was = 0.89.
Results by Objective
Objective 1
Objective one was to describe the demographic characteristics of the
participants in this study. Participants were asked to provide the year in which they
were born, their gender, their race/ethnicity, their grade level, the number of hours

90
they spent outside weekly, and their FFA participation. Table 4-1 presents the
responses of the participants.
The study had a relatively equal number of male and female participants (males
= 52.1%). However, Group 1 had a lower percentage of male participants (38.6%) and
the control group had a higher percentage of males (60.9%). The majority of
participants (56.1%) were between the ages of 15-16, with 10.1% age 18 or older. A
little over one third of the participants were in 9th grade (38.3%) and 11th grade
(33.7%). Group 1 had a much larger percentage of students in 9th grade (52.3%) and
the control group had a much larger percentage of students in 11th grade (70.8%). The
control group did not capture students in 9th grade. The majority of participants were
White, Non-Hispanic (60.6%), and the control group had a larger percentage of Black,
Non-Hispanic participants (50.0%). When compared to the demographic data from the
schools (Table 3-2), the sample of agriscience students had a higher percentage of
white students in each group and a lower percentage of Black students than the
school averages. Group 1 had a higher percentage of Hispanic/Latino students than
the school averages, while Group 2 had a lower percentage of Hispanic/Latino
students.
While a little over a third of participants were not active at all in the FFA
(35.7%), the largest percentage of students reported themselves as being somewhat
active in the FFA (42.9%). However, almost 80% of the control group were not active
at all in the FFA, while just under 80% of agriscience students reported being
somewhat active to very active. Fifty-two percent of participants spent 12 hours a
week or less outside, which is less than an hour and 45 minutes a day. Twenty-eight

91
and a half percent spend between 13-24 hours a week outside or less than 3.5 hours
a day. Less than 20% of participants spent 25 or more hours a week outside. The
control group had more students spending less time outside. Students were mostly
equally split among schools, overall and by group.
Objective 2
Objective two sought to identify the stress levels that are experienced by high
school agriculture students. The assumptions of a continuous dependent variable,
categorical independent variable with two groups, independent observations, no
outliers, normally distributed data, and homogeneity of variance for the independent
samples t-test were met. The PSS scores can range from zero to 40, with higher scores
indicating higher perceived stress levels (Cohen & Williamson, 1988). The mean Day 1
pretest PSS score for agriscience students was 15.75 (SD = 7.76). Students in the
control group had mean Day 1 pretest PSS score of 15.02 (SD = 9.06). An independent
samples t-test determined a statistically significant difference did not exist between the
PSS scores for agriscience students and PSS scores for control students, M = 0.78, SE
= 1.50, t(129) = 0.49, p = 0.63. Additionally, no statistical differences for PSS scores
were found between the two groups of agriscience students, M = 2.34, SE = 1.68, t(182)
= 1.39, p = 0.17.
The mean PSS scores of agriscience students was determined based upon
demographic data (see Table 4-2). The mean PSS scores indicated that females had
higher stress levels than males, which was similar to the norms for the PSS 10 identified
by Cohen and Williamson (1988) presented in Table 3-4. While the males in this study
had similar perceived stress levels (M = 12.31, SD = 6.97) as those in the normative
study (M = 12.1, SD = 6.6), the females in this study had a higher mean (M = 19.11, SD

92
= 7.15) than those in the normative study (M = 13.7, SD = 6.6). Results of an
independent t-test illustrated a statically significant difference between the perceived
stress levels of female agriscience students (M = 19.11, SD = 7.15) and male
agriscience students (M = 12.31, SD = 6.97), M = -6.79, SE = 1.66, t(70) = -4.08, p <
0.01, d = 0.96. The Cohen’s d effect size was calculated to be 0.96, a large effect
according to Cohen (1988, 1992).
The agriscience students in this study ranged from 14-19 years of age, which
was younger than the participants in the normative study; however, the average mean
score for all the age categories was 14.17, equivalent to the norm mean reported for
individuals in the 18-29 age range in the Cohen and Williamson (1988) study. A trend
for decreasing PSS scores with increasing age groups could be seen in the norm table,
however a clear pattern did not emerge with stress levels and ag in this study. The one-
way ANOVA indicated that a statically significant difference did not exist in stress levels
based upon age, F(5, 66) = 1.75, p = 0.12.
When stress levels were compared based upon race, white students had lower
stress levels (M = 14.74, SD = 7.85) than minority students. Other minorities had the
highest stress levels (M = 19.43, SD = 6.97) followed by Black students (M = 16.20, SD
= 8.64), and Hispanic/Latino students (M = 15.00, SD = 4.06). While the perceived
stress levels were higher for all race categories compared to those in the norm table,
the pattern was similar. In the Cohen and Williamson (1988) normative study, white
participants had the lowest stress levels (M = 12.8, SD = 6.2) followed by Black
participants (M = 14.7, SD = 7.2), other minorities (M = 14.1, SD = 5.0), and Hispanic
participants (M = 14.0, SD = 6.9). A one-way ANOVA did not find a statically significant

93
difference between agriscience students’ stress levels based upon race, F(3, 66) = 1.86,
p = 0.15. However, it should be noted that these findings could be affected by the
violation of normality within other minorities group of this variable.
Students in 9th grade had the highest stress levels (M = 19.29, SD = 7.22). The
stress level takes a dramatic drop in 10th grade (M = 10.82, SD = 6.16) and 11th grade
(M = 11.00, SD = 6.13) before increasing again in 12th grade (M = 14.13, SD = 8.25). A
one-way ANOVA was conducted to determine if the perceived stress level (PSS score)
of agriscience students was different for the four grade levels. Participants were
classified into four groups: 9th grade (n = 37), 10th grade (n = 11), 11th grade (n = 16),
and 912h grade (n = 8). The perceived stress level was statically significantly different
between grade levels, F(3, 68) = 9.09, p < 0.01, 2 = 0.29. According to Ferguson
(2009), this effect size represents a moderate effect. The PSS score decreased from 9th
grade students (M = 19.73, SD = 6.79) to the 12th grade students (M = 19.73, SD =
6.79), 11th grade students (M = 19.73, SD = 6.79), and 10th grade students (M = 19.73,
SD = 6.79), in that order. Tukey post hoc analysis revealed that the mean decrease
from 9th grade to 10th grade (8.91, 95% CI [2.82, 15.00]), was statically significant (p <
0.01) as well as from 9th grade to 10th grade (8.73, 95% CI [-3.43, 14.03, p < 0.01]), but
no other group differences were statically significant.
Students at School A had lower stress levels (M = 14.33, SD = 7.24) than
students at School B (M = 17.05, SD = 8.05). No significant difference was found
among Day 1 pretest PSS score based upon school, M = -2.72, SE = 1.68, t(82) = -
1.62, p = 0.11.

94
Students who were not active in FFA had the lowest stress scores (M = 14.69,
SD = 6.76), while students who rated themselves as active in FFA had the highest
stress scores (M = 17.00, SD = 6.13). Those who noted they were very active in FFA
did have lower stress levels (M = 16.13, SD = 10.27), than those active in the FFA. A
one-way ANOVA revealed that a statically significant difference did not exist based
upon level of involvement in the FFA, F(3, 68) = 0.38, p = 0.77.
Finally, students spending the least amount of time outside weekly, 12 or less
hours, had the highest stress levels (M = 17.69, SD = 7.20). Stress levels decreased as
time spent outside weekly increased. Students spending 25 or more hours outside
weekly had the lowest stress level (M = 12.13, SD = 9.68). The one-way ANOVA found
no statistically significant differences between stress levels based upon the number of
hours spent outside weekly, F(2, 69) = 2.42, p = 0.10.
Objective 3
Objective three investigated if a difference in student stress levels exists between
students instructed in the classroom setting and those instructed in a natural agricultural
laboratory setting. The research hypothesis related to this objective states, students
receiving instruction in a natural agricultural laboratory setting will have decreasing
stress levels than students receiving instruction in the classroom setting.
A general linear mixed model of day 1 and day 2 PSS difference scores by
treatment order was constructed to test the hypothesis. Assumptions were tested and
discussed in the Chapter 3. The model was not significant (Adj. R2 = 0.02, F(3,159) =
0.14, p = 0.93) and there was not a significant interaction effect (F(1,159) = 0.37, p =
0.54). This resulted in failure to reject the null hypothesis. Although not statistically
significant, figure 4-1 shows the profile plot of estimated marginal means of the PSS

95
difference scores for each day by treatment order, which shows an interaction. Each
group had higher difference scores on the day they received their treatment.
Additionally, the percentage of students who experienced a change in their PSS
in each environment was calculated. Table 4-3 presents the results. A greater
percentage of students experienced a decrease in their perceived stress level from the
beginning of class to the end of class in both the treatment (41%) and comparison
(50%), with 9% more of the students experiencing a decrease in the agriscience
classroom reporting a decrease than in the greenhouse environment. Conversely,
38.6% of students in the greenhouse environment experienced an increase in stressed
as compared to 35% in the agriscience classroom.
Objective 4
Objective four aimed to determine if a difference in student attention exists
between students instructed in the classroom setting and those instructed in a natural
agricultural laboratory setting. The researcher hypothesized, students receiving
instruction in a natural agricultural laboratory setting will have a greater increase in
attention scores than students receiving instruction in the classroom setting.
A general linear mixed model of day 1 and day 2 attention difference scores by
treatment order was constructed to test the hypothesis. Assumptions were checked and
were discussed in Chapter 3. A significant model accounted for 13.8% of the variance
(Adj. R2 = 0.138, F(3,147) = 9.01, p < 0.01, 2 = 0.16). A significant interaction between
day and treatment order existed (F(1,147) = 24.64, p < 0.01, 2 = 0.14). The significant
model and interaction effect led to a rejection of the null hypothesis that there was no
significant difference in change in attention level between student instructed in the

96
natural agricultural laboratory and the agriscience classroom. Additionally, the effect
sizes exceeded the recommended minimum for practical significance (Ferguson, 2009).
Figure 4-2 presents the profile plot for the estimated marginal means of attention
difference scores by day and treatment order. Both groups had larger changes in their
attention level on the day they received instruction in the natural agricultural laboratory
setting.
The percentage of students who experienced a change in their attention level in
each environment was calculated. Table 4-4 presents the results. A larger percentage
(59%) of students in the treatment group saw no change or an increase in their attention
(59%) than those in the comparison group (15.1%). At the same time, a larger
percentage of students in the comparison group saw a decrease in attention (84.9%)
than those in the treatment group (48.1%).
Objective 5
Objective five intended to determine if a difference in student content knowledge
exists between students instructed in the classroom setting and those instructed in a
natural agricultural laboratory setting. The following hypothesis was created, content
knowledge scores between students instructed in the in a natural agricultural laboratory
setting will not be statistically significantly higher compared to students instructed in a
classroom setting. In order to test the null hypothesis that a statistically significant
difference did not exist between the content knowledge scores of students in the
treatment and comparison groups, a paired samples t-test was completed.
Assumptions were checked are discussed in Chapter 3. Students who received
the treatment, instruction in the restorative learning environment first performed higher
on their first content knowledge assessment on propagation (M = 11.65, SD = 1.84)

97
than their second content knowledge assessment for plant nutrients (M = 10.40, SD =
2.58) for which they received instruction in the comparison environment, the agriscience
classroom. This represented a mean increase of 1.25 points (SE = 2.83). However this
differences was not statistically significant, t(19) = 1.98, p = 0.06, d = 0.44. This finding
supports the null hypothesis.
Students who were instructed in the agriscience classroom, the comparison
environment, for the propagation lesson also had a higher mean on the propagation
content knowledge score (M = 11.11, SD = 2.14) than when they were instructed in the
restorative learning environment, the greenhouse, for the plant nutrient lesson and
content knowledge assessment (M = 8.56, SD = 1.01). This represented a mean
difference of 2.57 points (SE = 0.63). This difference was statistically significant t(17) =
2.54, p = 0.02, d =0.60. This finding did not support the null hypothesis.
A general linear mixed model of day 1 and day 2 content knowledge scores by
treatment order was constructed to test the hypothesis. A significant model accounted
for 12.2% of the variance (Adj. R2 = 0.122, F(3,116) = 6.52, p < 0.01, 2 = 0.14). The
interaction between day and treatment order was not significant (F(1,116) = 2.08, p =
0.15). However, there was a significant main effect of day (F(1,116) = 15.61, p < 0.01).
Figure 4-3 presents the profile plot for the estimated marginal means of content
knowledge scores by day and treatment order. The profile plot illustrates the higher
mean scores, which were relatively equal, for both groups on Day 1 and lower scores
on Day 2 with a larger spread between the mean scores of each group.

98
Summary
Chapter 4 discussed the participation rate, limitations, and reliability of this study
before presenting the results for each objective. A majority of the participants were
white students ages 15-16 and enrolled in 9th or 11th grade with an equal number of
male and female students. While the majority of the control students were not involved
in FFA at all, the majority of the agriscience students reported some involvement in the
FFA. Over half of the students spent 12 or less hours a week outside; although
agriscience students did report spending more time outside than control students.
Agriscience students had an average PSS score of 15.75, which was not
significantly different from the control students. The trends in PSS scores were similar to
the trends found in the norm data; however, the actual PSS scores tended to be slightly
higher than the norms. Females experienced statistically significantly higher stress
levels than males, and although the difference in stress levels based on race was not
statistically significant, minority students had higher stress levels than white students.
Freshman had the highest stress levels which were significantly higher than
sophomores and juniors. Students at School A had lower stress levels than School B.
Stress levels increased with FFA involvement and decreased with time spent outside.
A significant difference was not found between the changes in stress levels or
the content knowledge between students taught in the treatment and comparison
environments. Conversely, a significant difference was found between changes in the
directed attention capacity of students. A greater percentage of students experienced
an increase or no change in their directed attention capacity when instructed in the
natural agricultural laboratory environment while a majority of the students experienced
a decrease in directed attention when instructed in the agriscience classroom.

99
Chapter 5 will discuss these findings in light of the current literature. The
researcher will draw conclusions and examine the implications. Finally, the researcher
will provide recommendations for practitioners and future research.
Table 4-1. Demographic characteristics of participants
Variable
Group 1 Treatment 1st
(n = 44)
Group 2 Treatment 2nd
(n = 42)
Group 3 Control A (n = 50)
Total
(n = 136)
Male (%) 38.6 51.4 60.9 52.1
Age (%) 14 27.8 21.1 0.0 18.4 15 33.3 31.6 0.0 24.5 16 33.3 13.2 58.3 31.6 17 2.8 23.7 20.8 15.3 18 2.8 5.3 16.7 7.1 19 0.0 5.3 0.0 2.0 20+ 0.0 0.0 4.2 1.0
Grade (%) 9th 52.3 39.5 0.0 38.3 10th 9.1 21.1 20.8 17.3 11th 18.2 21.1 70.8 33.7 12th 2.3 18.4 8.3 10.2
Race-ethnicity (%) White, Non-Hispanic
65.7 75.7 27.3 60.6
Black, Non-Hispanic
5.7 8.1 50.0 17.0
Hispanic/Latino 20.0 5.4 9.1 11.7 Multiracial, Non-Hispanic
5.7 5.4 4.5 5.3
American Indian/ Alaskan Native
0.0 2.7 9.1 3.2
Asian, Non-Hispanic
2.9 0.0 0.0 1.4
Hawaiian, Pacific Islander
0.0 2.7 0.0 1.4
FFA participation (%)
Not at all active 22.2 21.1 79.2 35.7

100
Somewhat active
61.1 47.4 8.3 42.9
Active 11.1 15.8 8.3 12.2 Very Active 5.6 15.8 4.2 9.2
Hours Spent Outside Weekly (%) 0-4 19.4 7.9 20.8 15.3 5-8 11.1 21.1 20.8 17.3 9-12 19.4 18.4 20.8 19.4 13-16 5.6 5.3 8.3 6.1 17-20 11.1 13.2 8.3 11.2 21-24 16.7 7.9 8.3 11.2 25-28 5.6 7.9 0.0 5.1 29-32 0.0 0.0 0.0 0.0 33-36 0.0 5.3 4.2 3.1 37-40 2.8 0.0 4.2 2.0 40-44 0.0 7.9 0.0 3.1 45-48 2.8 0.0 0.0 1.0 49-52 2.8 2.6 0.0 2.0 >52 2.8 2.6 4.2 3.1
School (%) School A 45.5 52.4 48.0 48.5 School B 54.4 47.6 52.0 51.5
Note. Valid percentages reported.
A Demographic data were only collected from control students at School B, hence demographic percentage only account for approximately half of the control group.

101
Table 4-2. Mean Day 1 Pretest PSS scores of agriscience students based on
demographic data
Category N M S. D.
Gender Male 35 12.31 7.15 Female 37 19.11 6.97
Age 14 18 17.50 7.36 15 24 17.88 8.44 16 16 13.38 7.14 17 10 12.40 8.11 18 3 11.33 4.16 19 2 12.50 9.19
Race White 50 14.74 7.85 Hispanic 9 15.00 4.06 Black 5 16.20 8.64 Other minority 7 19.43 8.42
Grade 9 38 19.29 7.22 10 11 10.82 6.16 11 16 11.00 6.13 12 8 14.13 8.25
School School A 40 14.33 7.24 School B 44 17.05 8.05
FFA Participation Not at All Active 16 14.69 6.76 Somewhat Active 39 15.56 7.45 Active 10 17.00 10.27 Very Active 8 16.13 9.98
Hours Spent Outside Weekly 12 or Less 35 17.69 7.20 13-24 22 14.91 6.74 25 or More 16 12.13 9.68

102
Table 4-3. Percentage of students who showed no change, a decrease, or an increase in stress by treatment
Treatment Lesson & Environment
No Change N (%)
Decrease N (%)
Increase N (%)
Treatment Total (N = 83) 17 (20.5) 34 (41.0) 32 (38.6) Day1 Propagation Greenhouse 9 (20.0) 15 (34.9) 19 (44.2) Day 2 Nutrients Greenhouse 8 (20.0) 19 (47.5) 13 (32.5)
Comparison Total (N = 80) 12(15.0) 40 (50.0) 28 (35.0) Day 1 Propagation Classroom 3 ( 7.9) 20 (52.6) 15 (39.5) Day 2 Nutrients Classroom 9 (21.4) 20 (47.6) 13 (31.0)
Table 4-4. Percentage of students who showed no change, a decrease, or an increase in attention by treatment
Treatment Lesson & Environment
No Change N (%)
Decrease N (%)
Increase N (%)
Treatment Total (N = 79) 15 (19.0) 38 (48.1) 26 (32.9) Day 1 Propagation Greenhouse 8 (20.9) 18 (45.0) 14 (35.0) Day 2 Nutrients Greenhouse 7 (17.9) 20 (51.3) 12 (30.8)
Comparison Total (N = 73) 3(4.1) 62 (84.9) 8 (11.0) Day 1 Propagation Classroom 2 (5.9) 30 (88.2) 2 (5.9) Day 2 Nutrients Classroom 1 (2.6) 32 (82.1) 6 (15.4)

103
Figure 4-1. GLM profile plot of PSS difference scores by time and treatment order

104
Figure 4-2. GLM profile plot for the estimated marginal means of attention difference
scores by day and treatment order

105
Figure 4-3. GLM profile plot for the estimated marginal means of content knowledge
scores by day and treatment order

106
CHAPTER 5 CONCLUSIONS AND RECOMMENDATIONS
Overview
This study was spurred from trends of pervasive stress in high school students
and the impacts that stress has on their health and learning. Chapter 5 will provide a
brief overview of the study. Findings from the study will be discussed in relationship to
previous literature. Based upon the findings and previous research the researcher will
draw conclusions and make recommendations both for current practitioners and for
future research.
Purpose, Objectives, and Hypotheses
The purpose of this study was to determine the influence of natural agricultural
laboratory settings on stress and attention levels of high school students. The following
research objectives were developed to guide this study:
1. Describe the demographic characteristics of the participants in this study;
2. Identify the stress levels experienced by high school agriculture students;
3. Determine if a difference in the change of student stress levels exists between students instructed in the classroom setting and those instructed in a natural agricultural laboratory setting;
4. Determine if a difference in the change of student attention capacity exists between students instructed in the classroom setting and those instructed in a natural agricultural laboratory setting; and
5. Determine if a difference in student content knowledge exists between students instructed in the classroom setting and those instructed in a natural agricultural laboratory setting.
The following research hypotheses were developed based on the research
objectives:
H1: Students receiving instruction in a natural agricultural laboratory setting will have a greater decrease in stress levels compared to students receiving instruction in the classroom setting.
107
H2: Students receiving instruction in a natural agricultural laboratory setting will have a greater increase in attention scores than students receiving instruction in the classroom setting.
H3: Students receiving instruction in a natural agricultural laboratory setting will have higher content knowledge scores than students receiving instruction in the classroom setting.
Methods
The Stress Reduction Theory (Ulrich, 1983) and the Attention Restoration Theory
(Kaplan & Kaplan, 1989) served as the theoretical base for this study and for the
conceptual framework of restorative learning environments. This study was completed
with students enrolled in secondary horticulture programs at two high schools in the
state of Florida. It used a quasi-experimental, counterbalanced, randomized subjects,
pretest-posttest, control group design to investigate the objectives of the study.
Descriptive statistics, paired samples t-tests, and general linear mixed models were
used to analyze the data collected.
Summary of Findings
Objective one found that students were approximately equally split between male
and females. Most students were 15-16 years old and in 9th or 11th grade. White
students made up the majority of the participants with Black and Hispanic/Latino
students representing the largest percentage of the minority participants. While nearly
80% of the control group was not at all active in the FFA, the majority of agriscience
students reported some level of involvement. Over half of the participants spent 12 or
less hours a week outside with control students reporting spending fewer hours outside
than that agriscience students.
The average PSS score for agriscience students was 15.75 and was not
significantly different from the PSS scores for the non-agriscience control students.

108
When compared to the norm data for the PSS 10, similar trends were found based upon
gender and race with females and minorities having higher stress levels than males and
white participants. In this study, males had normal PSS levels, and females had higher
than normal stress levels. The difference between stress levels of males and females
was found to be statistically significant with a strong effect size, indicating practical
significance. Stress levels were higher among all race categories when compared to the
norms. Although younger, students in this study had stress levels equivalent with the
18-29 age group from the normative study. Freshman students experienced the highest
stress levels. These stress levels dropped for sophomores and built again leaving
seniors with the second highest levels of perceived stress. The difference between 9th
grade stress levels and the stress levels of 10th and 11th grade students were found to
be statistically significant with a moderate effect size, indicating practical significance.
Perceived stress levels for School A were lower than School B. Students with some
level of participation in FFA had higher stress levels than students who were not active
in the FFA at all. Although not statistically significant, student stress levels decreased as
time spent outside weekly increased.
The null hypothesis that the students taught in the natural agricultural laboratory
setting would have a change in stress level equal to the students instructed in the
agriscience classroom failed to be rejected. The results of this test did not lend support
to the research hypothesis that students receiving instruction in the natural agricultural
laboratory setting would experience a decrease in stress levels compared to students
taught in the agriscience classroom. A greater percentage of students experienced a
decrease in stress levels in both environments with the students in the agriscience

109
classroom having the largest percentage of students experiencing the decrease in
stress levels.
A practical and statistically significant difference was found in the change in
attention levels of agriscience students taught in the natural agricultural laboratory
setting compared to those who were taught in the agriscience classroom causing the
researcher to reject the null hypothesis. Further analysis found that more than half of
the students receiving instruction in the natural agricultural laboratory environment had
no change or an increase in their attention levels from the beginning of class to the end
of class. On the other hand, 85% of the students taught in the agriscience classroom
experienced a decrease in attention.
The non-significant paired samples t-test failed to reject the null hypothesis that a
statistically significant difference existed in the content knowledge of students who
received instruction in the treatment and comparison environments. The non-significant
interaction effect for the general linear mixed model supported the dependent samples
t-test. This finding did not support the research hypothesis developed based upon the
conceptual model, that students instructed in the natural agricultural laboratory would
have statistically significantly higher content knowledge scores.
Conclusions, Discussion, & Implications
Objective 1
Frequencies were used to describe the demographic characteristics of
participants in this study. Since demographic information was not collected from both
school, comparisons between the agriscience students and control students should not
be made on the demographic data. The disparity in the racial make-up of the
agriscience students in this study and the schools indicates that the agriscience

110
horticulture programs in this study are not attracting and serving students representative
of the school population. This finding supports a call for agriscience programs to recruit
a more diverse population of students, which are representative of the school
characteristics (Torres, Kitchel, & Ball, 2010). When these findings are viewed in light of
findings that students from minority backgrounds have higher levels of perceived stress,
from objective 2, it becomes even more important that agriscience programs reach
these student populations.
With a majority of students spending less than an hour and 45 minutes outside
on a daily basis, the findings of this study confirm concerns that students are spending
less time in nature (Natural Conservancy, 2011; Price-Mitchell, 2014). This reduced
contact with nature can negatively impact physical and mental health of individuals
(Balmford & Bond, 2005). While many barriers to spending time in nature have been
identified, access to natural environments has been highlighted as one of the reasons
for the decline of time spent in nature (Charles & Louv, 2009; Natural Conservancy,
2011). Providing access to natural environments in a school setting, not only overcomes
this barrier, but also provides the opportunity for youth to have meaningful experiences
with nature that will help boost their concern and engagement with nature and
conservation issues and empower them to take action (National Conservancy, 2011;
Pergams & Zaradic, 2006).
Objective 2
Descriptive statistics were used to describe the stress level of agriscience
students. The mean PSS score for agriscience students on the first day of the study
was slightly higher than students in the control group, the difference was not significant.
This finding indicated that agriscience students in this study experienced stress at

111
similar levels of other students in the schools. Although this finding cannot be
generalized beyond the students in this study, it indicates that the majority of
agriscience students in this study are facing moderate to extreme levels of chronic
stress at rates higher than adults similar to the findings of stress research on the
general youth population (Austin et al., 2016; APA, 2014; CDPHE, 2015; Leonard, et al.,
2015; Jayson, 2014; Unni, 2016). Moreover, the majority of these students will cite
school as a somewhat or significant source of their stress and will be anticipating an
increase in stress in the coming year (APA, 2014). As a result of experiencing high
levels of stress, these students will likely sufferer from decreased physical and
emotional health (APA, 2014; Jayson, 2014), which can cause students to engage in
risky behaviors (Leonard, et al., 2015), experience anxiety disorders (NIMH, 2017),
undergo major depressive episodes (CBHSQ, 2016), and seek mental health services.
Many of these impacts from stress extend into college and adulthood (APA, 2014;
Leonard et al., 2015; Jayson, 2014; NIMH, 2017). Furthermore, the high stress levels
will hinder students’ ability to perform their best at school, home, work, and in social
situations. Since students are ill-prepared to effectively cope with their stress (APA,
2014; Jayson, 2014), schools need to create opportunities and tools for students to be
able to manage their stress (APA, 2014).
De Anda and colleagues (2000) concluded that the school is the most
appropriated site for stress intervention due to the accessibility to students and the
connectedness of stressors students experience to the school environment. Since
nature has been shown to contribute positively to the physical and mental health of
individuals (Balmford & Bonde, 2005, Kaplan, 1995; Gilbert, 2016; Rose, 2017;

112
University of Minnesota, 2016) and access to natural environments has been identified
as a barrier for youth to spend time in nature (Charles & Louv, 2009; Natural
Conservancy, 2011), one way schools can create opportunities for students to manage
their stress (APA, 2014) is by incorporating natural environments into the time students
spend at school. Small doses of nature have been found to provide benefits to the well-
being of individuals (McMahan & Estes, 2015). Additionally, Hartig and his colleagues
(2003) noted the role that everyday environments could play in helping or hindering
restoration. Since stress restoration begins so quickly after contact with a natural
environment, even short-term experiences in a natural environment, could have
beneficial impacts in everyday environments (Hartig et al., 1991; Ulrich et al., 1991). By
modifying the everyday environment students experience while at school to incorporate
natural, restorative environments, schools have the potential to make a positive impact
on the stress levels of students.
The difference in stress levels between the two groups of agriscience students,
treatment first and treatment second, were not statistically significant. This finding
allows any differences in stress levels emerging from this study to be contributed to
aspects of this study or error, rather than from initial differences between the two
groups.
The statically significant difference between male and female students in this
study not only matched with the normal standards for the PSS 10 established by Cohen
and Williamson (1988), but also aligned with similar trends found in adults and youth
(APA, 2014; 2015). Female high school students reported spending more time on
homework, earn higher GPAs, have higher levels of academic motivation than their
113
male counterparts (Leonard et al., 2015), which may contribute to their higher levels of
perceived stress. Additionally, these females reported grades as a significantly greater
source of stress than males. Gender differences in stress may require different
approaches to dealing with stress (de Anda et al., 2000).
Limited research has been completed on stress in the adolescent population
(Leonard et al., 2015). Additionally, many of the studies published do not report data
based upon age (APA, 2014), group adolescents together in one age category separate
from adults (Goyen & Anshel, 1998), or work with a narrow segment of the adolescent
population (de Anda et al., 2000; Leonard et al., 2015). For these reasons, limited
analysis has been completed on stress levels based upon age. Unlike the trend of
decreasing stress with age presented in the norm table published by Cohen and
Williamson (1988), a clear trend was not noticeable with the participants in this study.
Since there was not a significant difference based upon age, but there were significant
differences based upon grade, it seems that grade level may play a more predominate
role in determining stress levels than age for these high school students.
Freshman students had a significantly higher stress level than sophomores and
juniors but did not have a statistically significant stress level from seniors who reported
the second highest level of perceived stress. The transition into and out of high school
can add additional stressors to students in 9th and 12th grade (de Anda et al., 2000),
which may account for the increased level of stress experienced by freshman and
senior students in this study. School staff and researchers should investigate how they
can better support students during these transition times.

114
While no statistically significant differences were found in stress levels based
upon race, the trends of the mean stress scores should be considered based upon their
replication of results in other studies. This test is limited by the violation of the normality
of distribution assumption for students on the other minorities category (Field, 2013).
However, since the test is robust to violation of normality (Field, 2013), this violation
should only contribute to a very small difference in estimates (J. Colee, personal
communication). Additionally, the low number of participants in some of the groups
within race may be one reason no significant differences were found (Cohen &
Williamson, 1988; Field, 2013). Despite these limitations, the trends in mean stress
scores show lower stress levels for white students, and higher stress levels for
minorities, especially those in the other minorities category. De Anda and colleagues
(2000) noted that ethnic differences were evident in their findings. Additionally, Cohen &
Williamson (1988) found that Black participants had statically significantly higher stress
levels than white participants. Furthermore, the 2015 Stress in America report
Hispanics had the highest stress level and had had stress levels significantly higher
than the general population for the past four years (APA, 2014). Different racial and
ethnic groups responded differently to their stress as well (de Anda et al., 2000; APA,
2014). Based on trends of higher stress levels in minority populations and different
approaches to managing stress, specific strategies to support these populations should
be explored (de Anda et al., 2000).
The more rural school had lower mean PSS scores than the urban school.
Additionally, the more time students spent outside each week, the lower their stress
scores. Since the findings from this study cannot be generalized and this is an
115
exploratory study, future studies should investigate this trend more, even though these
differences were not statistically significant. The school in the more rural environment
was surrounded by more natural elements than the school in the urban environment.
While restorative experiences are not exclusive to natural environments and can occur
in urban environments Berto (2014), natural environments do tend to provide more
restorative benefits than urban environments (Berto, 2014; Hartig et al.,1991).
Additionally, recovery from stress occurs more quickly and completely in natural
environments compared to urban environments (Hartig et al., 2003; Ulrich et al., 1991).
Even natural views from the windows of dormitories and hospitals have been found to
have restorative benefits when compared to non-natural views (Tennessen & Cimprich,
1995; Ulrich, 1984). In one study, nature was found to cause a buffering effect (Wells &
Evans, 2003). This study found that the influence of stressful life events on
psychological distress was lower for students in environments with greater exposure to
nature and greater for students with lower exposure to nature. Students from the more
rural school and those spending more time outside may have benefited from having
more natural views in their everyday environments (Hartig et al., 1991; Ulrich et al.,
1991).
Students who reported some level of involvement in the FFA reported higher
perceived stress levels than students who reported no involvement with the FFA.
Despite the fact that a statistically significant difference was not found, the differences
should be noted. Thirty to 40% of high school students reported that extra-curricular
activities were somewhat or a great deal of a source of stress Leonard, et al., 2015). In
another study, 24.8% of students said competing in sports was often or very often a

116
source of stress and 20.1% of students reported the same of school activities (de Anda
et al., 2000). Other studies have shown that time management (Jayson, 2014) and
managing multiple activities (APA, 2014) as sources of stress. All of these reasons
could explain why an increasing involvement in the FFA was associated with increasing
stress scores. However, those who reported themselves as very active had slightly
lower stress levels than students who said they were active. Agriscience teachers and
FFA advisors should evaluate the amount of stress that FFA involvement contributes to
active members. Additionally, research should investigate why students who were very
involved had lower stress levels. Perhaps they have developed effective time
management and coping strategies, which can be applied to other students.
Objective 3
The finding that there was not a significant difference in the stress levels of
students after instruction in the natural agricultural laboratory environment contradicted
findings that individuals experienced faster and more complete restorative effects from
stress in natural environments (Hartig et al., 2003; Hartig et al., 1991; Ulrich et al.,
1991). These unexpected results may be contributed to several factors including: initial
response to the environment (Ulrich, 1983; Ulrich et al., 1991), negative anticipation of
leaving the restorative environment (Hartig et al., 1991; Hartig et al., 2003), difficulty
detecting decreases in negative affect (McMahan & Estes, 2015), the characteristics of
the restorative environment (Hartig et al., 1991; Kaplan & Talbot, 1983) and the
appropriateness of the measurement instrument.
In order for individuals to experience restoration from the natural environments,
they must have a favorable initial response to the environment (Ulrich, 1983; Ulrich et
al., 1991). However, the research team noted that some participants had a negative

117
response when they learned they would be going to the restorative learning
environment during class. This negative response to the environment may have acted
as a barrier to stress restoration for some of the participants. Future research should
investigate the initial response to the environment as that can shape the experience
individuals have in the environment (Ulrich, 1983; Ulrich et al., 1991). Since the
immediate response to restorative environments based on the stress reduction theory is
a parasympathetic response that impacts hear rate, respiration rate, and stress
hormone levels, these physiological measurements of stress should be used in future
research to detect more immediate changes to short-term contact to natural, restorative
learning environments.
Additionally, researchers have noted that negative anticipation of leaving the
natural, restorative environment may bias the results of individuals taking a posttest
right before returning to an everyday environment (Hartig et al., 1991; Hartig et al.,
2003). While individuals may have experienced greater reduction in stress while they
were in the environment, this reduction may not have been detected on the posttest
instrument if students were stressed about leaving that environment or going to their
next class. By monitoring physiological measurements of stress throughout the
experiences, researchers can better analyze this proposed bias.
A meta-analysis found that smaller effect sizes were found for decreasing of
negative affect when compared to increasing of positive effect (McMahan & Estes,
2015). This finding may indicate that it is harder for researchers to detect a decrease in
a negative affect. Future research should also measure elements of positive affect to
provide additional information on the benefits of restorative environments. Additionally,

118
more research is needs to investigate the effect of longer duration exposure to nature
(McMahan & Estes, 2015) as well as long term impacts of short-term exposure in
everyday environments.
Additional research should investigate how the different characteristics of the
restorative environment impact the restorative outcomes. While the natural agricultural
laboratory may meet the characteristic of being away, researchers have found that
being away is not enough to have a restorative effect without the other characteristics of
a restorative environment (Hartig et al., 1991; Kaplan & Talbot, 1983). How participants
perceive the restorative characteristics of an environment may mediate the effect of the
environment on stress levels.
Although the PSS 10 is a reliable and recommended instrument for measuring
perceived stress, has strong test-retest reliability (Cohen & Williamson, 1988; Lee,
2012), is easily understood, and can be used with adolescents (Cohen et al., 1983;
Cohen & Williamson, 1988), it was designed to appraise how stressful an individual
considers their life’s situation to be (Cohen et al., 1983). In this study, the wording of the
statement prompts was changed from, “in the past month,” to “currently” in order to
detect changes over the duration of the lesson. However, the researcher was unable to
determine how sensitive this instrument was to detecting the short term changes.
The research initially wanted to use the Mobile Photographic Stress Meter
(MPSM) to measure stress levels because it was designed to address the Ecological
Momentary Assessment requirements (Haim et al., 2015). These requirements entail
that data be collected in real-world environments, at the subject’s current state, at
strategic moments, and at multiple occurrences over time. Additionally, it is an

119
unobtrusive stress measure that is resilient to recall bias. The instrument was designed
and validated with college students and its reliability was established based upon a
strong correlation (r = 0.5559, p , 0.001) between the MPSM scores and the PSS.
However, in the pilot testing of this study the MPSM was not found to have strong
correlations to the PSS for the population of high school agriscience student population.
Researchers should work to develop an instrument that combines the reliability of the
PSS with the Ecological Momentary Assessment requirements of the MPSM to provide
an easy, reliable way to measure stress that is sensitive to short-term changes in stress.
The finding that a greater percentage of agriscience students experienced a
decrease in their stress levels and a lower percentage of students experienced an
increase in their stress levels during their agriscience instruction regardless of
environment, indicates that these agriscience classes had a more positive effect on the
stress levels of students. These results should be compared to the experiences of the
same students in non-agriscience classes as well to a control group of students to
determine if this is a unique trend. Further investigation is needed to determine why
these trends emerged and what factors contributed to both a decrease in stress levels
for some students and an increase in stress levels of others. In-depth semi-structured
interviews (Harding, 2013; Yin, 2016) as well as hierarchical regression (Keith, 2006)
could provide further insight in determining what characteristics of the environment and
instruction lead to both positive and negative changes in student stress levels. Findings
from this research would provide valuable recommendations for practitioners.
Considering the four characteristics of a restorative environment, being away,
fascination, extent, and compatibility (Kaplan, 1995; Kaplan & Tabot; 1983), and their

120
definitions, agriscience students may find their agriscience classroom to be a restorative
environment compared to their other classrooms. Future research should investigate
how students perceive their agriscience classrooms, other classrooms, and natural
agricultural laboratory environments based upon the restorative characteristics. If
students perceive their agriscience classroom as restorative, the findings could explain
the decreases in stress experienced by students in this study. The perceived
restorativeness of the environment should be analyzed to determine if it mediates the
outcome on stress.
Objective 4
The statistically significant and practical difference between the increase in
attention for students taught in the natural agricultural laboratory setting and decrease in
attention for students taught in the agriscience classroom supports the Attention
Restoration Theory (Kaplan & Kaplan, 1989). Natural environments have been found to
provide more cognitive renewal from mental fatigue than urban environments (Berto,
2005; Cimprich & Ronis, 2003; Hartig et al., 1991; Hartig et al, 2003) and natural views
have also been show to increase directed attention capacity (Tennessen & Cimprich,
1995).
Since students elect to take their agriscience coursework, they may have a
natural fascination with the content. The natural fascination, or involuntary attention
(James 1892), would allow students to focus on instruction without the effort required for
suppressing competing stimuli when directed attention is required in the absence of
fascination (Kaplan, 1995). When fascination allows directed attention to take a break,
individuals benefit from reduced mental fatigue (Kaplan & Talbot, 1983).

121
Mental fatigue is associated with irritability and challenges with concentration and
completing mental work (Kalplan & Talbot, 1983). In addition, directed attention fatigue
has the potential to affect selection, inhibition, fragility, perception, thought, action, and
feelings which could lead to human error (Kaplan, 1995), ineffectiveness (Berto, 2014;
Kaplan, 1995), and reduced competence. If time spent in natural agricultural
laboratories allows students to reduce their mental and directed attention fatigue, these
students would be able to avoid some of these challenges associated with this fatigue.
Despite the fact that a third of students taught in the restorative environment of
the natural agricultural laboratory increased their directed attention capacity and another
20% experienced no change in their directed attention capacity, 48% of students still
experienced a decrease in their attention levels. Although this percentage of students
who experienced a decrease in their directed attention capacity was much smaller than
those students receiving instruction in the classroom setting, some may be concerned
that it is still nearly half of the students. Kaplan (1995) explained that directed attention
fatigue can take longer to develop, consequently requiring more time to restore.
Students who did not experience increased attention during the span of the class
period, may need additional time to help recover from their directed attention fatigue.
During this study, students spent approximately 30 minutes in the restorative
environment. Students exposure to the restorative environment could occur in the form
of longer periods of exposure during a class period or repetitive exposure throughout
the week course. The impact of each of these should be investigated.
Additionally, other reasons for a decrease in attention levels should be
investigated. Characteristics of particular environments may require students to use

122
directed attention in these environments instead of reverting to fascination. For
example, the research team noted that when the fan in the greenhouse was on, it
produced a loud noise. This noise could have required students to rely on their directed
attention to suppress that stimuli and focus on instruction.
Since the results from this study are not generalizable, additional research
should investigate these findings in a larger, generalizable sample of agriscience
students. In addition to looking at the short-term impacts to directed attention,
researchers should attempt to measure the long-term impact of time spent in restorative
learning environments. Although the greenhouse/shade house setting was investigated
in this study because of their wide-spread usage (Franklin, 2008; Shoulders & Myers,
2012), teachers have a variety of laboratory areas available to them (Shoulders &
Myers, 2012), many of which could be categorized as natural agricultural laboratories
and provide restorative effects to students. Future research should investigate these
other laboratory environments to test for similar results.
Objective 5
Failure to reject the null hypothesis that no statistically significant difference
existed between the content knowledge scores of students who received instruction in
the treatment and comparison environments meant that this study did not find evidence
to support the research hypothesis for this objective. Based on the conceptual model
proposed in Chapter 2 (see Figure 2-1), the researcher hypothesized that students
instructed in the restorative environment, in this case the natural agricultural laboratory,
would have higher content knowledge scores, thus indicating improved academic
achievement from the restorative impacts of the natural environment outlined by the

123
Stress Reduction Theory (Ulrich, 1983) and the Attention Restoration Theory (Kaplan &
Kaplan, 1989).
While attempts were made to overcome the limitations of the counterbalance
design by ensuring the equivalence of learning material for each lesson (Ary et al.,
2010), students did note differences in the material to instructors. The significant main
effect for day in the general linear model points to issues with the equivalency of the
material. Prior experience with the content, the students’ perceived differences of
challenge in the content, and different learning activities in the lessons, may have
impacted the content knowledge scores. Future studies should consider increasing the
equivalence of their replications by assessing prior knowledge of the content, assessing
difficulty of standards with students from a comparative group, and selecting lesson
materials that can be taught using the same instructional practices. Additionally, the use
of established reliable and valid measures of content knowledge should be used over
research designed measures. Finally, one of the teachers had forgotten to give the
content knowledge assessment the day following the second day of instruction.
Although the teacher did attempt to give the assessment later, a lot of missing data
existed for this variable which could have biased the results of this test.
Previous research on laboratory instruction in agriscience had noted increased
content knowledge when laboratory instruction was utilized (Myers & Dyer, 2006;
Rotherberger & Stewart, 1995). In addition to the issues with equivalency, the limited
time for instruction and in the laboratory setting may have also influenced this finding.
The previous studies investigated laboratory instruction and content knowledge scores
over a longer duration. The impact of restorative environments on content knowledge
124
should be investigated over a longer duration. Additionally, the prolonged effects of
increased attention on content knowledge should be explored. While the findings of this
study do not support this previous literature, it is important to note that even though an
increase in content knowledge was not identified, neither was a decrease in content
knowledge scores. This finding has implications for practitioners because they do not
have to worry about sacrificing content knowledge in order to teach in these natural
agricultural laboratory settings.
Recommendations
Although this study was not generalizable, results from this study show the
possibility of increasing student directed attention capacity without sacrificing content
knowledge. Recommendations are provided for practitioners to capitalize on these
findings while additional research is being investigated. The exploratory nature of this
study combined with findings that did not align with research hypotheses, previous
literature, and theory provide many opportunities for additional research.
Practitioner Recommendations
Agriscience programs should add diversity to their programs by recruiting
students representative of the school population (Torres, Kitchel & Ball, 2010). This will
provide opportunities for these students to benefit from the restorative experiences
provided by natural agricultural learning environments. This is especially important for
the minority students who experience higher levels of perceived stress (Cohen &
Williamson, 1983).
Schools should provide natural environments conducive to learning and
encourage teachers to utilize these areas for instruction. These will help students
overcome the barrier of access to nature that limits their ability to spend time in natural

125
environments (Charles & Louv, 2009; Natural Conservancy, 2011). Additionally, time
spent in these areas can help reduce the negative health impacts associated with
reduced contact with nature (Balmford & Bonde, 2005). The natural areas will be even
more important in urban areas where natural environments are more sparse.
Moreover, these natural areas can be used by schools to develop stress
interventions. Since many stressors students experience stem from school itself (de
Anda et al., 2000; APA, 2014; Jayson, 2014) and schools have easy access to
facilitating the interventions to the students (de Anda et al., 2000), schools provide an
ideal environment for delivery of stress interventions. The stress interventions should
specifically target sub-populations of students who report higher stress levels, including
females, minorities, freshmen, and seniors.
Agriscience teachers have reported frequent use of their greenhouse laboratories
(Shoulders & Myers, 2012). Based upon the findings of this study, which showed a that
a large percentage of students either increased or maintained their directed attention
ability when instructed in the greenhouse setting while an even larger percentage of the
same students showed a decrease in their directed attention capacity in the agriscience
classroom, agriscience teachers should continue to utilize these natural agricultural
laboratories with frequency. Additionally, many agriscience teachers have access to
variety of natural agricultural laboratory settings (Shoulders & Myers, 2012). Agriscience
teachers should purposefully plan to utilize these facilities, despite the additional
preparation some of them require, allowing their students to benefit from directed
attention fatigue. Teachers should explore new and different ways to utilize these

126
natural laboratory settings in order to increase their use the opportunities for students to
benefit from the increased directed attention capacity.
Researcher Recommendations
As research on restorative learning environments in agriscience develops, the
following recommendation should be considered:
1. Since the findings of this study are not generalizable and there is no literature on the current stress levels of agriscience students, future research should investigate the stress levels of agriscience students to determine if they are similar to or different from the stress levels of other student populations.
2. Research should investigate the reasons certain sub-populations of students have higher stress levels, specifically females, minorities, and freshmen students.
3. Develop an instrument that provides a reliable measurement of current stress levels that is easy to use and sensitive to changes in stress over a short period in time with strong test-retest reliability in order to better measure the stress of high school students should be a research priority.
4. Research on stress levels of students should incorporate the use of physiological measurements of stress for more accurate measurement.
5. Additional research should investigate these findings in a larger, generalizable sample of agriscience students.
6. In addition to looking at the short-term impacts to directed attention and stress, researchers should attempt to measure the long-term impact of time spent in restorative learning environments.
7. Future research should investigate other agricultural laboratory environments to test for similar results.
8. Research should investigate the perceived restorativeness of different learning environments with different populations of students.
9. The influence of each characteristics of a restorative environment should be investigated in the educational setting.
10. Perceived restorativeness of the learning environment should be investigated for mediating effects on stress and attention levels of students.
11. As findings on the impact of restorative learning environments are confirmed, experimental trials should be completed to offer prescriptive recommendations.

127
This exploratory study on the influence of natural agricultural laboratory settings
on student stress levels and attention capacity has uncovered some interesting findings.
Continuation of this line of inquiry is recommended to further investigate the role of
restorative learning environments in the agriscience classroom.

128
APPENDIX A TEACHER PROPOSAL EMAIL
September 1, 2017 Dear _________,
My name is Anna Warner and I am in my 3rd year of my PhD program in Agriculture Education at the University of Florida. I’d like to ask you and your students to be a part of my dissertation research. I will provide you with a brief description of my research and an outline of your involvement.
The purpose of my research is to determine the effect of instruction in the
greenhouse setting on stress and attention levels of high school students. The study is based on current research which has shown positive impacts of time spent in nature on stress and attention. It is my hope that this research will set the ground work to enable us to understand how the unique laboratory settings agricultural programs have to offer can be used to meet the basic needs of our students and help them be better prepared to learn. Additionally, I hope this research will help provide justification for agricultural programs and laboratories.
The population for this study is student enrolled in the horticulture program. If
you choose to participate in this study, it would require you to help in distributing and collecting the required IRB form, selecting course topics to be included in the study, providing two, non-consecutive days of course time for the research team to deliver instruction, and administering a content knowledge assessment the day following the research team instruction. You will have access to all student work and their associated scores. Here is a proposed timeline of what the study would entail from you and your students.
Date Activity Teacher’s Role
Sept 6
Agree to participate Notify me of agreement to participate and provide me with the number of students and sections of horticulture which can participate, a schedule of when these classes meet, a description / pictures of your greenhouse and classroom facility, any dates during the delivery time which would not work with your school schedule, and recommend a teacher from another subject who might be willing to allow his/her students to take the instruments before and after his/her normal class to serve as a control.
Sept 13
Selection of appropriate lessons Provide feedback and agree on 2 lessons which would meet the needs of the study

129
and provide concepts and skills of equal difficulty.
Sept 20-25
Review of lesson materials (lesson plans and assessments)
Review lesson materials developed by the researcher for adherence to standards, content accuracy, and equivalence of concepts, procedures, and assessments.
Sept 25-29
Introduction and IRB forms Provide a brief introduction to the study and help distribute and collect IRB parental consent and student assent forms.
Oct 2-5
Lesson 1 Delivery Provide required classroom and greenhouse space and required materials for the lesson. Students will be busy during the entire class period. A team of researchers will come administer the instruments and deliver the lessons.
Lesson 1 Follow-up Administer the follow-up content knowledge test & Perceived Restorativeness Scale.
Oct 30-Nov 3
Lesson 2 Delivery Provide required classroom and greenhouse space and required materials for the lesson. Students will be busy during the entire class period. A team of researchers will come administer the instruments and deliver the lessons.
Lesson 2 Follow-up Administer the follow-up content knowledge test & Perceived Restorativeness Scale.
I appreciate your time and consideration. I hope you will consider agreeing to participate in this study. If you have any questions, please feel free to contact me at anna.j.warner @ufl.edu or by phone at 443-375-2927 or my advisor Dr. Brian Myers at [email protected] 352-273-2567
Sincerely, Anna J. Warner

130
APPENDIX B SEMI-HARDWOOD LESSON PLAN
Instructor:
Daily Plan 1
Estimated time of daily plan: 30 Minutes
Course: Ag Foundations and Hort 1-3
Unit of Instruction:
Plant Propagation
Unit EQ: How can plants reproduce?
Materials, Supplies, Equipment, References, and Other Resources: Materials:
Student note sheet
Clipboards for students in greenhouse
Post-it flags
Green and brown colored pencils
Potting mix
Pot 4”
Watering can or hose
Rooting hormone
Cup for hormone
Isopropyl alcohol
Plant specimen branches with 3 types of wood (1 for each pair of students).
Semi-hardwood specimens for propagation (can choose one of the following). o Lavender o Azealia o Heather o Box hedge o Camillia o Yew
Equipment:
Snippers or Pruning shears References:
http://horticulture.tekura.school.nz/plant-propagation/plant-propagation-2/h1092-plant-propogation-2-study-plan/semi-hardwood-and-hardwood-cuttings/ - watch second video
https://content.ces.ncsu.edu/plant-propagation-by-stem-cuttings-instructions-for-the-home-gardener
https://www.youtube.com/watch?v=R4NA4QUXQHM (yew Example – different types of wood cuttings)
http://www.thegardenersalmanac.co.uk/Data/Cuttings%20(Semi-hardwood)/Cuttings%20-%20Semi-Hardwood.htm
Intended Outcomes

131
What do you want students to know (K), understand (U), and be able to do (D)?
K: U: D:
The steps of semi hardwood cuttings
Plants can be produced through asexual propagating Identify semi-hardwood Propagate a plant using a semi-hardwood cutting
FL-DOE AFNR Benchmarks and Indicators: (http://www.fldoe.org/workforce/dwdframe/)
14.04 Demonstrate sexual and asexual propagation methods
Next Generation Sunshine State Standards/Common Core State Standards (CCSS): (http://www.floridastandards.org)
Lesson Objective(s):
1. Students will be able to identify features of softwood, semi-hardwood, and hardwood.
2. Students will be able to demonstrate how to asexually propagate a semi-hardwood plant.
Essential Question(s):
How can you identify semi-hardwood? How can you prorogate a semi-hardwood cutting?
Activating Strategy Introduction/Interest Approach: How will you prepare students for what you want them to learn today and link today’s activities with previous classes?
Estimated
Time:
2 minutes
How many of you wish you could print money? Today I am going to teach you the next best thing... and it is legal! When you print money, you are spending a little money on printing costs to get a lot of money to use. Plant propagation does the same thing. How many of you have propagated a plant before? What type of propagation did you do? How does propagation work? (You grow a new plant from a part of a mature plant) Semi-hardwood propagation is a special type of propagation which is commonly used to produce new trees or shrubs. These trees and shrubs grow in value each year. If you can grow multiple new plants each year from a single mature plant, you have the ability to sell these plants for almost a total profit, just like printing your own money! In order to be able to use this approach to build a profit you will have to meet our two objectives for the day. First you will need to be able to identify the features of softwood, semi-hardwood, and hardwood in order to be able to select the appropriate part of the plant to use for propagation. Second you will need to be able to demonstrate how to propagate a semi-hardwood cutting.
Learning Activity 1
Estimated Time:
10 minutes
Teaching Strategy / Materials / Higher Order Questions
Brief Content Outline
Teacher will describe the characteristics of each type of wood and show examples to students.
K: What do you want students to know (facts, figures, vocabulary, etc.)?
Features of hardwood, semi-hardwood, and softwood
1. Softwood

132
Students will record notes on provided note sheet. They will use colored pencils to color the different sections of the stem on the note sheet. Each pair of students will be given a branch specimen. They will use the post-it flags to mark the following areas:
where hard-wood turns to semi-hardwood
where semi-hardwood turns to softwood
Teacher will provide feedback Materials: Student Note Sheets Brown and green colored pencils Clipboards (if in greenhouse) Branch Specimens Post-it flags Higher Order Questions: Prepare questions ahead of time Reminders for the teacher
Set up stations with materials ahead of time.
a. This year’s growth b. Green stem, no bark
2. Semi-Hardwood a. Last year’s growth b. Portions of stem starting to dry out and turn
brown, portions of the stem still green
3. Hardwood a. More than two years old b. Bark covering stem
Ask Students: Why is it important to be able to identify semi-hardwood? U: What do you want students to understand (what is the big picture)?
1. One plant can have hardwood, semi-hard wood, and soft wood areas. \
2. Semi-hardwood cuttings are one way to asexually propagate shrubs and evergreens.
3. Mature plant has stored enough energy to allow for propagation
4. Semi-hardwoods are more hardy than softwood cuttings
D: What do you want students to be able to do (tasks, skills, etc.)?
1. Identify a semi-hardwood area on a plant.
Learning Activity 2
Estimated Time:
5 minutes
Teaching Strategy / Materials / Higher Order Questions
Brief Content Outline
Demonstration of semi-hardwood cutting. Students will take turns reading the steps of the hardwood cutting. Teacher will demonstrate the procedures Materials: Potting mix Pot 4” Rubber band Rooting hormone Cup for hormone
K: What do you want students to know (facts, figures, vocabulary, etc.)?
1. Sanitize tools a. Dip tools into Isopropyl alcohol b. Allow tools to air dry
Have all students sanitize their pruning shears at this point.
2. Find healthy plant a. Avoid stem, or bud damage b. Avoid diseased leaves
3. Cut off the hardwood portion of the stem 4. Cut horizontal below the node
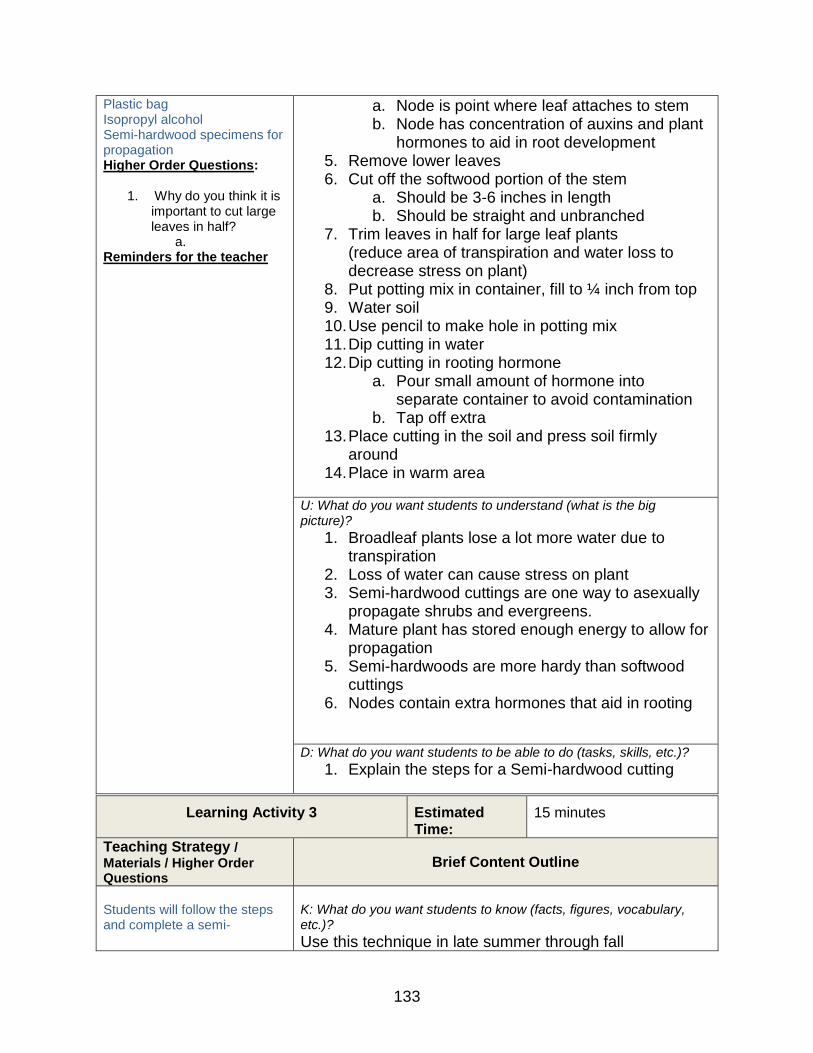
133
Plastic bag Isopropyl alcohol Semi-hardwood specimens for propagation Higher Order Questions:
1. Why do you think it is important to cut large leaves in half?
a. Reminders for the teacher
a. Node is point where leaf attaches to stem b. Node has concentration of auxins and plant
hormones to aid in root development 5. Remove lower leaves 6. Cut off the softwood portion of the stem
a. Should be 3-6 inches in length b. Should be straight and unbranched
7. Trim leaves in half for large leaf plants (reduce area of transpiration and water loss to decrease stress on plant)
8. Put potting mix in container, fill to ¼ inch from top 9. Water soil 10. Use pencil to make hole in potting mix 11. Dip cutting in water 12. Dip cutting in rooting hormone
a. Pour small amount of hormone into separate container to avoid contamination
b. Tap off extra 13. Place cutting in the soil and press soil firmly
around 14. Place in warm area
U: What do you want students to understand (what is the big picture)?
1. Broadleaf plants lose a lot more water due to transpiration
2. Loss of water can cause stress on plant 3. Semi-hardwood cuttings are one way to asexually
propagate shrubs and evergreens. 4. Mature plant has stored enough energy to allow for
propagation 5. Semi-hardwoods are more hardy than softwood
cuttings 6. Nodes contain extra hormones that aid in rooting
D: What do you want students to be able to do (tasks, skills, etc.)?
1. Explain the steps for a Semi-hardwood cutting
Learning Activity 3
Estimated Time:
15 minutes
Teaching Strategy / Materials / Higher Order Questions
Brief Content Outline
Students will follow the steps and complete a semi-
K: What do you want students to know (facts, figures, vocabulary, etc.)?
Use this technique in late summer through fall

134
hardwood cutting, checking off each step as they complete it. Materials: (at each station) Potting mix Pot 4” Rubber band Rooting hormone Cup for hormone Plastic bag Isopropyl alcohol Semi-hardwood specimens for propagation Higher Order Questions: Reminders for the teacher
Set up station with materials ahead of time.
Steps for Propagation
1. Sanitize tools a. Dip tools into Isopropyl alcohol b. Allow tools to air dry
2. Find healthy plant a. Avoid stem, or bud damage b. Avoid diseased leaves
3. Cut off the hardwood portion of the stem 4. Cut horizontal below the node
a. Node is point where leaf attaches to stem b. Node has concentration of auxins and plant
hormones to aid in root development 5. Remove lower leaves 6. Cut off the softwood portion of the stem
a. Should be 3-6 inches in length b. Should be straight and unbranched
7. Trim leaves in half for large leaf plants (reduce area of transpiration and water loss to decrease stress on plant)
8. Put potting mix in container, fill to ¼ inch from top 9. Water soil 10. Use pencil to make hole in potting mix 11. Dip cutting in water 12. Dip cutting in rooting hormone
a. Pour small amount of hormone into separate container to avoid contamination
b. Tap off extra 13. Place cutting in the soil and press soil firmly
around 14. Place in warm area
U: What do you want students to understand (what is the big picture)?
7. Semi-hardwood cuttings are one way to asexually propagate shrubs and evergreens.
8. Mature plant has stored enough energy to allow for propagation
9. Semi-hardwoods are more hardy than softwood cuttings
10. Nodes contain extra hormones that aid in rooting

135
D: What do you want students to be able to do (tasks, skills, etc.)?
1. Perform a semi-hardwood cutting.
Summarizing Strategy (Reflection) How will you have students reflect on what they have learned today and prepare them for the next class?
Estimated Time:
2 minutes
How is performing semi-hardwood cuttings like printing your own money? What value can horticulture producers gain from semi-hardwood cuttings? How is semi-hardwood different from softwood and hardwood?
Assessing Strategy (Evaluation) How will you determine if students know (K), understand (U), and can do (D) what you intended Formative: Identification of different wood types on branch specimens, Feedback on cutting process Summative: Content knowledge posttest.

136
Semi-Hardwood Propagation Features of Softwood, Semi-hardwood, and Hardwood
Directions: Record the features of each type of wood on the right. Color each section of the branch to match the description.
Softwood How old is this growth? What does it look like?
Semi-Hardwood How old is this growth? What does it look like?
Hardwood How old is this growth? What does it look like?

137
Semi-Hardwood Propagation Steps of Semi-hardwood Propagation
Directions: Reach each step and perform. Check off each step as you complete it.
1. Sanitize tools. a. Dip tools into Isopropyl alcohol b. Allow tools to air dry.
2. Find healthy plant a. Avoid stem, or bud damage b. Avoid diseased leaves
3. Cut off hardwood portion of the stem
4. Cut horizontal below the node (Node - point where leaf attaches to stem and has concentration of auxins and plant hormones to aid in root development)
5. Remove lower leaves
6. Cut off softwood portion of the stem a. Should be 3-6 inches in length b. Should be straight and unbranched stem.
7. Trim leaves in half for large leaf plants (reduce area of transpiration and water loss to decrease stress on plant)
8. Put potting mix in container, fill to ¼ inch from top
9. Water soil
10. Use pencil to make hole in potting mix
11. Dip cutting in water
12. Dip cutting in rooting hormone,
a. Pour small amount of hormone into separate container to avoid contamination
b. Tap off extra 13. Place cutting in the soil and press soil firmly around
14. Place in warm area.
How is performing semi-hardwood cuttings like printing your own money?
What value can horticulture producers gain from semi-hardwood cuttings?
How is semi-hardwood different from softwood and hardwood?

138
Semi-Hardwood Propagation Matching: Read each statement and write the letter of the type of wood it describes on
the line. Answers may be used more than once. (1 point each)
____ 1. Stem is completely green
____ 2. Last year’s growth
____ 3. Stem is covered in bark
____ 4. This year’s growth
____ 5. Stem has areas of bark and areas of green
True or False: Read each statement. Write a T for true or and F for false. (1 point each)
____ 6. You should sanitize your pruning shears before you cut your cuttings.
____ 7. The node contains hormones that will help develop flowers.
____ 8. You should trim large leaves in half to prevent water loss and plant stress.
____ 9. You should tap off extra rooting hormone.
____ 10. Semi-hardwood cuttings are less hardy than softwood cuttings.
____ 11. Mature plants store enough energy for propagation.
Short Answer: Read the scenario and respond in a few sentences. (4 points)
12. One of your friends wants to start a business for his Supervised Agriculture
Experience (SAE), but he doesn’t know what to do. One weekend you visit his home and
realize that he has a lot of different shrubs and trees. Explain to your friend how he can
use semi-hardwood cuttings from his shrubs and trees to make a profitable business.
A. Hardwood B. Semi-hardwood C. Softwood

139
Semi-Hardwood Propagation
Answer Key Matching: Read each statement and write the letter of the type of wood it describes on
the line. Answers may be used more than once. (1 point each)
__C__ 1. Stem is completely green
__B__ 2. Last year’s growth
__A__ 3. Stem is covered in bark
__C__ 4. This year’s growth
__B__ 5. Stem has areas of bark and areas of green
True or False: Read each statement. Write a T for true or and F for false. (1 point each)
__T__ 6. You should sanitize your pruning shears before you cut your cuttings.
__F__ 7. The node contains hormones that will help develop flowers.
__T__ 8. You should trim large leaves in half to prevent water loss and plant stress.
__T__ 9. You should tap off extra rooting hormone.
__F__ 10. Semi-hardwood cuttings are less hardy than softwood cuttings.
__T__ 11. Mature plants store enough energy for propagation.
Short Answer: Read the scenario and respond in a few sentences. (4 points)
12. One of your friends wants to start a business for his Supervised Agriculture
Experience (SAE), but he doesn’t know what to do. One weekend you visit his home and
realize that he has a lot of different shrubs and trees. Explain to your friend how he can
use semi-hardwood cuttings from his shrubs and trees to make a profitable business.
Answer should include 4 of the following points;
Home has resources are available for SAE
Students can take semi-hardwood cuttings from shrubs and trees
Cuttings will grow into plants that can be sold
It will take little investment
Receive a large return or investment of profit
A. Hardwood B. Semi-hardwood C. Softwood

140
APPENDIX C PLANT NUTRIENTS & DEFFICIENCIES LESSON PLAN
Instructor:
Daily Plan 1
Estimated time of daily plan: 30 Minutes
Course: Ag Foundations and Hort 1-3
Unit of Instruction: Plant nutrients and fertilizers
Unit EQ: What happens to plants that don’t get enough essential elements?
Materials, Supplies, Equipment, References, and Other Resources: Materials:
Clipboards for students in greenhouse
Essential Elements
Sources of Essential Elements
Corn Case Study Cards
Plant Doctor Evaluation Form
Plant Doctor Reference Manual References:
Nutrients for Life: Nourishing the Planet in the 21st Century - High School Curriculum – Lesson 4 - https://app.etapestry.com/cart/NutrientsforLifeFoundation/default/category.php?ref=1020.0.16100377
Intended Outcomes What do you want students to know (K), understand (U), and be able to do (D)?
K: U: D:
Plants require essential nutrients present in the right amounts to be healthy
Plants need different nutrients in different amounts Plants will exhibit signs of deficiency if they are not getting enough of the essential nutrients Use references to diagnose plant nutrient deficiencies
FL-DOE AFNR Benchmarks and Indicators: (http://www.fldoe.org/workforce/dwdframe/)
15.02 Identify nutritional needs of plants.
Next Generation Sunshine State Standards/Common Core State Standards (CCSS): (http://www.floridastandards.org)
Lesson Objective(s):
3. Students will be able to identify the essential nutrients required by plants.
4. Students will be able to use reference materials to identify plant nutrient deficiencies.
Essential Question(s): What are the essential elements required for plant health?
How can you tell if plants are not getting enough nutrients?
Activating Strategy

141
Introduction/Interest Approach: How will you prepare students for what you want them to learn today and link today’s activities with previous classes?
Estimated Time:
3 minutes
How do we get all the nutrients we need? (from the foods we eat) What happens if we don’t get all the nutrients we need? (we get sick, we don’t grow and develop properly) “Like us, plants need certain nutrients to survive. Today we are going to identify the essential nutrients required by plants and identify plant nutrient deficiencies.”
Learning Activity 1
Estimated Time:
10 minutes
Teaching Strategy / Materials / Higher Order Questions
Brief Content Outline
Teacher will Discuss the Characteristics of and Essential Elements with Master1.1 Essential Elements “We get the essential elements we need from the food we eat. How do plants get the nutrients they need?” (absorb nutrients from the soil through their roots) Students will work to complete Master 1.5 Sources of Essential Elements. Teacher will review correct answers and then discuss the different needs of the elements by plants. Students will color or highlight the primary Macronutrients in one color, the secondary macro nutrients in another color and leave the micro nutrients white. Student should make a key on their paper so they know what each color represents. Materials: Student Note Sheets (Master 1.1 & 1.5) Highlighters or something to color with
K: What do you want students to know (facts, figures, vocabulary, etc.)?
Characteristics of an Essential Element
4. Is required for a plant to complete its life cycle 5. Cannot be replaced by another element 6. Is directly involved in the plant’s metabolism 7. Is required by many different plants
Sources of Essential Elements
Essential Elements are Required in Different Levels
1. Primary Macronutrients – needed in largest quantities (NPK)

142
Clipboards (if in greenhouse) Reminders for the teacher
2. Secondary Macronutrients – Needed in smaller quantities (Ca, Mg, S)
3. Micronutrients – Needed in smallest quantities U: What do you want students to understand (what is the big picture)?
5. Plants requaire essential elemnts in different amoutns D: What do you want students to be able to do (tasks, skills, etc.)?
6. Identify sources of essential elements for plants
Learning Activity 2
Estimated Time:
15 minutes
Teaching Strategy / Materials /
Higher Order Questions
Brief Content Outline “What might happen to plants if they don’t get the nutrients they need?” (they would have problems growing & developing, susceptible to disease, etc) “Do you think the plant’s response would be the same for all missing nutrients or do you think there would be different responses? “ (Allow for them to share their thoughts) “Today we are going to do a case study to identify how a plant will show signs of nutrient deficiency. You are going to review information sent in by local farmers who suspect that their crops suffer from a nutrient deficiency. You will refer to the Plant Doctor Reference Manual to diagnose the specific nutrient deficiency affecting each plant.” Teacher will have students get in groups of 2-3 Distribute Master 4.3 Plant Doctor Evaluation Form, Master 4.4 Plant Doctor Reference manual to each group. Give each group the primary Information for one of the 3 case studies. Allow them time to complete Step 2 on their Plant doctor evaluation form. (Allow approximately 5 minutes.) Ask “What are some important symptoms your corn plants show?” “Are you certain of your diagnosis?
K: What do you want students to know (facts, figures, vocabulary, etc.)?
Symptoms of nutrient deficiencies 15. Yellowing (N,K)
a. V-shaped (N) b. Edges (K)
16. Stunted (N, P, K) 17. Spindly (N) 18. Mature later (P, K) 19. Purpling or reddening of leaves (P) 20. Susceptible to disease and damage (P) 21. Dry leaf edges (K) 22. Dark spots (dead cells) in leaves (K) 23. Weak Stems (K)
U: What do you want students to understand (what is the big picture)?
1. Plants will exhibit signs of deficiency if they are not getting enough of the essential nutrients
D: What do you want students to be able to do (tasks, skills, etc.)?
1. Use reference materials to diagnose plant nutrient deficiencies
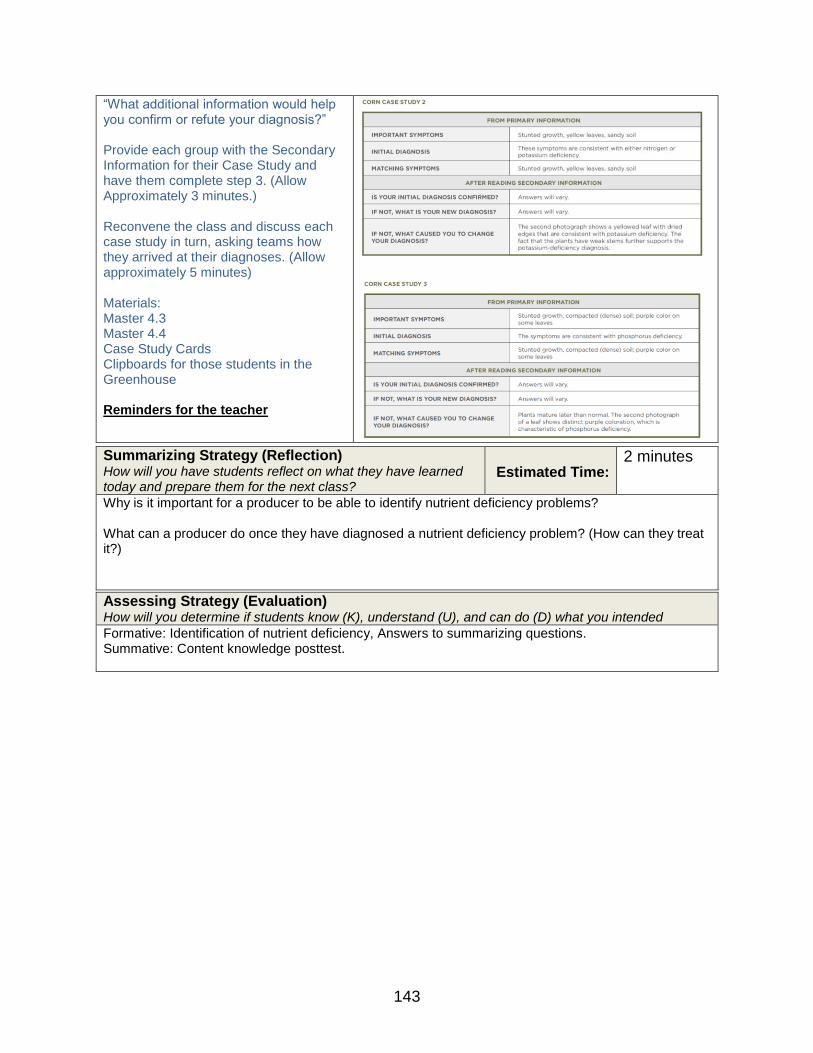
143
“What additional information would help you confirm or refute your diagnosis?” Provide each group with the Secondary Information for their Case Study and have them complete step 3. (Allow Approximately 3 minutes.) Reconvene the class and discuss each case study in turn, asking teams how they arrived at their diagnoses. (Allow approximately 5 minutes) Materials: Master 4.3 Master 4.4 Case Study Cards Clipboards for those students in the Greenhouse
Reminders for the teacher
Summarizing Strategy (Reflection) How will you have students reflect on what they have learned today and prepare them for the next class?
Estimated Time:
2 minutes
Why is it important for a producer to be able to identify nutrient deficiency problems? What can a producer do once they have diagnosed a nutrient deficiency problem? (How can they treat it?)
Assessing Strategy (Evaluation) How will you determine if students know (K), understand (U), and can do (D) what you intended Formative: Identification of nutrient deficiency, Answers to summarizing questions. Summative: Content knowledge posttest.

Plant Nutrients Matching: Read each statement and write the letter of the type of nutrient it describes on the
line. Answers may be used more than once. (1 point each)
____ 1. Required in the smallest amount
____ 2. Molybdenum (Mo)
____ 3. Required in the largest amount
____ 4. Sulfur (S)
____ 5. Phosphorus (P)
____ 6. Potassium (K)
____ 7. A major nutrient required in smaller amounts
____ 8. Nitrogen (N)
Short Answer: Read each question and write your response.
9. List three sources from which plants can get the essential nutrients they need. (3 points)
10. Why is it important for producers to be able to identify a nutrient deficiency? (2 points)
11. Provide two different symptoms of a nutrient deficiency? (2 points)
D. Primary Macronutrient
E. Secondary Macronutrient
F. Micronutrient

Plant Nutrients Answer Key
Matching: Read each statement and write the letter of the type of nutrient it describes on the
line. Answers may be used more than once. (1 point each)
__C__ 1. Required in the smallest amount
__C__ 2. Molybdenum (Mo)
__A__ 3. Required in the largest amount
__B__ 4. Sulfur (S)
__A__ 5. Phosphorus (P)
__A__ 6. Potassium (K)
__B__ 7. A major nutrient required in smaller amounts
__A__ 8. Nitrogen (N)
Short Answer: Read each question and write your response.
9. List three sources from which plants can get the essential nutrients they need. (3 points)
Soil
Water
Air
10. Why is it important for producers to be able to identify a nutrient deficiency? (2 points)
Include two of the following
To address the problem early
To prevent the loss of plant
To protect the profit
To protect yield of plants
11. Provide two different symptoms of a nutrient deficiency? (2 points)
Include two of the following
Yellowing (N,K) o V-shaped (N) o Edges (K)
Stunted (N, P, K)
Spindly (N)
Mature later (P, K)
Purpling or reddening of leaves (P)
Susceptible to disease and damage (P)
Dry leaf edges (K)
Dark spots (dead cells) in leaves (K)
Weak Stems (K)
A. Primary Macronutrient
B. Secondary Macronutrient
C. Micronutrient

APPENDIX D INSTRUMENTATION INSTRUCTIONS
Instructor Directions for Delivering Instruments and Instruction Perceived Stress Scale:
1. Distribute the Perceived Stress Scale Beginning of Class Sheet
2. Ask all students to record their participant number on the bottom of the sheet.
3. Ask students to read each statement and select their agreement as it applies to them in the
moment.
4. Collect all papers.
Necker Cube Pretest:
1. Distribute the Necker Cube Introduction and Practice Sheet.
2. Read the following statement.
“On your paper you will see a wire-frame Necker Cube used for this task. As you look at
the cube it will seem to flip between the two patterns. Some people find it easier to see
the changing patterns if they focus in the middle of the image.
Some people will see the patterns flip back and forth quickly while others will see the
changes happening slowly.
Use this time to watch the cube for the change in pattern. Mark a tally next to the box
each time you see the pattern change. Please let me know if you have any questions about
the Necker Cube”
3. Observe that all students have made a tally mark. If students have not made a tally mark,
ask them individually if they can see the change. It may be helpful to place a dot on one
of the corner and have them focus on the dot and how it appears at two different locations
when the shape flips.
4. Ask students to turn their paper over.
5. Ask students to record their participant ID at the bottom of the sheet.
6. Have students fold their paper along the line so that they are looking at the beginning of
class Exercise 1.
7. Read the following statement.
“When I say go you will look at the Necker Cube for Exercise 1. Make a tally mark next
to the cube each time you notice the pattern change until I say Stop.”
8. Say “Go” and begin the stop watch for 30 seconds
9. At 30 seconds, say “Stop”
10. Count your tally marks and record the total number in the box next to exercise 1.
11. Ask students to flip their paper to the Exercise 2 side.
12. Read the following directions

“When I say go you will look at the Necker Cube for Exercise 2. Try to hold each pattern
for as long as you can without letting it change. Make a tally mark next to the cube each
time you notice the pattern change until I say Stop.”
13. Say “Go” and begin the stop watch for 30 seconds
14. At 30 seconds, say “Stop”
15. Count your tally marks and record the total number in the box next to exercise 2.
16. Collect all of the beginning of the class papers.
Students with a 1 at the beginning of their Participant number should go to the Greenhouse.
Students with a 2 at the beginning of their Participant number should remain in the Classroom.
Students with a 3 at the beginning of their Participant number should receive instruction from
their classroom teacher.
Instruction should be delivered according to the supplied lesson plans.
Following instruction collect the Post Test assessments in the location of instruction using the
following procedures.
Perceived Stress Scale:
1. Distribute the Perceived Stress Scale End of Class Sheet
2. Ask all students to record their participant number on the bottom of the sheet.
3. Ask students to read each statement and select their agreement as it applies to them in the
moment. Note: Your responses may be different from the beginning of class.
4. Collect all papers.
Necker Cube Posttest:
1. After the class instruction, distribute the End of Class sheet.
2. Ask students to record their participant ID at the bottom of the sheet.
3. Read the following statement.
“When I say go you will look at the Necker Cube for Exercise 3. Try to hold each pattern
for as long as you can without letting it change. Make a tally mark next to the cube each
time you notice the pattern change until I say Stop.”
4. Say “Go” and begin the stop watch for 30 seconds
5. At 30 seconds, say “Stop”
6. Count your tally marks and record the total number in the box next to exercise 3.
7. Collect all of the end of the class papers.
Perceived Restorativeness Scale:
1. Distribute the Perceived Restorativeness Scale sheets
2. Ask all students to record their participant number on the bottom of the sheet.
3. Ask students to read each statement and select their agreement with each statement as it
applies to the environment in which they received instruction (classroom or greenhouse).
4. Collect all papers.

APPENDIX E NECKER CUBE PATTERN CONTROL TEST
Necker Cube Introduction and Practice
Below is the wire-frame Necker Cube used for this task. As you look at the cube it will seem to
flip between the two patterns. Some people find it easier to see the changing patterns if they
focus in the middle of the image.
Some people will see the patterns flip back and forth quickly while others will see the changes
happening slowly. Use this time to watch the cube for the change in pattern. Mark a tally next to
the box each time you see the pattern change. Ask the instructor if you have any questions.
When instructed by your instructor you will complete the exercises for the beginning of the class.
Total # of Tally Marks ________

149
Beginning of Class
Exercise 1:
When directed by the instructor, focus on the Necker Cube. Each time you see the pattern
change, make a tally mark next to the cube.
Exercise 2:
When directed by your instructor you will repeat the same procedures, except this time you will
try to hold each pattern for as long as you can without letting it change. Make a tally mark next
to the bar each time the box flips.
Total # of Tally Marks ________
Total # of Tally Marks ________

150
End of Class
Exercise 3:
When directed by the instructor, focus on the Necker Cube. Each time you see the pattern
change, make a tally mark next to the cube.
Total # of Tally Marks ________

151
APPENDIX F DEMOGRAPHIC INFORMATION
University of Florida Impact of Natural Environments Participant Demographic Information Please read each question and put a check mark in the box next to the answer which best applies.
1. What year were you born?
□ 2005 □ 2004 □ 2003 □ 2002 □ 2001 □ 2000 □ 1999
□ 1998 □ 1997 or before
2. What gender are you? □ Male □ Female
3. What is your Race and Ethnicity?
□ American Indian or Alaska native, Non-Hispanic
□ Asian, Non-Hispanic
□ Black or African American, Non-Hispanic
□ Hispanic/Latino
□ Multiracial (two or more races), Non-Hispanic
□ Native Hawaiian or Other Pacific Islander, Non-Hispanic
□ White, Non-Hispanic
4. What grade are you in?
□ 6th □ 7th □ 8th □ 9th □ 10th □ 11th □ 12th
5. How many hours do you spend outside on a weekly basis?
□ 0-4 □ 5-8 □ 9-12 □ 13-16 □ 17-20 □ 21-24 □ 25-28
□ 29-32 □ 32-36 □ 37-40 □ 40-44 □ 45-48 □ 49-52 □ >52
6. How would you describe your participation in FFA?
□ Not at All Active □ Somewhat Active □ Active □ Very Active

152
APPENDIX G INFORMED STUDENT ASSENT
Informed Student Assent Dear Student,
The University of Florida Agricultural Education Department is trying to learn about the effects
of classroom and greenhouse spaces on student stress and attention levels. You will be asked to complete
the Perceived Stress Scale and Necker Cube Pattern Control Test at the beginning of class. The Perceived
Stress Scale includes will ask you to rate your agreement to a series of 10 statements relating to the stress
you are currently experiencing, “I am upset because of something that happened unexpectedly”.
Questions will be answered on a scale of 0 (Strongly Disagree) to 4 (Strongly Agree). The Necker Cube
Pattern Control Test asks you to tally the number of times your perspective of a wire-cube changes in a 30
second period. You will then receive instruction in a classroom or greenhouse from a certified agriculture
teacher on the research team. At the end of class you will complete the Perceived Stress Scale and the
Necker Cube Pattern Control Test again. Additionally, you will complete the Perceived Restorativeness
Scale to rate the environment (classroom or greenhouse) on the characteristics of a restorative
environment. The following day you will complete a quiz on the content from the lesson. If you are in a
non-agriculture course, you will be completing the different scales at the beginning and end of your
regular class instruction and will not be required to take a content quiz. You will not have to answer any
question you do not wish to answer. Your information will be assigned a code number. The list
connecting your name to this number will be kept in a locked file in my faculty supervisor’s office. When
the study is completed and the data have been analyzed, the list will be destroyed. Your name will not be
used in any report. Your identity will be kept confidential to the extent provided by law and your name
will not be connected to your questionnaire responses.
The purpose of this study is to determine the influence of natural agricultural laboratory settings
on stress and attention levels of high school students. The results of this study may assist agricultural
educators in designing learning environments that would lower student stress and increase students’
capacity for attention. The results may not directly benefit you; however, may benefit future students.
Participating in this study will have no effect on the grade in your
If you have any questions about this research protocol, please contact me at
[email protected] or my faculty supervisor, Dr. Myers at [email protected]. Questions or concerns
about your rights as a research participant may be directed to the IRB-02 office, University of Florida,
Box 112250, Gainesville, FL, 32611; (352) 392-0433.
Sincerely,
Anna Warner Brian E. Myers
Graduate Student Professor & Associate Dept. Chair
Department of Agricultural Education and Communication University of Florida
I have read the procedure described above for the impact of agricultural activities students. I voluntarily
agree to participate in in the study by answering questions on the questionnaire.
307A Rolfs Hall Fax: 352-392-9585 PO Box 110540 Ph: 352-273-2614 Gainesville, FL 32611-0540 [email protected]
Institute of Food and Agricultural Sciences Department of Agricultural Education and Communication Anna J. Warner

153
___________________________________________ ___________________
Signature of Participant Date

154
APPENDIX H INFORMED PARENT CONTSENT
Informed Parental Consent Dear Parent/Guardian,
I am a graduate student in the Agricultural Education and Communication Department at the
University of Florida, conducting research on the effects of classroom and greenhouse environments
on the stress and attention levels of students under the supervision of Dr. Brian Myers. The purpose
of this study is to determine the influence of natural agricultural laboratory settings on stress and
attention levels of high school students. The results of this study may assist agricultural educators in
designing learning environments that would lower student stress and increase students’ capacity for
attention. The results may not directly benefit your student; however, may benefit future students.
With your permission, I would like to ask your child to volunteer for this research.
Participants will be asked to complete the Perceived Stress Scale and Necker Cube Pattern
Control Test at the beginning of class. The Perceived Stress Scale includes will ask students to rate
their agreement to a series of 10 statements relating to the stress they are currently experiencing, “I
am upset because of something that happened unexpectedly”. Questions will be answered on a scale
of 0 (Strongly Disagree) to 4 (Strongly Agree). The Necker Cube Pattern Control Test asks students
to tally the number of times their perspective of a wire-cube changes in a 30 second period. Students
will then receive instruction in a classroom or greenhouse from a certified agriculture teacher on the
research team. At the end of class your students will complete the Perceived Stress Scale and the
Necker Cube Pattern Control Test again. Additionally, they will complete the Perceived
Restorativeness Scale to rate the environment (classroom or greenhouse) on the characteristics of a
restorative environment. The following day the students will complete a quiz on the content from the
lesson. If your student is in a non-agriculture course, he/she will be completing the different scales at
the beginning and end of his/her regular class instruction and will not be required to take a content
quiz. Students will not be required to answer any question they do not want to answer on any of the
tests. Your student’s information will be assigned a code number. The list connecting your student’s
name to this number will be kept in a locked file in my faculty supervisor’s office. When the study is
completed and the data have been analyzed, the list will be destroyed. Your child’s name will not be
used in any report. Your child’s identity will be kept confidential to the extent provided by law and
names will not be collected with questionnaire responses. Participation or non-participation in this
study will have no effect on your child’s grades or placement into any programs.
There are no anticipated risks, compensation or other direct benefits to your child as a
participant of this study. Your child may withdraw his or her consent at any time and may
discontinue participation in the study without consequence. Group results will be available upon
request in May. If you have any questions about this research protocol, please email me at
[email protected] or my faculty supervisor, Dr. Myers at [email protected]. Questions or
concerns about your child’s rights as a research participant may be directed to the IRB-02 Office,
University of Florida, Box 112250, Gainesville, FL, 32611; (352) 392-0433. IRB# 201702792
Sincerely,
307A Rolfs Hall Fax: 352-392-9585 PO Box 110540 Ph: 352-273-2614 Gainesville, FL 32611-0540 [email protected]
Institute of Food and Agricultural Sciences Department of Agricultural Education and Communication Anna J. Warner

155
Anna Warner Brian E. Myers
Graduate Student Professor & Associate Dept. Chair
Department of Agricultural Education and Communication University of Florida
I have read the procedure described above. I voluntarily give my consent for my child,
_________________________________________, to participate in the study of the impact of
agricultural activities on student reactions.
_____________________________________________________ ___________________
Parent/Guardian Signature Date

156
LIST OF REFERENCES
Adevi, A. A. & Mårtensson, F. (2013). Stress rehabilitation through garden therapy: The garden as a place in the recovery from stress. Urban Forestry & Urban Greening, 12, 230-237. doi: 10.1016/j.ufug.2013.01.007
Alkahtani, M., Ahmad, A., Darmoul, S., Samman, S., Al-zabidi, A., & Matraf, K. B. (2016). Multitasking trends and impacts on education: A literature review. International Journal of Social, Behavioral, Educational, Economic, Business and Industrial Engineering, 10(3), 1006 – 1012.
Alter, A. (2013, March 29). How nature resets our minds and bodies. The Atlantic.
Retrieved from https://www.theatlantic.com/health/archive/2013/03/how-nature-resets-our-minds-and-bodies/274455/
American Psychological Association (APA). (2006). Driven to distraction. Retrieved from
American Psychological Association http://www.apa.org/research/action/drive.aspx
American Psychological Association (APA). (2014). Stress in America: Are tends adopting adults; stress habits?. Retrieved from American Psychological Association https://www.apa.org/news/press/releases/stress/2013/stress-report.pdf
American Psychological Association (APA). (2015). 2015 Stress in America Snapshot. Retrieved from American Psychological Association https://www.apa.org/news/press/releases/stress/2013/stress-report.pdf
American Psychological Association (APA). (2017). Understanding Chronic Stress. Retrieved from American Psychological Association http://www.apa.org/helpcenter/understanding-chronic-stress.aspx
Ary, D., Jacobs, L. C., Sorensen, C. K., & Walker, D. A. (2010). Introduction to Research in Education (9th ed.). Belmont, CA: Wadsworth Cengage Learning.
Atchley, R. A., Strayer, D. L., & Atchley, P. (2012). Creativity in the wild: Improving
creative reasoning through immersion in natural settings. PLoS ONE, 7(12), 1-3. doi: 10.1371/journal.pone.0051474
Austin, G., Polik, J., Hanson, T., & Zheng, C. (2016). School climate, substance use,
and student well-being in California, 2013-2015. Results of the fifteenth Biennial Statewide Student Survey, Grades 7, 9, and 11. San Francisco: WestEd Health & Human Development Program.
Baggot, K. (2003). The role of everyday nature in children’s lives: Do green schoolyards make a difference to attention? Combined abstracts of 2003 Psychology Conferences.

157
Balmford, A. & Bond, W. (2005). Trends in the state of nature and their implications for human well-being. Ecology Letters, 8, 12-18-1234. doi: 10.1111/j.1461-0248.2005.00814.x
Baum, A. (1990). Stress, intrusive imagery, and chronic distress. Health Psychology, 6, 653-675.
Beer, J. (1989). Learning effects while passively viewing the Necker cube. Perceptual and Motor Skills, 69(3), 1391-1394.
Berto, R. (2005). Exposure to restorative environments helps restore attentional
capacity. Journal of Environmental Psychology, 25, 249-259. doi: 10.1016/j.jenvp.2005.07.001
Berto, R. (2014). The role of nature in coping with psycho-physiological stress: A literature review on restorativeness. Behavioral Sciences, 4, 394-409. doi: 10.3390/bs4040394
Campbell, D. T., & Stanley, J. C. (1963). Experimental and quasi-experimental designs for research. Chicago, IL: Rand McNally & Company.
Center for Behavioral Health Statistics and Quality (CBHSQ). (2016). Key substance use and mental health indicators in the United States: Results from the 2015 National Survey on Drug Use and Health (HHS Publication No. SMA 16-4984, NSDUH Series H-51). Retrieved from http://www.samhsa.gov/data/
Charles, C., & Louv, R. (2009, September). Children’s nature deficit: What we know – and don’t know. Children and Nature Network. Retrieved from http://www.natureandforesttherapy.org/uploads/8/1/4/4/8144400/childrens_nature_deficit_disorder_2009.pdf
Cimprich, B. (1993). Development of an intervention to restore attention in career patients. Career Nursing, 16(2), 83-92.
Cimprich, B. E. (1990). Attentional fatigue and restoration in individuals with cancer (Doctoral dissertation, University of Michigan). Retrieved from https://search-proquest-com.lp.hscl.ufl.edu/docview/303852595?pq-origsite=summon&accountid=10920
Cimprich, B., & Ronis, D. L. (2003). An environmental intervention to restore attention in
women with newly diagnosed breast cancer. Cancer Nursing, 26(4), 284-292. Clay, R. A. (2001). Green is good for you. Monitor on Psychology, 32(4), 40. Retrieved
from http://www.apa.org/monitor/apr01/greengood.aspx
Cohen, J. (1992). A power primer. Quantitative Methods in Psychology, 112(1), 155-159.
158
Cohen, J. (1988). Statistical power analysis for the behavioral science (2nd ed.). Hillsdale, NJ: Lawrence Erlbaum Associates.
Cohen, S. (1986). Contrasting the hassles scale and the perceived stress scale: Who’s really measuring appraised stress? Journal of Health and Social Behavior, 24, 385-396.
Cohen, S. (1994). Perceived Stress Scale. [Psychological assessment instrument]. Retrieved from http://www.mindgarden.com/documents/PerceivedStressScale.pdf
Cohen, S., Kamarck, T., & Mermelstein, R. (1983). A global measure of perceived stress. Journal of health and Social Behavior. 24(4), 385-396.
Cohen, S. & Williamson, G.M. (1988), Perceived stress in a probability sample of the United States. In S. Spacapan & S. Oskamp (Ed.), The social psychology of health: The Claremont Symposium on applied social psychology symposium proceedings (pp. 31-67). Thousand Oaks, CA: Sage Publications, Inc.
Colorado Department of Public Health and Environment (CDPHE). (2015). Mental health among youth in Colorado. Health Kids Colorado Survey 2015. Retrieved from https://www.colorado.gov/pacific/sites/default/files/PF_Youth_HKCS_MH-Infographic-Digital.pdf
de Anda, D. Baroni, S. Boskin, L., Buchwald, L., Morgan, J., Ow, J., Gold, J. S., & Weis, R. (2000). Stress, stressors, and coping among high school students. Children and Youth Services Review, 22(6), 441-463.
DeYoung, R. (2010). Restoring mental vitality in an endangered world: Some attentional benefits of walking in natural settings. EcoPsychology, 2(1), 13-22. Doi: 10.1089/eco.2009.0043
DeYoung, R. K. (2015, February 27). Testing or our capacity to direct attention:
Restoring and managing mental resources needed for environmentally resilient living. Retrieved from http://www.snre.umich.edu/eplab/intranet/demo_dac_tasks.html?gotoTask=Other+EPLab+tests+of+our+capacity+to+direct+attention
DeYoung, R. K. (2016, March 1). Using Necker Cube to test out capacity to direct attention: Helping to manage the mental vitality needed for a civil transition to durable living. Retrieved from http://www.snre.umich.edu/eplab/demos/nt0/neckerintro.html
Ferguson, C. L. (2009). An effect size primer: A guide for clinicians and researchers. Professional Psychology: Research and Practice. 40(5), 532-538. Doi: 10.1037/a0015808

159
Field, A. (2013). Discovering statistics using IBM SPSS statistics (4th ed.). Thousand Oaks, CA: Sage Publications Ltd.
Florida Department of Education (FDOE). (2017a). Horticulture science and services curriculum framework. Retrieved from http://www.fldoe.org/core/fileparse.php/18567/urlt/8121600-1819.rtf
Florida Department of Education (FDOE). (2017b). School accountability reports: 2015-2016. Retrieved from http://doeweb-prd.doe.state.fl.us/eds/nclbspar/year1516/main1516.cfm
Frankenhauser, M. (1980). Psychoneuroendocrine approaches to the study of stressful person-environment transactions. In H. Selye, Ed., Selye’s Guide to Stress Research. New York: Vam Norstrand Reinhold, Vol. 1, 46-70.
Franklin, E. A. (2008). Description of the use of greenhouse facilities by secondary agricultural education instructors in Arizona. Journal of Agricultural Education, 49(3), 34-45. doi: 10.5032/jae.2008.03034
Gilbert, N. (2016, March 17). A natural high. Nature, 531(7594 Suppl,), S56-57.
Goyen, M. J., & Anshel, M. H. (1998). Sources of acute competitive stress and use of coping strategies as a function of age and gender. Journal of Applied Developmental Psychology, 19(3), 469-486.
Haim, S., Wang, R., Lord, S. E., Loeb, L., Zhou, X., & Campbell, A. T. (2015, September). The Mobile Photographic Stress Meter (MPSM): A New Way to Measure Stress Using Images. Association for Computing Machinery International Joint Conference on Pervasive and Ubiquitous Computing, Osaka, Japan. P 733-742. doi: 10.1145/2800835.2804398
Hansmann, R., Hug, S., & Seeland, K. (2007). Restoration and stress relief through
physical activities in forests and parks. Urban Forestry & Urban Greening, 6, 213-225. doi: 10.1016/j.ufug.2007.08.004
Harding, J. (2013). Qualitative data analysis from start to finish. Washington, DC: Sage Publications.
Hartig, T., & Evans, G. W. (1993). Psychological foundations of nature experiences.
Advances in Psychology, 96, 427-457.
Hartig, T., Evans, G. W., Jamner, L. D., Davis, D. S., & Garling, T. (2003). Tracking restoration in natural and urban field settings. Journal of Environmental Psychology, 23, 109-123.
Hartig, T., Mang, M., & Evans, G. W. (1991). Restorative effects of natural environment experiences. Environment and Behavior, 23(1), 3-26.

160
Hodson, R. (2016, March 17). Urban health and well-being. Nature, 531(7594 Suppl,), S49.
Hofstein, A., & Mamlok-Naaman, R. (2007). The laboratory in science education: The state of the art. Chemistry Education Research and Practice, 8(2), 105-107. doi: 10.1002/sce.10106
Holding, D. H. (1983). Fatigue. In R. Hockey, Ed., Stress and Fatigue in Human Performance. New York: John Wiley, 145-167.
James, W. (1892). The stream of consciousness. Cambridge, MA: Harvard University Press.
Jaggard, C. (2014). The effect of intentionally engaging attention when viewing restorative environments: Exploring attention restoration theory (Master’s thesis). Retrieved from Research Gate
Jayson, S. (2014, February 11). Teens feeling stressed, and many not managing it well. USA Today.
Kaplan, R., & Kaplan, S. (1989). The experience of nature: A psychological perspective. New York: Cambridge University Press.
Kaplan, S. (1995). The restorative benefits of nature: Toward an integrative framework.
Journal of Environmental Psychology, 15, 169-182. doi:10.1016/0272-4944(95)90001-2
Kaplan, S. (2001). Meditation, restoration and the management of mental fatigue.
Environment and Behavior, 33, 480-506. doi: 10.1177/00139160121973106 Kaplan, R. & Talbot, J. F. (1983). Psychological benefits of a wilderness experience. In
I. Altman & J. F. Wohlwill, Eds., Human Behavior and Environment. New York: Plenum Press, Vol 6, Behavior and the Natural Environment, 163-203.
Keith, T. Z. (2006). Multiple regression and beyond (1st ed.). Boston, MA: Pearson.
Laerd Statistics (2015). Statistical tutorials and software guides. Retrieved from https://statistics.laerd.com/
Lee, E. (2012). Review of the psychometric evidence of the Perceived Stress Scale. Asian Nursing Research, 6, 121-127. doi: 10.1016/j.anr.2012.08.004
Leonard, N. R., Gwadz, M. V., Ritchie, A., Linick, J. L., Cleland, C. M., Elliot, L., &
Grethel, M. (2015). A multi-method exploratory study of stress, coping, and substance use among high school youth in private schools. Frontiers in Psychology, 6, 1-16. doi: 10.3389/fpsyg.2015.01028

161
Litwin, M. S. (2003). How to assess and interpret survey psychometrics (2nd ed.). Thousand Oaks, CA: Sage Publications.
Lix, L. M., Keselman, J. C., & Keselman, H. J. (1996). Consequences of assumption
violations revisited: A quantitative review of alternatives to the one-way analysis of variance F test. Review of Educational Research, 66(4), 579-619.
Maslow, A. H. (1943). A theory of human motivation. Psychology Review, 50(4), 370-396. doi: 10.1037/h0054346
McMahan, E. A., & Estes, D. (2015). The effect of contact with natural environments on
positive and negative affect: A meta-analysis. The Journal of Positive Psychology, 10(6), 507-519. doi: 10/1080/17439760.2014.994334
National Institute of Mental Health (NIMH). (2017). Any anxiety disorder among children.
Retrieved from https://www.nimh.nih.gov/health/statistics/prevalence/any-anxiety-disorder-among-children.shtml
Nature Conservancy. (2011). Connecting America’s Youth to Nature. Retrieved from
https://www.nature.org/newsfeatures/kids-in-nature/youth-and-nature-poll-results.pdf
McMillan, J. H., & Schumacher, S. (2010). Research in education: Evidence-based
inquiry (7th ed.). Upper Saddle River, NJ: Pearson Education. Myers, B. E. & Dyer, J. E. (2006). Effects of investigative laboratory instruction on
content knowledge and science process skill achievement across learning styles. Journal of Agricultural Education, 47(4), 55-63. doi: 10.5032/jae.2006.04052
Novotney, A. (2014). Students under pressure. Monitor on Psychology, 45(8), 36. Retrieved from http://www.apa.org/monitor/2014/09/cover-pressure.aspx.
Osborne, E. W. (1994). Stretching the educational value of your land laboratory. Agricultural Education Magazine, 66(10), 3, 9.
Pergams, O. R. W. & Zaradic, P. A. (2006). Is love of nature in the US becoming love of electronic media? 16-year downtrend in national park visits explained by watching movies, playing video games, internet use, and oil process. Journal of Environmental Management, 80, 387-393. doi: 10.101016/j.jenvman.2006.02.001
Phipps, L. J., Osborne, E. W., Dyer, J. E., & Ball, A. L. (2008). Handbook of agricultural education in public schools (6th ed.). Clifton Park, NY: Thomson Delmar Learning.
Price-Mitchell, M. (2014, March 27). Does nature make us happy? Psychology Today. Retrieved from https://www.psychologytoday.com/blog/the-moment-youth/201403/does-nature-make-us-happy

162
Reynolds, J. H., Gottlieb, J. P., & Kastner, S. (2008). Attention. In L. Squire, D. Berg, F. Bloom, S. du Lac, A. Ghosh, & N. Spitzer (Eds.), Fundamental Neuroscience (3rd ed) (pp. 113-1132). New York, NY: Elsevier.
Roberts, T. G., Harder, A., & Brashears, M. T. (Eds). (2016). American Association for Agricultural Education national research agenda: 2016-2020. Gainesville, FL: Department of Agricultural Education and Communication.
Rose, J. (2017, March 1). Is exposing employees to nature the key to employee wellbeing and higher productivity? Occupational health and wellbeing. Retrieved from http://www.personneltoday.com/hr/exposing-employees-nature-key-employee-wellbeing-higher-productivity/
Rothenberger, B. H. & Stewart, B. R. (1995). A greenhouse laboratory experience:
Effects on student knowledge and attitude. Journal of Agricultural Education, 36 (1), 24-30. doi: 10.5032/jae.1995.01024
Sahlin, E., Lindegård, A., Habzibajramovic, E., Grahn, P., Matuszczyk, J. V., & Ahborg, G. (2016). The influence of environment on directed attention, blood pressure, and heartrate – An experimental study using a relaxation intervention. Landscape Research, 41(1), 7-25. doi: 10.1080/01426397.2014.982079
Shah, S. M. H., Shah, S. M. H., & Saleem, S. (2015). Level of attention of secondary
school students and its relationship with their academic achievement. Journal of Arts and Humanities, 4(5), 92-106.
Shoulders, C. W. & Myers, B. E. (2012). Teachers’ use of agricultural laboratories in
secondary agricultural education. Journal of Agricultural Education, 53(2), 124-138. doi: 10.5032/jae.2012.02124
Shoulders, C. W. & Myers, B. E. (2013). Teachers’ use of experiential learning stages in agricultural laboratories. Journal of Agricultural Education, 54(3), 100-115. doi: 10.5032/jae.2013.03100
Shows, G. D., Albinsson, P. A., Ruseva, T. B., & Waryold, D. M. (2016). Technology over-consumption: Helping students find balance in a world of alluring distractions. Retrieved from http://digitalcommons.kennesaw.edu/cgi/viewcontent.cgi?article=1106&context=ama_proceedings
Sugimoto, M., Fujita, M., & Mattson, R. H. (2004, June). The relation of physiological
and psychological effect of horticultural activity based on principal components analysis. In E. Matsuo (Convener), VIII International People-Plant Symposium on Exploring Therapeutic Powers of Flowers, Greenery and Nature. Symposium conducted at the meeting of International Society for Horticultural Science, Awaji, Japan.

163
Tennessen, C. M. & Cimprich, B. (1995). Views to nature: Effects on attention. Journal of Environmental Psychology, 15, 77-85.
Torres, R. M., Kitchel, T., & Ball, A. L. (Ed.) (2010). Preparing and advancing teachers
in agricultural education. Columbus, OH: Curriculum Material Service, The Ohio State University.
Ulrich, R. S. (1983). Aesthetic and affective response to natural environments. In I. Altman & J. F. Wohlwill, Eds., Human Behavior and Environment. New York: Plenum Press, Vol 6, Behavior and the Natural Environment, 85-125.
Ulrich, R. S. (1984). View through a window may influence recovery from surgery. Science, 224(4647), 420-421.
Ulrich, R. S., Simons, R. F., Losito, B. D., Fiorito, E., Miles, M. A., & Zelson, M. (1991). Stress recovery during exposure to natural and urban environments. Journal of Environmental Psychology, 11, 201-230.
University of Minnesota. (2016). How does nature impact our wellbeing? Taking Charge of your Health and Wellbeing. Retrieved from https://www.takingcharge.csh.umn.edu/enhance-your-wellbeing/environment/nature-and-us/how-does-nature-impact-our-wellbeing
Unni, U. (2016, March 9). Tackling the disturbing trend of stressed-out students. Lamorinda Weekly.
U.S. Census Bureau. (2018). American fact finder. Retrieved from https://factfinder.census.gov/faces/nav/jsf/pages/index.xhtml
Wells, N. M. & Evans, G. W. (2003). Nearby nature: A buffer of life stress among rural children. Environment and Behavior, 35(3), 311-330. doi: 10.1177/0013916503251445
Williams, F. (2016, January). This is your brain on nature. National Geographic Magazine. Retrieved from http://www.nationalgeographic.com/magazine/2016/01/call-to-wild/
Williams, R. A., Hagerty, B. M., Cimprich, B., Therrien, B., Bay, E., & Oe, H. (2000). Changes in directed attention and short-term memory in depression. Journal of Psychiatric Research, 34(3), 227-238. doi: 10.1016/S0022-3956(00)00012-1
Yin, R. K. (2016). Qualitative research from start to finish (2nd ed.). New York: Guilford Press.

164
BIOGRAPHICAL SKETCH
Anna Warner was raised on a farm in York County, Pennsylvania. Growing up,
she was active in 4-H and helping at her family’s feed mill in Carroll County, Maryland.
From these experiences in agriculture, Anna had no doubt that she wanted to major in
agricultural education in college.
Anna attended West Virginia University where she earned her Bachelor of
Science in Agriculture degree with a major in Agricultural and Extension Education. She
also completed her student teaching at Hundred High School in Hundred, West Virginia
under the supervision of Mr. Virgil Wilkins. Anna fulfilled the requirements to become a
certified agricultural teacher and graduated in May of 2007.
Anna’s experiences from West Virginia University and the opportunities offered
by the University of Florida brought Anna to the University of Florida to pursue her
Master of Science degree from the Agricultural Education and Communication
Department. Anna’s degree specialized in agricultural education. She served as a
graduate teaching and research assistant. Her thesis research investigated the
relationship between content area reading strategies (CARS) professional development
and implementation of CARS in the agriscience classroom.
Upon graduation, Anna taught agriscience for two years at Hereford High School
in Baltimore County, Maryland and four years at Manchester Valley High School in
Carroll County, Maryland. During this time, Ms. Warner taught fourteen different
agriscience courses, advised the FFA chapters, oversaw the Supervised Agricultural
Experiences (SAE) of her students, and impacted the lives of countless students in her
classrooms. Ms. Warner earned certification for multiple courses in the Curriculum for
Agricultural Sciences Education (CASE), including: Introduction to Agriculture Food, and
165
Natural Resources; Principles of Agricultural Science – Plant; Principles of Agricultural
Sciences – Animal; and Animal and Plant Biotechnology. She served as a lead and
master teacher for CASE, leading teacher professional development institutes during
the summer. Anna worked with another agriscience teacher and the Maryland State
Department of Education to develop a capstone curriculum. Ms. Warner was an active
member of the Maryland Agriculture Teachers Association, serving on multiple
committees and as the secretary and representative to the FFA Board. She also served
as the Career Coordinator at Manchester Valley High School where she facilitated
quality internship experiences for students.
In 2015, Anna returned to the Agricultural Education and Communication
Department at the University of Florida in pursuit of her Doctor of Philosophy degree
specializing in teacher education. As part of her assistantship duties, Anna developed
the Florida Friendly Landscape™ curriculum for extension agents, served as a teaching
assistant and lab instructor for the agricultural education pre-service coursework,
supervised student teachers, completed research with faculty members and the Center
for Public Issues Education, and worked as a member of the Owl Pellets: Tips for Ag
Teachers extension programming team. She was an active member and served in
leadership roles for the Agricultural Education and Communication graduate Student
Organization and Alpha Tau Alpha. Anna represented graduate students on the
department’s graduate committee, the AEC Advisory Council, and College of
Agricultural and Life Sciences curriculum committee. Anna is looking forward to
beginning her career as an assistant professor of agricultural education at Washington
State University.