Embed Size (px)
Citation preview

(N(N(NNA STUDY TO DETERMINE THE COST OF QUALITY(ASSURANCE TO THE DEPARTMENT OF SURGERY
AT US ARMY MEDICAL DEPARTMENT ACTIVITYIFORT BENNING, GEORGIA
A Graduate Research Project
Submitted to the Faculty of
Baylor University
In Partial Fulfillment of the
Requirements for the Degree
of
Master of Health Administration
by
Captain John A. Becker, MSC
8 May 1984
DTIC S ELECTEJUNOIIW
OuU09 U4Hu~ftQ
----------

TABLE OF CONTENTS
LIST OF ILLUSTRATIONS ................................ iv
LIST OF TABLES ....................................... V
ACKNOWLEDGEMENTS ..................................... vi
Chapter
I. INTRODUCTION ................................... 1
Statement of the Problem ....................... 3Criteria ....................................... 3Assumptions ...................................... 3Limitations ...................................... 4Literature Review ................................. 4Objectives ....................................... 9Research Methodology ............................ 10Footnotes ....................................... 13
II. DISCUSSION ..................................... 14
Operational Aspects--Department of Surgery ..... 14Medical Care Composite Unit ...................... 17Analysis of Army Regulation 40-66 ............... 18Development of QA Questionnaire ................ 20Data Collection/Analysis ....................... 21Analysis of Quality Assurance Program .......... 29Footnotes ...................................... 44
III. CONCLUSIONS .................................... 46
Further Applications Within the MilitaryV Health Care Delivery System .................... 46
APPENDICES
A. QUALITY ASSURANCE TIME LOG (MANHOURS) ........... 48
B. PRODUCTIVITY PROFILE (MCCUs) ................... 50
C. MANHOURS AVAILABLE FOR DIRECT PATIENT CARE ..... 52
D. PRODUCTIVITY LOSS (MCCUs) ....................... 54
ii ,.I~.j

6t!rg-AH F QF VIF .jZfTION 16b. OFFICE SYMBOL 7a. NAME OF MONITORING ORGANIZATION(If applicable)Graduate Program in Health Car I Admin/HSHA-IHC
6c. ADDRESS (City, State, and ZIPCode) 7b. ADDRESS (City, State, and ZIP Code)
Ft. Sam Houston, TX 78234-6100
Ba. NAME OF FUNDING/SPONSORING 8b. OFFICE SYMBOL 9. PROCUREMENT INSTRUMENT IDENTIFICATION NUMBERORGANIZATION (if applicable)
8c. ADDRESS(City, State, and ZIP Code) 10. SOURCE OF FUNDING NUMBERS
PROGRAM PROJECT TASK IWORK UNITELEMENT NO. NO. NO. CCESSION NO.
'" 1f tff T )COST OF QUALITY ASSURANCE TO THE DEPARTMENT OF SURGERY AT USARMY MEDICAL DEPARTMENT ACTIVITY, FORT BENNING, GEORGIA
l o%~rAL JUTJR
1h TYE OF REPORT 11b TIMuCVERED . 14. DATE OF 8REPORT (Year, Month, Day) 15. PAGE COUNT___ FROM TdUl 84 y 8109
16. SUPPLEMENTARY NOTATION
17. CSTCDSTRSCnbFIELD COSATI CODES i~ay EC' TRMS 4 Conji e oljreverse if necessary and identify by block number)FIELD GROUP SUB-GROUP dare, a y gouance
19, ABSTRACT (Continue on reverse if necessary and identify by block number)
This study was conducted to determine the cost of quality assurance to the Departmentof Surgery at the Medical Activity at Fort Benning, Georgia. The time spent in qualityassurance activities was assessed from committee minutes and a physician questionnaire.The 'cost' to the department was assessed by computing a physician productivity profilebased on MCCUs and computing the 'loss' of patient contact hours due to qualityassurance activities. The study found a 5.5 percent loss in productivity to theQuality Assurance Program. The Program was being run in accordance with ArmyRegulation 40-66 and significant benefits were being derived.
20. DISTRIBUTION /AVAILABILITY OF ABSTRACT 21. ABSTRACT SECURITY CLASSIFICATIONUNCLASSIFIED/UNLIMITED 03 SAME AS RPT. 0 DTIC USERS
2Za. NAME OF RESPONSIBLE INDIVIDUAL 22b. TELEPHONE (Include Area Code) I 22c. OFFICE SYMBOLLawrence M. Leahy, MAJ, MS l(512) 221-6345/2324 1 HSHA-IHC

F. QUALITY ASSURANCE QUESTIONNAIRE .................... 58
G. QUALITY ASSURANCE TIME LOG--COMPLETED ............. 60
H. PRODUCTIVITY PROFILE (MCCUs)--COMPLETED ......... 76
I. MANHOURS AVAILABLE FOR DIRECT PATIENT CARE--COMPLETED ..................................... 92
J. PRODUCTIVITY LOSS (MCCUs)--COMPLETED ............ 94
K. HOSPITAL SERVICE STATISTICS ........................ 99
L. EXAMPLES OF AUDIT CRITERIA ........................ 102
BIBLIOGRAPHY .......................................... 106
Aoaesson ForNTTS GRA&I
DTIC TAB 0Unarnounced CJustif1catto
ByDlstribut Lo
Availability CodoS
Dist s pcial
iii
LIST OF ILLUSTRATIONS
1. Department of Surgery Organizational Structure... 15
2. Martin Army Community Hospital CommitteeStructure ....................................... 30
iv

LIST OF TABLES
1. Department of Surgery Staffing During the Study.. 14
2. Physician Master Listing .......................... 16
3. Breakdown of Physician Time Spent in QualityAssurance Activities ............................ 22
4. Physician Committee Involvement .................. 23
5. Synopsis of Physician Productivity (MCCUs) ....... 25
6. Average Length of Stay by Surgical Specialty ..... 26
7. Synopsis of Physician Productivity Loss (MCCUs).. 27
8. Productivity Loss (Percentages) .................. 28
V

ACKNOWLEDGEMENTS
A project of this scope cannot be completed without
the assistance and encouragement of others. I would like
to express my thanks to all those individuals that helped
make this effort a success.
Colonel Lawrence K. Vann, my preceptor, was instrumental
in helping select a topic that was both challenging and of
interest to the institution. His guidance and support dur-
ing the entire residency year have been outstanding, for
which I am very appreciative.
Colonel Ronald G. Williams, Deputy Commander for Clinical
Services, and Colonel Joseph C. Macdonald, Chief, Department
of Surgery, provided much needed advice, guidance, and support
during the entire project. I owe a debt of gratitude to the
physicians in the study, for without their support this proj-
ect could have not been completed. A special thanks to the
secretaries and noncommissioned officers on each of the services
within the Department of Surgery, for they were instrumental in
helping collect data.
A sincere thanks is extended to Mr. Smiley K. Davis, Pro-
grammer Analyst, Data Processing Division, for his assistance
in data collection. Mrs. Elaine A. Tate, Medical Librarian,
is also to be thanked for her assistance in locating the
literature needed for this project.
vi
A heartwarm thanks is offered to Ms. Ann Dobbs, Secretary
to the Deputy Commander for Administration, for her technical
expertise and outstanding support in the typing of this docu-
ment. Her administrative support and friendship during the
residency helped make this a most enjoyable year.
My wife, Terri, and children, Shannon and Eddie, must
be recognized for their support, encouragement, and love.
Their sacrifices over the past two years have been great, and
no words written here can adequately thank them.
This Graduate Research Project
is dedicated to
my father
Alvin J. Becker
My father passed from this earth on 27 August 1983, a
time during which the proposal for this project was being
developed. He helped instill in me at an early age the impor-
tance of higher education, and had hoped to see me reach
graduation. Although this was not to be, he will be remem-
bered for that important foundation from which this work has
risen. Thanks Dad, for the goal has been reached!
vii

I. INTRODUCTION
Defense resources are limited and competition for them
in Congress is intense. In order to defend the minimum essen-
tial level of health resources needed for the Army, the Army
Medical Department (AMEDD) must have complete information to
explain its responsibilities and objectives and demonstrate
the costs and benefits of its programs to meet them.
One such program is quality assurance (QA). The Joint
Commission on Accreditation of Hospitals substantially revised
its approach to quality assurance in April 1979, and a "new"
standard went into effect 1 January 1981. Department of the
Army established a formalized quality assurance program in
July 1980 with the publication of Army Regulation (AR) 40-66,
"Medical Records and Quality Assurance Administration."
A change in the complexion of health care delivery both
in the Army and the nation has made quality assurance a central
health care issue. An increase in medical technology, the
growing complexity of hospital services, and the rapid emer-
gence of new health care professions have been contributing
factors. The level of education of the public has improved
dramatically, contributing to greater awareness of and expecta-
tions from the health care field. Hospitals have become
increasingly responsible and accountable to government and
society.

2
Significant Congressional interest has been generated
in this area since 1981 due to publicized malpractice cases
brought against Department of Defense (DOD) medical facilities.
This concern was prompted by adverse publicity surrounding
the inadequate investigation of alleged improprieties at
Wilford Hall US Air Force Medical Center--and a subsequent
$1.8 million malpractice judgement against the Government.
Defense Department auditors are currently examining a number
of aspects of quality assurance in the military medical system.
This environment has caused the AMEDD to place a great
deal of emphasis on its quality assurance program. The goal
is to provide optimal patient care within available resources.
Quality assurance requires physician involvement and time,
which reduces the time that can be spent in patient care. A
dilemma arises for the physician because he is responding to
the requirements of quality assurance, but is also being depended
upon to generate workload. The hospital's resource requirements
are defended on the basis of workload accomplished.
The physicians at Martin Army Community Hospital (MACH)
"perceive" that they are required to spend a significant amount
of time in quality assurance activities, which is decreasing
their productivity. They are given no workload credit for
their effort and feel this to be unjustified.
The purpose of this research, therefore, is to determine
if their perception is correct. How much time are they actually
spending in quality assurance, and what is the impact on pro-
ductivity? Is there evidence to suggest that workload credit
needs to be given for time spent in quality assurance?

3
The Department of Surgery provides an 'xcellent oppor-
tunity for meaningful research in this area. Surgeons are
involved in generating all of the inputs for the current
AMEDD measure of productivity, the Medical Care Composite Unit
(MCCU). They are also significantly involved in quality assur-
ance due to the nature of their specialty.
Statement of the Problem
The problem is to determine the cost of quality assurance
to the Department of Surgery.
Criteria
1. The quality assurance activities considered in this
research will be those specifically outlined in AR 40-66.
2. Productivity will be measured in terms of the Medical
Care Composite Unit.
3. Cost will be measured in terms of "lost productivity."
("Loss" as used in this criteria is a loss that is not recover-
able, i.e., quality assurance "costs" will not be eliminated,
nor is there an intent to do so.)
4. Time spent in quality assurance will be measured in
manhours.
Assumptions
1. That each physician will be involved in direct patient
care if not spending time in quality assurance.
2. That physician responses to the quality assurance
questionnaire and their daily accounting of manhour availability

4
for the Manpower Availability Report and Clinician Manhour
Distribution Report are accurate assessments.
3. That the data gathered from patient administration
and the clinics is accurate.
4. That physician staffing will remain stable during
the period of the study, and the physicians will be receptive
of the study.
Limitations
1. This project will be limited to the Department of
Surgery and to only those physicians in the department who
contribute directly to the MCCU. This will consist of
fifteen physicians.
2. The time frame will be limited based on the approval
date of this proposal and the due date of the project.
3. The MCCU is the methodology being used by the AMEDD
to measure productivity, but it is not necessarily the best
measure.
Literature Review
A comprehensive literature review was conducted utilizing
MEDLINE and manual searches, with a focus on the cost of
quality assurance. The search logic utilized the topic
identifiers of quality assurance; productivity; efficiency/
measurement; cost benefit analysis and quality assurance; and
quality assurance, health care and costs/cost analysis.

5
"While the importance of quality assurance programs to
hospital operation has been widely recognized, little atten-
tion has been devoted to the costs of such programs." I Cost
has been overlooked as a subject of investigation. 2 As a3
result, relatively little has been published in this area.
There was a great debate in the past about the cost-
effectiveness of professional standards review organizations
(PSROs), but this controversy centered mainly on their ability
to reduce utilization of hospital days and hence the cost of
care. Quality review, although mandated in the original PSRO
legislation, was largely ignored by the cost debaters.
From time to time, questions about the expense of quality
assurance surfaced from other quarters. Chairpersons of hospital
medical committees wrote articles or letters to medical journal
editors complaining about how much it cost to perform required
audits (and how ineffective such audits seemed to them in terms
of improving quality of care). Some audits were said to have
cost in excess of $5,000.
Warner discusses some thoughts about the cost of QA.4
He feels the cost of QA activities can be considerable, espe-
cially if absorbed costs are taken into account. When looking
at Veterans Administration (VA) facilities, health maintenance
organizations and similar institutions with salaried medical
staffs, physician committee time represents actual on-duty hours,
the cost of which the facility must absorb. Zelman and Jessee
consider physician committee time as an "in kind" contribution-
donated service that is not paid for by the hospital.5

6
Warner also points out that the VA has been reviewing QA
studies performed at its facilities for some time. Most of
the studies show largely absorbed costs somewhere between
$500 and $1000 per study, depending on the number of criteria
used, the size of the data sample, and the amount of expensive
professional committee time required.
Wallace and Donnelly calculated the cost of medical audit,
utilization review, and nursing audit programs at Little6
Company of Mary Hospital, Eugene Park, Illinois. This was
done in an attempt to determine whether the benefits of these
programs outweighed their cost.
The cost of each program was divided into salary expense,
non-salary expense, and indirect expense. The salary expenses
were then divided into three occupational categories: clerical,
professional, and physician. The total hours each individual
in each category was involved in each program during the space
of a year were calculated and multiplied by the amount each
earned per hour.
After studying the activities of the various audit-related
committees and the amount of time physicians spent working on
these committees, the hospital arrived at an average number of
hours physicians spent per year working on audits only.
When computing physician cost, the hospital multiplied
the total yearly hours by $25, assuming that such an hourly
figure would not be unreasonable if the hospital had to contract
for these services. It was discovered that physicians spent
437 manhours in medical audits, 1040 manhours in utilization

7
review, and 120 manhours in nursing audits. The total cost
of the medical audit program was $37,972, the utilization
review program cost $76,351, and the nursing audit program
cost $33,163.
Determining whether the programs' cost to the hospital
were completely justified was difficult. The hospital's
utilization review program decreased the overall length of
stay by one day. Yet quality of care is relative; its degree
is a function of a hospital's definition of such care. Little
Company of Mary Hospital is convinced that the benefits of
these programs outweigh their cost.
McSherry studied the cost-effectiveness of utilization
review (UR) and medical audit at the New York Hospital-Cornell7
Medical Center. He discovered that physician members of the
UR Committee contributed a total of approximately twenty hours
per week to committee activities. In the course of one year,
1,040 hours were expended. A study of the effectiveness of UR
found it to be an extremely expensive program yielding no sig-
nificant benefits.
McSherry also found that the cost of medical audit studies
(average $4,788) yielded no justifiable benefits.
Phelps develops a benefit/cost analysis framework with
which to assess the gains to society from undertaking a quality8
assurance program. His basic premise is that casual benefit/
cost analysis will likely overstate benefits and understate
costs of QA programs. Phelps points out that the opportunity
cost of a resource is of primary importance in assessing costs.

8
An example he used was a study done by a hospital of the cost
of its QA program. Much of the work undertaken in that QA
program was done by staff physicians whose time was donated
in return for access to the hospital facilities. The computa-
tion of costs for that program allowed nothing for the time of
the physicians on the grounds that the hospital had to pay
nothing to them for their time. While this procedure may have
been accurate on accounting grounds, it was an unfortunate
error from the point of view of society--the physicians involved
in that study could have been undertaking other activities which
saved lives or stamped out disease, and it is the value of that
time which is the opportunity coit of having them perform QA
work for free.
Phelps concludes by saying that QA programs are being pro-
moted as devices capable of improving the quality of medical
care, reducing malpractice and malpractice law suits, and
reducing the costs of medical care through elimination of unneces-
sary treatment. The efficacy of these programs in achieving any
of these goals has not been tested yet in any systematic fashion.
Williamson points out that quality assurance activity in
the United States has expanded rapidly in terms of manhours9
and resource expenditures. Yet there is not much in the way of
evidence that the results are commensurate to the effort. Pro-
viders are becoming disenchanted by the efforts required of them
in the face of little documented benefit.
An examination of the literature published to date yields
certain general conclusions. All work done has dealt strictly

9
with monetary costs and has been carried out in the civilian
health care sector. Little research has been done and many
questions about the cost and value of quality assurance remain
unanswered.
Although costs are important in the military health care
sector, the annual operating budget is based upon past pro-
ductivity as measured by the Medical Care Composite Unit. For
this reason, the researcher feels a more relevant approach will
be to evaluate manhours expended not in terms of "dollars" but
in terms of MCCUs, which equate to "dollars" in the military
health care system.
Objectives
1. The operational aspects of the Department of Surgery
will be fully described.
2. The operational aspects of the Medical Care Composite
Unit as a measure of productivity will be fully described.
3. Army Regulation 40-66 will be thoroughly analyzed to
determine the requirements for the AMEDD quality assurance
program.
4. A questionnaire will be developed to quantify on an
individual basis time spent in QA activities.
5. The time spent in quality assurance activities will
be identified and quantified per physician.
6. A physician productivity profile will be established
to determine what each physician is producing as measured in
MCCUs.

10
7. The potential impact of case-mix differences on pro-
ductivity among the various surgical specialties will be
addressed.
8. The cost to the department will be determined based
upon the analysis of the data gathered.
9. An assessment will be made of the quality assurance
program at MACH to determine what benefits there might be
that would offset any costs determined above.
10. The final objective is to recommend further applica-
tions of this research within the military health care delivery
system.
Research Methodolody
General Approach
This research effort will be purely "descriptive" in
nature and does not seek to explain casual relationships, test
hypothesis, or make predictions. The data collected does not
lend itself to inferential statistical analysis.
Data Collection
Time spent in quality assurance activities will be extracted
from committee minutes and a physician questionnaire. This data
will be recorded per physician as shown in Appendix A.
An individual physician productivity profile will be estab-
lished using the MCCU. The MCCU = (average daily beds occupied)
+ (10 x average daily admissions) + (10 x average daily live
births) + (0.3 x average daily clinic visits).1 0

11
Clinic visits per physician will be extracted from indi-
vidual clinic log-in sheets. Admissions, beds occupied, and
live births attributed to each physician will be extracted
from computer generated patient index cards. The daily Admis-
sions and Dispositions Report published by the Patient
Administration Division (PAD) will be used to determine dis-
charge dates. The patient index cards are updated by PAD upon
discharge to indicate the attending physician, if different
from the admitting physician. Adjustments will be made to
reflect those occasions when the admitting physician is not
the attending physician. The above data will be recorded as
shown in Appendix B.
Hours spent in direct patient care per physician will be
extracted from the Manpower Availability Report and Clinician
Manhour Distribution Report, each of which is generated by HSC.
Both reports constitute a daily accounting and identification
of each physician's manhours spent in patient care, administra-
tion, etc. This data will be recorded as shown in Appendix C.
All of the above data will be collected over the same
three month period (December 1983-February 1984).
Data Analysis
The MCCUs produced per physician during each month (Appen-
dix B) will be divided by their respective hours spent in direct
patient care during this time (Appendix C). The resultant num-
ber will be MCCUs/hour (e.g., what the physician is producing
on average). The total number of hours spent in quality
assurance per physician will then be multiplied by their

12
respective productivity levels with the resultant number being
lost productivity due to time spent in quality assurance. The
loss will be summarized for the period of the study, and this
will be the cost to the Department of Surgery (Appendix D).
A percentage loss in productivity per physician and for
the department will then be calculated. The MCCUs lost due
to quality assurance will be divided by what that physician
could have potentially produced if not involved in quality
assurance. Potential productivity will equal the summation of
actual productivity and lost productivity (Appendix E).
Data Interpretation
The cost of quality assurance may not necessarily be the
true cost if offsetting benefits exist. Although not the pur-
pose of the research effort, this issue will be addressed
through a "soft" analysis of the quality assurance program at
Martin Army Community Hospital. Is the program doing what it
was designed to do (identify and solve problems), or is it just
a paperwork exercise? Both quantifiable and abstract aspects
will be considered.
Case-mix differences among the various surgical specialties
will also be addressed in a general manner to determine what
impact they may have on a physician's input to the MCCU measure-
ment.

FOOTNOTES
IWilliam N. Zelman and William F. Jessee, "BudgetingQuality Assurance Activities," Quality Review Bulletin(February 1983), 42.
2Robert F. Wallace and Michael Donnelly, "ComputingQuality Assurance Costs," Hospital Progress (May 1975), 53.
3Allan M. Warner, "Thoughts About the Cost of Quality
Assurance," Quality Review Bulletin (February 1983), 39.4Ibid., p. 40.5Zelman and Jessee, "Budgeting Quality Assurance
Activities," p. 47.6Wallace and Donnelly, "Computing Quality Assurance
Costs," p. 53.7Charles K. McSherry, "Quality Assurance: The Cost of
Utilization Review and the Educational Value of Medical Auditin a University Hospital," Surgery (July 1976), 122-129.
8Charles E. Phelps, "Benefit/Cost Analysis of QualityAssurance Programs," Quality Assurance in Health Care(Rockville, MD: Aspen Systems Corporation, 1976), p. 289.
9john W. Williamson, The Health Accounting Approach toQuality Assurance (Cambridge, MA: Balinger Publishing Company,1978), p. 270.
10U.S., Department of the Army, "Health Services Performance:
Description and Measurement," U.S. Army Health Services CommandStudy Report (November 1982), 2-2
13
II. DISCUSSION
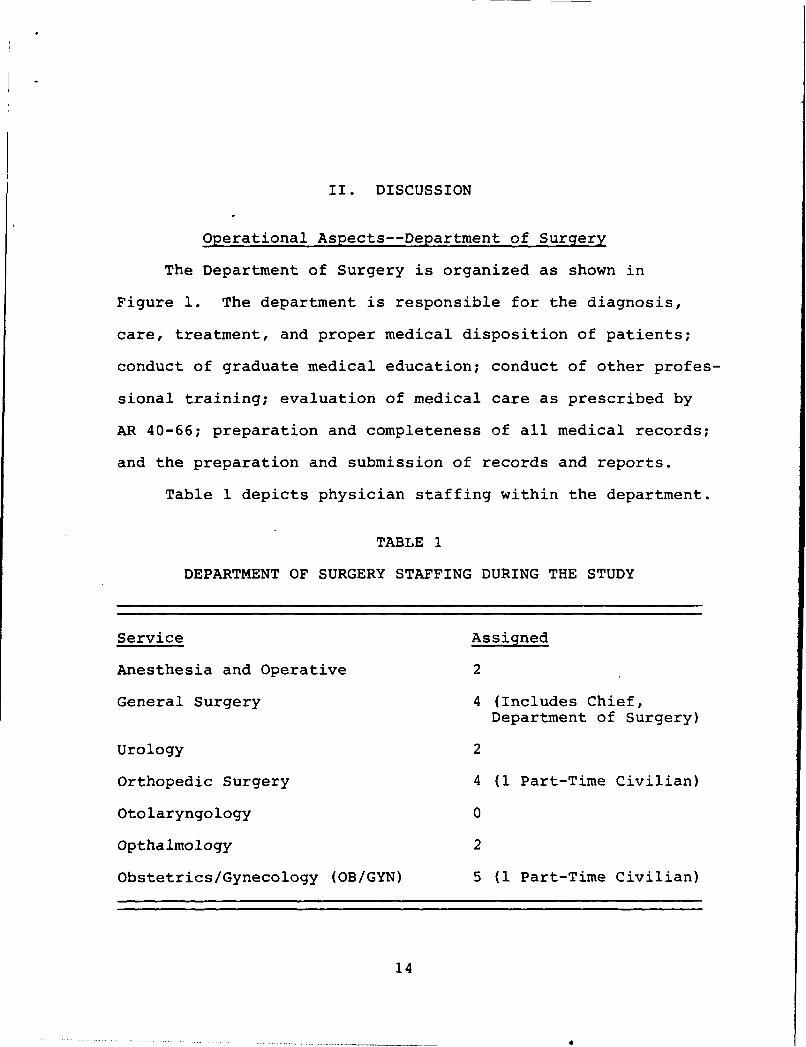
Operational Aspects--Department of Surgery
The Department of Surgery is organized as shown in
Figure 1. The department is responsible for the diagnosis,
care, treatment, and proper medical disposition of patients;
conduct of graduate medical education; conduct of other profes-
sional training; evaluation of medical care as prescribed by
AR 40-66; preparation and completeness of all medical records;
and the preparation and submission of records and reports.
Table 1 depicts physician staffing within the department.
TABLE 1
DEPARTMENT OF SURGERY STAFFING DURING THE STUDY
Service Assigned
Anesthesia and Operative 2
General Surgery 4 (Includes Chief,Department of Surgery)
Urology 2
Orthopedic Surgery 4 (1 Part-Time Civilian)
Otolaryngology 0
Opthalmology 2
Obstetrics/Gynecology (OB/GYN) 5 (1 Part-Time Civilian)
14

15
4-J
S-
CAU;

16
For purposes of this study, the physicians in Anesthesia
and Operative Service are not included because they provide no
inputs for the MCCU measurement due to the nature of their
specialty. The two civilian physicians are not included
because they work only part-time.
All services (except otolaryngology--no physician) operate
clinics and perform surgery on a weekly basis. The Chief, Anes-
thesia and Operative Service is responsible for scheduling the
four operating rooms in an efficient manner to make maximum use
of available time.
General Surgery averaged ninety-six operative procedures
per month during 1983, ophthalmology averaged fifteen per month,
urology averaged nineteen per month, orthopedics averaged sixty-
six per month, and OB/GYN averaged fifty-nine per month. 1 The
department is responsible for approximately 34 percent of all
MCCUs produced at MACH.
For privacy reasons, physician names will not be used. A
coding system utilizing letters of the alphabet will associate
physicians with their respective services for analysis purposes.
A master listing is provided in Table 2.
TABLE 2
PHYSICIAN MASTER LISTING
Identification Code Service
A-D General Surgery
E-G Orthopedics
H-I Ophthalmology
J-K Urology
L-O Obstetrics/Gynecology

17
Medical Care Composite Unit
The Medical Care Composite Unit was developed in 1958 and
has been in use by the U.S. Army Medical Department ever since
to evaluate cost and staffing in U.S. Army hospitals. The
Department of Defense has also used it for health resource
planning and allocation. The philosophy of the original develop-
ment included the following considerations:2
Patient Turnover (Admissions/Beds Occupied) - Patientswith a short duration of stay represent a consideratlyheavier workload per patient day than longer termpatients. As the average length of stay is reduced,the relative volume of administrative and professionalstaff time utilized for admissions, initial work-up,diagnosis, initiation of treatment regimen, and subse-quent disposition of patients becomes increasinglyimportant. Field surveys in a selected group of mili-tary hospitals established that the manpower associatedwith the admission and disposition process was equalto approximately ten times the manpower value of oneday of inpatient care exclusive of the turnover factor.Thus, considering the patient day as representing a"normal" or standard day of care with a weight of one,an admission is assigned a weight of ten.Births - Newborn infants are not counted as an admis-sion while the mother remains in the hospital. Fieldstudies again showed that the added workload of caringfor the newborn indicated that a weight of ten shouldbe assigned to live births.Outpatient Care - The volume of outpatient care inArmy hospitals has constantly expanded in contrast tothe decline in inpatient care. Therefore, it was con-sidered essential to establish outpatient care as aseparate element with its own weight. An average out-patient visit was found to have an average manpowervalue of three-tenths that of a normal patient day anda weight of 0.3 is used.
The current MCCU measure was described earlier under
"Research Methodology."

18
Analysis of Army Regulation 40-66
Army Regulation (AR) 40-66, "Medical Records and Quality
Assurance Administration," provides the basis for the Army
Medical Department's quality assurance program. This regula-
tion was analyzed to determine the requirements it sets forth
with respect to quality assurance activities.
The Quality Assurance Program (QAP), within the context
of the AR, involves patient care assessment, credentialing,
utilization review, and risk management.3
The first requirement establishes a minimum number of QAP
committees. They include the Executive Committee, Quality Assur-
ance Committee, Credentials Committee, Therapeutic Agents Board,
Infection Committee, and Nursing Quality Assurance Activities
Committee.
These committees are required to meet monthly (except
Credentials Committee and Therapeutic Agents Board which are
quarterly) and evaluate the quality of care on an ongoing basis.
Each committee is also required to keep minutes of all meetings.
These minutes must report the number and types of cases sampled
and reviewed, problems studied, pertinent discussions, findings,
and recommendations.
A QAP educition program is another requirement. QAP
activities and findings should be presented to the entire pro-
fessional staff and not be given to just a single department.
A statistical review of all deaths, hospital infections, and
other complications should be part of the education program.
19
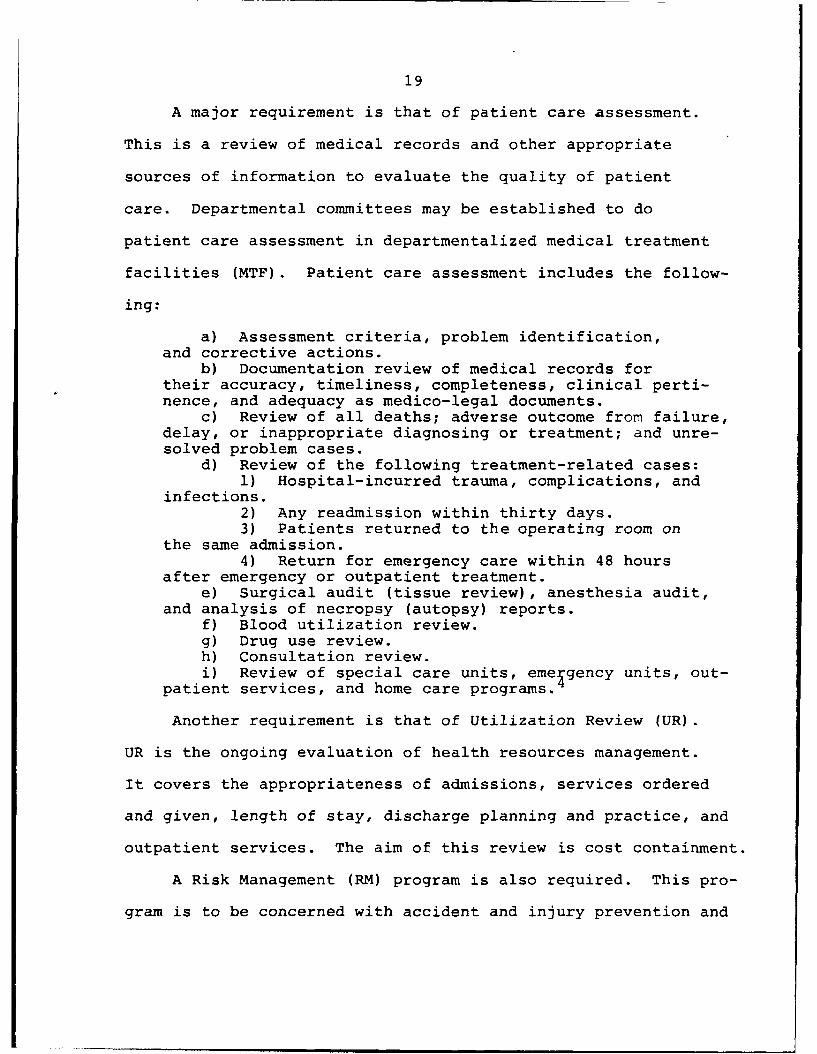
A major requirement is that of patient care assessment.
This is a review of medical records and other appropriate
sources of information to evaluate the quality of patient
care. Departmental committees may be established to do
patient care assessment in departmentalized medical treatment
facilities (MTF). Patient care assessment includes the follow-
ing:
a) Assessment criteria, problem identification,and corrective actions.
b) Documentation review of medical records fortheir accuracy, timeliness, completeness, clinical perti-nence, and adequacy as medico-legal documents.
c) Review of all deaths; adverse outcome from failure,delay, or inappropriate diagnosing or treatment; and unre-solved problem cases.
d) Review of the following treatment-related cases:1) Hospital-incurred trauma, complications, and
infections.2) Any readmission within thirty days.3) Patients returned to the operating room on
the same admission.4) Return for emergency care within 48 hours
after emergency or outpatient treatment.e) Surgical audit (tissue review), anesthesia audit,
and analysis of necropsy (autopsy) reports.f) Blood utilization review.g) Drug use review.h) Consultation review.i) Review of special care units, emeigency units, out-
patient services, and home care programs.
Another requirement is that of Utilization Review (UR).
UR is the ongoing evaluation of health resources management.
It covers the appropriateness of admissions, services ordered
and given, length of stay, discharge planning and practice, and
outpatient services. The aim of this review is cost containment.
A Risk Management (RM) program is also required. This pro-
gram is to be concerned with accident and injury prevention and

20
the lowering of financial losses after an incident has occurred.
It will identify problems or potential risk circumstances that
must be eliminated or reduced to prevent future accident and
injury.
Credentialing is the final requirement of a QAP. This
involves the delineation of clinical privileges for all health
care practitioners who are directly responsible for the diagnosis,
treatment, and disposition of patients. The Credentials Committee
is required to evaluate and either reinstate or modify the privi-
leges of all clinical practitioners at least annually.
The QA requirements discussed above are the minimum that
must be met by all Army medical treatment facilities. These
requirements provide a definitional basis for "quality assurance
activities" as used in this study.
Development of QA Questionnaire
The bulk of QA requirements set forth in AR 40-66 are accom-
plished through an extensive committee structure at MACH. As a
result, much of the data quantifying time spent in quality
assurance activities is available in committee minutes. Physi-
cians spend time, however, in quality assurance activities that
support the requirements of AR 40-66, but this time is not cap-
tured in committee minutes. After discussion with the physicians
in the department, a general consensus was reached concerning
what these activities should be. They include the documentation
review (audit) of medical records, identification/resolution
of QA problems, preparation for attendance at QA related meetings,

21
completion of QA related reports, and attendance at QAP education
programs.
A questionnaire was developed (Appendix F) to quantify time
spent in these activities and it was administered to each physi-
cian on a weekly basis over the period of the study.
Data Collection/Analysis
Time spent in quality assurance activities was extracted
from committee minutes and the physician questionnaires. This
data was recorded per physician as shown in Appendix G. Table 3
depicts a compilation of that data for the three-month study period.
One can see a wide variation among the physicians. Man-
hours ranged from 2 to 76.05, with a mean of 34.5. There are
are several possible reasons for this variance.
The physician questionnaire had some subjectivity since
each physician evaluated their own contribution to the QA effort
without scrutiny from others. Individuals vary many times in
their perception of what they are actually doing.
Humans, by their very nature, perform similar tasks at
different rates. The amount of time required to complete the QA
activities considered in this study probably differed based on
one's experience and rapidity in performing such tasks.
A wide variance existed in the numbers and types of QA
activities each physician was involved with (see Table 3 and
Table 4). Five of the physicians had no involvement in commit-
tees, while the remaining ten had varying involvement. Each of
the service chiefs attended more committees than the physicians

22
1. oO LA 00 LA LA O4~* 0 LA L 0 LA N LA Ln CN C1
0 o LA - N IV C% D %O0 0 a D RE- IV 0 w. - (N LA m N r- - ~q mv 0
LA
m c LA co LA LA %E-4 mV LA 0D 0 LA CN LA N LA
Enl H '.0 LA N 0 4C r-4 LA LA 0CNr-4 m- '
HEE-1 0
HE4 zU 0
rn N MN (n -4fnca 0u02 0%
W4 LA LA A L
H W
H 0H
~) z ~ Lf LAw lA LA
02 a 4 LA N4 00 M'
04
E-0
H H2
m w T. ~ . N LA LA t"
02 E-4
rZ4 - - - - - - -
0 0
R4LA) LA LA L
0. E-4
>N rN
U>U
z
HE-4 U
H s4 M U 0 Wz rZ4 t0 X 4 Z 0 4 4O ~>02 <~ P C
> E4 W Wz000
CIO E-a 4 C

23
TABLE 4
PHYSICIAN COMMITTEE INVOLVEMENT
NUMBER OFPHYSICIAN COMMITTEES ATTENDED
A 11
B 2
C 2** D 5
* E 4
F 0
G 0* H 6
I 0* J 6
K 1* L 4
M 0
N 4
0 0
*DEPARTMENT CHIEF**SERVICE CHIEF
within their respective services. The department chief sat on
eleven separate committees, far more than any other physician
in the study.
All physicians performed documentation review of medical
records, but to varying extents ranging from 2 manhours to
53 manhours. Eight physicians were involved in QA studies,
eight spent time in preparation for attendance at QA related
meetings, seven were involved in completing QA related reports,
and eight attended QAP education programs.

24
The differences addressed above were influenced by the
numbers and types of documentation review required of each
service, the number of physicians on each service to perform
these functions, the number of QA problems that occurred on each
service, the number of reports required of each service, and the
number of committees for which these physicians were designated
members or stand-ins.
When considering time spent in QA activities as a depart-
ment (Table 3), 52 percent of that time was spent in documentation
review, 13 percent in QA studies, 8 percent in preparation for
attendance at meetings, 5 percent in completion of QA reports,
4 percent in QA education programs and 18 percent in committees.
Documentation review is by far the largest consumer of
physician time, with committee meetings a distant second.
An individual physician productivity profile was estab-
lished using the MCCU as a unit of measurement (Appendix H).
Table 5 depicts what each physician produced during the period of
the study. Individual physician productivity levels ranged from
7.43 MCCUs to 83.7 MCCUs.
The nature of the MCCU measurement had an impact on these
productivity levels. Because admissions and live births are each
weighted by a factor of 10 as compared to a weighting of 0.3 for
clinic visits and 1 for beds occupied, OB/GYN physicians show a
much greater productivity level than other physicians. They are
the only physicians generating live births for the MCCU, and they
also have a high admission rate due to the nature of their
specialty.

25
TABLE 5
SYNOPSIS OF PHYSICIAN PRODUCTIVITY (MCCUs)
BEDS CLINIC LIVEPHYSICIAN OCCUPIED ADMISSIONS VISITS BIRTHS MCCU
A 324 53 270 31.11
B 312 60 509 35.57
C 355 64 570 38.37
D 532 70 630 46.97
E 599 82 938 56.49
F 395 30 477 27.87
G 256 28 577 23.67
H 106 49 800 27.77
I 10 6 502 7.43
J 163 34 418 20.82
K 81 18 475 13.31
L 337 93 760 47 64.52
M 439 120 696 57 79.73
N 367 104 511 56 77.24
0 440 121 915 59 83.70
TOTAL 634.57
Case-mix differences also impacted on productivity levels.
Case-mix is usually measured by aggregating groups of patients
sharing one or more characteristics. Case-mix measurements
have been related to many variables: length of stay (LOS), cost
per case, total hospital budget, death rates, and measures of
morbidity. 5 This study will compare the average LOS among the
various surgical specialties to determine what impact this may
have had.

26
Table 6 displays data obtained from the Patient Administra-
tion Systems and Biostatistical Activity, Fort Sam Houston,
Texas, for Martin Army Community Hospital during calendar year
1983.
TABLE 6
AVERAGE LOS BY SURGICAL SPECIALTY
SPECIALTY AVERAGE LOS
General Surgery 8.7
Obstetrics 3
Gynecology 4.6
Ophthalmology 3.4
Urology 7.2
Orthopedics 16.3
These differences in LOS were absorbed in the average daily
beds occupied component of the MCCU. Orthopedics, for example,
had a much higher number of beds occupied than ophthalmology
(Table 5), part of which can be attributed to differences in the
types of patients seen and their lengths of stay. OB/GYN's shorter
lengths of stay were overcome by extremely high admission rates.
The impact of these differences is lessened through the overall
MCCU calculation, however, since the "beds occupied" component
is only weighted by a factor of one.
Hours spent in direct patient care per physician are shown
in Appendix I. This data was extracted directly from the Man-
power Availability Report and Clinician Manhour Distribution
Report from HSC.
27
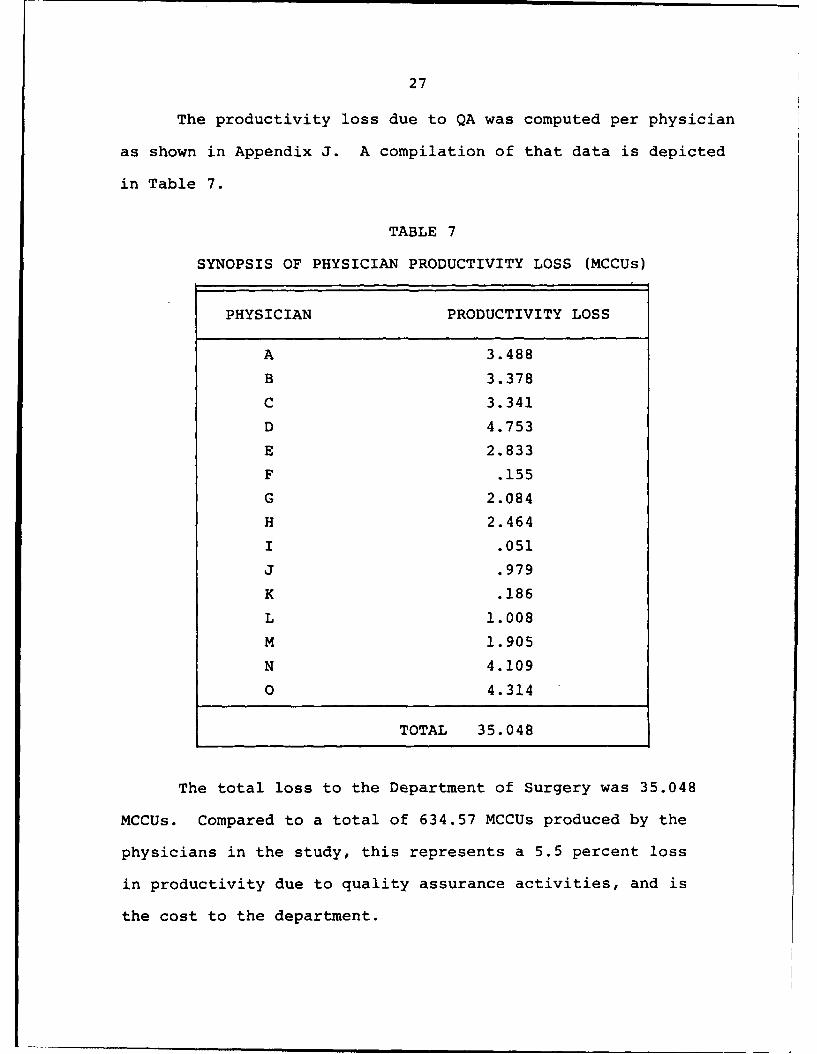
The productivity loss due to QA was computed per physician
as shown in Appendix J. A compilation of that data is depicted
in Table 7.
TABLE 7
SYNOPSIS OF PHYSICIAN PRODUCTIVITY LOSS (MCCUs)
PHYSICIAN PRODUCTIVITY LOSS
A 3.488
B 3.378
C 3.341
D 4.753
E 2.833
F .155
G 2.084
H 2.464
I .051
J .979
K .186
L 1.008
M 1.905
N 4.109
0 4.314
TOTAL 35.048
The total loss to the Department of Surgery was 35.048
MCCUs. Compared to a total of 634.57 MCCUs produced by the
physicians in the study, this represents a 5.5 percent loss
in productivity due to quality assurance activities, and is
the cost to the department.

28
A percentage loss in productivity per physician was then
calculated as shown in Table 8.
TABLE 8
PRODUCTIVITY LOSS (PERCENTAGES)
PRODUCTIVITYPHYSICIAN Y (X+Y) = LOSS (%)
A 3.488 34.598 10
B 3.378 38.948 8.7
C 3.341 41.711 8* D 4.753 51.723 9.2
* E 2.833 59.323 4.8
F .155 28.025 .6
G 2.084 25.754 8* H 2.464 30.234 8.2
I .051 7.481 .7* J .979 21.799 4.5
K .186 13.496 1.4L 1.008 65.528 1.5
M 1.905 81.635 2.3
N 4.109 81.349 5
0 4.314 88.014 5
KEY: X = MCCUs PRODUCED PER PHYSICIAN *DEPARTMENT CHIEFY = MCCUs LOST DUE TO QA **SERVICE CHIEF(X+Y) = POTENTIAL PRODUCTIVITY
These losses ranged from 0.6 percent to 10 percent per physician,
with a mean of 5.3 percent. This data indicates that as a group,
the physicians in the General Surgery Service had the greatest
percentage loss, ranging from 8 percent to 10 percent. Three out
of five service chiefs had the greatest percentage loss within
a

29
their service. The Chief, Department of Surgery had a 10 percent
loss in productivity, the highest among the physicians in the
study.
Analysis of Quality Assurance Program
The cost of quality assurance arrived at earlier may not
necessarily be the true cost if offsetting benefits exist. A
"soft" analysis of the QA program at MACH was done to determine
if any such benefits exist, and if the program is being imple-
mented in accordance with AR 40-66. Inc.uded in this analysis
will be hospital-wide activities, departmental activities, and
medical staff functions.
Hospital-Wide Activities
The QA Program at Martin Army Community Hospital was
designed to ensure that patient care services are provided at an
optimal level within available resources and consistent with7
achievable goals. The singular, overall goal of the program
is to ensure an integrated approach is achieved. The QA Committee
and the Administrative Management Committee, and those other com-
mittees which forward their written minutes to the Executive
Committee directly serve as the primary mechanism to direct and
conduct routine quality assurance activities on an on-going basis.
The committee structure and reporting mechanism are shown in8
Figure 2. The Executive Committee, which reviews, supervises
and acts upon recommendations of all committees' activities, and
which is chaired by the MEDDAC Commander, ensures the goals and
objectives of the QAP are adequately being accomplished.

APPROVAL
AUTHORITry
EXECUTIVECOMM ITTEE
QQUALIT 71- -1MNSTAIE4S 5U R A CE KA 'A GEENTCOMMITEE COMI
Subordinate SubordinateCorni ttees: ICommuittees:
AMBULATORY ~ AUT, 11T I ON A~Ei~Q7 CIPATIENT CARE . ~ GUIDAINCE - ONMTE ?D CAS= G~
COMMITTEE~~COM 177,L ______TA
.- E CVILIANHEALTH ANDCANCE~ I ZDUCATIO1N/71AINING FITNESSNTAL
COMM1TLE EOMTE INS COMMITTEE______- ADVISORY TA
t* tjMMU-, H riA .7 D DIATR)IOPTL UCJION!7 "-DI CAT 7
EDUCATION AND TRAINI1NG -, OTHERS"COMMITT~~~~ I ~ C-NMI7T~ r.OMTE_________
COMMITTEE_________ OMITE
~CRITICAL ENRG 7 E0CAL DIREC70ORCFCARE H CONSERVATION LIBRARY +HEALTH. SERVIES
0"M17TE TAS2K GO~.UP CQMM17TE:_-'= L _COM 17TE7
INFECTION ~ HMN2:CR: PROGRAM 3U;COET 7 NHEI STE_
7 -ADISRYADVISORY POMO i ON
7 NTRIIONL 7~IN~ PROGRAM 30GC T'CARE L ~ CONTROL ADVISORY CIINSUMERCOMTEE COMTE SUBCOUNCI .,JNI
AOVISCNy -~SCRY M- ANAGEME:T,--- SCARD q L~~E :.O. r Z'MTTE Y"T
M, 7,-T RANGE CO.AM!TTE OPD. COM
1'7"17:,;: 7AET M IL TAPY STA,S 7R/vI C IS'ARS2T;
C 0M ITTEEC U- !,T ____z__ zOAR B 0 1. PEN
fiorward 14 or;e s
T S u:/, L'_', 5_E'U R NCC _
C CIM iT: 7DUC
atid 2 L osSOLDiEP,'NCO F E
(forward cric-nal)
Figure 2. Martin Army Comunity Hospital Comittee Structure

31
All committees are required to earmark in their minutes
a section entitled "Quality Assurance." Within this paragraph,
quality assurance problems relating to subject areas pertinent to
the function of that committee are identified. As a minimum, all
QA problems documented in the committee minutes contain the
problem, solution, and name of the project officer.
The Executive Committee directs comprehensive integration
of problems to all interested activities, and if not accomplished
at a lower committee, will assign responsibility for problem reso-
lution. The Executive Committee also directs appropriate follow-up
action through its committee review process, and through the action
of the individual Executive Committee members within their disci-
pline (medical, nursing, and administration).
This committee monitors problem resolutions on a monthly as
well as annual basis. The QA manager compiles a report by
extracting identified problems from appropriate committee minutes
each month. This report tracks the following data by committee:
1. Date problem identified
2. Problem
3. Project officer
4. Target date for completion
5. Problem resolved?
6. Resolution
7. Resolution date
8. Follow-up dates
9. Remarks

32
In this manner, the committee is kept aware of all docu-
mented QA problems, their status, and can ensure problem
resolution does occur.
The QAP focuses on known problems, problems for which there
are local solutions, and problems that adversely impact on patient
care.
The following list of data sources are used to assist in
problem identification:
1. Ancillary services requests and reports
2. AAA reports
3. Blood utilization review
4. Committee findings
5. Current literature
6. Financial Data
7. IG reports/complaints
8. Incident reports
9. Infection control surveillance
10. Internal Review studies
11. JCAH Survey recommendations
12. Laboratory reports
13. Letters of Complaint/Comment
14. Medical audits
15. Medical records
16. Medical statistics
17. Nursing audits
18. Observations
19. Patient or practitioner profile data

33
20. Patient surveys.
21. Personnel interviews
22. Pharmacy prescriptions
23. Radiology reports
24. Safety findings/inspections
25. Tissue review
26. Utilization review
During calendar year 1983, 45 QA problems were identified
hospital-wide. Thirty-two of these problems have been resolved,1i
while 13 are pending resolution. The resolution of QA prob-
lems has resulted in improved clinical performance and patient
care. These improvements can not be quantified in numbers, how-
ever, due to the vastness of the QA program (in which many
problems are identified and solved before ever reaching the
Executive Committee level), and subjectivity in measuring the
actual impact of many corrective actions taken. Several repre-
sentative examples will be discussed as indicators of the type of
benefits that are being derived.
One significant QA problem that surfaced in 1983 was a high
staphylococcus infection rate in newborn infants. This issue was
raised by the Infection Control Committee, and a pediatric physi-
cian and the Infection Control Nurse were made project officers
with a high priority placed on resolution. The nursery was closed
for a period of time; proper washing procedures stressed; staff
carriers identified, and prophylaxis initiated. The nursery was
then reopened, with special precautions taken to prevent infection.

34
These corrective actions have resulted in no recurring problems
to newborns, with monitoring being done on a monthly basis as a
precaution.
An issue was raised at the daily Executive Committee con-
cerning the familiarity of surgeons with new equipment coming
into the hospital (specifically orthopedics). The Chiefs of
Logistics, Orthopedics, and OR Nursing were assigned as project
officers. The resolution was to conduct familiarization classes
for physicians on new equipment. This is currently aii crgoing
program which has assisted the surgeons in their clinical per-
formance.
The final problem to be discussed is that of nitrous oxide
levels in the operating rooms (during cases) exceeding established
guidelines. The Chief, Anesthesia Nursing Section was assigned
as the project officer. High priority was placed on resolution,
and it was discovered that several tanks containing nitrous oxide
were faulty. The tanks were repaired and are 100 percent opera-
tional, with no further problems arising during monthly checks.
This prospective action prevented injury from occurring to staff
and patients in the operating room, and is an excellent example
of the benefits being derived from the QA program.
Most resolved QA problems have resulted in some benefits
to staff, patients, or both. These benefits many times are
intangible, such as greater patient satisfaction with the health
care encounter, or increased staff satisfaction with the work
environment and patient encounter.

35
Statistics kept by the Patient Affairs Liaison (PAL) Office
at MACH are an indicator of patient satisfaction. The PAL office
deals with requests for assistance, complaints, and requests for
information. Historically, letters of appreciation have out-12
numbered letters of complaint by a ten to one margin. This
appears to indicate that patients in general are positive in their
attitudes concerning the quality of health care they are receiving.
The findings of a visit by the Health Services Command
Annual General Inspection Team during the period 26-30 March 1984
are an indicator of staff morale.13 The team stated staff morale
was "excellent," and that Martin Army Community Hospital was the
"best" medical facility they had inspected during the past year.
TL appears the QA program is generating benefits that are having
a positive effect not only on patients but on the staff and their
care for patients.
A review of statistical data presented to the QA Committee
on a monthly basis comparing the rates of various hospital serv-
ice indicators against both professional standards and last year's
data indicates the standard of care at MACH is well within estab-
lished limits in all categories (see Appendix K). This is another
indicator of the benefits being derived from quality assurance.
Utilization Review activities form an integral component of14
the Quality Assurance Program. UR is the ongoing evaluation of
how well the organization is managing its resources. The goal is
simply to ensure that the greatest benefits possible are derived
from the resources available.

36
The primary vehicle that is utilized at MACH for conducting
UR activities is the committee structure. All committees have
utilization review functions and responsibilities appropriate to
their area of expertise. Ongoing utilization review takes place
within all of the organizational elements as part of their daily
management practices.
The central focus of UR occurs in the QA Committee. It is
there that the following UR functions are performed:
1. Review of one-day admissions
2. Review of rescheduled admissions
3. Long-term patient roster
4. Review of length-of-stay profiles
5. Review of unanticipated lengths-of-stay
6. Review of consultation usage
7. Review comments, PAL Office
8. Review supplemental care
The committee includes nine physicians, and there is signif-
icant involvement in the review process. Medical records are
reviewed and discussed when appropriate, and particular emphasis
is placed on the long-term patient roster, review of supplemental
care, and review of unanticipated lengths-of-stay. Physicians
with patients in the hospital over certain expected lengths of
stay are required to discuss the reasons before the committee.
Dispositions have been generated by this process.
A review of supplemental care has shown exceedingly high
expenditures are being made for Computer Assisted Tomography (CAT)
scans, sometimes accounting for 50 percent of fund expenditures

37
for the month. This review has contributed to a procurement
action for a CAT scanner to be installed at MACH this fall. The
hospital will save considerable resources as a result.
The high cost of cardiology and otorhinolaryngology con-
sults/tests discovered through supplemental care review have
contributed to the initiation of a Joint Health Benefits Delivery
Program. It is expected this program will save considerable
resources also.
Unanticipated lengths of stay are carefully scrutinized by
physician review of the record to determine possible causes,
trends, and corrective actions that may be necessary.
These are just a few of the many benefits being realized
by the hospital through its Utilization Review function.
The Risk Management (RM) function is also an integral part15
of the QA Program. Its purposes are to prevent hazardous
injuries and lower the risk of financial loss to the government.
At the center of this activity is the Risk Management Committee,
which functions mainly for information gathering, analysis, and
development of plans related to risk management. Direct action
and intervention in risk management is vested in each individual
within the hospital, to include the first line supervisor in all
areas.
The reporting system for RM utilizes both formal and informal
information gathering mechanisms. Those more commonly utilized
include, but are not limited to:16
1. Reports of unusual occurrence
2. Safety reporting system

38
3. Patient affairs liaison: direct contact with patients
4. Patient Administration Division: various audits and
reports
5. Staff contacts
6. Other committees
This function is being performed in an adequate manner.
Upon notification of an unusual occurrence, department/division/
activity chiefs are insuring that proper corrective action is
initiated. The Risk Manager (Deputy Commander for Clinical
Services, also Chairman of QA Committee) is contacting the Staff
Judge Advocate (SJA) representative upon notification of an occur-
rence involving a possible loss to the government. The Risk
Management Committee is reviewing all reports of unusual occur-
rences reported during each month. Overall trends are compared and
recommendations for change made, as appropriate.
Problems, actions taken, and other related data can not be
discussed because of the sensitive nature of information relating
to this area. It was obvious during the assessment, however, that
benefits are being derived from the program.
Departmental Activities
The primary mechanism for conducting QA activities at the
departmental level is the QA subcommittees. Within the Depart-
ment of Surgery, the Subaudit Committee performs this function.
Committee minutes are forwarded to the QA Committee for review.
The chief of each service within the department sits on
the committee on a monthly basis, with the chairman being the
chief of the department. Each service makes a report to the

39
committee concerning numbers of admissions, clinic procedures,
and operative procedures. The results of medical record docu-
mentation review for both outpatients and inpatients are also
reported. All complications, infections, hospital-incurred
trauma, and deaths are reviewed and explained in a narrative
format. Cases that warrant further investigation are formalized
as a QA issue and an Ad Hoc Committee is formed to study the case
and make recommendations. This information is forwarded to the
QA Committee for review. Any cases that are potentially com-
pensable are immediately coordinated with the Risk Manager.
Quality assurance issues arising through mechanisms other than
medical record review are also dealt with in this committee, as
well as are general business issues concerning the department.
The Department of Surgery's QA efforts can best be summed
up in the "Finding of Recognition" the department received for
its QA Program during a recent Health Services Command Annual
General Inspection:
A detailed review of the Department of Surgery QualityAssurance functions indicated that their department hadinstituted a Department wide program that involved allsurgical services. This Department's Quality Assurancefunctions were well integrated and clearly demonstratedan active concurrent and retrospective record review ofall assigned providers. Complications, infections, anddeaths were actively reviewed on an on-going basis andclearly demonstrated that morbidity and mortality reviewswere accomplished in a timely manner.17
Medical Staff
The basic responsibilities of the medical staff with
respect to QA are as follows:18

40
1. Continually assess and reappraise credentials and
privilege delineation granted to all personnel considered as
health care providers
2. Document evaluation of:
a) Surgical care review (tissue review)
b) Blood utilization
c) Antibiotics utilization
d) Pharmacy and therapeutics
e) Medical records
f) Utilization review
g) Continuing medical education
h) Cardiopulmonary resuscitation
i) Ambulatory care services provided in troop medical
clinics and hospital-based outpatient and specialty clinics
j) Other activities as determined by the Executive
Committee
3. Evaluate quality of the following services at intervals
prescribed by the Executive Committee:
a) Anesthesia
b) Dietetics
c) Emergency
d) Hospital Sponsored Ambulatory Care
e) Infection Control
f) Pediatric Emergencies
g) Nuclear Medicine
h) Pathology
i) Pharmacy

41
j. Physical and Occupational Therapies
k. Radiology
1. Respiratory Therapy
m. Special Care Units
n. Social Work
The majority of these responsibilitiet are executed through
the committee structure. As shown by the findings of this study,
physician involvement in the formal committee structure varies
greatly.
Two areas all physicians are involved in include credential-
ing and documentation review of medical records. The credentialing
function is formally carried out by the Credentials Committee.
Each clinical department or specialty has criteria for granting
clinical privileges in that department/specialty. Physicians
are continually assessed as to their clinical abilities, which
causes them to maintain proficiency or have privileges suspended
or revoked.
Credentialing at MACH has been linked to physician perform-
ance in the timely completion of medical records. Physicians
that have delinquent charts are given an opportunity to make cor-
rective actions. If adequate action is not taken, a permanent
statement is entered in their credentials file. Repeated defi-
ciencies in this area result in modification or suspension of
hospital privileges. This policy, established by the Deputy
Commander for Clinical Services, has reduced the number of
delinquent charts, thus improving the quality of care. Ongoing

42
care to patients whose medical records are not available or are
incomplete is difficult and potentially detrimental to the patient.
A recent Health Services Command directive requires that
mortality and complication rates be documented for all health care19
providers, and that these rates be compared against norms. This
review is part of the annual credential review. If the provider's
rate is above the established norm, a review occurs to determine
why, and if action should be taken. This places an additional
incentive on physicians to provide quality care. As of this study,
no physician at MACH has exceeded the standards for DOD health
care provider performance.
This study revealed that all physicians are involved in
documentation review of medical records. This is one of the pri-
mary mechanisms for evaluating the quality of patient care and
identifying QA problems. Preestablished, clinically valid cri-
teria are being utilized in this review. Examples include a
standard medical record evaluation, which utilizes 27 criteria;
an anesthesia care audit, which utilizes 30 criteria; and a blood
audit, which utilizes 10 criteria (Appendix L).
Physicians also attend a QAP education program, for which
they receive Continuing Medical Education (CME) credits. This
program is conducted through a professional staff conference
held one hour each week for all physicians. Various topics
relating to QA are discussed, as well as cases of interest
within the hospital.
The physicians in the Department of Surgery know what
their responsibilities are with regard to quality assurance,

43
and they are executing these responsibilities in an exemplary
manner as evidenced by the Annual General Inspection report
alluded to earlier, and the findings of this analysis.

FOOTNOTES
U.S. Army Medical Department Activity, Fort Benning(Georgia), Minutes of Meeting of Department of Surgery Sub-audit Committee, Meeting of December 1983.
2U.S., Department of the Army, "A Study ComparingUtilization, Staffing, and Cost Trends in Civilian and CONUSArmy Hospitals," A Decade of Change in U.S. Hospitals, 1953-1963 (Washington, DC, Office of the Surgeon General, May 1965),pp. 47-48.
3U.S., Department of the Army, "Medical Record and QualityAssurance Administration," Army Regulation 40-66 (15 June 1980),p. 9-1.
4Ibid., pp. 9-3; 9-5.5Dale N. Schumacher, Cathy J. Clopton, and Dennis A.
Bertran, "Measuring Hospital Case Mix," Quality Review Bulletin(April 1982), 21.
6Telephone call to Patient Administration Systems and Bio-statistics Activity, Fort Sam Houston, Texas, 10 April 1984.
7U.S., Department of the Army, "Quality Assurance Program,"MEDDAC Regulation 40-81 (22 September 1981), 1.
8U.S., Department of the Army, "MEDDAC Committees, Sub-committees, Conferences, Boards and Councils," MEDDAC Regula-tion 15-1 (31 August 1984), Annex B.
9U.S. Army Medical Department Activity, Fort Benning(Georgia), MEDDAC Annual Quality Assurance Report of 19 January1984, p. 1.
10U.S., Department of the Army, "Quality Assurance Program,"Annex 2.
11U.S. Army Medical Department Activity, MEDDAC AnnualQuality Assurance Report, pp. 1-16.
12Telephone interview with Patient Affairs Liaison officerepresentative, Fort Benning, Georgiav 29 March 1984.
13U.S., Department of the Army, Health Services CommandAnnual General Inspection Report of Inspection of Fort Benning,26-30 March 1984. 44

45
14U.S., Department of the Army, "Utilization Review--Quality Assurance," MEDDAC Regulation 40-84 (1 May 1982), 1.
i5U.S., Department of the Army, "Risk Management/IncidentReporting," MEDDAC Regulation 40-80 (12 April 1982), 1.
16Ibid., p. 2.
17U.S., Department of the Army, Health Services CommandAnnual General Inspection Report of Inspection of Fort Benning,Finding 43.
18U.S. Army Medical Department Activity, MEDDAC Annual
Quality Assurance Report, pp. 2-4.
19U.S., Department of the Army, Health Services CommandMessage 2272, Patient Care Assessment and Risk Management Func-tions, Message of June 1983.

III. CONCLUSIONS
The cost of quality assurance to the Department of Surgery
was a 5.5 percent loss in productivity. The "significance" of
this loss is a subjective judgement that must be made by the
reader. The researcher feels that if the Department of Surgery
is representative of all departments within the hospital, then
the total cost to the facility may warrant concern. An analysis
of the Quality Assurance Program, however, revealed that it was
being conducted in accordance with AR 40-66 and significant
benefits were being derived. The researcher feels that these
benefits outweigh the cost even if some benefits are intangible.
The impact of quality assurance activities on individual
physician productivity varied greatly, ranging from 0.6 percent
to 10 percent. Fifty-two percent of time spent in QA activities
was devoted to documentation review, while 18 percent was spent
in committees. For the three month period of the study, 504 man-
hours were spent in QA activities. This evidence suggests that
enough time is spent in QA activities to warrant workload credit,
but further research is required to validate this finding.
Further Applications Within the Military
Health Care Delivery System
The methodology used in this research effort is entirely
applicable to alternate Army medical treatment facilities. This
46

47
methodology has proven its effectiveness at the departmental
level. Further research should concentrate on applying it
hospital-wide to determine the total cost to the facility. Phy-
sician time spent in QA activities may vary greatly among facil-
ities based upon how individual programs are implemented and
physician interest/involvement. Likewise, the benefits derived
may vary significantly depending on the effectiveness of these
programs.
It is recommended that the definitional basis of "Quality
Assurance" be expanded beyond that of AR 40-66 to include other
QA related activities such as time spent on ward rounds, time
spent teaching interns and residents, time spent teaching and
preparing lectures for house staff, etc.
Further applications should include the development of rela-
tive value scales and workload credits for QA activities that
physicians perform.
The cost of quality assurance programs will continue to be
an issue of concern in these times of increasingly limited
resources. Further research is needed to help solve the dilemma
that exists between increased quality assurance requirements and
decreased resources with which to conduct these programs.

APPENDIX A
QUALITY ASSURANCE TIME LOG (MANHOURS)

49
LU-
cm i
4) m-
C00
Cl, - - - - -

APPENDIX B
PRODUCTIVITY PROFILE (MCCUs)

51PRODUCTIVITY PROFILE (MCCUs)
PHYSICIAN NAME: _ _______TIME PERIOD: ________
BEDS CLINIC LIVEWEEK OCCUPIED ADMISSIONS VISITS BIRTHS
MonthlyTota_Daily
Average __ _ _ _ _ _ __ _ _ _ _ _ __ _ _ _ _ _ __ _ _ _ _ _
MCCU_________ 10 .3 1 1 MCCU
Calculti on + + ______+_____
5 ________ ________ ________
6 ________
7 ________ ________
8 _ _ _ _ _ _ _ _ _ _ _ _ _ _
MonthlyTotal__ _ _ _ _ _ __ _ _ _ _ _
DailyAveraciMCCU
Weight -10 .3 10 MCCU
Calculation _____+_____+-~ I10 _ _ _ _ _ _ _ _ _ _ _ _ _
MonthlyTotal _ _ _ _ _ _ _ _ _ _ _ _ _ _ _ _ _ _ _ _ _ _ _ _ _ _ _
DailyAverane __________
MCCUWeight ___ ___10 .3 10 MCMCCU ++
Calculation++
TOTAL MCCUs = Month 1 + %-~i7 + -F
APPENDIX C
MANHOURS AVAILABLE FOR DIRECT PATIENT CARE

53
MANHOURS AVAILABLE FOR DIRECT PATIENT CARE
- MONTH ______
PHYSICIAN _______ TOTAL
GRAND TOTAL ______

APPENDIX D
PRODUCTIVITY LOSS (MCCUs)

55
4J)
LV.
S-0
=
4J
U a
-J
4 -)0 Cl.
-C 3
I- 4J
(.3 -I--

APPENDIX E
PRODUCTIVITY LOSS (PERCENTAGES)

57
PRODUCTIVITY LOSS (%)
ProductivityPhysician Y (X+Y) Loss (%
KEY: X = MCCUs Produced per PhysicianY = MCCUs Lost Due to QA(X+Y) = Potential Productivity

APPENDIX F
QUALITY ASSURANCE QUESTIONNAIRE

DISPOSITION FORMFor use of this form, see AR 340.15; the proponent agency is TAGO.
REFERENCE OR OFFICE SYMBOL SUBJECT
HSXB-AR Time Spent in Quality Assurance Activities (Graduate ResearchProject)
TO Adj utant FROM DATE CMT I
ATTN: Admin Resident
I spent the following amount of time in quality assurance activities for the period
Activity Ti me
Audit of Patient Treatment Records ________
Identification/Resolution of QA Problems (QA Studies)________
Preparation for Attendance at QA Related Meetings________
Completion of QA Related Reports ________
QA Education Program ________
DA FUG0R 49 PREVIOUS EDITIONS WILL1 BE USED ~U. S. G.PO 92-

APPENDIX G
QUALITY ASSURANCE TIME LOG--COMPLETED

61
r- 00 Ln N r- 0
(o 4-4 00 Lr 4 ) 0
c00'
LAJ0-
U.A--
rC) rn LAi4~~C1 qT,4r- _ _
LA LA LA)
LAl LA LAI
C-0 LOA LAj LA LA- N
ON NN N
U.S -- c
Ln~ en
94 -4-N
(N
LLA
-l --- -- -4 m
C-4 'n
r- - -4 r-4 --1 - -4 r-4 (N c
9...d - 1 (a 4- -4
4) c'i . ~ 4-A U, ' 03 , ~4-) 0) 0j r_ -) <= w 0 =-v O~_____ _ ~cm

62
r-~r r-L Lw L0 LA 0 . DQ~L
....... .U . .
(N v-4 (N -40
LiJ,

63
> j LA C9 )
00I Rd- LO r r-. i*o 00o 00 m- c
al 4.JZol '
w - c
VI-
CC,--
LiJ 9
LC! L9
CQ InJ CC L
V) -4
C, m q) C4- LA 4-) C, Co 4-) 0CC= w0 = CD-a- _ ____ ____ ____ ____

64
U') LO Ln LO Lnf-i- CU(% L L9 LA .
wJ- a. ) a% q c .JO LO '0 co r-. co Oi - to 0- CA
woCl I-, n
0.
u -
0U0
C" " L
m~I gli C~jf.
J
a -n CZ c-4 a 1

65
.x (a LA LO LO c mA_ " 0
c 0C1.1 LA; -1, cmJ C C%; c; 9- C - r-
9-iC' C~j
0
LUJ
CU
-i
Ln
in
LAL LA LALOr ~-9 -9 -l 9- I-
O r m C V- C .-)
~ - - - - - - - - - - - - - - -
~~~~c, m---------------------------------
A -~~
C*IQ CD - ' - ~
'4 - --)
-c - +a-C-~l
m ~ LO .= 9 0o(A2
M~.,

66
L"J
Cd,~~ ~ 59'---
.11 In %0 - - -o a - m - -CD

67
p--
0j) 61 en LL U LO to -~~ LO '.0 U-lA LO '.0 0 CM.
w 0- I " I .J .)
0j0
C-3
- D,-
tn
tooi- 4-jW 0
MF -c -o -0 ---------- C

68
Lo Om Lr LO C... Ul04 LA u-rl. O
LJJ -W C c Cj C o;1 r- - -
w0 r
LiJ
ciL!LO LA LA PA LA LA
m- r-.co cn
LALn~ ~I -Q
-C,() Y
I-. CV) (Y) C9
L9LA LA L9
LO LA LA
4..m,. r. c
Ln 0,

69
- ~ ~ JCV zr C'J C~J C~j CJ c C'J Cj c.J c9J
0
VII
C,,
(Ao
-49
- - - - -- CO - - - -M-c

70
jfl L A L A ,-00 LA
L-u- Ln LO i- p-A CDJ V ~) 00 Loko &"I 9-i c\Al
LjJ
01
IU ,
LU9
r%. co - C
In rn'IC

71
N, LO , U,) LO
I--C.. C . U C"! C . LC! L9
LhAh
IN0
I- - m -W c - o rft a4
LU -PR

72
.u t
LiJ
jJ
-4
090
LJ 0- -W
=K -jo
U-) r- CO

73
04C~ C14 Lt) CLO koi
CAJ
cr
LAV - - - -CA
'-4
cmC1-Oc
(A a- o -4-
01Cl

74
p..-Ln LO.W. L C LA L C\I
cu -c -% -1 -% Cj m O
- - - - - - - - - - - -
0z
(I, I-nI
0O L
Cdj
>-4 -j 4 c
>. 4-J

75
4- J
C-'
Laj --
I-
0&
LJJ 9
I- -j
3:J r-i c - I~

APPENDIX H
PRODUCTIVITY PROFILE (MCCUs)--COMPLETED

77PRODUCTIVITY PROFILE (MCCUs)
PHYSICIAN NAME: A TIME PERIOD:
BEDS CLINIC LIVEWEEK OCCUPIED ADMISSIONS VISITS BIRTHS
2
3
4
Monthly3841
DailyAveracie ,1.23 .13 2.61
MCCUWeight " 0- .3 10 MCCU
Calcu~ation 1.23 + 1.3 + .78 + =3. 31
5
8Monthly 160 25 98TotalDaily 5.16 .81 3.16AverageMCCUWeight " 0 .3 10 MCCUMCCU 5.16 + 8.1 + .95 +=14.21
Caulation __
9
10
11
12MonthlyTotal 126 24 91Daily
Averaqe 4.35 .83 3.14 _ ___
MCCUWe10ht . MCCUMCCU
Calculation 4.35 8 1.3 + .94 + 1 13.59
MCCUs nthl y+ Mnth 2 + Month 3

78
PRODUCTIVITY PROFILE (MCCUs)PHYSICIAN NAME: B TIME PERIOD:
BEDS CLINIC LIVEWEEK OCCUPIED ADMISSIONS VISITS BIRTHS
Monthly 72Total24 3DailyAverage .10 2.32MCCU
Weigt 10 .3 10 MCCUMCC U
Calculation .77 + 1 + .70 + 2.47
6
7
8MonthlyTotal 140 25 192Daily
A'veraqe 4.5 .81 6.19MCCUWeight 10O .3 10 MCCUM C C U 4 58 11 8 4 4Calculation 45 + 81 + 18 44
UII
12MonthlyTotal 148 32 245Daily
Average 5.1 1.1 8.45
MCCUWeight - 10 .3 10 MCCU
MCCU 5.1 + 81 + 2.54 + 18.64Calculation I II
TOTAL MCCUs I + Month = 35.57

79
PRODUCTIVITY PROFILE (MCCUs)PHYSICIAN NAME: C TIME PERIOD:
BEDS CLINIC LIVEWEEK OCCUPIED ADMISSIONS VISITS BIRTHS
l
2
3
4
Monthly 1 91 0TotalI19920D a i l y3 .4. 16 8
Averaq 3.84 .61 6.68
MCCU - 10 .3 10 M_
Wei ghtL"lO. l0MCMCCU
Calcuation 3.84 + 6.1 + 2 + 11.94IIU
5
6
7
8Monthly 1 52 0Total 152 0D a i ly 4 6 7 .Average .8 7 .MCCU
Weiaht 10O .3 10 MCCUMCCU 4.68 + 7.4 + 1.95 + =14.03
CaIr~ulation
9
10
II
12Mo nthly 91 2216Total I 9 21
Avealy 3.13 .76 5.55Mvrce C
Weigqht " 0 .3 lO10C
mCcuto 3.13 + 7.6 + 1.67 + =12.4
TOTAL MCCUs - + + = 38.37MothIonth ot

80
PRODUCTIVITY PROFILE (MCCUs)PHYSICIAN NAME: D TIME PERIOD:
BEDS CLINIC LIVEWEEK OCCUPIED ADMISSIONS VISITS BIRTHS
2
3
4MonthlyTotal 150 15 174 .
DailyAveraQe 4.84 .48 5.61MCCUWeiht -10 .3 10 MCCU
Calcufation 4.84 + 4.8 + 1.68 + II.32
5
7
8
Monthly 215 29 244Total 15 29 244DailyAvera 6.94 .94 7.87
MCCUWeight 10 .3 10 MCCUMCCU + +
Calculation 6.94 9.4 2.36 18.7
9
10 _ __ __ _ __ __ __ _
12
Monthly 167 26 212Total 167_26_212Daily 5.76 .90 7.31
Averace 5MCCUWeight - IC .3 10 MCCUMCCU
Calculation 5.76 + 9 + 2.19 += 16.95Talcth I ITOTAL MCC';s = Monit + MoanthF + % E-t'R

81
PRODUCTIVITY PROFILE (MCCUs)PHYSICIAN NAME: __TIME PERIOD:
BEDS CLINIC LIVEWEEK OCCUPIED ADMISSIONS VISITS BIRTHS
2
4
Monthly 97 8 211Tot~al
Daily 3.1 .26 6.81AverageMCCUWeight__- _ 10 . 10 MCCU
CalMFUtion 3.1 + 2.6 + 2.0 + 7.7
6
7
8Monthly 2 73 6Total 273 6
Da ily 9 2 1 6AVeraq¢926lI .6MCCU
Weigqht; 10 .3 10 MCCUMCCU+++
Calgulation 9.26 10 3.50 +=22. 8
II*
12Monthly 362
Total 1 4 6Daily 1.68
Averace 7.41_._4812.5
MCCUWeight 10 O .3 10 MCCUMCCU 7.41 + 14.8 + 3.78 + 25.99
Calculation _ _ _ _ _ _
9O A 5 6 .49___ _ _ _ _ _ __ _ _ _ _ _ _ _ _ _ _ __ _ _ _ _ __ _ _ _ _ _
DailyFRT %-T T + %-T

82
PRODUCTIVITY PROFILE (MCCUs)PHYSICIAN NAME: F TIME PERIOD:
BEDS CLINIC LIVEWEEK OCCUPIED ADMISSIONS VISITS BIRTHS
1
2
3
4Monthly112ilTotal I1Daily3 .1. 6.5Average3.1.6.5
MCCUWei aht " l0 .3 10 MCCU
Ca u ation 3.1 +.6 + 1.07 += 5.281
5
6
7
8Monthly15817Total15817Daily 4.84 ,26 5.74
AverageMCCU
Welicht 10O .3 10 MCCUC cuto 4.84 +2.6 + 1.72 + = 9.16
12Monthly I
Total 133 20 188Daily
Average 4.59 .69 6.48MCCU
Weight -10 .3 l10 MCCU
C cuato 4.59 + 6.9 + 1.94 + =13.43Cacuion+Mnh2+Mot 78 1
TOTAL MCCUs T -7 ot 7+ RF 78

83
PRODUCTIVITY PROFILE (MCCUs)PHYSICIAN NAME: G TIME PERIOD:
BEDS CLINIC LIVEWEEK OCCUPIED ADMISSIONS VISITS BIRTHS
2
3
4
Monthly 8
Daily 2.78 .13 1.23Average
MCCUWei aht; " 10 , 10 MCCU
Calcu~ation 2.78 + 1.3 + .34 + =4.42
5
8Monthly 83 4 298
TotalDaily 2.68 .13 9.61AVeraqeMCCU
Weight 10 .3 10 MCCU
MCCU 3.68 + 1.3 + 2.88 +=6.861Calculation 2
9
10
I m
12Monthly 87 20 241Total IDaily 3 .69 8.31
AveraeMCCU MCCUWeight "0. .3 1MCCU 3
Calculation 3. + .3 + 2.8 +-
TOTAL MCCUs 0 + 2nt1 + 23.67

84
PRODUCTIVITY PROFILE (MCCUs)PHYSICIAN NAME: H TIME PERIOD:
BEDS CLINIC LIVEWEEK OCCUPIED ADMISSIONS VISITS BIRTHS
1
2
3
4MonthlyTotal 8 3 205Daily
Average .26 .10O 6.61
MCCUWeiqht "1l0 •.3 10 MCCU
MCC U . +UCalculation .26 1 1.98 +=3.24
5
6
7
8Monthly 4 1Ttal45731Daily 1 4 8 0 1
MCCUWeight; 10O .3 10 MCCU
Ccutn 1.45 + 8.7 + 3.05 + =13.2
12Monthl y 531 8TotalI5 8Daily l1.83 .66 9.66
AveraceMCCU
Weight 10l .3 10 MCCUMCCU 18 . . 13
Calculation 18 . . I3lmw :27.77TOTAL MCCUs = + ,n-tF7 + Mot3

85
PRODUCTIVITY PROFILE (MCCUs)PHYSICIAN NAME: ITIME PERIOD:
I BEDS CLINIC LIVEWEEK OCCUPIED ADMISSIONS VISITS BIRTHS
2
3
4Monthly ll
Total 0 0 60
Daily.Average 1.94
MCCUWei cht - 1 10 • .3 10 1MCCU
CalMcuation 0 + 0 + .58 + =.58
5
8MonthlyTotal 4 2 242Daily
Average .13 .07 7.81MCCU
Weight 10 .3 lO MCCU
MCCU + + +Calculation .13 .7 2.34 3.17
9
10
11
12Monthly 6Total 642
DailyAveraqe 7.81MCCU
Wei__ht 1 l0 .3 10 MCCU
MCCU .21 + 1.4 + 2.07 + = 3.68Calculation 7 2
TOTAL MCCUs = Fnv + + = +7.43
9ot 1________ Month __Month 3 _

86PRODUCTIVITY PROFILE (MCCUs)
PHYSICIAN NAME: _TIME PERIOD:
BEDS CLINIC LIVE
WEEK OCCUPIED ADMISSIONS VISITS BIRTHS
2
3
4MonthlyTotal 19 3193Daily
Average .61 .]6.23MCCU
Weiaht 10l .3 10 MCCU
Calcu~ation .61 + 1 + 1.87 + :3.48]
6
7
8MonthlyTotal 78 16 125
ADealy 2.52 .52 4.03
MCCUWeight "10O _ .3 10 MCCU
MCCU
CCulain 2.52 + 5.2 + 1.21 + =8.82
100 MC
11
Monthly 61 1 1.7Total661lODaily 2.28 .52 3.45
AveraceMCCUWeight " 10 .3 10 MCCU
Calculation 2.28 + 5.2 + 1.04 + = 8.52
TOTAL MCCUs 15-"'- + Month 2 0nth 3
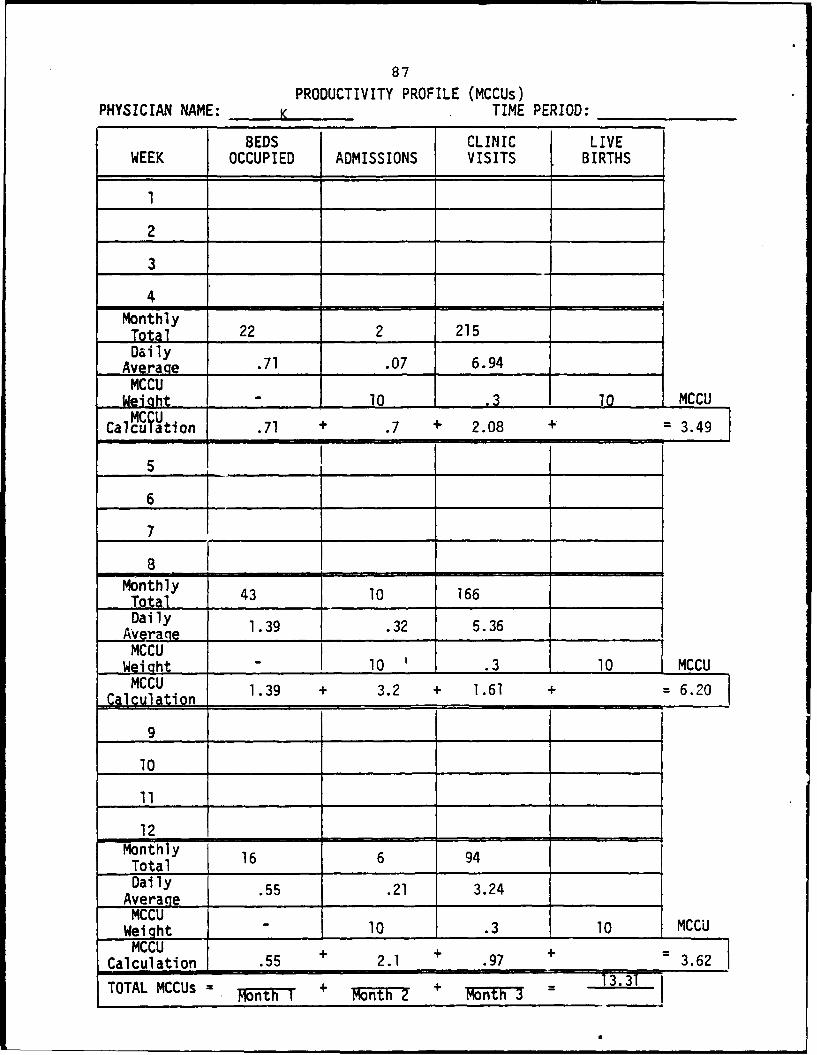
87
PRODUCTIVITY PROFILE (MCCUs)PHYSICIAN NAME: K TIME PERIOD:
OBEDS CLINIC LIVE
WEEK OCCUPIED ADMISSIONS VISITS BIRTHS
2
3
4
MonthlyTotal 22 2 215Daily
Average .71 .07 6.94
MCCUWeight - 10 .3 10 MCCUMCu
Calcuation .71 + .7 + 2.08 + =7 3.49
6
7
8Monthly 4 0 166Total 43 10 166
Daily 1.39 .32 5.36AverageMCCU IWeiQht " 10 .3 10 MCCUMCCU 1.39 + 3.2 + 1.61 + 6.20
CAlgulation9
12Monthly 16 6 94Total 16_6_94Daily .55 .21 3.24
AverageMCCUWeight " 10 .3 10 MCCU
MCCU + + +Calculation .55 2.1 .97 3.62
TOTAL MCCUs = + %ont + = 13.31

88
PRODUCTIVITY PROFILE (MCCUs)
PHYSICIAN NAME: L TIME PERIOD:
BEDS CLINIC LIVEWEEK OCCUPIED ADMISSIONS VISITS BIRTHS
2
3
4
Monthly 139 35 . 147 16
Daily 4.16 1.13 4.74 .52AveraqeMCCUWeiaht - 10 .3 10 MCCUMCCU 14 52220
Calculation 4.16 + 11.3 + 1.2 + 5.=20
8
MonthlyTotal 129 37 267 21DailyAVer ag 4.16 1.19 8.61 .68
MCCUWeight 10O .3 10 MCCU
MCCU++galculation 4.16 11l.9 + 2.58 + 6.8 =25.44
9
10
12MonthlyTotal 79 21 346 10
Daily
Averaie 2.72 .72 4.93 .35
MCCU
MC CU
Wfight 10l .3 10 MCCU
Calculation 2.72 + 7.2 + 3.58 + 3.5 =217
Caluntly
OALe i 4.16 1 8.61t-7 68
TALMCCUs ~ t ot ot

89PRODUCTIVITY PROFILE (MCCUs)
PHYSICIAN NAME: M TIME PERIOD:
BEDS CLINIC LIVEWEEK OCCUPIED ADMISSIONS VISITS BIRTHS
2
3
4
MonthlyTotal 136 40 276 23
DailyAverage 4.39 1.29 8.9 .74
MCCUWeiaht - 10 .3 10 MCCUMCCU.]
Calculation 4.39 + 12.9 + 2.67 + 7.4 27.36
5
6
7
8
Monthly 149 39 272 15T9149
Daily 4.81 1.26 8.77 .48Averane
MCCUWeight " 10 .3 10 MCCUMCCU 4.81 + 12.6 + 2.63 + 4.8 24.84
Calculation
10
11
12MonthlyTotal 154 41 148 19Daily
Averaae 5.3 1.41 5.1 .66MCCUWeight -10O .3 10 MCCUMCCU +
Calculation 5.3 14.1 + 1.53 6.6 27.53
TOTAL MCCUs - Month-I + Month2 + Mot 3 = 79.73

90PRODUCTIVITY PROFILE (MCCUs)
PHYSICIAN NAME: N TIME PERIOD:
BEDS I CLINIC LIVEWEEK OCCUPIED ADMISSIONS VISITS BIRTHS
1
2
3
4
MonthlyTotal 107 33 113 21DailyAverage 3.45 1.06 3.65 .68MCCUWeiaht - 10 .3 1 MCCU
CalcuMf Ution 3.45 + 10.6 + 1.1 + 14.28 29.43
8MonthlyTotal 152 41 206 18DailyAvcraiy 4.9 1.32 6.65 .58MCCUWeight 10 .3 10 MCCUMCCU
Calculation 4.9 + 13.2 + 2 + 5.8 = 25.9
9
12Monthly
Ttl108 30 192 17
Dvaly 3.72 1.03 6.62 .59
MCCUWeight " l10 .3 , 1l_0 MCCUMCi 3.72 + 10.3 + 6.99 + 5.9 21.91
Cal culation + 1 +
TOTAL MCCUs - -- T + Month + Mon Z3 =.77.24

91PRODUCTIVITY PROFILE (MCCUs)
PHYSICIAN NAME: n TIME PERIOD:
BEDS CLINIC LIVEWEEK OCCUPIED ADMISSIONS VISITS BIRTHS
2
3
4MonthlyTotal 106 31 284 17Daily3 .219 1.5Averaqa34e 91 5MCCU
Wei q 10 .3 10O MCCUMCCU.
Calculation 3.42 10l + 2.75 + 5.5 =21.67
5
7
8Monthly 129 35 332 16TotalDaily 4.16 1.13 10.71 .52Averaqe
i MCCUSWeiqht 10O .3 10 MCCU
CacuItn 4.16 11l.3 + 3.21 + 5.2 23.87
! 9
12MonthlyTotal 205 55 299 26
Avealy 7.07 1.90 10.3 .90
i ~~MCCUlO.I0MCWeight10.10MCCcuto 7.07 + 19 + 3.09 + 9 38.16
TOTAL MCCUs = + Mo16nth 2 + Mot6 3.7
1 ____________ __________________________

APPENDIX I
MANHOURS AVAILABLE FOR DIRECT PATIENT CARE--COMPLETED

93
MANHOURS AVAILABLE FOR DIRECT PATIENT CARE
MONTHPHYSICIAN DECEMBER JANUARY FEBRUARY TOTAL
A 123 150 152 425
B 160 232 240 632
C 253 232 240 725
D 186 275 293 754
E 157 177 182 516
F 103 237 212 552
G 171 179 236 586
H 92 145 118 355
I 48 142 104 294
J 171 218 188 577
K 168 183 87 438
L 156 262 241 659
M 196 285 212 693
N 244 267 243 754
0 216 225 267 708
GRAND TOTAL

APPENDIX J
PRODUCTIVITY LOSS (MCCUs)--COMPLETED

95
> Ln o m 0 0 0 0 CD COC ON %0 0 C00A C) r-_ 00 C\J r-.. P% o CD Kr q D a lA
CA CD U) V)(r m ~ oo M n m O CDJ r.u01
1-
0.0'r 00 lr- cn LA UlV) 0D to LA '0 i ~ n,0 Ln LA
Wf.9 ON r-. c' oo to coL O
La ) ~ LO a% LC) C14 co r% 0 C%j 9- 0 00ON co r- %0 r.% q~ tD LC) .0 to LA
Ln
U W
> W 00 CD 04C C1 0) m~ C~j 0D to LA nI~ LA LA ko cn Kr LA cn) qw 00 r. 0
4-)~C4 \ C~J C~j CIQ r- Cj C-i
L.. u)L.C
CL~
oO (M LA kLA ~rC) P- LoC ~ Lc) qcA LA koO L Ar f n l
-- - - 0~ K0 0- 0 %
-- -
9-j m~ -j r- oc- y ' - CJL

96
41or 0 \ (% .- en CJ a% .cr LA O (D 0 -r 0 CIO m
>% CD cn, LO cn ko LO r- C0 t.o 00 cn CD0-- i r co 0 0 C) CD %0 to C)C %
41
V) LA 1- 9~ '.0 0-r o D C J C i O
x
_ON ON cJ c'~4 ON qc %.0 o CV~) ULA % 04f J ~ CIQ LA (r) t0 c'lJ M' LO CV) ON m
-aS
S.~Ig r. r.. cm. (C" I- cl.a (n to e.i ULA co-- LA P,. co 0D m~ -r ~O ~
w In4- C)U L)io - o o LI) ) 4n U
-o %..o0 0 Zo0m%.Ooo* CD .-z -0 J
%0 Ln mc '. C J 10, %0. cl C,i. C',; % - ~ c ~ - e.z c.
.141I *I
~~~~~~~~~~~~~- ~ s C 0 C) L ~ - ~ . % - ') CM,
C % ~ -e

97
>U cci to -r~C.J . CJ CJ o~0n O 00 0 0 C- '-- 04 0 0)LA ~
u C J ) : CJLn )C % nC
=Cr In
m cn c m % 0.- c
CDC
>-.
;. c*% 0 ' o coc ,-4 CDJ c A0 '
S- 0 0 0
-a .
UW-
-n cc 'nr
LeOle

98
(%J cli CI Lo- LAO ) 0i LO -W>c c o C) qd o CD 0D LO I- ICA Lo CA Um) LA j M% CA CsJ e-
C-
IIO
0.' - LA LA LA
1 ~ ~ O C'~J C J c') .~ LO
CD CD. ko 0 0
CD a
-
(n (A I In
m n wn0 o-
oi P, O r, ovol 0i 0mCQ \
-jI
CC

APPENDIX K
HOSPITAL SERVICE STATISTICS

Month of December 1983
100Number RATES AND PERCENTAGES
Current To Date Current TO Last Same MonthDate Year Last
1. Gross Deat'- Rate (Excl. fetal deaths, 10 116 1.2 .9 .7 1.4DOA's) (4%)
2. Net Death Rate (after 48 hours) (2.5%) 5 73 .6 .6 .4 .7
3. Maternal Death Rate (.25%) 0 0 0 0 0 0
4. Neonatal Death Rate (2%) 0 7 0 .6 .6 .8
5. Postoperative Death Rate (1%) 0 0 0 0 0 0
6. Anesthetic Death Rate (1 in 5000) 0 0 0 0 0 0
7. Fetal Death Rate 0 10 0 .8 1.1 0
8 Autopsy Rate 7 49 70 42.2 47 62
9. Number of Tubal Ligations 10 126
10. Number of Therapeutic Abortions 0 1
11. Number of Vasectomies 10 101
12. Normal Tissue Removed Rate (10%) 4 20 2.5 .7 .8 0
13. Cesarean Sections Rate (15%) 11 104 9 8.3 .9 9
14. Postoperative Infection in Clean 0 29 0 1.2 1 2Surgery Rate (1-2%)
15. Patient Consultation Rate (15-20%) 186 2,030 21.8 17.2 16 18
16. Total Hospital Infection Rate (3-4%) 6 93 .7 .8 .7 2
17. All Other Complications Rate (3-4%) 7 184 .8 1.6 1.5 3
18. Deaths:
a. Active Duty n
b. Other 10 110
19. Number of Patients Undergoing 115 1,670Major Surgery
20. Number of Patients Undergoing 83 938Minor Surgery

Month of January 1984
101Number RATES AND PERCENTAGES
Current To Date Current TO Lact Same MonthDate Year Last
1. Gross Death Rate (Excl. fetal deaths, 8 8 .9 .9 .9 2
DOA's) (4%)
2. Net L.ath Rate (after 48 hours) (2.5/) 6 6 .7 .7 .6 2
3. Maternal Uaath Rate (.25%) 0 0 0 0 0 0
4. Neonatal Death Rate (2%) 0 0 0 0 .6 0
5. Postoperative Death Rate (1%) 0 0 0 0 0 0
6. Anesthetic Death Rate (1 in 5000) 0 0 0 0 0 0
7. Fetal Death Rate 0 0 0 0 .8
8. Autopsy Rate 3 3 37.5 o 37.5 42.2 47
9. Number of Tubal Ligations 19 19
10. Number of Therdpeutic Abortions 0 0
11. Number of Vasectomies 12 12
12. Normal Tissue Removed Rate (10%) 5 5 1.9 1.9 .7 1
13. Cesarean Sections Rate (15%) 6 6 5.9 5.9 8.3 5
14. Postoperative Infection in Clean 1 1 .4 .4 1.2Surgery Rate (1-2%)
15. Patient Consultation Rate (15-20%) 213 213 24.9 24.9 17.2 20
16. Total Hospital Infection Rate (3-4%) 5 5 .6 .6 .8
17. All Other Complications Rate (3-4%) 14 14 1.6 1.6 1.6 2
18. Deaths:
a. Active Duty 0 0
b. Other 8 8
19. Number of Patients Undergoing 168 168Major Surgery
20. Number of Patients Undergoing 103 103Minor Surgery
21. Number Surgical Procedures Performed 470 470on Patients Undergoing all Types ofSurgery

APPENDIX L
EXAMPLES OF AUDIT CRITERIA

103
SERVICE MONTH
EVALUATION OF MEDICAL RECORD
A. Adequacy of: YES NO I. Overall management of this case*History ( ) C )Phys Exam J. Overall rating of chart*Prog. Notes ( ) C )X-rays ( ) ( )Lab Tests ( ) ) K. Disposition of Chart:( )Have corrections made, then forward
B. Record of Consultations: to Medical Record Librarian in PAD
Consult indicated ( ) ( ) ( )Refer chart for discussion in Sub-
Consult, if obtained, is ( ) ( ) Patient Care Committee meeting.
included in record on L. Comments:SF 513
C. Tissue Information:Tissue removed ( ) (Tissue report in chart ( ) ( )Tissue diseased ( ) ( )Path report agrees with dg. ( ) ( )
D. Operations:Fully described ( ) ( )Procedure correct C ) C )Surgery justified ( ) ( )Patient agreed with surgery ( ) ( )Surgery report in chart ( ) ( )
E. Transfusions:Indicated ( ) ( )Forms Signed ( ) ( )
Acceptable Not AcceptableF. Doctors Orders:
Signed C ) ( )Appropriate ( ) ( )
G. Clinical findings justify ( ) ( )final dg.
H. Drugs used properly:Proper usage of drugs for dg( ) ( )Proper length of time in ( ) (
dosage of drugs usedWas use of antibiotic or ( ) ( )
other drug directed by lab Signature of Reviewing Officerresults or other positive findings
Were all drugs used simul- ( ) ( )taneously in the patient compatible
*Give reasons for nonacceptability
FB(MED) Form 7Aug 80 (Previous Editions Obsolete)

ANES DATE
ANESTHETIST
PATIENT #
MARTIN ARMY COMMUNITY HOSPITAL "
ANESTHESIA CARE AUDIT--SF 517
I. PRE-ANESTHESIA EVALUATION/SUMMARY S U N/A
1. Surgical/Obstetrical Summary2. History, incl drugs & previous anes3. Evaluation, incl physical and lab4. Potential anes problems/ASA Class5. Anesthesia choice/plan (general, regional, local)6. Pre-anes meds/evaluation signed by physician
II. REVIEW IMMEDIATELY PRIOR TO INDUCTION
7. Record of abnormal lab, pre-med, patient condition
III. ANESTHESIA RECORD8. Patient data (name, age, sex, hosp no., ssan)9. Surgical procedure and date
10. Surgical and anesthesia teams identified11. Signature of anesthetist12. Anesthesia/surgery times--begin/end13. Monitors (appropriate & type--ECG,BP,Temp,Stetho,F0 2)14. Vital signs and other pertinent data recorded15. IV - catheter size/site, fluids, type/qty16. Blood and blood components--amount/unit numbers17. Anesthesia agents and techniques18. Intubation--description, incl post-intubation breath
sounds19. Regional anes (position, prep, needle, location,
parathesias CSF, drugs, catheter, results, cx's)20. Estimated blood loss21. Tourniquet time/pressure22. Intraoperative complications--recorded if present
IV. POST-ANESTHESIA CARE--RECOVERY ROOM
23. Arrival time, condition, mentation, VS, F10224. Discharge time, condition, mentation, VS
V. POST-ANESTHETIC VISITS
25. Identified as "Anes Post-OP Note"26. Visit date and time27. Visit within 48 hours (72 on week-end)28. Anesthesia related complications--stated as none or
referred to Progress Notes (SF 509) if present
VI. NURSING PROCESS (DA FORM 3888, & -1)
29. Do the nursing orders reflect the problem list?30. Are the Nursing Care Plan and the Medical Plan
compatible?
Auditor
Date

105
AUDIT of 3LOOD and BLOOD CPC:%ET USE
Justification for transf usion. The . in column A i~dicates that either the CR:Tc.RIAor the EXCEPTION is sufficient justification for transfusion. -he K in column Bindicates ;hat the EXCEFTION must e present to justify the use of blood.or bloodcomponents. Circle the CRITERIA and/or £XC-PTIOMS present.
C!PONEN&T CRITERIA ST.',DARD EXCEPTIONSAiB
Red Cell 1. Hypovolemia due to surgeryTransfusion trauma, or GI bleeding. 1. Coronary artery disease,
chronic pulmonary disease, orcerebral ischemic disease.
2. Acute leukemia, &plastic K. NONEthalassemia, sickle cellanemia, or hemodialysis ifhemoglobin (Mg)cS pm/dl orhematocrit (Hct) <Z41
3. Iron deficiency anemia, X Sa. Etiology of blood lossinvestigated; and
b. Previous treat=nt with iron,Vitamin B-12, or folic acid;and
c. Symptoms of chronic anemia.
4. Unspecified anemia. X 4a. Preoperative Hg-lO p inmajor and S gm in minorsurgery.
b. Preoperative hypovolemia(flat veins, postural hypo-tension, low bp. tachycixdiaor blood volume deficit of730 cc or equivalent.
Whole Blood S. Use of W.hole Blood X oa. Surgical or trauma Patientb. Patient w/ acute GI :ledting
Platelets 6. Use of blood platelets X 6a. Patient bleedin;; andb. Platelet count SO,o0 =2;3
c. Bleeding ti=e 3 15 ai.;... .. .d. Conmultation w/ Pathologist
7. Use of blood plate- K 7a. Lack of response to steriidslets for IT. or contraindications for
b. Hematology consultation.c. Surgical indications.
S. Use oi more than 3 X S. Presence of antiplatelet -
t5..ts of platelets. antibodies.
Serum albumin 9. Use of serum albumin K 9a. Surgical patlent. in shock.3 plasma pro- and plasma protein frac- b. Severe nalnourishment 5 neohro.tein fraction tion. tic syndrome w/ h-poalbuminemia
Factor IX 10. Use of Factor IX X la. Fresh frozen plasma not avail.Complex Complex. b. Child with Factor IX deficie'cv
(hereditarv).c. Hematology consul:a:ion.
CONDEINT:
"odified from JCAH, Suggested Criteria for Retrospective Review of Blood Transfusion,
RB, DEC 7
FB(!.ED) Form 733 1 FL5 1

BIBLIOGRAPHY
Books
Donabedian, Avedis. The Criteria and Standards of Quality.Ann Arboe, MI: Health Administration Press, 1982.
Egdahl, Richard H.; Gertman, Paul M. Quality Assurance inHealth Care. Rockville, MD: Aspen Systems Corporation,1976.
Joint Commission on Accreditation of Hospitals. AccreditationManual for Hospitals (1984). Chicago: JCAH, 1983.
_ The Quality Assurance Guide: A Resource for HospitalQuality Assurance. Chicago: JCAH, 1980.
Luke, Roice D.; Krueger, Janelle C.; Modrow, Robert E.Organization and Change in Health Care Quality Assurance.Rockville, MD: Aspen Systems Corporation, 1983.
Pena, Jesus J.; Haffner, Alden N.; Rosen, Bernard; Light,Donald W. Hospital Quality Assurance. Rockville, MD:Aspen Systems Corporation, 1984.
Williamson, John W. The Health Accounting Approach to QualityAssurance. Cambridge, MA: Ballinger Publishing Company,1978.
Government Documents
NOTE: Army and MEDDAC Regulations are listed numerically atthe end of this bibliography division.
U.S. Army Medical Department Activity. MEDDAC Annual QualityAssurance Report, 19 January 1984.
• Minutes of Meetings of Accreditation Committee. FortBenning, GA, 1983-84
• Minutes of Meetings of Ambulatory Patient Care Com-mittee. Fort Benning, GA, 1983-84
• Minutes of Meetings of Cancer Committee. Fort Benning,GA, 1983-84.
106

107
• Minutes of Meetings of Community Health EducationCommittee. Fort Benning, GA, 1983-84.
• Minutes of Meetings of Credentials Committee. FortBenning, GA, 1983-84.
• Minutes of Meetings of Critical Care Committee. FortBenning, GA, 1983-84.
_ Minutes of Meetings of Department of Surgery SubauditCommittee. Fort Benning, GA, 1983-84.
• Minutes of Meetings of Director of Health ServicesCommittee. Fort Benning, GA, 1983-84.
• Minutes of Meetings of Executive Committee. FortBenning, GA, 1983-84.
_ Minutes of Meetings of Health and Fitness AdvisoryCommittee. Fort Benning, GA, 1983-84.
• Minutes of Meetings of Health Consumer Council. FortBenning, GA, 1983-84.
• Minutes of Meetings of Hospital Education and TrainingCommittee. Fort Benning, GA, 1983-84.
• Minutes of Meetings of Infection Control Committee.Fort Benning, GA, 1983-84.
_ Minutes of Meetings of Institutional Review Human/Animal Use Committee. Tort Benning, GA, 1983-84.
• Minutes of Meetings of Medical Staff Conference. FortBenning, GA, 1983-84.
. Minutes of Meetings of Nutritional Care Committee.Fort Benning, GA, 1983-84.
• Minutes of Meetings of Quality Assurance Committee.Fort Benning, GA, 1983-84.
• Minutes of Meetings of Rabies Advisory Board. FortBenning, GA, 1983-84.
• Minutes of Meetings of Radiation Safety Committee.Fort Benning, GA, 1983-84.
• Minutes of Meetings of Rehabilitative Services Com-mittee. Fort Benning, GA, 1983-84o
. Minutes of Meetings of Risk Management Committee.Fort Benning, GA, 1983-84.

108
. Minutes of Meetings of Therapeutics Agents Board.Fort Benning, GA, 1983-84.
• Minutes of Meetings of Tissue/Blood TransfusionUtilization Committee. Fort Benning, GA, 1983-84.
U.S., Department of the Army, "A Study Comparing Utilization,Staffing and Cost Trends in Civilian and CONUS ArmyHospitals." A Decade of Change in U.S. Hospitals,1953-1963, May 1965.
. Health Services Command Annual General InspectionReport of Inspection of Fort Benning, 26-30 March 1984.
. Health Services Command Message 2272, Patient CareAssessment and Risk Management Functions, June 1983.
. "Health Services Performance: Description and Measure-ment." US Army Health Services Command Study Report,November 1982.
. "Organization and Functions Policy." MEDDAC Regula-tion 10-1, 1 August 1983.
. "MEDDAC Committees, Subcommittees, Conferences,Boards and Councils." MEDDAC Regulation 15-1, 31 August1983.
. "Medical Record and Quality Assurance Administration."Army Regulation 40-66, 15 June 1980.
. "Risk Management/Incident Reporting." MEDDAC Regula-tion 40-80, 12 April 1982.
. "Quality Assurance Program." MEDDAC Regulation 40-81,22 September 1981.
. "Utilization Review--Quality Assurance." MEDDAC Regu-lation 40-84, 1 May 1982.
Periodicals
Couch, N. P.; "The High Cost of Low-Frequency Events." NewEngland Journal of Medicine (March 1981): 634-637.
Hetherington, Robert W.; "Quality Assurance and OrganizationalEffectiveness in Hospitals." Health Services Research(Summer 1982): 85-198.

109
Kalzuny, Arnold D.; "Quality Assurance as a Managerial Innova-tion: A Research Perspective." Health Services Research(Fall 1982): 253-265.
Klastorin, Theodore D.; Watts, Carolyn A.; "On the Measurementof Hospital Case Mix." Medical Care (June 1980): 675-685.
McSherry, Charles K.; "Quality Assurance: The Cost of UtilizationReview and the Educational Value of Medical Audit in aUniversity Hospital." Surgery (July 1976): 122-129.
Mannisto, M.; "An Assessment of Productivity in Health Care."Hospitals (16 September 1980): 71-76.
Markus, A.C.; "Quality Assurance--Panacea of Trojan Horse?"Quality Review Bulletin (February 1981): 21-22.
Rhein, Reginald W.; "Measuring Physicians' Productivity."Medical World News (16 April 1979): 37-44.
Schumacher, Dale N.; Clopton, Cathy J.; Bertram, Dennis A.;"Measuring Hospital Case Mix." Quality Review Bulletin(April 1982): 20-26.
Warner, Allan M.; "Thoughts About the Cost of Quality Assurance."Quality Review Bulletin (February 1983): 39-41
Wallace, Robert F.; Donnelly, Michael; "Computing QualityAssurance Costs." Hospital Progress (May 1975): 53-57.
Wood, Walter R.; Ament, Richard P.; Kobrinski, Edward J.;"A Foundation for Hospital Case Mix Measurement." Inquiry(Fall 1981): 247-254.
Zelman, William N.; Jessee, William F.; "Budgeting QualityAssurance Activities." Quality Review Bulletin (February1983): 42-46