Embed Size (px)
Citation preview

Tobacco ControlNorthern Ireland
‘Smoking has been identified as the
single greatest cause of preventable
illness and premature death in
Northern Ireland.’

Tobacco Control Northern Ireland, produced by Health Intelligence, Public Health Agency, 2015. 8
2
Gilmore G. Wilmot E. Tobacco Control Northern Ireland. 2015 Public Health Agency: Belfast, 2015.

Tobacco Control Northern Ireland, produced by Health Intelligence, Public Health Agency, 2015. 8
3
Contents The impact of smoking in NI ........................................................................................ 5
Deaths attributable to smoking ......................................................................... 5
Inequality and smoking related mortality .......................................................... 5
The costs of smoking .................................................................................................. 6
The extent of smoking in Northern Ireland .................................................................. 7
Disadvantaged adults who smoke .................................................................... 7
Pregnant smokers ............................................................................................ 9
Children and young people (11-16 year olds) ................................................... 9
Prevalence of E-cigarette use ................................................................................... 10
Second hand smoke exposure .................................................................................. 10
Tobacco control vs the tobacco industry ................................................................... 11
Key advertising strategies .............................................................................. 11
Point of sale advertising ....................................................................... 13
Packaging as advertising ..................................................................... 13
Taxation/illicit tobacco .................................................................................... 13
Stop Smoking Services .................................................................................. 14
Conclusion ................................................................................................................ 15
References ................................................................................................................ 16

Tobacco Control Northern Ireland, produced by Health Intelligence, Public Health Agency, 2015. 8
4

Tobacco Control Northern Ireland, produced by Health Intelligence, Public Health Agency, 2015. 8
5
The impact of smoking Deaths attributable to smoking Smoking has been identified as the single greatest cause of preventable illness and premature death in Northern Ireland with 2014 data revealing approximately 16% or 1 in 6 of all deaths in Northern Ireland (NI) were attributable to smoking.1,2
Indeed smoking has been shown to contribute to deaths from a wide variety of causes and is thought to account for:2i
86% of all deaths from lung cancer;
85% of all deaths from Chronic Obstructive Lung Disease;
Over half the deaths from Stomach/Duodenum ulcers;
1 in 4 of all cancer deaths and;
1 in 10 of all circulatory disease deaths.
During the past decade the number of deaths attributable to smoking has been estimated to be between 2,300-2,400 per year, equating to approximately 6 deaths a day.1 Moreover, research has shown a smoker’s life span is shortened by about five minutes for each cigarette smoked and on average, those killed by smoking have lost 10-15 years of life.3
Inequality and smoking related mortality The regional standardised death rate due to smoking related causes in NI was 168 per 100,000 in the period 2009-13, a decline from previous years.4,5 i Deaths relate to deaths registered in the 2012 year.
Nevertheless, the ‘standardised death rate due to smoking related causes in the most deprived areasii was 54% higher than the overall regional rate and 129% higher than the standardised death rate in the least deprived areas’5iii. Furthermore, over the past decade, there is now a widening inequality gap between the standardized death rate in the most deprived and the least deprived areas of NI (see Figure 1).5 Figure 1: Inequality gap in the standardized death rate due to smoking in NI (2004/08-2009/13) 5
Smoking related mortality among
males is twice that of females (244 vs.
115 deaths per 100,000 population)
ii Deprivation level is assessed in Northern Ireland by the use of the Northern Ireland Multiple Deprivation Measure (NIMDM) 2010. This measure examines 7 areas of deprivation which are given individual weights to produce an overall combined measure of deprivation. The small geographical area used for the NIMDM is the super output area (SOA). Northern Ireland consists of 890 SOA areas, each with an average population of 2,000 people. These 890 areas are divided into 5 equal quintiles representing a measure of the diversity of deprivation in the population. iii Smoking related death rate in most deprived areas: 258
per 100,000, regional average 168 per 100,000 and in least deprived areas 113 per 100,000.
47 48 51 52 53 54
110 117 120 119
127 129
0
20
40
60
80
100
120
140%
ga
p in
sta
nd
ard
ised
de
ath
ra
te (
SD
R)
du
e t
o s
mo
kin
g
rela
ted
cau
ses
Year
% gap in the SDR from smoking relatedcauses between the most deprived areasand NI average
% gap in the SDR from smoking relatedcauses between the most deprived areasand least deprived areas.

Tobacco Control Northern Ireland, produced by Health Intelligence, Public Health Agency, 2015. 8
6
(see Figure 2). Moreover, the
inequality divide is strongly evident
within the genders. The standardised
death rate due to smoking related
causes is highest among males in the
20% most deprived areas, more than
twice that of males in the 20% least
deprived areas and almost five times
that of females in the 20% least
deprived areas.6
Figure 2: Standardised death rate per 100,000 (2009-13) from smoking related causes by gender and deprivation6
Smoking not only causes death but reduced quality of life through illness. While it is difficult to quantify the extent and impact of these illnesses, it has been estimated 17,889 people were admitted to hospitals in NI due to smoking related causes in 2013.7
The costs of smoking In Northern Ireland it has been estimated the costs of treating smoking related illness in NI hospitals alone is around £164m a year.8
However, hospital costs are only one of the many financial outlays associated with smoking. Several studies conducted within the UK have examined the overarching costs of smoking to society. These studies have accounted for a wide range of smoking related costs including health
care, premature death, excess sickness absence, smoke breaks, second hand smoke (early deaths), smoking related litter and fire in the business place or home. The costs of smoking have been estimated to be £790m per year in Wales, £1.1 billion in Scotland and £12.9 billion in England with an additional one billion pounds required for social care costs in England alone.9,10,11,12 Based on the economic studies above, (and accounting for the number of smokers within the Northern Ireland population) it is estimated that smoking costs the Northern Ireland economy around £450 million per year. Given the economic costs outlined above, it is estimated the total cost of smoking to the UK as a whole could substantially outweigh the tax generated through cigarettes by an excess of £5 billion a year.13iv Moreover, nationally it has been reported a 1% decrease in the prevalence of smoking could be estimated to produce a net revenue gain of £240 million pounds per year in the UK.14 Asides from the societal costs of tobacco, the financial burden to individual smokers is considerable. In 2014, a 20-a-day smoker would spend on average, over £3,000 a year on cigarettes with lower income groups in the UK spending twice as much of their total income on cigarettes compared to the more affluent groups (4% vs 2%).15,16
iv Total costs exclude any social care costs in Northern Ireland, Scotland and Wales. £5 billion is calculated as the total costs of tobacco throughout the UK (minus tax revenue) plus an additional one billion lost through illicit tobacco. Note: additional pension costs or costs of quitter’s health care gained through extra life years are not included in the calculation.

Tobacco Control Northern Ireland, produced by Health Intelligence, Public Health Agency, 2015. 8
7
The extent of smoking in Northern Ireland Population prevalence Twenty two percent of the NI population currently smoke, a figure which has declined from 24% in 2012 but still remains the highest prevalence rate (equal to Scotland, 22%), within the UK and Republic of Ireland (ROI), (Figure 3).17,18,19,20,21
Figure 3: Smoking prevalence throughout the UK and ROI
It is now estimated around 320,000 adults aged 16 and over smoke in Northern Ireland with the prevalence of smoking among males being 23% and females 21%.17 Smoking prevalence differs substantially by local government district (LGD). Belfast (25.1%) and Londonderry/Strabane (23.3%) LGD’s have the highest estimated smoking prevalence compared to the LGD areas of Lisburn and Castlereagh with a prevalence of only 16.5% and North Down and Ards with a prevalence of 17.4% v (see Figure 4, overleaf).22
v Smoking prevalence by LGD is calculated from Quality
outcomes framework (QOF) data.22
Raw QOF data is available to download from: http://www.dhsspsni.gov.uk/index/statistics/qof/qof-achievement/qof-practice-13-14.htm. Data analysis indicates an overall smoking prevalence of 21% as opposed to the 22% estimate derived from the Health Survey for Northern Ireland data
17 Smoking information
The Northern Ireland Ten Year Tobacco Control Strategy for Northern Ireland identifies a number of priority groups for targeted action owing to the high prevalence of smoking or the particularly detrimental health impact smoking can cause within these groups. These priority groups have been identified as: disadvantaged adults who smoke, pregnant women who smoke and children and young people (11-16 years old).23
Disadvantaged adults who smoke Smoking prevalence analysis by deprivation quintile (see page 5, footnote ii for further information on deprivation quintiles) shows a strong gradient exists. The most recent NI data for 2014/15 shows three times as many smokers living within the most deprived quintile (36%) compared to the least deprived quintile (12%),
(Figure 5).5 Figure 5: Smoking prevalence by deprivation quintile 2011/12-2014/15
Likewise, the smoking prevalence among routine and manual workers remains around one third higher than the general population average at around 30% and substantially higher than that observed in professional occupations (9%).24,25
has been recorded for 85% of all patients aged 16+ who have registered with a General Practitioner (GP) in NI.
15
17
19
21
23
25
27
29
2008 2009 2010 2011 2012 2013 2014
Sm
ok
ing
pre
vale
nc
e (
%)
(no
n z
ero
axis
)
Year
England Scotland Wales
N.Ireland ROI
36
26 21
17 12
0
10
20
30
40
50
1 2 3 4 5
Pre
va
len
ce
(%
)
Deprivation quintile (1 most deprived - 5 least deprived
11/12
12/13
13/14
14/15

Tobacco Control Northern Ireland, produced by Health Intelligence, Public Health Agency, 2015. 8
Figure 4: Smoking prevalence by Local Government District (LGD)22

Tobacco Control Northern Ireland, produced by Health Intelligence, Public Health Agency, 2015. 8
9
Pregnant smokers Fifteen percent of pregnant women self-reported being a smoker at the time of their first antenatal appointment during 2014/15, a fall from the 16% level observed in 2013/14.26 Pregnant women who smoke are more likely to have a baby of low birth weight (under 2,500g), a factor which can result in future health problems for the child. NI data shows over twice as many mothers who smoke had a low birth weight baby 11.1%, compared to only 4.5% of mothers who do not smoke.26
The extent of the relationship between smoking in pregnancy and deprivation is shown in Figure 6. 27% of pregnant women in the most deprived areas of NI smoke compared to only 6% of pregnant women in the least deprived quintile who smoke.26 Figure 6: Prevalence of smoking in pregnancy by deprivation quintile 2014/15
Children and young people: 11-16 year olds Smoking prevalence among 11-16 year olds has declined over the last seven years from 8.7 % in 2007 to 8.4% in 2010 and then to 5% in 2013 (see Figure 7).27,28,29 Figure 7: Smoking habits of 11-16 years old 2007-2013
Further analysis of 11-16 years olds smoking prevalence (2013) has shown for the first time no deprivation difference is now evident among children who smoke (see Table 1).30 Table 1: Smoking status of 11-16 years old by deprivation quintile (2013) (Deprivation quintiles: 1 most deprived -5 least deprived).
Deprivation quintile
1
2 3 4 5
All
Current smoker (%)
5 5 5 4 6 5
27
16
11 10
6
0
5
10
15
20
25
30
1 2 3 4 5
Sm
ok
ing
pre
va
len
ce
am
on
g
pre
gn
an
t w
om
en
(%
)
Deprivation quintile (1 most deprived- 5 least deprived)
5 8.3
86.1
0
20
40
60
80
100
Smoke at all Do not smokenow
Neversmoked
Sm
ok
ing
pre
vale
nc
e (
%)
Smoking status
2007 2010 2013

Tobacco Control Northern Ireland, produced by Health Intelligence, Public Health Agency, 2015. 8
10
Prevalence of E-cigarette use E-cigarettes are designed to look and feel like cigarettes; however, E-cigarettes are not licensed nicotine replacement products. These products are not regulated in terms of their safety and therefore the level of risk associated with their use is unknown.31
Trend data from England has shown E-cigarette use among adults has taken a downturn, due to a reduction in use by people who continue to smoke; nevertheless use for quitting continues to increase somewhat.32 Currently data from England shows the prevalence of any E-cigarette use among smokers and ex- smokers to be 24%, (around 5% of the overall population) while the prevalence of daily use is approximately 15% and use for quitting purposes is 38%.32 NI data has shown that around 14% of the overall population have ever used an E-cigarette, with 5% of the population currently using these products.vi Similar to the prevalence of smoking, this use is focused within the more deprived areas (8%) compared to the least deprived areas (4%).5,33 Data from England has shown that the majority of 11-15 year olds are aware of E-cigarettes (88%), with over a fifth of children and young people having reported ‘ever’ to have had an E-cigarette (22%). Indeed young people’s experimentation with E-cigarettes has now overtaken that of the traditional cigarette (18%).34 This finding coupled with the close linkages between E-cigarette use and smoking
vi E-cigarette use in NI is reported from the overall
population, in contrast to England which reports on prevalence among smokers and ex-smokers only. Nevertheless equivalent overall rates of E-cigarette use within the overall population of around 5% are evident in both countries.
behaviour is therefore a concern for public health given its potential to displace the current downward trend in smoking prevalence among young people.
Second hand smoke exposure Exposure to second hand smoke (SHS) is a major health concern owing to its association with smoking related illnesses such as lung cancer, heart disease and stroke.35 Second hand smoke is also a threat to the health of children and babies due to the established links between SHS and respiratory disease, cot death, middle ear disease and asthma.36
Information from the infant feeding survey (UK including NI) has shown almost one fifth of mothers (19%) lived in a household in which someone other than the mother herself smoked. 37
Beyond the physical damage caused by SHS, exposure to SHS has been shown to have an impact on the uptake of smoking and nicotine dependence symptoms in young people. Becklake et al., (2005) showed that the proportion of nicotine absorbed from that available in SHS during childhood was associated with subsequent smoking in adolescence.
This was after adjustment for a number of factors such as sex, socio-economic group and number of adult smokers at home.38 Indeed, it has been shown that children who live with parents or siblings who smoke are up to 3 times more likely to become smokers themselves than children living in non-smoking households.39 Additionally local data (2008) indicates

Tobacco Control Northern Ireland, produced by Health Intelligence, Public Health Agency, 2015. 8
11
approximately 45% of primary seven children reported having at least one parent who smokes, with 14% from homes in which both parents smoke.40
Furthermore, a multi–country study carried out in NI, Wales and Scotland pre and post smoke free legislation showed SHS exposure was highest, and private smoking restrictions least frequently reported, among children from lower socio-economic groups.41 Research has shown the home and car to be the major sources of children’s smoking exposure, however the most recent results from the 2014/15 Health Survey Northern Ireland found that 8 in 10 respondents did not allow smoking in the home and just over 8 in 10 respondents (85%) who had a family car did not allow smoking in their car at all.17
Nevertheless, a 2013 omnibus survey, which also examined smoking in the car found rules on smoking in the car varied significantly depending on whether the individual was a smoker or not. 81% of those who never smoked reported not allowing smoking in the car compared to only 24% of current smokers.42
Tobacco control vs tobacco industry Key advertising strategies One key mechanism by which tobacco has emerged as a social norm within our society is the extensive advertising carried out by the tobacco industry. Advertising may be defined as ‘above the line’ (ie TV, radio or billboards) or ‘below the line’ (sales promotion, point of sale etc), however few jurisdictions across the globe have introduced comprehensive bans on smoking
advertising, (ie above and below the line advertising bans). This, thereby allows the tobacco industry to simply divert its resources to fill market gaps, thus maintaining visibility and hence tobacco consumption. While the tobacco industry in the UK has traditionally carried out ‘above the line’ advertising this is now prohibited through the UK Tobacco advertising and promotion Act 2002.43 This ban was then supplemented in 2005 with the European union (EU) Directive which regulates tobacco advertising and sponsorship with cross-border implications in the media other than television. 44 Owing to these bans, the industry has shifted its advertising strategies to ‘below the line’ activities including point of sale displays and product placement in various guises from alibivii branding of tobacco companies in formula one to more mainstream tobacco imageryviii in the media.ix While evidence has shown the extent of this type of advertising within the film industry has somewhat declined it continues to occur in films deemed by the British Board of Film Classification as suitable for children and young people.45 Indeed more recent research has revealed this tobacco imagery extends beyond the film industry into mainstream television broadcasts. 34% of programmes shown on free to air prime time (18:00-22:00) United Kingdom (UK) TV contained some tobacco imagery with 12% of these programmes showing actual tobacco
vii
Alibi branding refers to the use of colours and branding representative of that of a product but omitting the product name. viii
Tobacco imagery refers to actual tobacco use, implied tobacco use, the appearance of tobacco paraphernalia, tobacco brands and other references to tobacco. ix Tobacco imagery in television programmes for artistic or
editorial purposes is exempt from the Tobacco Advertising and Promotion Act.

Tobacco Control Northern Ireland, produced by Health Intelligence, Public Health Agency, 2015. 8
12
use. Indeed, over 60% of these incidences of tobacco use occurred before the 21:00 watershed thereby exploiting a potential source of young people’s tobacco exposure.46 Further analysis showed tobacco use on mainstream TV to be highly variable depending on the programme genre with over half of feature films (59%) and reality TV shows (56%) shown during the peak viewing times of 18:00-22:00 showing actual tobacco use (see Figure 8). Nevertheless, 8% of soap operas also showed tobacco use, while 49% of soap operas showed any tobacco imagery.46 Figure 8: The proportion of each programme genre that contained any tobacco use on prime time (18:00-22:00) UK free to air television, 2010x
In addition, tobacco imagery appears in 22% of YouTube music videos while e-cigarette imagery appears in 2%.47 The impact of this ‘below the line’ marketing has clearly proved lucrative for the tobacco industry with data showing that in the United States of
x Figure 8: reproduced from Lyons et al, 2014.
46
America, the tobacco industry is investing 97% of expenditure in ‘below the line’ marketing despite ‘above the line’ advertising still being allowed in the USA.48
The value of anti-tobacco advertising is an important component in tobacco control. The United States National Cancer Institute released a comprehensive scientific review of international evidence concerning the impact of media on smoking attitudes and behavior. The Institute concluded on balance that well-funded anti-tobacco campaigns can reduce smoking prevalence, with the extent of reductions highly related to levels of media expenditure.49
While the amount spent by the tobacco industry in the UK is unknown, in the US figures released by the Federal Trade commission in 2012, report over 9 billion dollars was spent on advertising by the tobacco industry xi (around $285 per second).50 This is in stark contrast to the approximately £11.7m spent on mass media anti-tobacco advertising in England (approx. 37p per second) and the £440,000 in NI in 2013/14 (approx. 1p a second).51,52
The key value of local anti-tobacco advertising has been observed with the 2012/13 NI anti-tobacco campaign estimated to have reached 72% of NI smokers and aided 6.8% smokers to make a quit attempt.53 Nevertheless, media spend restrictions in NI on public sector advertising may impinge on the frequency and sustainability of anti-tobacco advertising and the resultant impact on smoking prevalence.
xi For comparison purposes the prevalence of smoking in
USA was 21.3%% in 2012-13.
59
56
41
26
12
12
8
4
0
0
0 20 40 60 80
Feature films
Reality Tv
Comedy
Drama
Chat show
Sport
Soap opera
News
Game show
Sci-fi/ fantasy
Proportion of each genre that showed actual use of tobacco (%)
Pro
gra
mm
e g
en
re

Tobacco Control Northern Ireland, produced by Health Intelligence, Public Health Agency, 2015. 8
13
While above the line advertising, such as TV advertising is no-longer permitted for tobacco products, this is not the case for E-cigarettes. The evolution of E-cigarettes has led to ‘above the line’ advertising of these devices in the UK, an issue of concern for tobacco control given the increasing number of 11-18 year old users observed in the UK.34 Point of sale advertising Point of sale is a key mechanism in below the line advertising. A strong positive relationship has been shown between point of sale (POS) advertising and increased tobacco consumption with POS displays reportedly increasing young people’s susceptibility to smoke, stifling ex-smokers ability to remain quit or detracting smokers from making a quit attempt.54 As a result point of sale display bans have come into force in large retailers since 31 October 2012 in NI and in small retailers from 6 April 2015 as a key mechanism to reduce public exposure to cigarettes. Packaging as advertising One key strategy the tobacco industry still utilizes to sell tobacco is branding. While the industry implies this is to influence brand choice, plain packaging has been found to reduce the appeal of cigarettes and smoking while enhancing the salience of health warnings on packs.55 Visibility of cigarettes is an important advertising strategy for the tobacco industry with some companies having increased the range of tobacco products displaying their branding to maximize the visibility of their products.54
Nonetheless, Australia has led the way globally in instigating a comprehensive advertising ban on tobacco products including the introduction of
standardised packaging. The value of this strategy has been observed with the daily smoking rate falling pre plain packaging from 15.9% (2010) to a level of 13.3% post plain packaging (2013) in those aged 18 and over.56 Furthermore, emerging evidence has shown the introduction of standardised packaging in Australia has increased the effectiveness of health warnings, reduced the ability of packaging to mislead about smoking harms and reduced the appeal of cigarettes to adults and adolescents.57,58
Furthermore, larger graphic health warnings on the new standardised packets have been associated with increasing rates of thoughts of quitting among adult cigarette smokers.
59
More recently the Republic of Ireland and the UK have followed in the footsteps of Australia and have taken steps towards the introduction of standardised packaging.
One counter-argument provided by the industry for plain packaging is that this will increase illicit tobacco, however, the Chantler review has strongly refuted this argument.60 Moreover, recent evidence from the implementation of standardised packaging in Australia has shown no evidence of increased use of two categories of manufactured cigarettes likely to be contraband, no increase in purchase from informal sellers and no increased use of unbranded illicit tobacco.61 Taxation/illicit tobacco Increased taxes placed on tobacco in recent years have played a significant role in the increased costs of the products. Price increases are considered to be the most effective mechanism for decreasing consumption; yet, these increases are still not substantive enough to cover
Tobacco Control Northern Ireland, produced by Health Intelligence, Public Health Agency, 2015. 8
14
the economic costs of smoking within society.62 While, the tobacco industry claims price rises simply result in increased smuggling and illicit tobacco, this argument is contradicted by the downward trends displayed in the illicit market share for cigarettes from 15% in 2005/06 to 10 per cent in 2013-14.13 Stop Smoking Services Current evidence shows combined pharmacotherapy and behavioral interventions to be the most effective mechanism to aid smokers to quit.63 In line with this evidence, the Public Health Agency (PHA) commission specialist quality assured Stop Smoking Services as recommended by the National Institute for Health and Clinical Excellence.64,65
These services are designed specifically for those smokers who are motivated, ready to quit and prepared to set a quit date. The services are offered in a range of local settings including GP practices, pharmacies, hospitals and community/voluntary settings across Northern Ireland. The Stop Smoking Services are delivered by specialist providers who have received specific training for this role. The services offer intensive treatment, over the course of 6-12 weeks, with structured support being available for at least four weeks after the clients quit date. To date, the provision of specialist Stop Smoking Services in NI has supported over 200,000 people to stop smoking since 2001/02, and over 50% of these clients remain quit at 4 weeks.
In 2014/15, 21,779 smokers registered with the NI Stop Smoking Services, thereby reaching approximately 6.8% of all smokers in Northern Ireland, and
above the 5% reach of Stop Smoking Services recommended within the NI Ten Year Tobacco Strategy.66
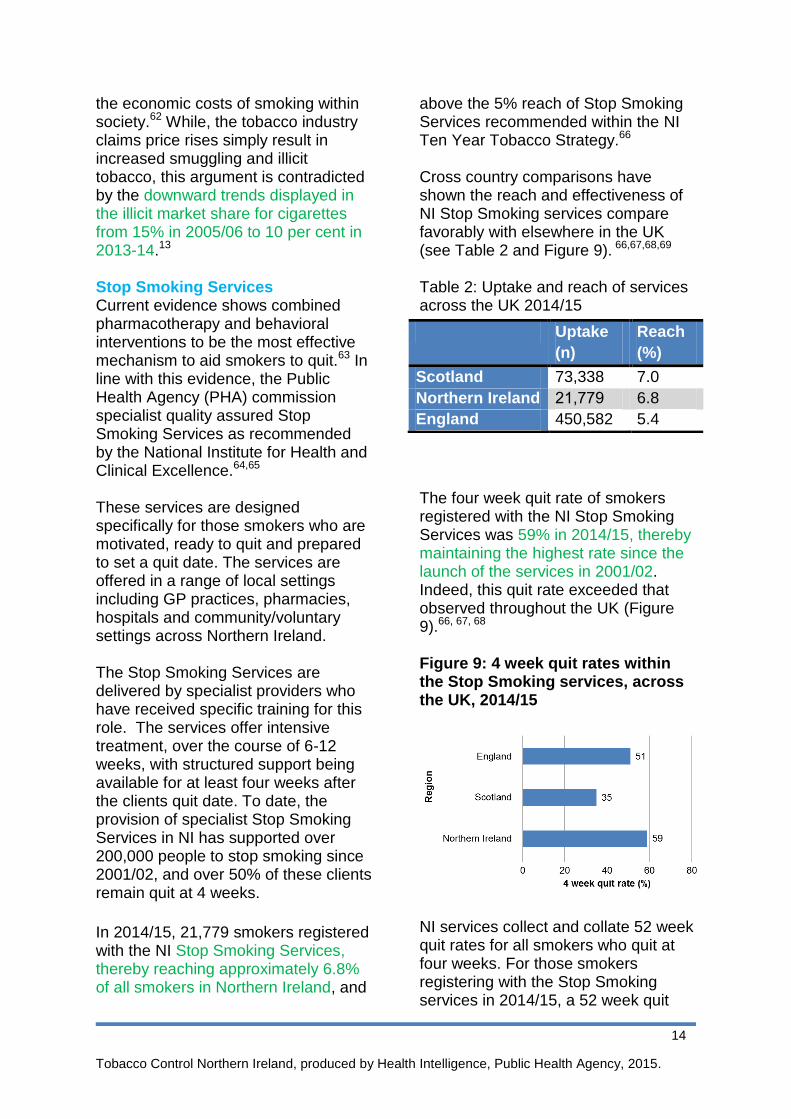
Cross country comparisons have shown the reach and effectiveness of NI Stop Smoking services compare favorably with elsewhere in the UK (see Table 2 and Figure 9). 66,67,68,69 Table 2: Uptake and reach of services across the UK 2014/15
The four week quit rate of smokers registered with the NI Stop Smoking Services was 59% in 2014/15, thereby maintaining the highest rate since the launch of the services in 2001/02. Indeed, this quit rate exceeded that observed throughout the UK (Figure 9).66, 67, 68 Figure 9: 4 week quit rates within the Stop Smoking services, across the UK, 2014/15
NI services collect and collate 52 week quit rates for all smokers who quit at four weeks. For those smokers registering with the Stop Smoking services in 2014/15, a 52 week quit
Uptake
(n)
Reach
(%)
Scotland 73,338 7.0
Northern Ireland 21,779 6.8
England 450,582 5.4
Tobacco Control Northern Ireland, produced by Health Intelligence, Public Health Agency, 2015. 8
15
rate of 24.4% was observed, a figure considerably higher than the 5% 52 week quit rate observed in Scotland. 66,67 Furthermore, the observed 52 week quit rate in NI was the highest rate since the services began and equated to the Stop Smoking services aiding 2.0% of all smokers to remain abstinent from smoking for at least one year. Despite the demonstrated effectiveness of the Stop Smoking Services, these services alone cannot eliminate tobacco as a public health issue in NI. Recently, observed unexplained declines in the number of smokers using Stop Smoking Services have been noted throughout the UK, a fact which limits the reach and effectiveness of a key evidenced based service. 66,67,68 Estimates suggest, if the number of clients utilizing the Stop Smoking Services in NI continue to decline at the current ratexii, it would take a minimum of 32 years for the services alone to aid NI approach the target 15% smoking prevalence level depicted within the current Ten Year Tobacco Control Strategy for Northern Ireland, and 102 years to eliminate smoking from society.xiii
Conclusion Tobacco remains a key public health issue in society with over a fifth of the NI population still smoking. Moreover, the health effects and financial costs of
xii
Approx. 18% yearly decline in service use has been observed between 2012/13-2014/15. Future declines are calculated at -18% until a limit whereby the services reach the 5% of smokers recommended by NICE guidance and the ten year Tobacco control strategy for Northern Ireland. xiii
Estimates only account for quitting activity and do not take into account uptake of smoking. Predictions are therefore likely to vastly underestimate the necessary timelines for a smoke free society.
smoking to the individual and to society as a whole are immense. The impact of tobacco is greatest among the poorest in our society impacting on their income, health and the health and social norms their children are inadvertently exposed to. It is evident the tobacco industry continually utilizes a plethora of mechanisms to promote tobacco products and encourage tobacco use within the population, thereby comprehensive tobacco control policies are a necessity. The 2010 inquiry into the cost and cost effectiveness of tobacco control in the UK estimated overall costs of tobacco control to be around £300 million a year, money which is primarily spent on the anti-smuggling strategy, Stop Smoking Services and mass media. The inquiry reported the net annual revenue benefits to government given the decline in smoking prevalence since 1998 stood at £1.7 billion per year and that Government expenditure on tobacco control ‘provides substantial economic value and a positive return on investment. Cutting back on expenditure in this area would almost certainly result in net revenue losses rather than gains to the Exchequer’14 While this briefing paper summarizes some but not all of the key mechanisms of tobacco control in NI (advertising, taxation and Stop Smoking Services) it is clear comprehensive, sustained and adaptive evidenced based tobacco control measures are required to counteract and overcome the influence of the tobacco industry in NI.

Tobacco Control Northern Ireland, produced by Health Intelligence, Public Health Agency, 2015. 8
16
References
1. The Northern Ireland Statistics and Research Agency (NISRA). Registrar General Northern Ireland Annual Report 2014.NISRA National Statistics: Belfast, 2015
2. Health intelligence, Public Health Agency (PHA). Smoking related deaths data analysis. PHA: Unpublished, 2014.
3. Royal College of Physicians (RCP). Nicotine Addiction in Britain. A report of the Tobacco Advisory Group of the Royal College of Physicians. RCP: London, 2000.
4. Public Health Information and Research Branch. Health and Social Care Inequalities Monitoring System (HSCIMS) - Health Inequalities in NI:Key Facts 2015. Department of Health, Social Services and Public Safety (DHSSPSNI): Belfast, 2015
5. Public Health Information and Research Branch. Health and Social Care Inequalities Monitoring System (HSCIMS) – Regional 2015 data tables. Department of Health, Social Services and Public Safety (DHSSPSNI): Belfast, 2015
6. Public Health Information and Research Branch, Department of Health, Social Services and Public Safety Northern Ireland (DHSSPSNI). Standardised death rate analysis 2009-2013. Department of Health, Social Services and Public Safety (DHSSPSNI): Belfast, 2015
7. Health intelligence, Public Health Agency (PHA).Smoking related hospital admissions data analysis. PHA: Unpublished, 2015.
8. Department of Health, Social Services and Public Safety Northern Ireland (DHSSPSNI). Making Life Better: A whole system strategic framework 2013-2023. DHSSPSNI: Belfast, 2014.
9. Grant. A. The economic costs of smoking to Wales, a review of existing evidence. Action on Smoking on health (ASH) and British Heart Foundation (BHF): Cardiff, 2013.
10. Action on Smoking on Health (ASH), Scotland. Up in smoke the economic cost of smoking in Scotland. ASH, Scotland: Scotland, 2010.
11. Action on Smoking on Health (ASH). The economics of tobacco. ASH: London, 2014.
12. Action on Smoking on Health (ASH). The costs of smoking to the social care system in England. ASH: London, 2014.
13. HM Revenue and Customs. Measuring tax gaps 2015 edition. Tax gap estimates for 2013-14. HM Revenue and Customs
:London, 2015 14. All Party Parliamentary Group on Smoking
and Health. Inquiry into the effectiveness and cost-effectiveness of tobacco control: Submission to the 2010 Spending Review and Public Health White Paper Consultation process. Available at www.ash.org.uk/APPGoct2010. Accessed 22.07.2015
15. Tobacco Manufacturers association. Available at: http://www.the-tma.org.uk/tma-publications-research/facts-figures/uk-cigarette-prices. Accessed 21.07.2015.
16. Office National Statistics (ONS). Living Costs and Food Survey, 2013 Appendix A: Table A6:detailed household expenditure by gross income decile group. Office National Statistics: Available at :http://www.ons.gov.uk/ons/rel/family-spending/family-spending/2014-edition/art-appendix-a.html. Accessed 21.07.2015.
17. Department of Health, Social Services and Public Safety Northern Ireland (DHSSPSNI). Smoking tables from Health Survey Northern Ireland. Available at: https://www.dhsspsni.gov.uk/publications/tables-health-survey-northern-ireland. Accessed 03.12.2015.
18. Lifestyles Statistics team. Statistics on smoking, England 2015. Health and Social Care Information Centre. England, 2015.
19. Brown L, Christie S, Gill V,Gray L,Hinchliffe S, Ilic N, Lepps H,Leyland AH. The Scottish Health Survey. 2014 edition, volume 1, main report. Scottish Government: Scotland, 2012.
20. Welsh Government Statistics for Wales. Statistical bulletin. Health related lifestyle results 2014. Welsh Government: Wales,
2015. 21. Hickey P. Evans DS. Smoking in Ireland
2014: Synopsis of key patterns. National Tobacco Control Office Health and Wellbeing Division: Health Service Executive (HSE), 2015
22. Health intelligence, Public Health Agency (PHA). Quality Outcomes Framework (QOF) smoking Indicator Set analysis. PHA: Unpublished, 2015
23. Department of Health, Social Services and Public Safety Northern Ireland (DHSSPSNI). Ten year tobacco control strategy for Northern Ireland. DHSSPSNI: Belfast, 2012.
24. Public Health Information and Research Branch, Department of Health, Social Services and Public Safety Northern Ireland (DHSSPSNI). Routine and manual workers smoking prevalence 2013/14.
Tobacco Control Northern Ireland, produced by Health Intelligence, Public Health Agency, 2015. 8
17
Personal communication, 2014 25. Public Health Information and Research
Branch, Department of Health, Social Services and Public Safety Northern Ireland (DHSSPSNI). Socio-economic group smoking prevalence 2012/13. Personal communication, 2014.
26. Health Intelligence, Public Health Agency (PHA). Northern Ireland Maternity Service (NIMATS) analysis 2013/14-2014/15. PHA: unpublished, 2015.
27. Central Survey Unit; Northern Ireland Statistics and Research Agency (NISRA). Young Persons Behaviour and Attitudes Survey bulletin,2007.NISRA: Belfast, 2008.
28. Central Survey Unit; Northern Ireland Statistics and Research Agency (NISRA). Young Persons Behaviour and Attitudes Survey bulletin,2010. NISRA: Belfast, 2011
29. Central Survey Unit; Northern Ireland Statistics and Research Agency (NISRA). Young Persons Behaviour and Attitudes Survey bulletin,2013. NISRA: Belfast, 2014.
30. Public Health Information and Research Branch, Department of Health, Social Services and Public Safety Northern Ireland (DHSSPSNI). Smoking and young people: deprivation analysis, 2013. Personal communication, 2014.
31. Britton J, Bogdanovica I. Electronic Cigarettes, A report commissioned by Public Health England. UK Centre for Tobacco and Alcohol Studies, May 2014
32. Smoking in England. Electronic cigarettes in England latest trends, 2013. Available at: http://www.smokinginengland.info/latest-statistics/. Accessed 20.07.2015.
33. Department of Health, Social Services and Public Safety Northern Ireland (DHSSPSNI). Health survey for Northern Ireland: First results from the health survey 2014/15. DHSSPSNI: Belfast, 2015
34. Agalioti-Sgompou V, Christie S, Fiorini P, Hawkins V, Hinchliffe S, Lepps H, Sal N, Sharman S. Health and social acre information centre. Smoking, drinking and drug use among young people in England in 2014. Health and Social Care Information centre, 2014.
35. U.S. Department of Health and Human Services. How Tobacco Smoke Causes Disease: The Biology and Behavioral Basis for Smoking-Attributable Disease: A Report of the Surgeon General. Atlanta, GA: U.S. Department of Health and Human Services, Centers for Disease Control and Prevention, National Center for Chronic Disease Prevention and Health Promotion, Office on Smoking and Health, 2010.
36. Scientific Committee on Tobacco and
Health (SCOTH). Report of the Scientific Committee on Tobacco and Health. London: TSO, 1998. Scientific Committee on Tobacco and Health (SCOTH). Secondhand smoke: review of evidence since 1998. London: Department of Health, 2004.
37. Department of Health (DoH). Infant Feeding Survey early results. DoH, London, 2010.
38. Becklake MR, Ghezzo H, Ernst P. Childhood predictors of smoking in adolescence: a follow-up Study of Montreal schoolchildren. Canadian Med Assoc J.2005; 173(4): 377-9.
39. Leonardi-Bee J, Jere ML, Britton J. Exposure to parental and sibling smoking and the risk of smoking uptake in childhood and adolescence: a systematic review and meta-analysis. Thorax 15 Feb. 2011 doi:10.1136/thx.2010.153379.
40. Health Promotion Agency (HPA). Childhood exposure to tobacco smoke. HPA: Belfast, 2009
41. Moore GF, Currie D, Gilmore G, Holliday JC, Moore L. Socioeconomic inequalities in childhood exposure to secondhand smoke before and after smoke-free legislation in three UK countries. J Public Health (Oxf). 2012 Dec;34(4):599-608.
42. Health intelligence, Public Health Agency (PHA).Public attitudes to smoking in cars Health intelligence, PHA: Unpublished, 2014.
43. The National Archives, Tobacco advertising and promotion Act, 2002. Available at http://www.legislation.gov.uk/ukpga/2002/36/contents
44. Directorate general for Health and Consumers. Report on the implementation of the EU Tobacco Advertising Directive. European commission, Directorate general for Health and Consumers, 2008.
45. Lyons A, McNeill A, Chen Y, Britton Y.Tobacco and tobacco branding in films most popular in the UK from 1989 to 2008. Thorax 2010;65:417e422. doi:10.1136/thx.2009.130716.
46. Lyons A, McNeill A, Britton J. Tobacco imagery on prime time UK television. Tob Control. 2014 May;23(3):257-63.
47. Cranwell J, Murray R, Lewis S, Leonardi-Bee J, Dockrell M, Britton J. Adolescents’ exposure to tobacco and alcohol content in YouTube music videos. Addiction 2014: 110, 703–711
48. Action on Smoking on Health (ASH). Tobacco displays at the point of sale. ASH, London, 2013.

Tobacco Control Northern Ireland, produced by Health Intelligence, Public Health Agency, 2015. 8
18
49. National Cancer Institute. The Role of the Media in Promoting and Reducing Tobacco Use. Tobacco Control Monograph No. 19. Bethesda, MD: U.S. Department of Health and Human Services, National Institutes of Health, National Cancer Institute. NIH Pub. No. 07-6242, June 2008.
50. Federal Trade Commission. Federal Trade Commission Cigarette Report for 2012.[PDF–308 KB]. Washington: Federal Trade Commission, 2015.
51. Action on Smoking on Health (ASH). ASH briefing: UK Tobacco Control Policy and expenditure. ASH, London, 2014.
52. Health Intelligence, Public Health Agency. Advertising analysis. PHA: Unpublished, 2014.
53. Health Intelligence, Public Health Agency (PHA). Proud to be a quitter campaign evaluation. PHA :Unpublished, 2013.
54. ASH briefing. Tobacco Displays at the point of sale. ASH, London, 2013.
55. Moodie, C Angus K, Stead M and Bauld L. Plain Tobacco Packaging Research: An Update. Stirling, Scotland: Centre for Tobacco Control Research, Institute for Social Marketing, University of Stirling,2013
56. Australian Government. Department of Health. Tobacco key facts and figures. Available at : http://www.health.gov.au/internet/main/publishing.nsf/Content/tobacco-kff Accessed 03.12.2015
57. White V. Williams T, Wakefield M. Has the introduction of plain packaging with larger graphic health warnings changed adolescents’ perceptions of cigarette packs and brands? Tob Control 2015;24:ii42-ii49 doi:10.1136/tobaccocontrol-2014-052084.
58. Durkin S, Brennan E, Coomber K, Zacher M,Scollo M. Wakefield M. Short-term changes in quitting-related cognitions and behaviours after the implementation of plain packaging with larger health warnings: findings from a national cohort study with Australian adult smokers. Tob Control 2015;24:ii76-ii81 doi:10.1136/tobaccocontrol-2014-052072
59. Wakefield M, Coomber K, Zacher M, Durkin S, Brennan E. Scollo M. Australian adult smokers’ responses to plain packaging with larger graphic health
warnings 1 year after implementation: results from a national cross-sectional tracking survey Tob Control 2015;24:ii17- ii25 doi:10.1136/tobaccocontrol-2014-052050.
60. Standardised packaging of tobacco. Report of the independent review undertaken by Sir Cyril Chantler. Kings College:London, 2014.
61. Scollo M, Zacher M, Coomber K, Wakefield M. Use of illicit tobacco following introduction of standardised packaging of tobacco products in Australia: results from a national cross-sectional survey. Tob Control 2015;24:ii26-ii32 doi:10.1136/tobaccocontrol-2014-052058.
62. Chaloupka FJ, Yurekli A, Fong GT. Tobacco taxes as a tobacco control strategy. Tob Control. 2012 Mar;21(2):172-180.
63. Stead* LF, Lancaster T. Combined
pharmacotherapy and behavioural interventions for smoking cessation. Cochrane review, 2012.
64. NICE Public Health Guidance 10: Smoking Cessation Services in Primary Care, Pharmacies, Local Authorities and Workplaces, Particularly for Manual Working Groups, Pregnant Women, and Hard to Reach Communities, February 2008.
65. Public Health Agency/Health and Social Care Board. 2011. Quality Standards for the Delivery of Specialist Stop Smoking Services in Northern Ireland. September 2011. Belfast: PHA, HSCB.
66. Public Health Agency. Annual report on tobacco control 2014-2015. PHA: Unpublished, 2015.
67. Information Services Division (ISD) Scotland, NHS Smoking Cessation Service Statistics (Scotland) 1st January to 31st December 2014. Scotland, Scottish Public Health Observatory, 2015.
68. The NHS Information Centre, Statistics on NHS Stop Smoking Services: England, April 2013 – March 2014. England, NHS, 2014.
69. Office National Statistics. Population Estimates for UK, England and Wales, Scotland and Northern Ireland - Mid 2013.