Embed Size (px)
Citation preview

8/9/2019 Tocqueville Gold - 4Q 2012 Investor Letter
http://slidepdf.com/reader/full/tocqueville-gold-4q-2012-investor-letter 1/15
Tocqueville Asset Management L.P.
40 West 57th Street 19th Floor ● New York ● NY ● 10019-4001
Tel: (212)698-0800 ● Fax: (212)262-0154 ● www.tocqueville.com
Tocqueville Gold Strategy
Fourth Quarter 2012 Investor Letter
The bull market in gold remains intact. The metal rose approximately 7.14% in 2012 in U.S. dollar terms
and has increased in each of the last 12 years.
Negative real interest rates incentivize capital to move into gold. It is difficult to imagine a world of
positive real interest rates, absent a significant shift in monetary and fiscal policy in the Western democracies.
Gold and gold shares historically have been positively correlated. However, during the past few years,
gold mining stocks have underperformed the metal due a host of issues that we have discussed at length,
including in our website article A Golden Mulligan.(A Golden Mulligan | Tocqueville). Although the article was
published a few years ago, the issues afflicting gold mining stocks mentioned then still hold true.
Gold mining stock valuations are at the low end of the historical range since the introduction of the gold
ETF (GLD) in 2004, or roughly 10% (basis XAU/spot bullion.) This relationship is depicted on page 11 of the
appended data section to this report. Significant rallies in gold mining shares have occurred in the past few
years from this compressed valuation base.
We see evidence of fundamental change within the gold mining industry, which addresses many of the
concerns that have caused negative investor sentiment. For example, cost pressures are leveling off, which
should help margins. Investor pushback against major capital spending projects is leading to better capital
allocation decisions. There have been a number of departures at the CEO level due to investor dissatisfaction,
and this should heighten the sense of accountability to shareholder interests in the ranks of management. On
the other hand, resource nationalism remains a strong headwind. Only the better managed companies will be
able to deal successfully with these pressures.
Despite the steady rise in the gold price over many years, it has failed to exceed the 2011 high of
$1901/oz. achieved during the debt ceiling crisis and U.S. credit downgrade. This lack of direction has hurt gold
mining stocks, which do best when the upward trend of the gold price is clear. We believe that gold stocks will
respond favorably to a new high in the gold price.
Gold needs to rise only 15% to trade at a new high. We believe that this is in the cards for 2013, and that
such a move will be driven by the continuation of negative real interest rates and heightened concerns over the
direction of monetary and fiscal affairs in all western democracies. Such concerns would be exacerbated by the
continuation of extremely weak economic activity in 2013 and quite possibly the resumption of a recession,
anticipated by few.

8/9/2019 Tocqueville Gold - 4Q 2012 Investor Letter
http://slidepdf.com/reader/full/tocqueville-gold-4q-2012-investor-letter 2/15
Tocqueville Asset Management L.P.
40 West 57th Street 19th Floor ● New York ● NY ● 10019-4001
Tel: (212)698-0800 ● Fax: (212)262-0154 ● www.tocqueville.com
Most investors seem to expect a gradual acceleration of economic growth in 2013. We disagree and
believe that the recent tax hike, one of the largest in history, will dampen economic activity sufficiently to
widen the deficit and require the extension of debt monetization by the Federal Reserve for years to come.
We also believe that polarization of public opinion and the political process over austerity versus growth
agendas will also serve to paralyze economic activity. Not only will this require continued monetization of fiscal
deficits, but it will affect business and consumer behavior negatively. Intractable fiscal issues such as tax and
entitlement reform, in our opinion, will only be achieved through political consensus. In the absence of
effective political leadership, such a consensus seems achievable only in the aftermath of a financial and
economic meltdown on the order of 2008.
Once gold demonstrates that it can trade sustainably above $2000, or 20% above current levels, we
believe that gold mining stocks could trade at 13%-15% of spot bullion (basis XAU). That would translate into
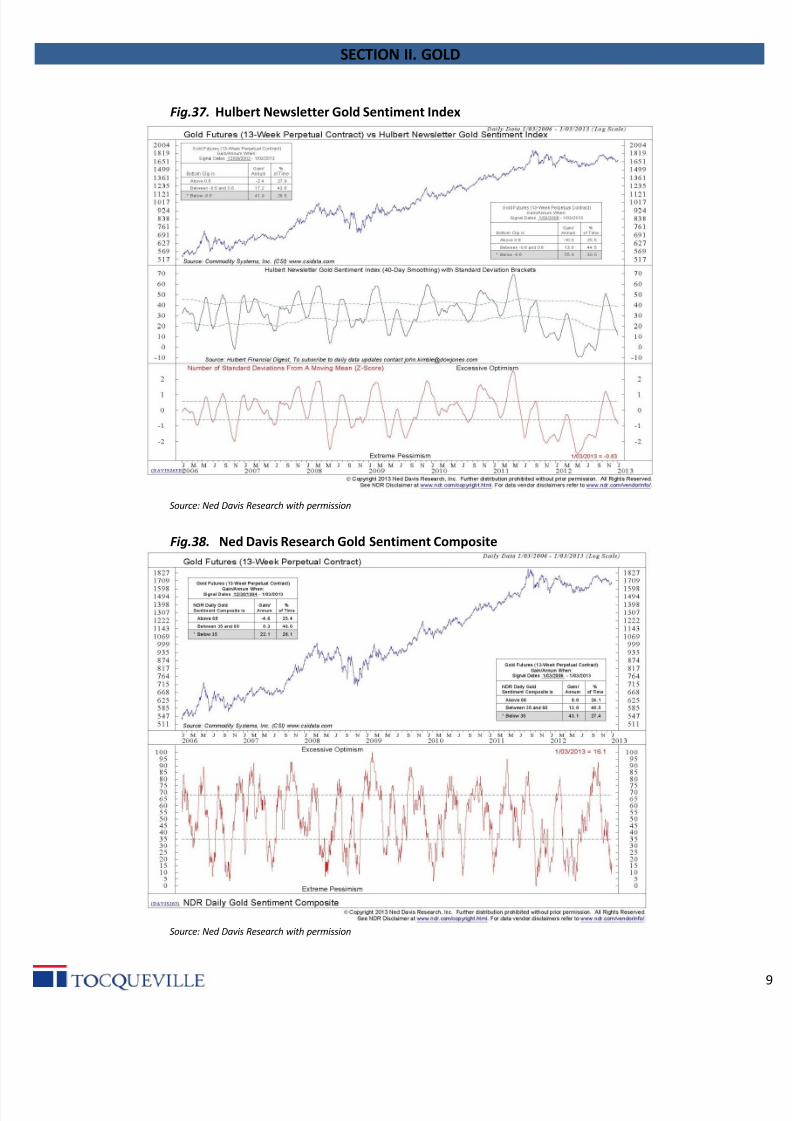
appreciation of 60%-90% above the current XAU level of 160. Investor sentiment on gold is currently extremely
negative, comparable to the levels of mid-May 2012, when gold was trading approximately $100/oz. below
current levels (see Fig.35 - Fig.38 on pp. 8-9 of the appended data section). Historically, extreme negative
sentiment levels such as these have provided excellent entry points for new positions in bullion and the mining
shares.
Best regards,
John Hathaway
Portfolio Manager and Senior Managing Director
© Tocqueville Asset Management L.P.
January 8, 2013
This article reflects the views of the author as of the date or dates cited and may change at any time. The information should not be
construed as investment advice. No representation is made concerning the accuracy of cited data, nor is there any guarantee that any
projection, forecast or opinion will be realized.
References to stocks, securities or investments should not be considered recommendations to buy or sell. Past performance is not a guide
to future performance. Securities that are referenced may be held in portfolios managed by Tocqueville or by principals, employees and
associates of Tocqueville, and such references should not be deemed as an understanding of any future position, buying or selling, that
may be taken by Tocqueville. We will periodically reprint charts or quote extensively from articles published by other sources. When we
do, we will provide appropriate source information. The quotes and material that we reproduce are selected because, in our view, they
provide an interesting, provocative or enlightening perspective on current events. Their reproduction in no way implies that we endorse
any part of the material or investment recommendations published on those sites.

8/9/2019 Tocqueville Gold - 4Q 2012 Investor Letter
http://slidepdf.com/reader/full/tocqueville-gold-4q-2012-investor-letter 3/15
Macro charts show bloated and still expanding central bank balance sheets, negative real interest
rates in major currencies, and rapid growth of monetary aggregates. One could argue that thesefacts are well known, and that is certainly the case. However, the consequences of these facts are
still unknown, and therefore undiscounted by the markets. This in our opinion is the basis for
further upside in the gold price.
Charts 16 & 17 reveal a potential time bomb for US treasuries. Interest on the public debt is close
to historical lows, due in part to Fed manipulation, the “fear” trade, and old fashioned
momentum. Think of what 300 or 400 additional basis points across the yield curve would do to
the fiscal deficit. (Hint: what is 4% x $16 trillion as a percent of future fiscal deficits? Answer: it is
very high).
Charts 23 & 24 reflect the declining willingness of foreign investors to invest in US securities. It
may have something to do with the point above.
Charts 28, 32 & 32 indicate that despite all of the talk about gold, it remains very underowned.
Charts 35 & 38 show that sentiment is at, or approaching rock bottom levels from which rallies can
be reliably be expected.
Chart 47 shows that despite all of the sell side whining about rising costs (see Chart 48), profits are
at record levels.
The consequence of Chart 47 is reflected in Chart 51, a steady decline in equity issuance. We
believe declining equity dilution is an important positive fundamental change in the industry that
will help lead to expanding valuation of gold mining equities.

8/9/2019 Tocqueville Gold - 4Q 2012 Investor Letter
http://slidepdf.com/reader/full/tocqueville-gold-4q-2012-investor-letter 4/15
SECTION I. MACRO
-3%
-2%
-1%
0%
1%
2%
3%
4%€ 0
€ 200
€ 400
€ 600
€ 800
€ 1,000
€ 1,200
€ 1,400
1999 2001 2003 2005 2007 2009 2011
Fig.3. ECB Real Rates and Gold in EURGold
ECB Real Rates
Source: Bloomberg
-5%
-4%
-3%
-2%
-1%
0%
1%
2%
3%
4%
5%2,000
4,000
6,000
8,000
10,000
12,000
14,000
1999 2001 2003 2005 2007 2009 2011
Fig.5. Chinese Real Rates and Gold in RMBGold
Chinese Real Rates
Source: Bloomberg
-5%
-4%
-3%
-2%
-1%
0%
1%
2%
3%
4%
5%$0
$200
$400
$600
$800
$1,000
$1,200
$1,400
$1,600
$1,800
$2,000
2000 2002 2004 2006 2008 2010 2012
Fig.1. Gold and US Real Rates
Gold Price
US Real Rates
Source: Bloomberg
$0
$500
$1,000
$1,500
$2,000
$2,500
$3,000
$3,500
1994 1998 2002 2006 2010
Fig.2. Fed Balance Sheet ($B)
Source: Bloomberg
€ 0
€ 500
€ 1,000
€ 1,500
€ 2,000
€ 2,500
€ 3,000
€ 3,500
1999 2001 2003 2005 2007 2009 2011
Fig.4. ECB Balance Sheet ( €B)
Source: Bloomberg
0
5,000
10,000
15,000
20,000
25,000
30,000
35,000
2003 2005 2007 2009 2011
Fig.6. PBC Balance Sheet (RMB B)
Source: Bloomberg

8/9/2019 Tocqueville Gold - 4Q 2012 Investor Letter
http://slidepdf.com/reader/full/tocqueville-gold-4q-2012-investor-letter 5/15
SECTION I. MACRO
$0
$10
$20
$30
$40
1999 2001 2003 2005 2007 2009 2011
$0
$5
$1,
$1,
$2,Fig. 8. Gold and Combined M2
($T; Fed, ECB, PBC)
Gold
M2
Source: Bloomberg
0%
4%
8%
12%
16%
1970 1975 1980 1985 1990 1995 2000 2005 20
Fig. 10. US M2 YoY%
Source: Bloomberg
-5%
0%
5%
10%
15%
20%
25%
1970 1975 1980 1985 1990 1995 2000 2005 2010
Fig. 9. US M1 YoY%
Source: Bloomberg
0%
4%
8%
12%
16%
1999 2001 2003 2005 2007 2009 2011
Fig. 11. ECB M1 YoY %
Source: Bloomberg
0%
4%
8%
12%
1999 2001 2003 2005 2007 2009 2011
Fig. 12. ECB M2 YoY %
Source: Bloomberg
0%
10%
20%
30%
40%
1996 1998 2000 2002 2004 2006 2008 2010 2012
Fig.13. PBC M1 YoY %
Source: Bloomberg
0%
10%
20%
30%
1996 1998 2000 2002 2004 2006 2008 2010 2
Fig.14. PBC M2 YoY %
Source: Bloomberg
$0
$2
$4
$6
$8
$10
$12
$14
$16
2006 2007 2008 2009 2010 2011 2012
Fig.7. The Biggest 6 Central Bank Balance
SheetsUS, UK, Japan, China, EU & Switzerland (US$T)
Source: Bloomberg

8/9/2019 Tocqueville Gold - 4Q 2012 Investor Letter
http://slidepdf.com/reader/full/tocqueville-gold-4q-2012-investor-letter 6/15
SECTION I. MACRO
Fig.15. Inflation
US Euro Area China
Headline CPI 1.80% 2.20% 2.00%
Core CPI 1.90% 1.40% n/a
Shadowstats 9.41% n/a n/a
Source: Bloomberg; Shadow Government Statistics
Fig 19. Total credit Market Debt as % of GDP
Source: Ned Davis Research with permission
Dec-12
$0
$2
$4$6
$8
$10
$12
$14
$16
$18
1980 1990 2000 2010
Fig.17 . US Public Debt Outstanding ($T)
Source: Bloomberg
0%
1%
2%
3%
4%
5%
6%
7%
2000 2002 2004 2006 2008 2010 2012
F ig.16. Average Annual Interest Rate Pai
on US Debt
Source: Bloomberg; US Treasury
10%
12%
14%
16%
18%
20%
22%
24%
1988 1992 1996 2000 2004 2008 20
Fig.18 US Interest Expense as % of Total
Government Outlays
Source: Bloomberg; US Treasury

8/9/2019 Tocqueville Gold - 4Q 2012 Investor Letter
http://slidepdf.com/reader/full/tocqueville-gold-4q-2012-investor-letter 7/15
SECTION I. MACRO
Fig.21. The Debt Ceiling ($T) Fig.22. Global Forex Accumulation. 12 months sum
Source: MacroMavens, LLC
Source: Bianco Research
Fig.23. China Net Purchases of LT US Securities (annual $B)
Source: MacroMavens, LLC Source: MacroMavens, LLC
Fig.24. Share of Global Forex Accumulation Recycl
into US Securities
0
50
100
150
200
250
300
350
400
1999 2001 2003 2005 2007 2009 2011
$0
$500
$1,000
$1,500
$2,000Fig. 20. Quality Spread and Gold
Gold Price
Moody's Seasoned Corp Aaa vs Baa
Source: Bloomberg

8/9/2019 Tocqueville Gold - 4Q 2012 Investor Letter
http://slidepdf.com/reader/full/tocqueville-gold-4q-2012-investor-letter 8/15
SECTION II. GOLD
Fig. 25. Gold Supply and Demand(tonnes)
Source: World Gold Council
0
500
1000
1500
2000
2500
2004 2005 2006 2007 2008 2009 2010 2011 2012
Fig. 27 . Gold Held By Gold ETFS (tonnes)
Other
GLD
Source: Company Filings, World Gold Council
20%22%
6%
0%
5%
10%
15%
20%
25%
1934 1982 Q3'2012
Fig. 26. Market Cap of Above Ground Gold as % of Total US
Financial Assets
Source: Federal Reserve, World Gold Council
2002 2003 2004 2005 2006 2007 2008 2009 2010 2011 Q32012
Supply
Mine production 2,591 2,592 2,478 2,550 2,481 2,476 2,409 2,584 2,739 2,827 2,101
Old gold scrap 835 944 829 886 1,107 956 1,217 1,672 1,723 1,669 1,237
Traditional supply 3,426 3,536 3,307 3,436 3,588 3,432 3,626 4,257 4,463 4,495 3,337 Net producer hedging (412) (279) (445) (86) (373) (444) (349) (252) (108) 10 (12)
Official sector sales 545 617 497 662 367 484 236 30 - - -
Total supply 3,559 3,874 3,359 4,012 3,582 3,472 3,513 4,034 4,355 4,505 3,326
Demand
Jewellery 2,680 2,522 2,673 2,707 2,283 2,405 2,187 1,760 2,017 1,972 1,410
Other 360 385 416 431 458 462 436 373 466 453 327
Total fabrication 3,040 2,907 3,089 3,138 2,741 2,867 2,623 2,134 2,483 2,425 1,738
Bar & coin retail investment 373 314 396 412 421 446 649 743 1,205 1,519 942
Official sector purchases - - - - - - - - 77 457 374
ETFs & Similar 3 39 133 208 260 253 321 617 382 185 189
Implied net investment 143 614 (259) 254 160 (94) (80) 541 207 (81) 83
Total demand 3,559 3,874 3,359 4,012 3,582 3,472 3,513 4,034 4,355 4,505 3,326

8/9/2019 Tocqueville Gold - 4Q 2012 Investor Letter
http://slidepdf.com/reader/full/tocqueville-gold-4q-2012-investor-letter 9/15
SECTION II. GOLD
Fig.30. Notable Transactions in 3Q12
Source: World Gold Council
Investment
Adviser,
19.3%
Broker, 7.4%
Private
Banking, 0.9%
Pension Fund,
0.5%
Hedge Fund,
10.2%Mutual Fund,
3.6%
Insurance
Company,
0.2%
Non-Institutional,
57.9%
Fig. 28. GLD Ownership by Type
Source: Factset
00 01 02 03 04 05 06 07 08 09 10 11 3Q12
-600-500
-400
-300
-200
-100
0
100
200
300
400
500
600 Fig.29. Central Banks Net Purchases (tonnes)
Source: World Gold Council
29,500
30,000
30,500
31,000
31,500
32,000
32,500
33,000
33,500
34,000
2000 2002 2004 2006 2008 2010 2012
Fig. 31. Central banks Holdings of Gold (tonnes)
Source: World Gold Council
1.0%
1.1%
1.2%
1.3%
1.4%
1.5%
1.6%
2000 2002 2004 2006 2008 2010 2
Fig. 32. Gold as % of Total Reserves
Source: World Gold Council
Country Tonnes Transaction
Kazakhstan 2.45 Purchase
Korea 16.00 Purchase
Russia 16.48 Purchase
Turkey 58.13 Addition

8/9/2019 Tocqueville Gold - 4Q 2012 Investor Letter
http://slidepdf.com/reader/full/tocqueville-gold-4q-2012-investor-letter 10/15
SECTION II. GOLD
0
20
40
60
80
100
Aug-05 Aug-06 Aug-07 Aug-08 Aug-09 Aug-10 Aug-11 Aug-12
Fig.33. Web searches for "Gold Bubble"
Source: GoogleTrends
0
20
40
60
80
100
2004 2006 2008 2010 2012
Fig.34. Web searches for "Gold Investment"
Source: GoogleTrends
$0
$500
$1,00
$1,50
$2,00
0
20
40
60
80
100
2006 2007 2008 2009 2010 2011 2012
Fig. 35. Bernstein's Daily Sentiment Index
DSI Gold
Source Bloomberg, Bernstein's DSI
$400
$600
$800
$1,00
$1,20
$1,40$1,60
$1,80
$2,00
0
20
40
60
80
100
2006 2007 2008 2009 2010 2011 2012
Fig. 36. Market Vane Bullish Consensus
Market Vane Gold
Source: Bloomberg; Market Vane
8/9/2019 Tocqueville Gold - 4Q 2012 Investor Letter
http://slidepdf.com/reader/full/tocqueville-gold-4q-2012-investor-letter 11/15
SECTION II. GOLD
Fig.37. Hulbert Newsletter Gold Sentiment Index
Source: Ned Davis Research with permission
Fig.38. Ned Davis Research Gold Sentiment Composite
Source: Ned Davis Research with permission

8/9/2019 Tocqueville Gold - 4Q 2012 Investor Letter
http://slidepdf.com/reader/full/tocqueville-gold-4q-2012-investor-letter 12/15
SECTION II. GOLD
-20%
80%
180%
280%
380%
480%
2000 2002 2004 2006 2008 2010 2012
Fig.40. Gold vs Continuous Commodity Index
CCI Index
Gold
Source: Bloomberg
$0
$200
$400
$600
$800
$1,000
$1,200
$1,400
$1,600
$1,800
$2,000
-1000
-800
-600
-400
-200
0
200
400
600
800
2006 2007 2008 2009 2010 2011 2012
Fig. 41. Comex Gold Futures Activity (tonnes)
Net Large Speculators
Net Hedgers/Commercials
Gold
Source: CFTC
$0
$200
$400
$600
$800
$1,000$1,200
$1,400
$1,600
$1,800
$2,000
800
1000
1200
1400
1600
1800
2000
2006 2007 2008 2009 2010 2011 2012
Fig. 39. Comex Gold Futures Open Interest
(tonnes)
Open
Interest
Source: Bloomberg
$900
$1,100
$1,300
$1,500
$1,700
$1,900
0.30%
0.40%
0.50%
0.60%
0.70%
0.80%
0.90%
1.00%
07-10 09-10 11-10 01-11 03-11 05-11 07-11 09-11 11-11 01-12 03-12 05-12 07-12 09-12 11-12
Fig.42. Commercial Net Shorts as % of Total Open Interest
Net Short/Open Interest
Gold
Source: Bloomberg; The McClellan Market Report
More Net Short
Less Net Short

8/9/2019 Tocqueville Gold - 4Q 2012 Investor Letter
http://slidepdf.com/reader/full/tocqueville-gold-4q-2012-investor-letter 13/15
SECTION III. MINING EQUITIES
0%
10%
20%
30%
40%
50%
60%
70%
1994 1996 1998 2000 2002 2004 2006 2008 2010 2012
Fig.43. XAU and HUI as a Ratio of Gold
HUI/Gold
XAU/Gold
Source: Factset
-$1,500
-$1,000
-$500
$0
$500
$1,000
$1,500
$2,000
$2,500
$3,000
$3,500
1 H 0 7
2 H 0 7
1 H 0 8
2 H 0 8
1 H 0 9
2 H 0 9
1 H 1 0
2 H 1 0
1 H 1 1
2 H 1 1
1 H 1 2
2 H 1 2
Fig.44. Net Fund Flows For Lipper's Equity
Precious Metals Fund Universe ($M)
Source: Morningstar
2H12 - as of 11/30/12
15%
20%
25%
30%
35%
40%
03 04 05 06 07 08 09 10 11 12
Fig.46. Gold Miners Dividend Payout Ratio
Source: Factset
Universe: ABX, NEM, GG, AU, GFI, KGC, NCM, BVN, HMY, AUY, IAG, CG,
EGO, GOLD
$0
$2
$4
$6
$8
$10
$12
$14
$16
2006 2007 2008 2009 2010 2011 2012
Fig.45. Market Cap of Van Eck Gold
Equity ETFs ($B)
Source: Factset
$0
$200
$400
$600
$800
$1,000
$1,200
$1,400
$1,600
$1,800 Fig.47. Senior Producers Cash Costs and
Margin
Cash Margin
Cash Costs
Source: Bloomberg

8/9/2019 Tocqueville Gold - 4Q 2012 Investor Letter
http://slidepdf.com/reader/full/tocqueville-gold-4q-2012-investor-letter 14/15
SECTION III. MINING EQUITIES
Fig. 48. Total Cash Outflow ($/oz)
Note: Operating = Operating costs + Exploration costs + Royalties;
ap ta= ngo ng+ xpans on cap ta ; t er = nance costs + t er costs
ource: o e s
0%
10
20
30
40
50
60
70
$0
$100
$200
$300
$400
$500
$600
2005 2006 2007 2008 2009 2010 2011 2012
Fig. 49. Average Cost of Acquisitions in the
Gold Sector ($/Oz)
Acquisition Cost As Ratio of Gold PriceSource: RBC Capital Markets
0
20
40
60
80
100
120
140
$0
$2
$4
$6
$8
$10
$12
$14
$16
$18
2000 2001 2002 2003 2004 2005 2006 2007 2008 2009 2010 2011 2012
Fig.51. Equity Capital Issued by Gold Miners
$B of Equty Issued
# of Transactions
Source: RBC Capital Markets
-2%
0%
2%
4%
6%
8%
10%
2002 2003 2004 2005 2006 2007 2008 2009 2010 2011 2012
Fig. 50. Senior Producers Return On Capital
Source: Factset
Universe: NEM, ABX, GG, KGC, AUY, NCM, AU, GFI, HMY
Est

8/9/2019 Tocqueville Gold - 4Q 2012 Investor Letter
http://slidepdf.com/reader/full/tocqueville-gold-4q-2012-investor-letter 15/15
SECTION III. MINING EQUITIES
Fig. 52. Gold Price Discounted by Market
Source: BMO Capital Markets
Fig. 54. NAV Premiums - Senior & Intermediate producers (N.A.)
Source: BMO Capital Markets
Fig. 55. P/CF - Senior producers (N.A.)
Source: BMO Capital Markets
20072008
2009
2010
2011
2013
2012
$500
$700
$900
$1,100
$1,300
$1,500
$1,700
Yr 0 Yr 1 Yr 2 Yr 3 Yr 4
Fig.53. Consensus Forecast Gold Price ($/Oz)
Source: Scotiabank