Embed Size (px)
Citation preview
TODAY 10/09/14 PERIOD 11. Attendance / seating
chart2. Say hi to MR. BEAN :
)3. Notes on Density 4. Worksheet5. Begin Lab if time??
Lat /Long
Time Zones
Contour maps
TODAY 10/9/14 PERIOD 7
1. Attendance/Seating Chart
2. Say Hi to Mr. Bean!3. Check and go over
Density HW4. More Notes5. Another worksheet6. Lab folder fun – if
timeLat /Long
Time Zones
Contour maps
UNIT 1 INTRO AND TOPOGRAPHIC MAPS
Measuring the Earth
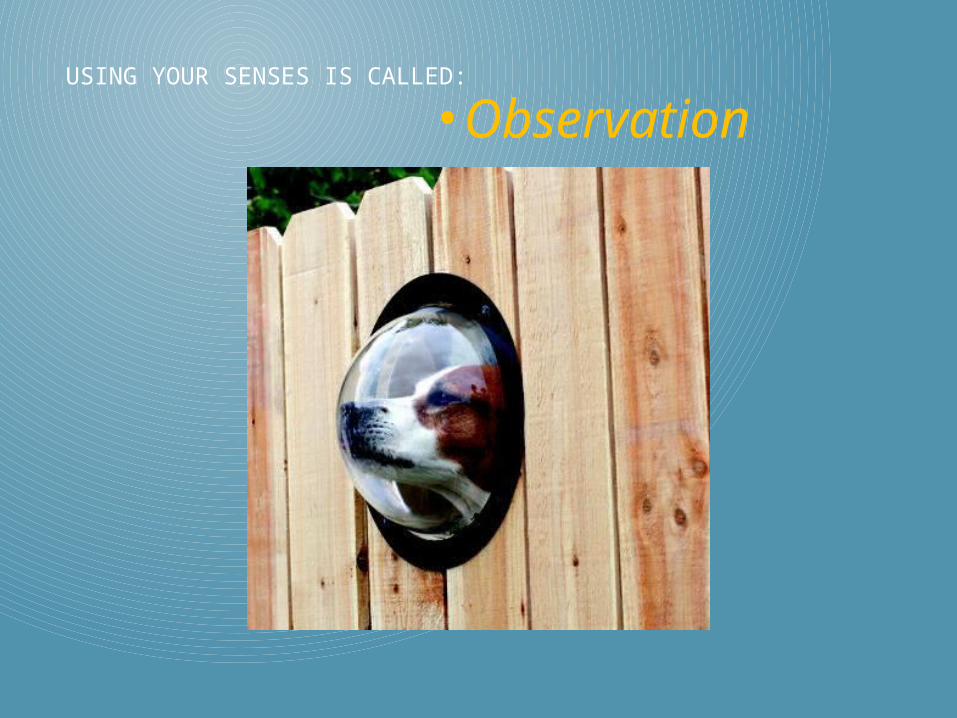
• ObservationUSING YOUR SENSES IS CALLED:
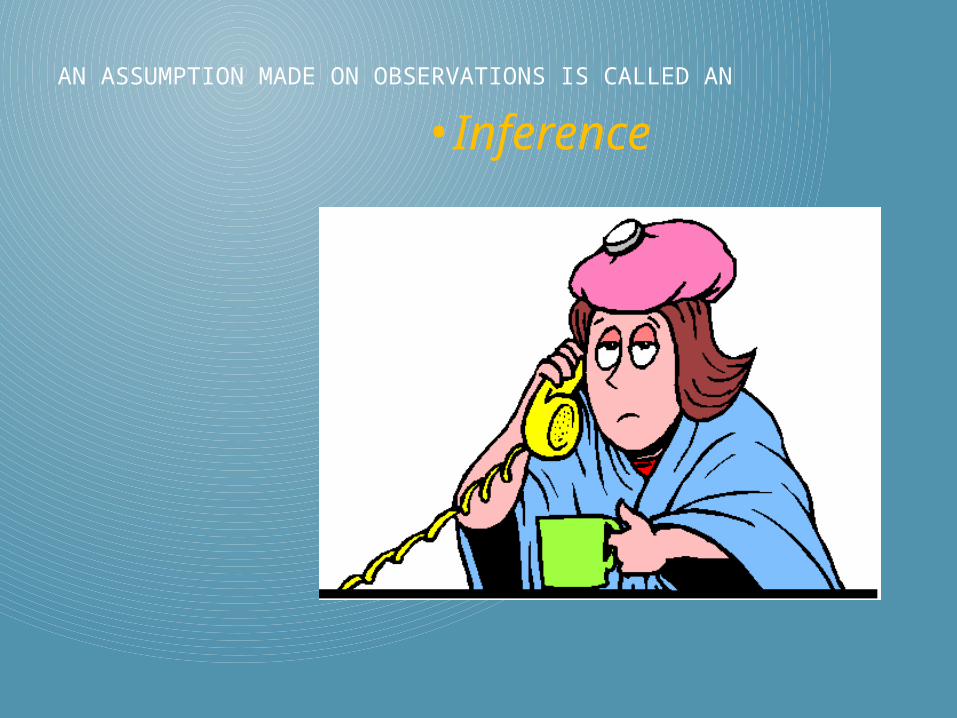
• InferenceAN ASSUMPTION MADE ON OBSERVATIONS IS CALLED AN
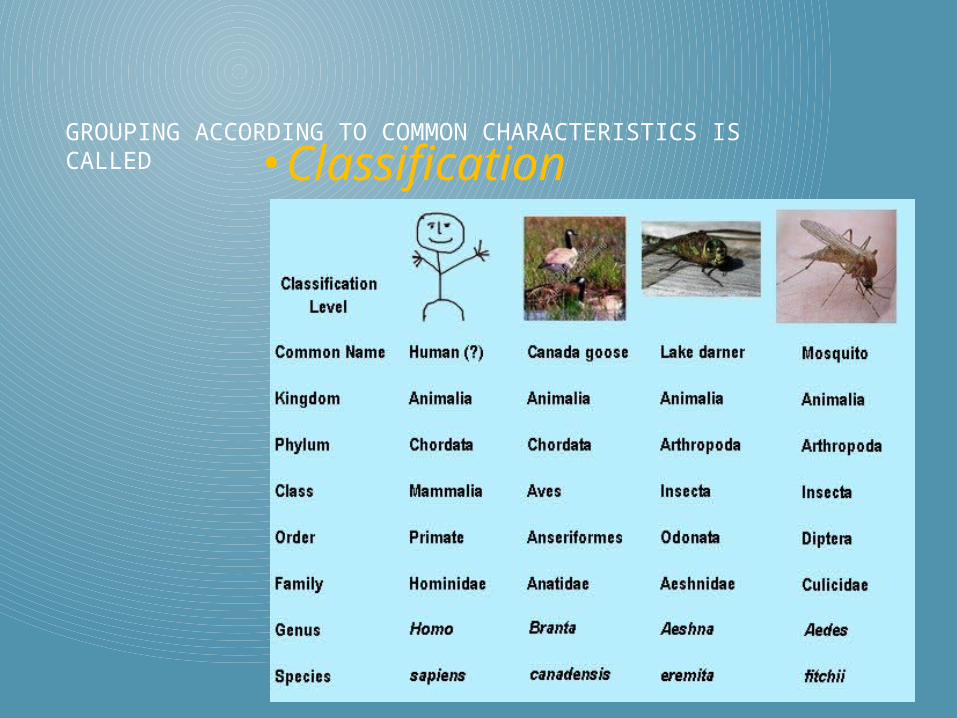
• ClassificationGROUPING ACCORDING TO COMMON CHARACTERISTICS IS CALLED
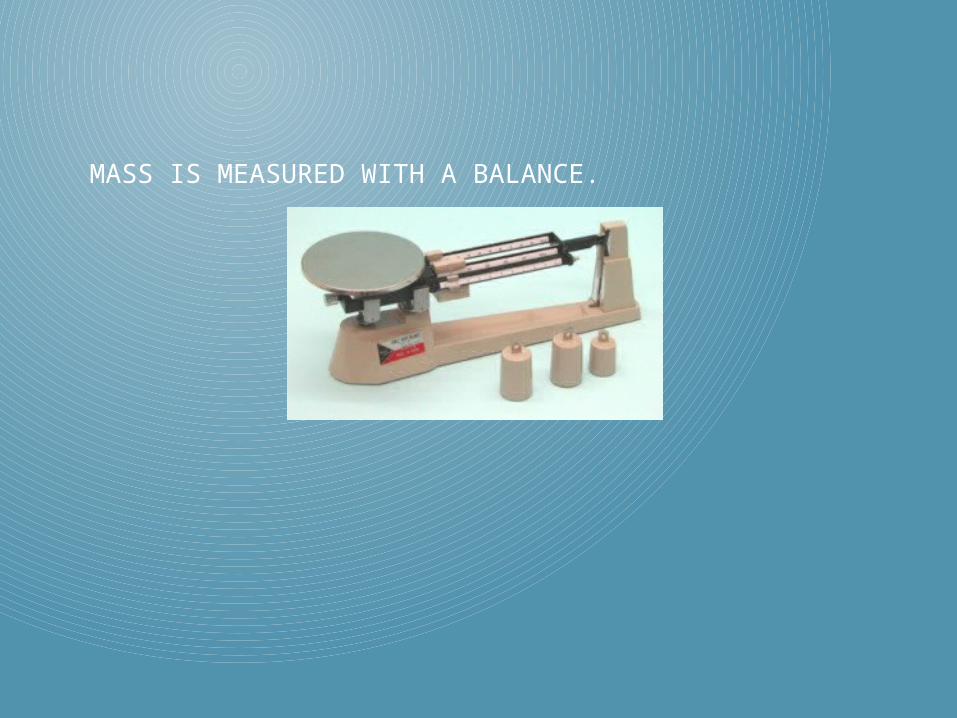
MASS IS MEASURED WITH A BALANCE.
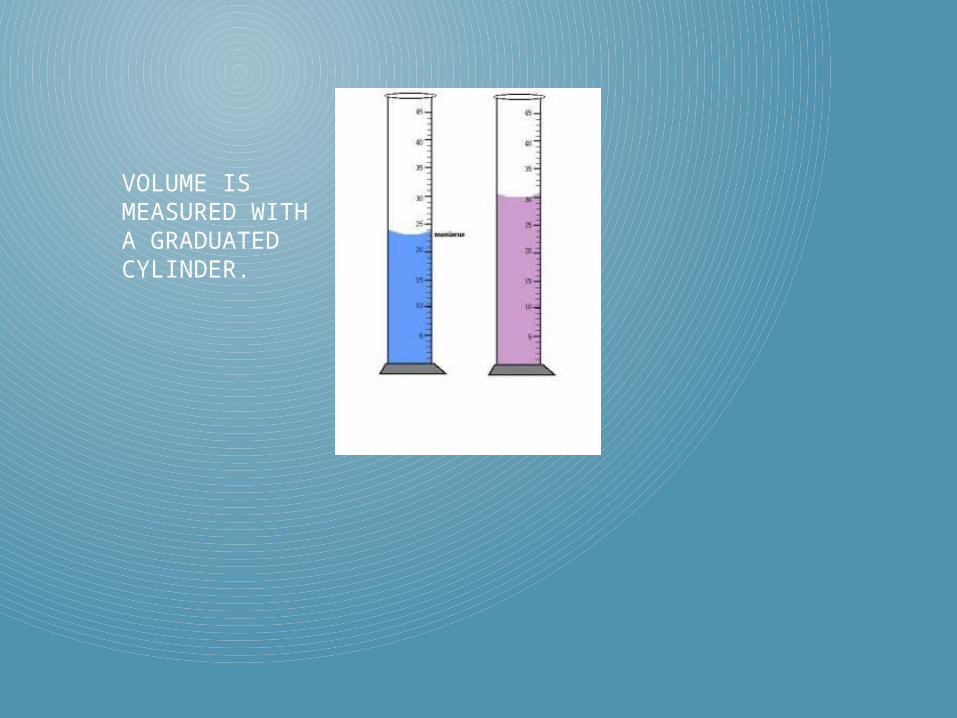
VOLUME IS MEASURED WITH A GRADUATED CYLINDER.
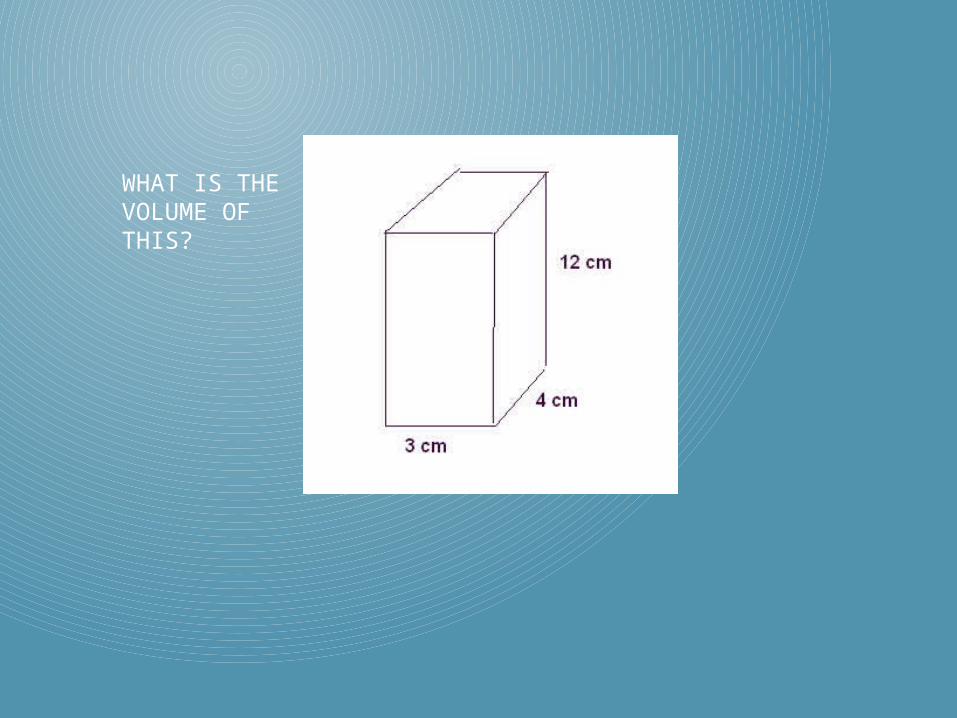
WHAT IS THE VOLUME OF THIS?
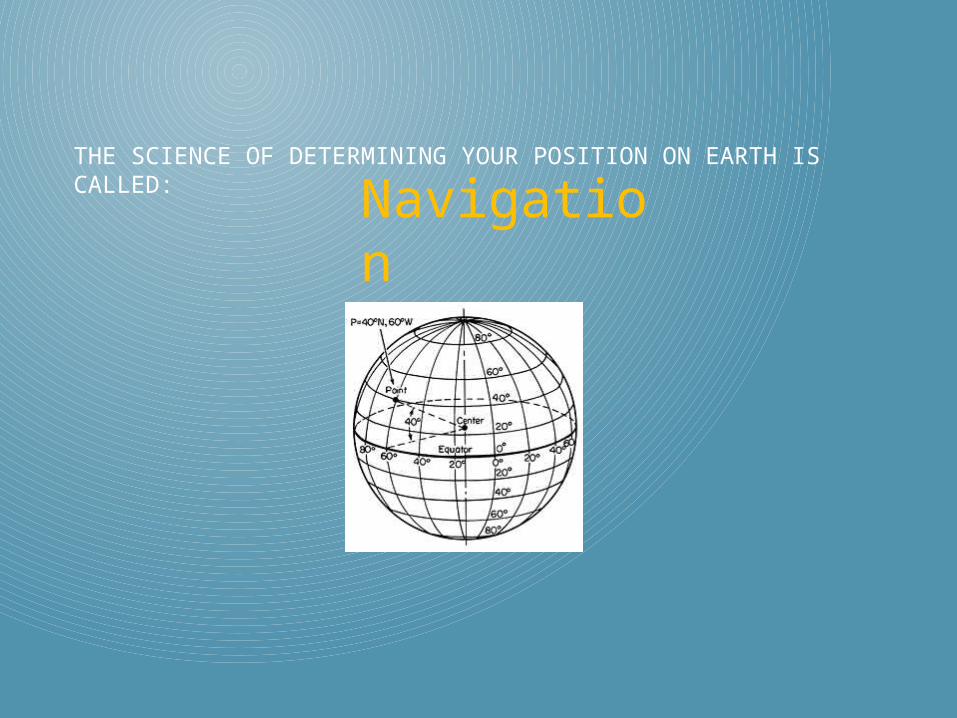
THE SCIENCE OF DETERMINING YOUR POSITION ON EARTH IS CALLED: Navigation
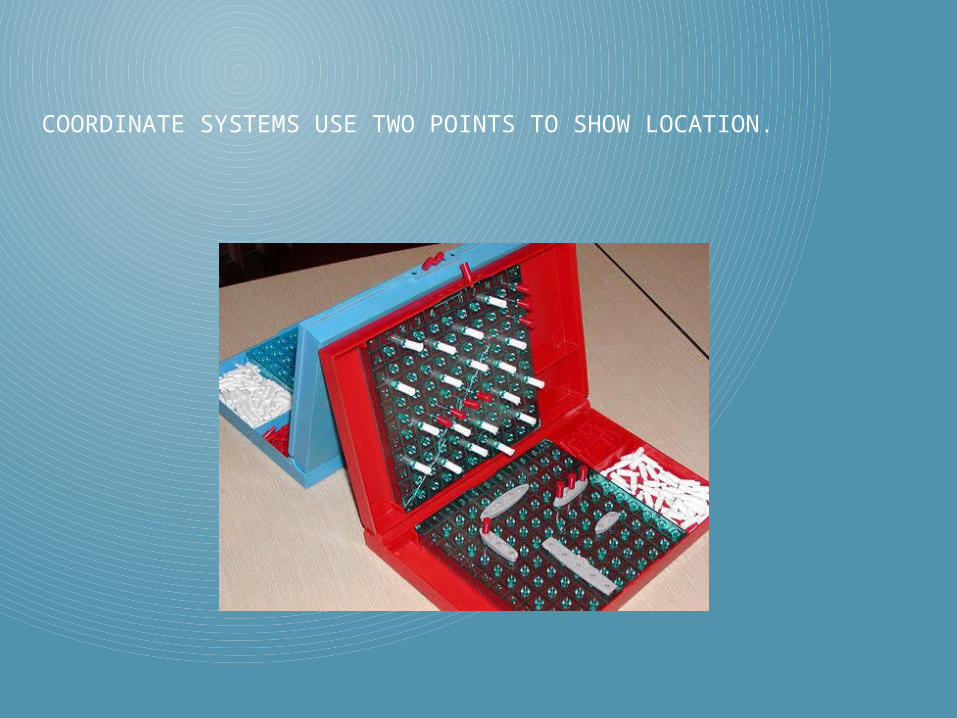
COORDINATE SYSTEMS USE TWO POINTS TO SHOW LOCATION.
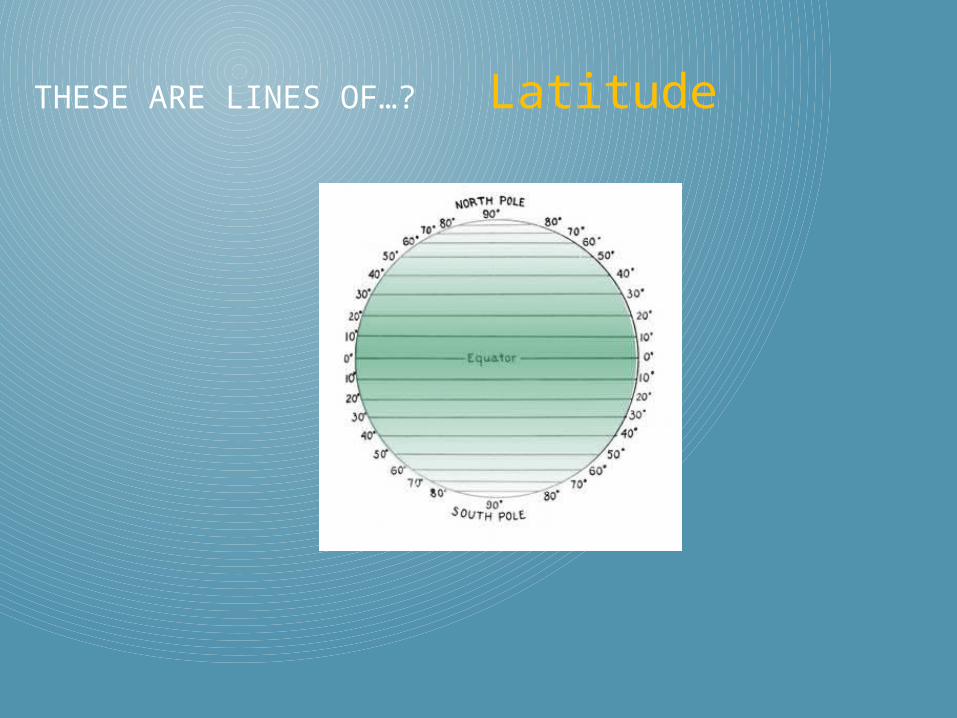
THESE ARE LINES OF…? Latitude
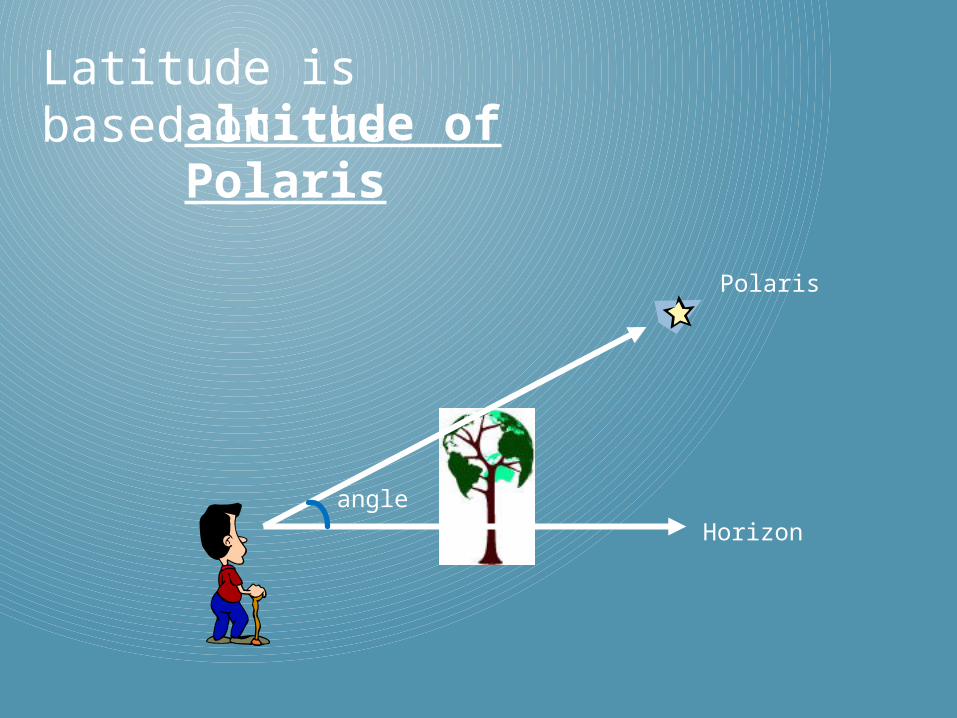
Latitude is based on the altitude of Polaris
Horizon
Polaris
angle
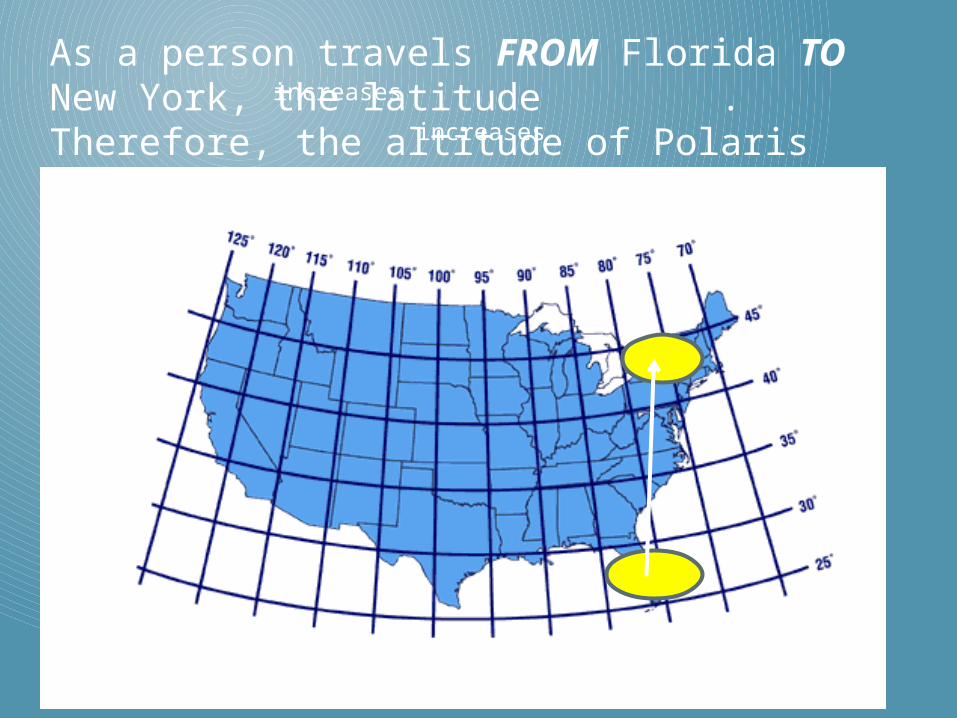
As a person travels FROM Florida TO New York, the latitude . Therefore, the altitude of Polaris .
increases
increases
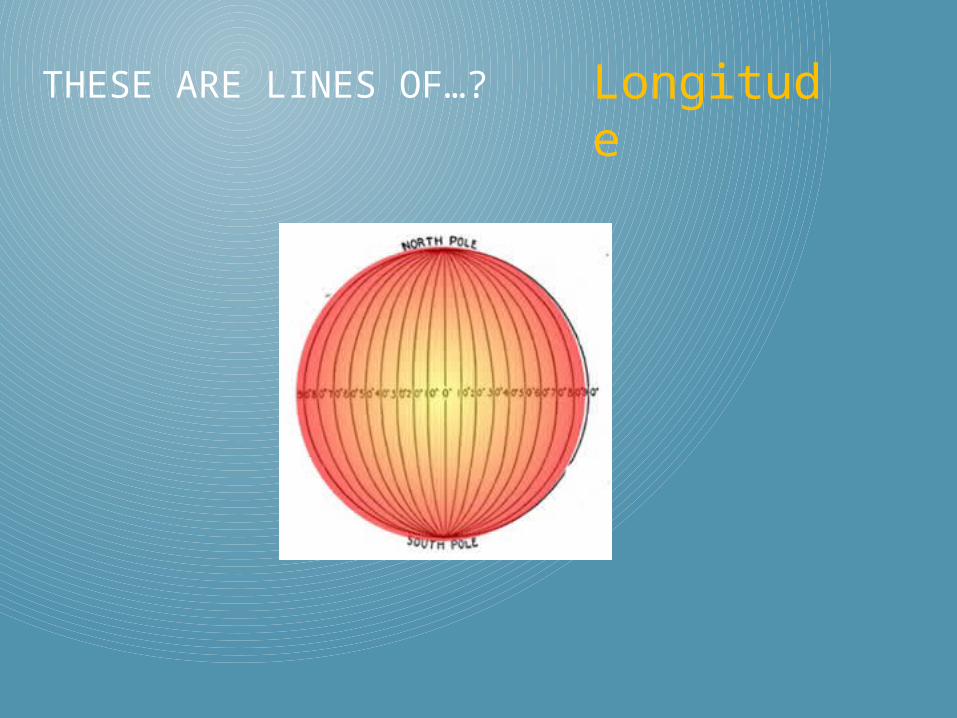
THESE ARE LINES OF…? Longitude
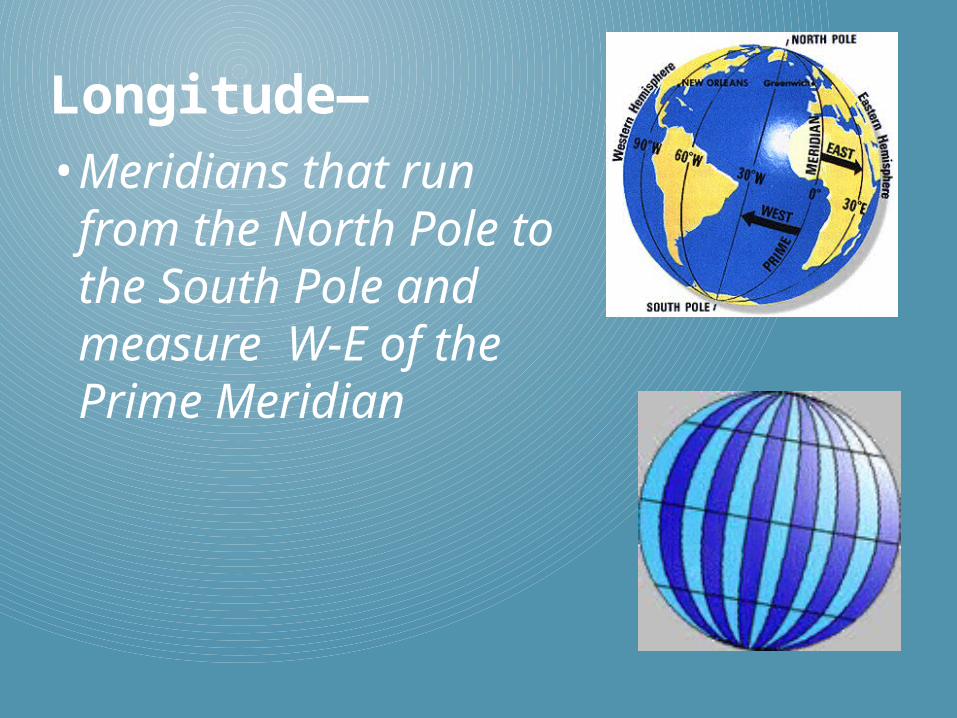
• Meridians that run from the North Pole to the South Pole and measure W-E of the Prime Meridian
Longitude—
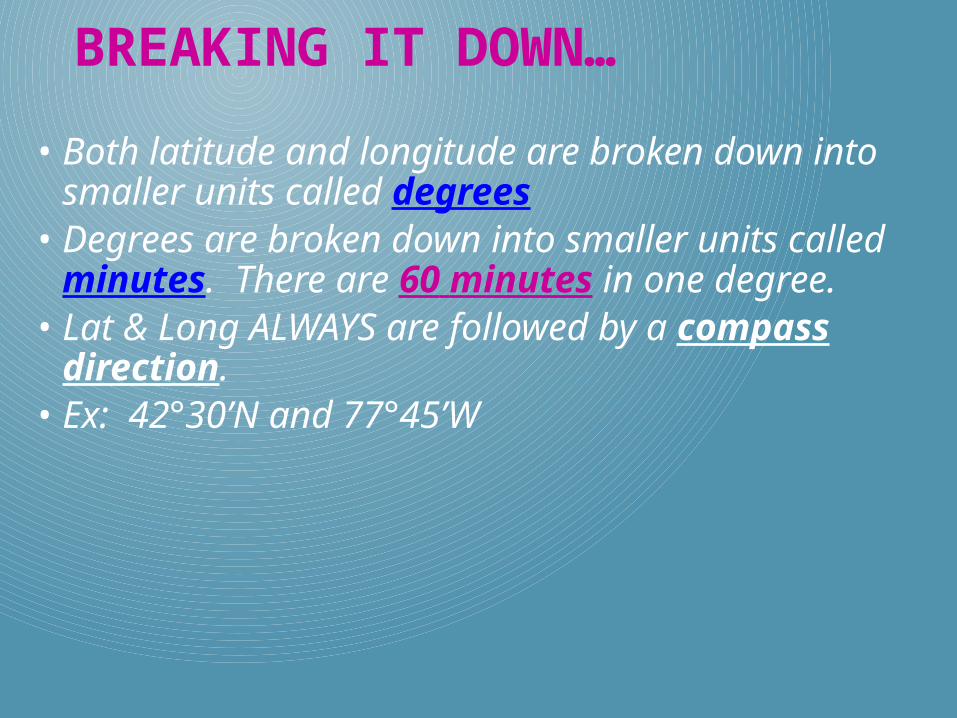
• Both latitude and longitude are broken down into smaller units called degrees
• Degrees are broken down into smaller units called minutes. There are 60 minutes in one degree.
• Lat & Long ALWAYS are followed by a compass direction.
• Ex: 42°30’N and 77°45’W
BREAKING IT DOWN…
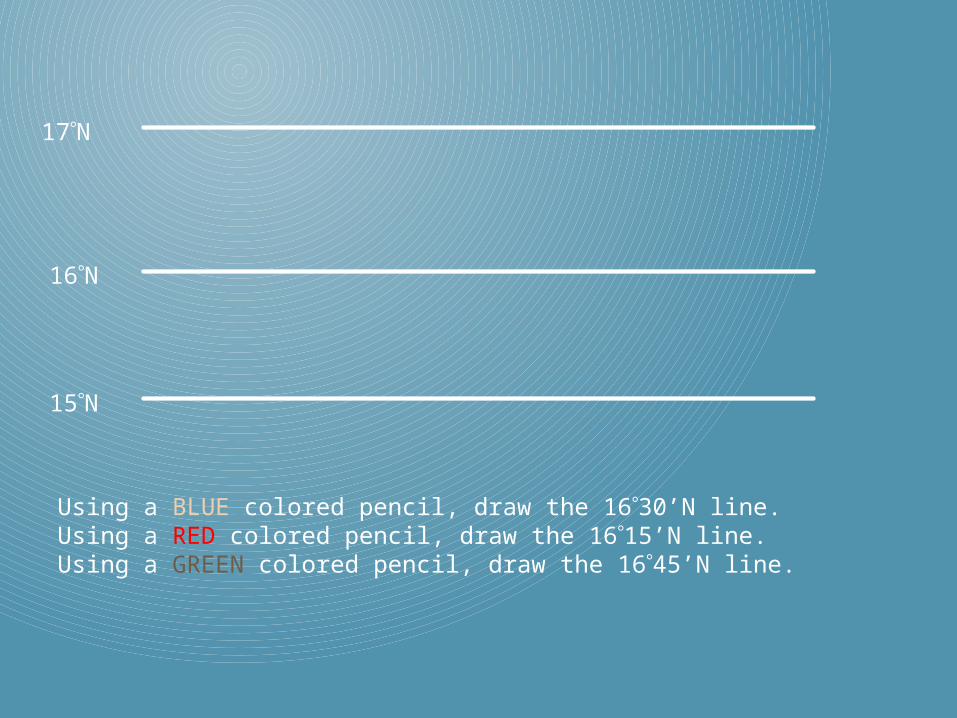
17N
16N
Using a BLUE colored pencil, draw the 1630’N line.Using a RED colored pencil, draw the 1615’N line.Using a GREEN colored pencil, draw the 1645’N line.
15N
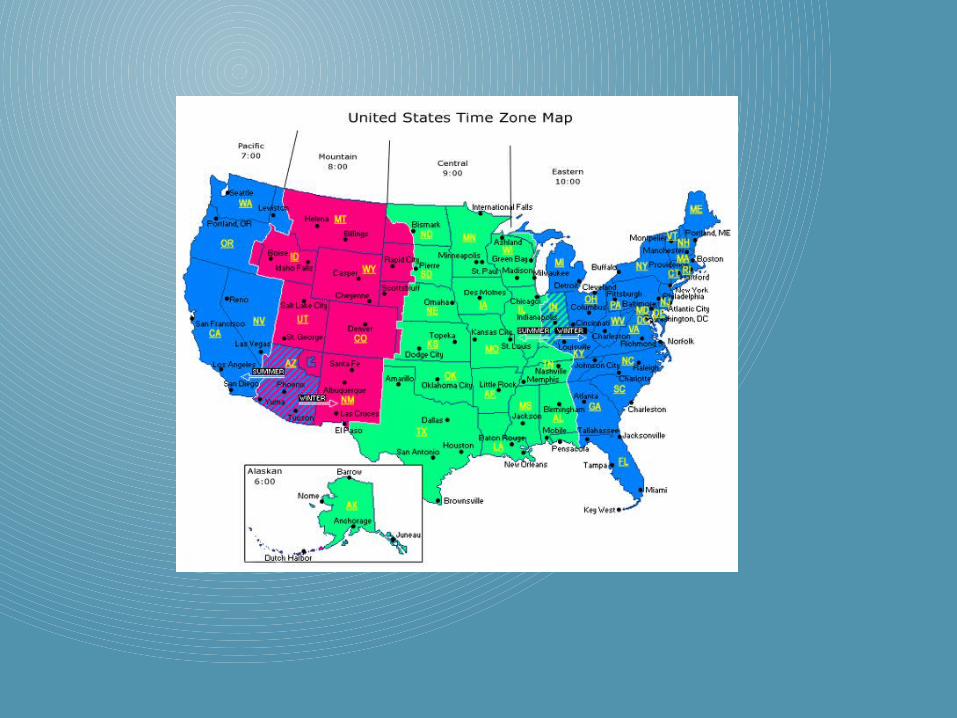
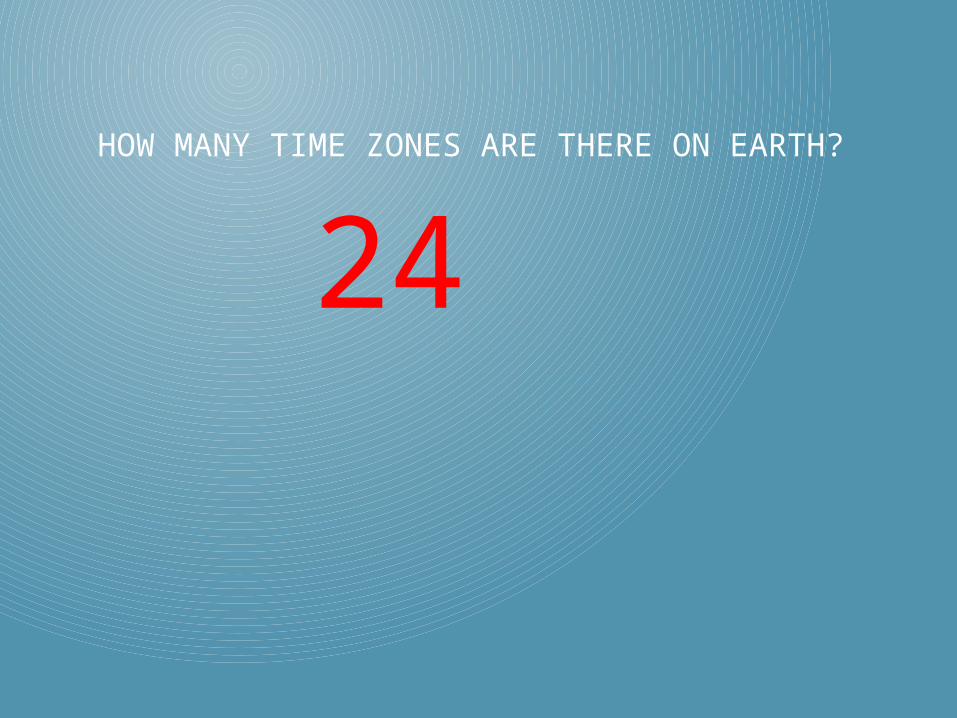
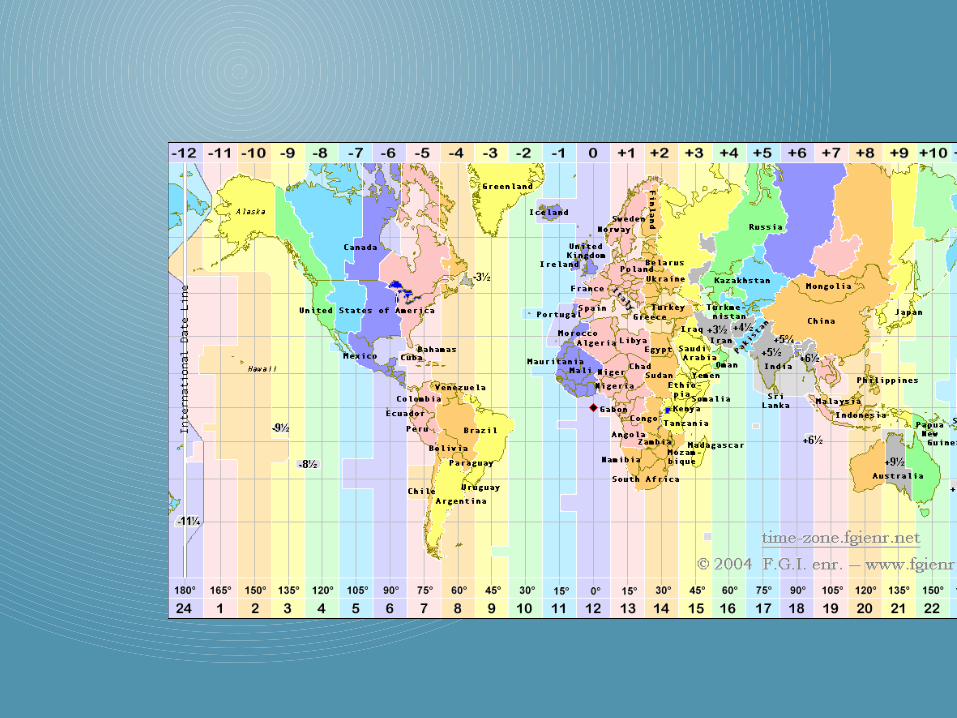
HOW MANY TIME ZONES ARE THERE ON EARTH?
24
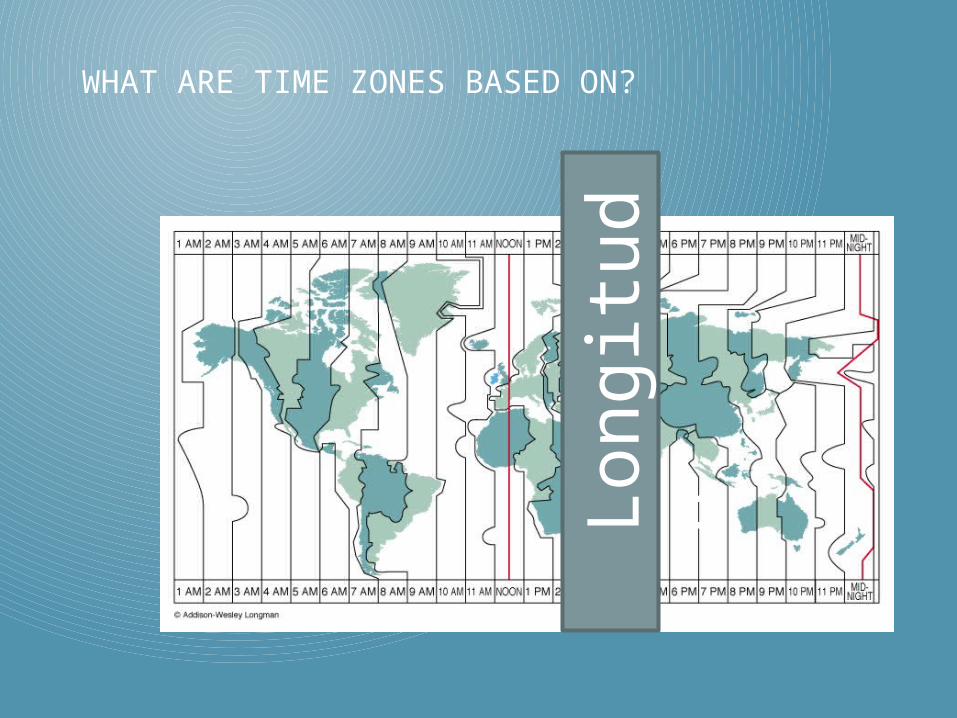
WHAT ARE TIME ZONES BASED ON?
Long
itud
e
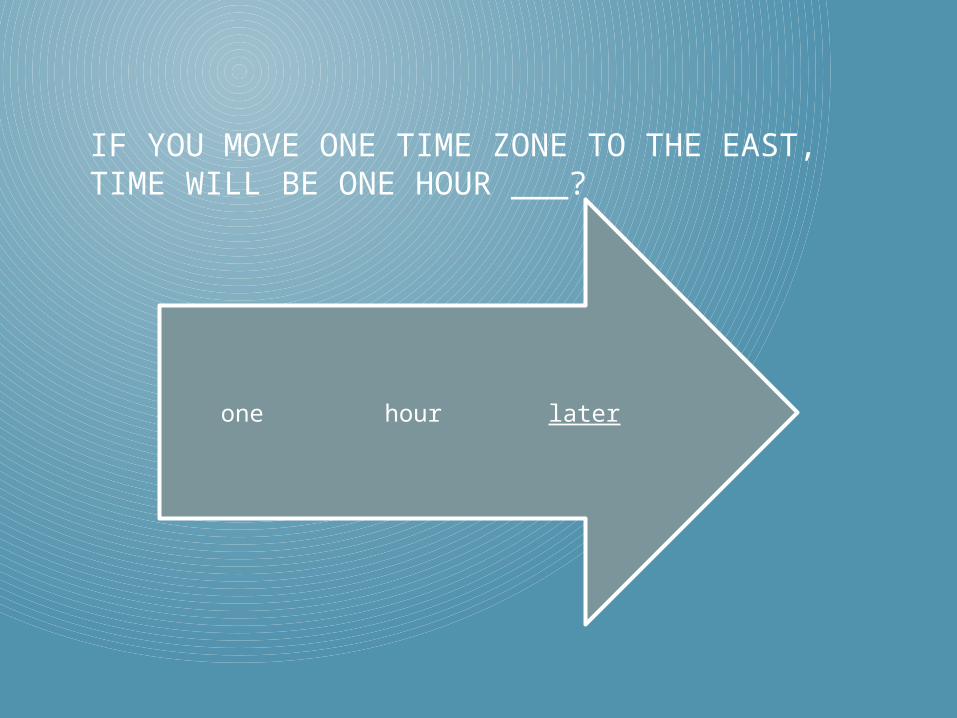
IF YOU MOVE ONE TIME ZONE TO THE EAST, TIME WILL BE ONE HOUR ___?
laterhourone
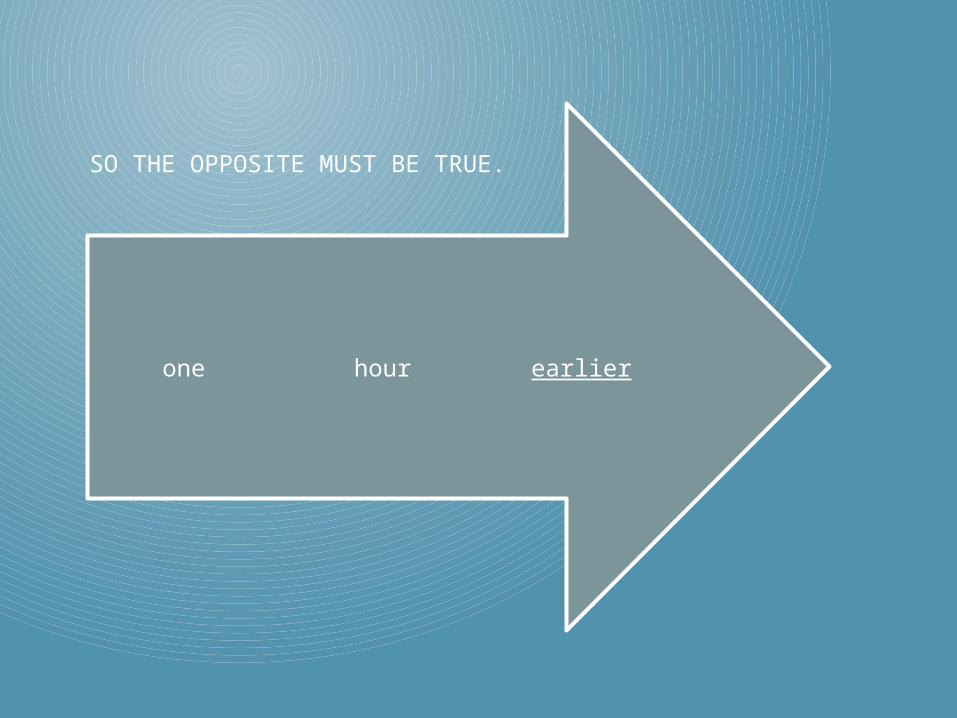
SO THE OPPOSITE MUST BE TRUE.
earlierhourone
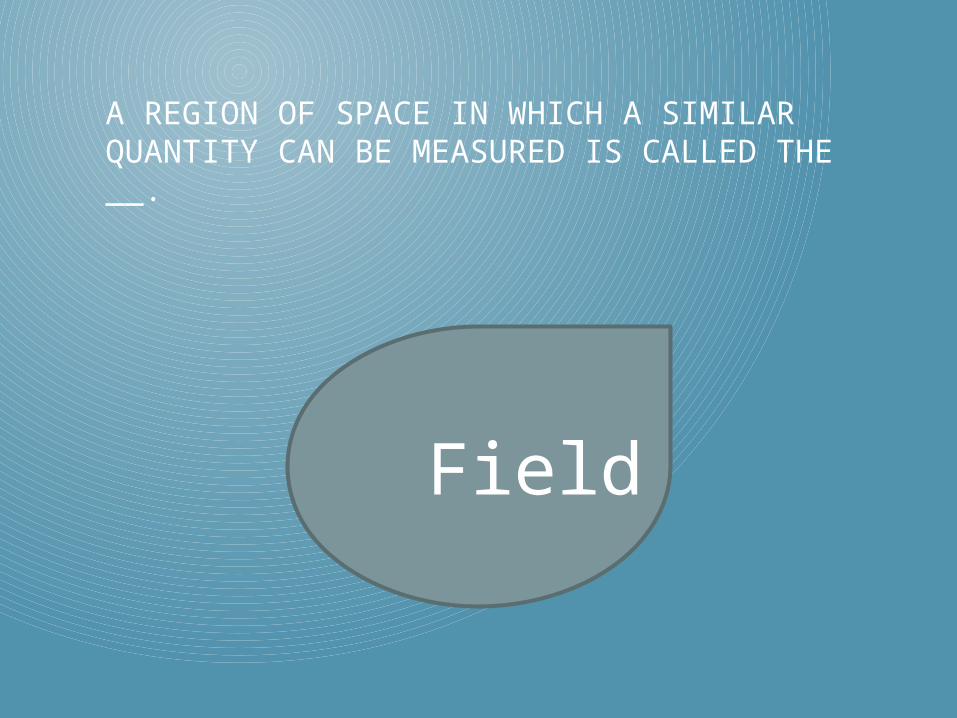
A REGION OF SPACE IN WHICH A SIMILAR QUANTITY CAN BE MEASURED IS CALLED THE __.
Field
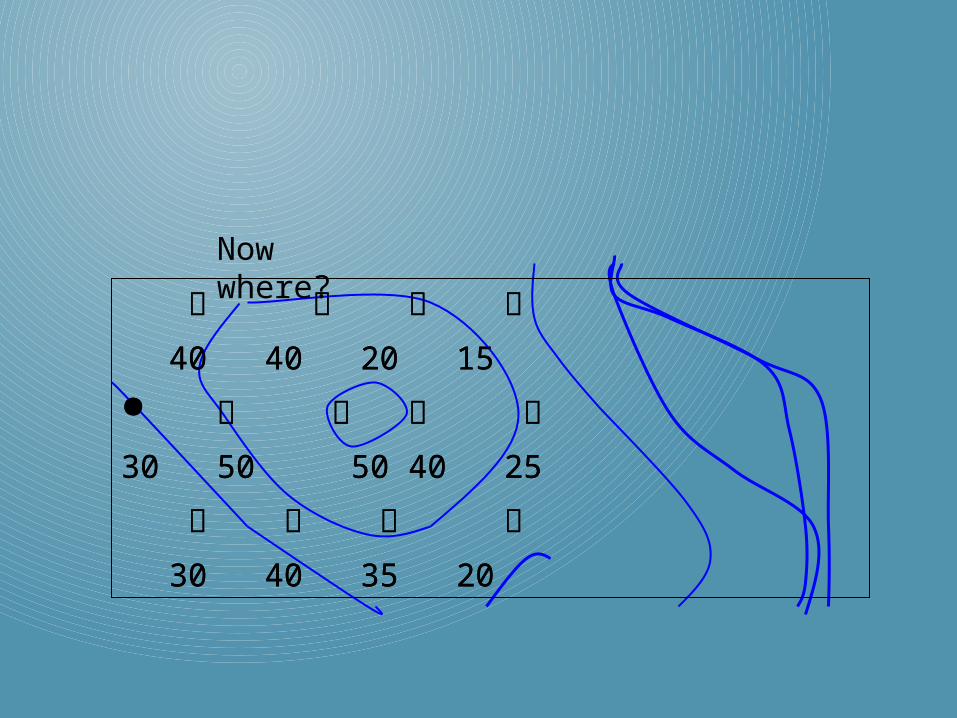
40 40 20 15
30 50 50 40 25
30 40 35 20
Now where?
40 40 20 15
30 50 50 40 25
30 40 35 20
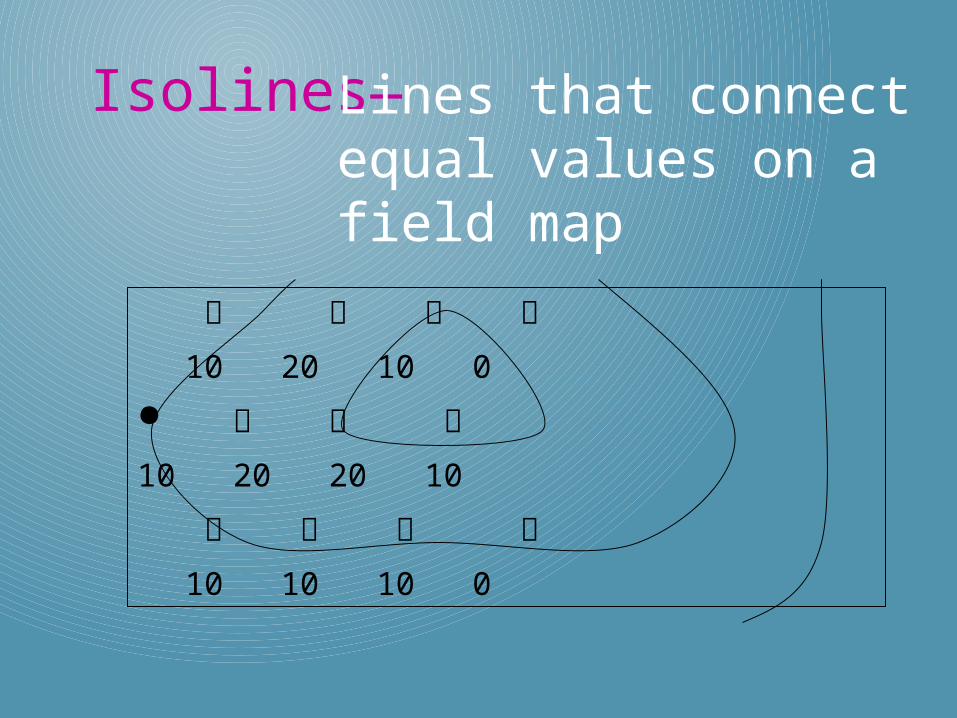
Isolines—Lines that connect equal values on a field map
10 20 10 0
10 20 20 10
10 10 10 0
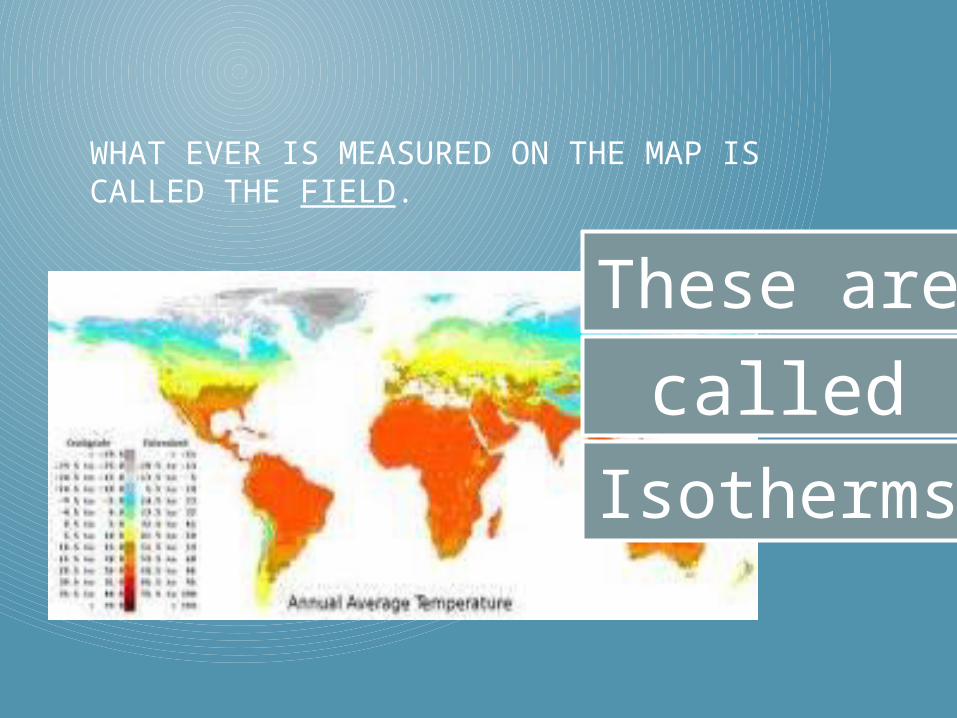
WHAT EVER IS MEASURED ON THE MAP IS CALLED THE FIELD.
These are
calledIsotherms
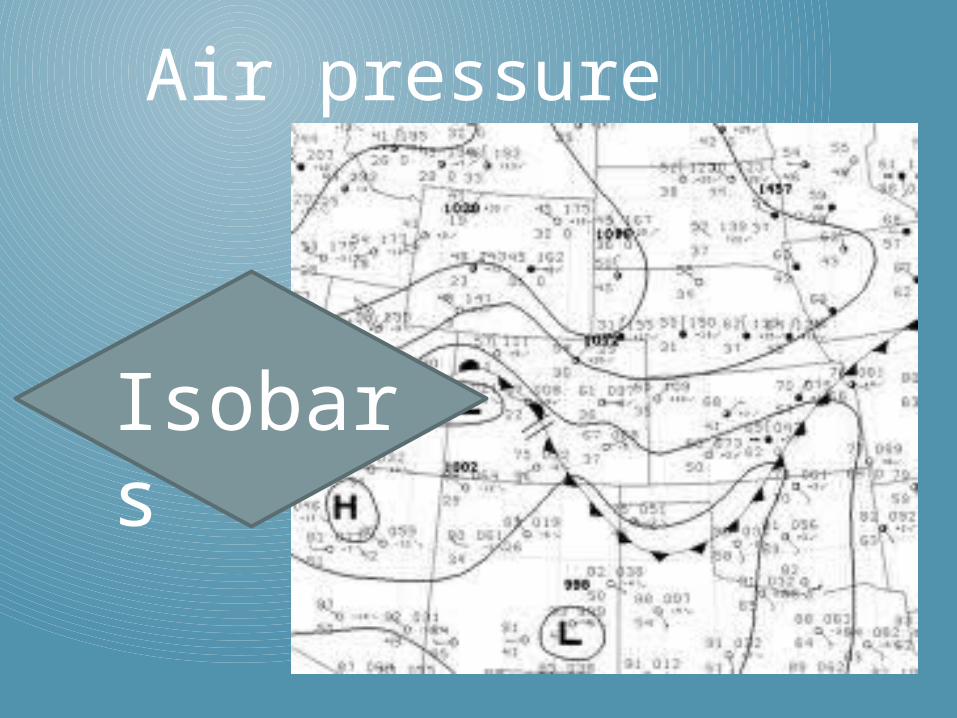
Air pressure
Isobars
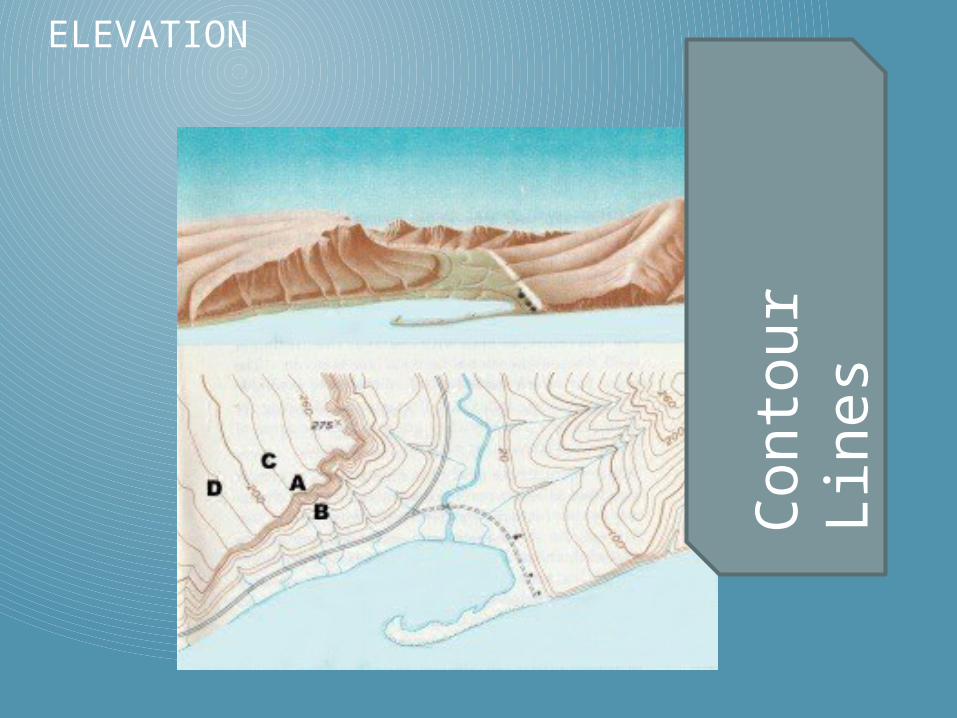
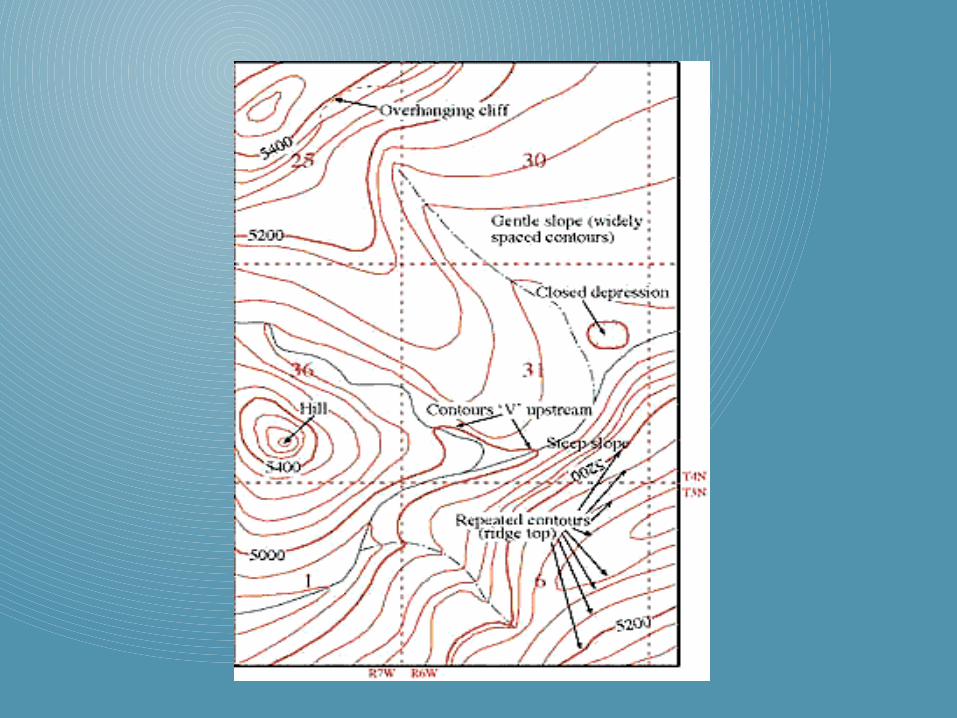
ELEVATION
Con
tou
r Li
nes
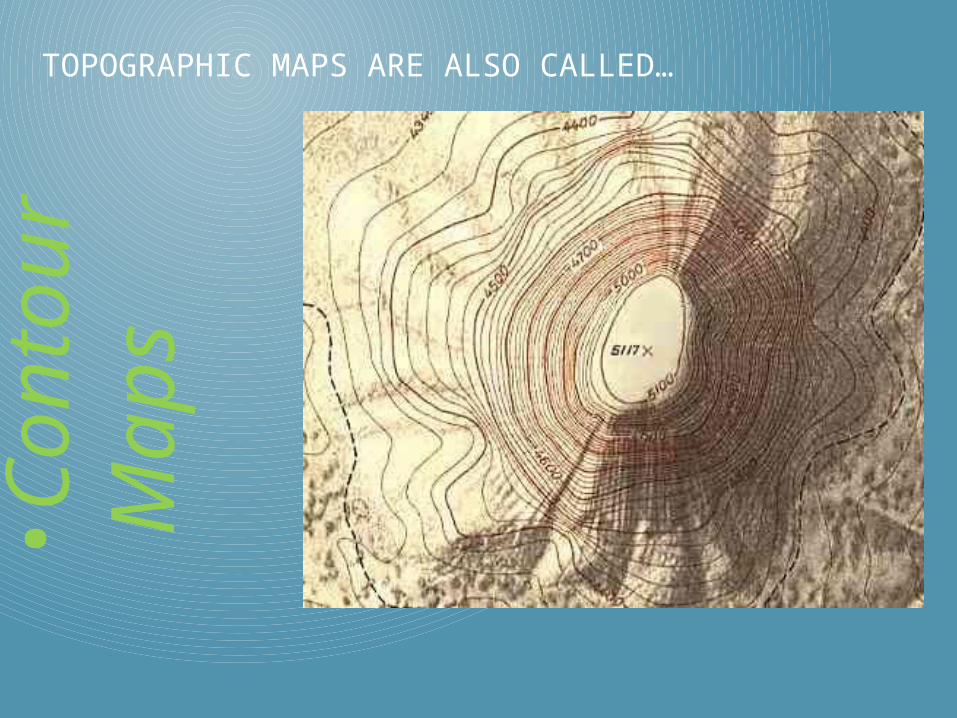
• Con
tou
r M
ap
sTOPOGRAPHIC MAPS ARE ALSO CALLED…
THE DISTANCE BETWEEN CONTOUR LINES IS CALLED THE …
Contour interval
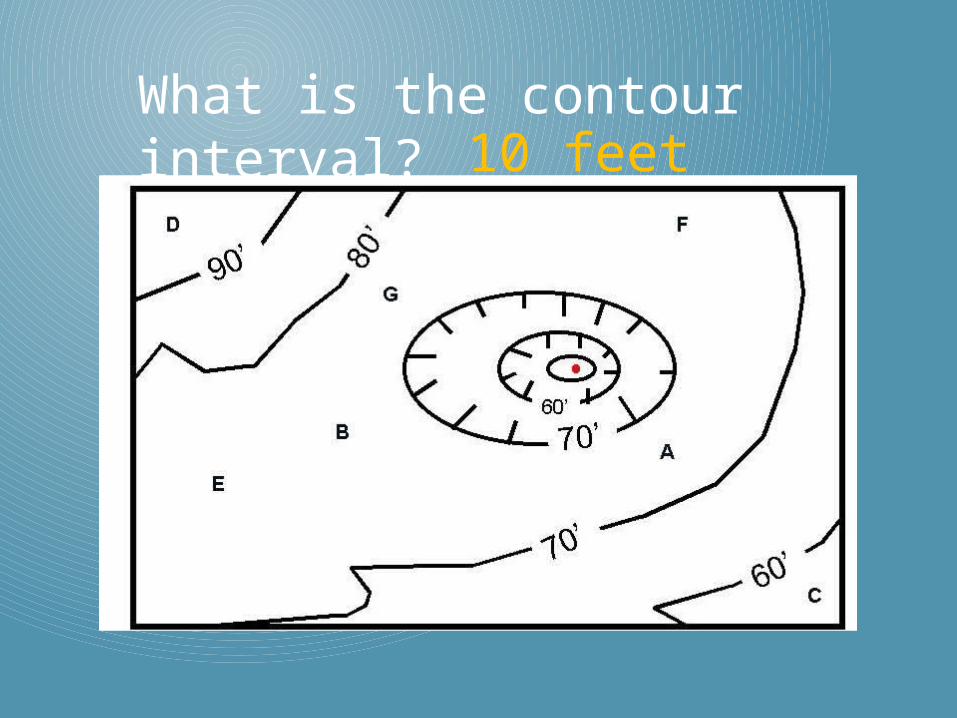
What is the contour interval? 10 feet
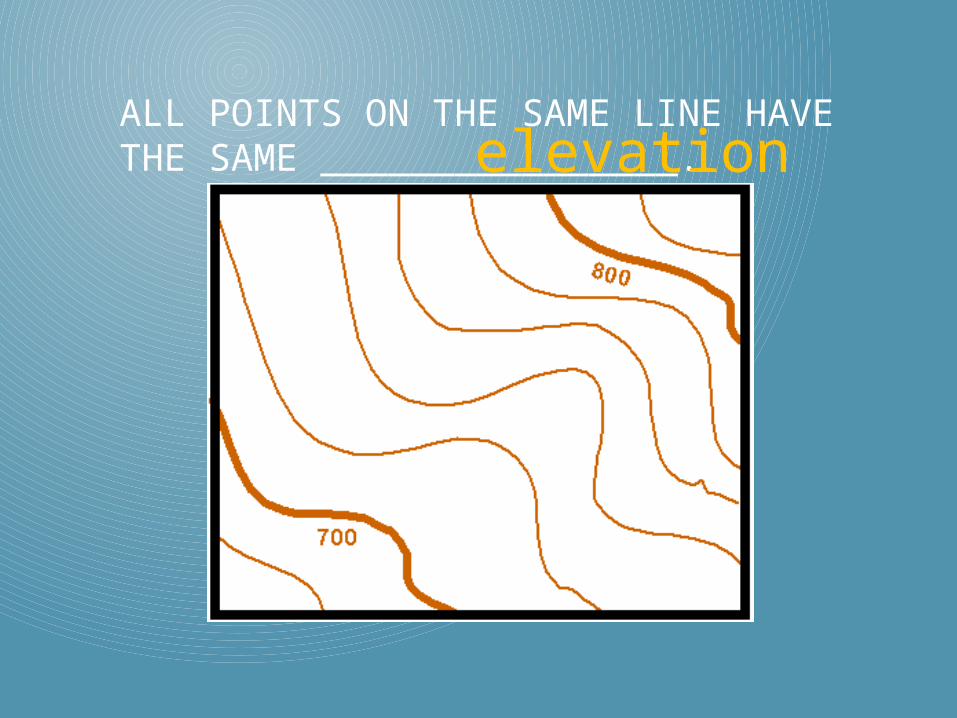
ALL POINTS ON THE SAME LINE HAVE THE SAME ________________.elevation
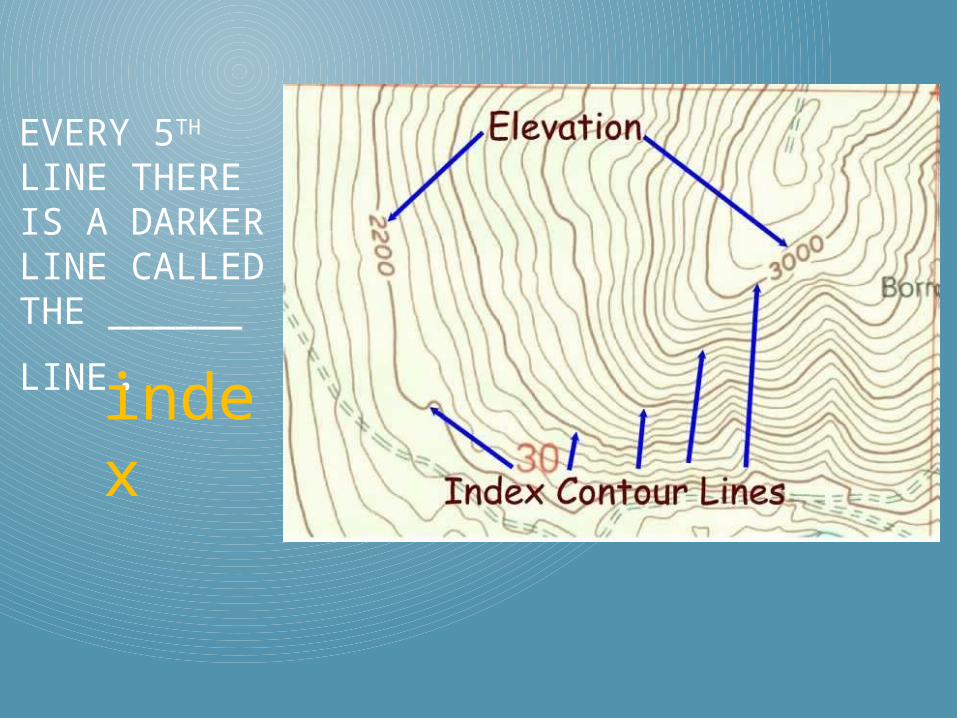
EVERY 5TH LINE THERE IS A DARKER LINE CALLED THE ______
LINE.index
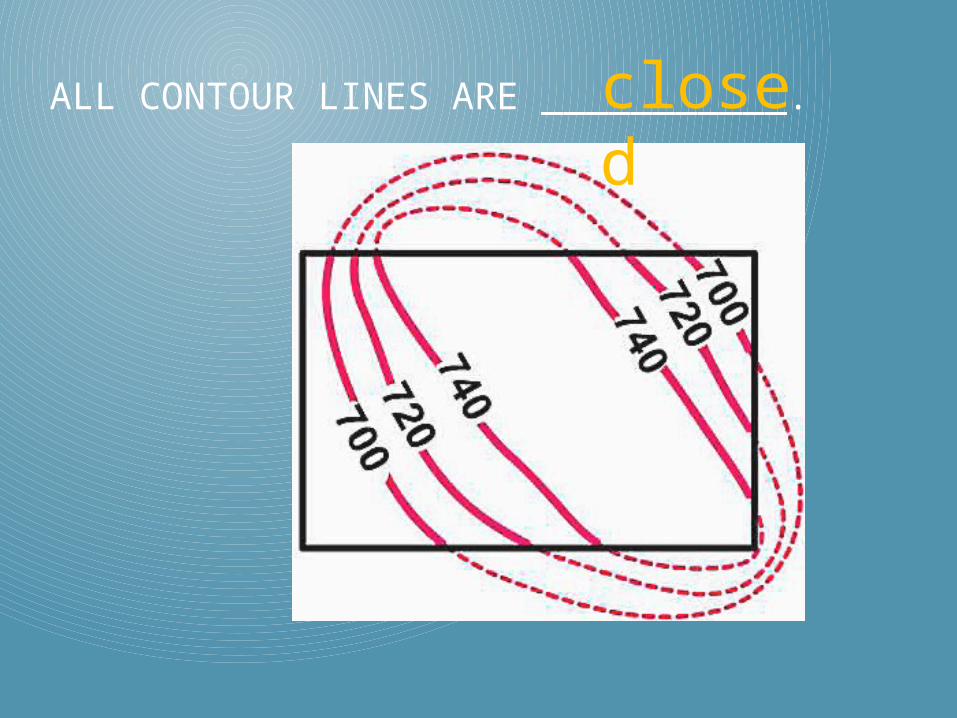
ALL CONTOUR LINES ARE ___________.closed
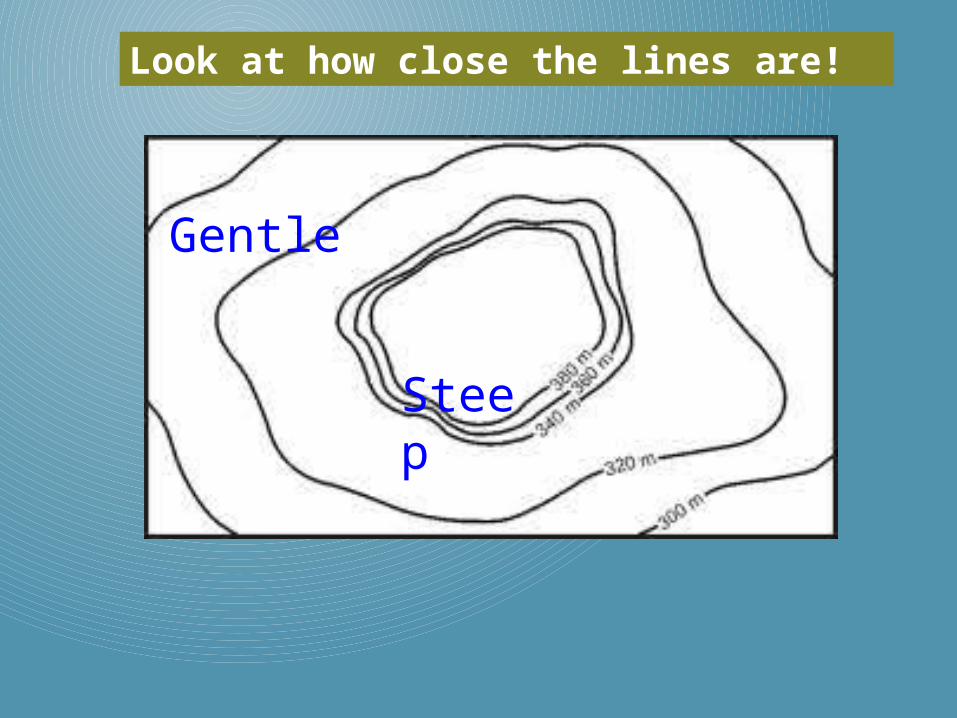
Look at how close the lines are!
Gentle
Steep
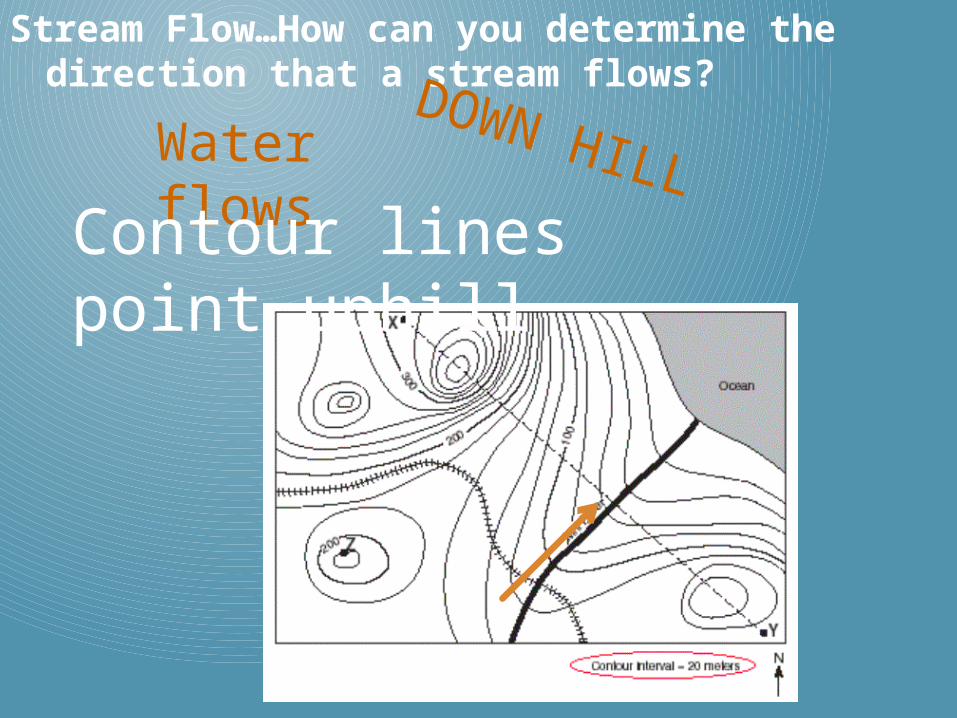
Stream Flow…How can you determine the direction that a stream flows?
Water flowsContour lines point
uphill
DOWN HILL
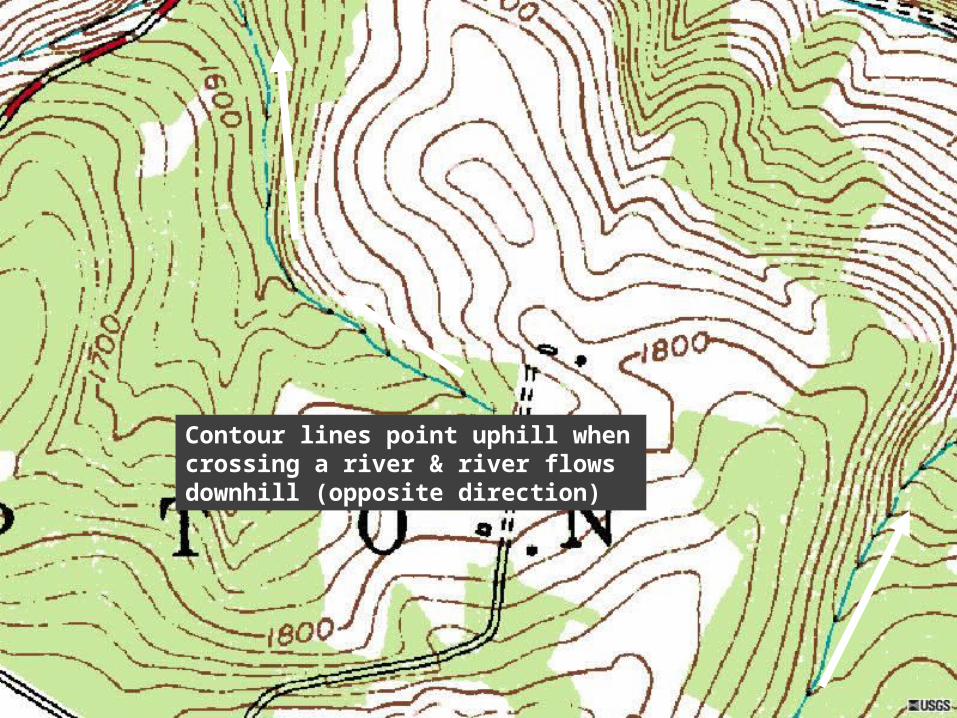
Contour lines point uphill when crossing a river & river flows downhill (opposite direction)
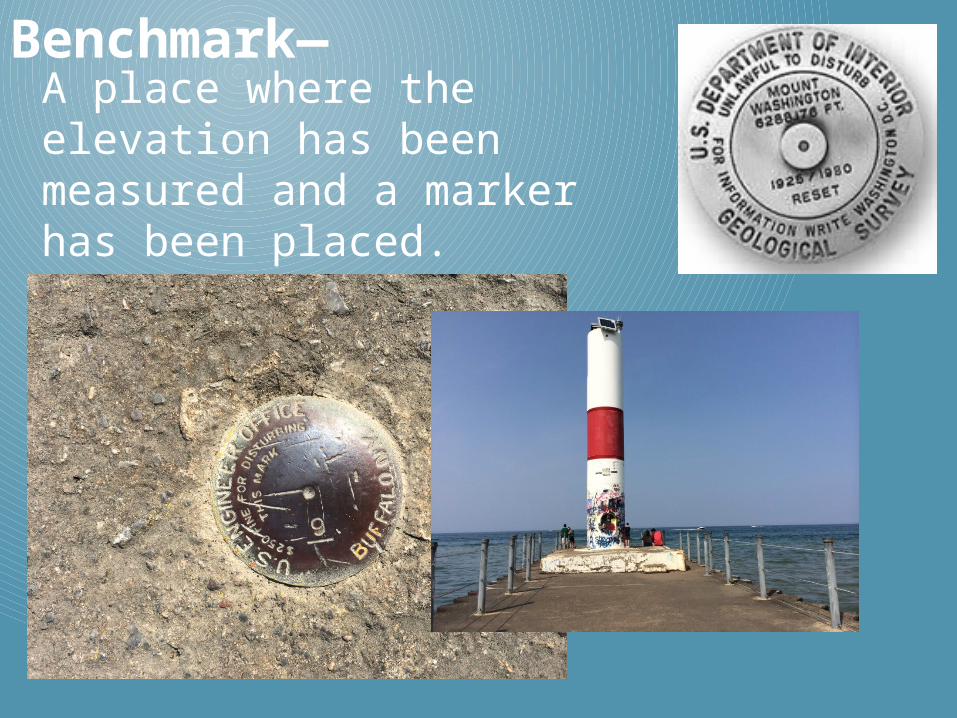
Benchmark—A place where the elevation has been measured and a marker has been placed.
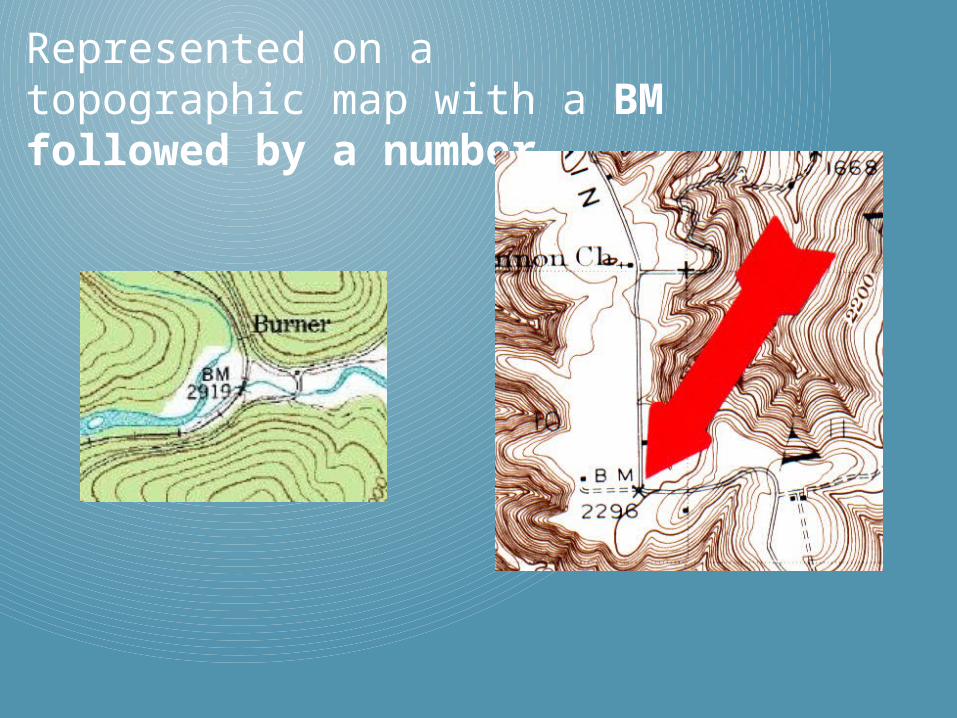
Represented on a topographic map with a BM followed by a number
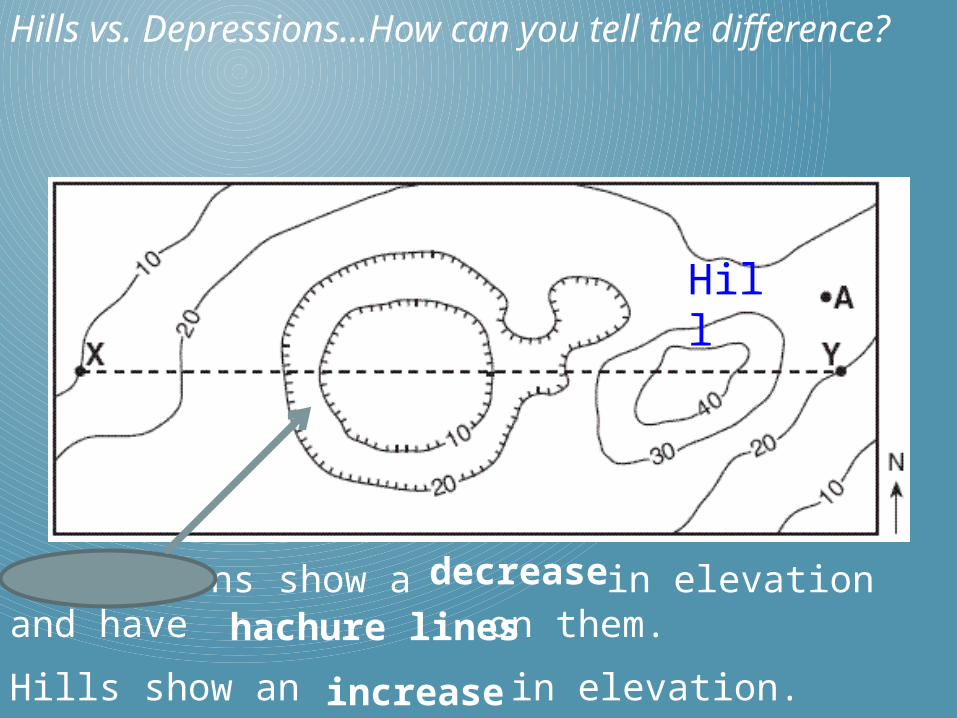
Hills vs. Depressions…How can you tell the difference?
Depressions show a in elevation and have on them.
Hills show an in elevation.
decrease
hachure lines
increase
Hill
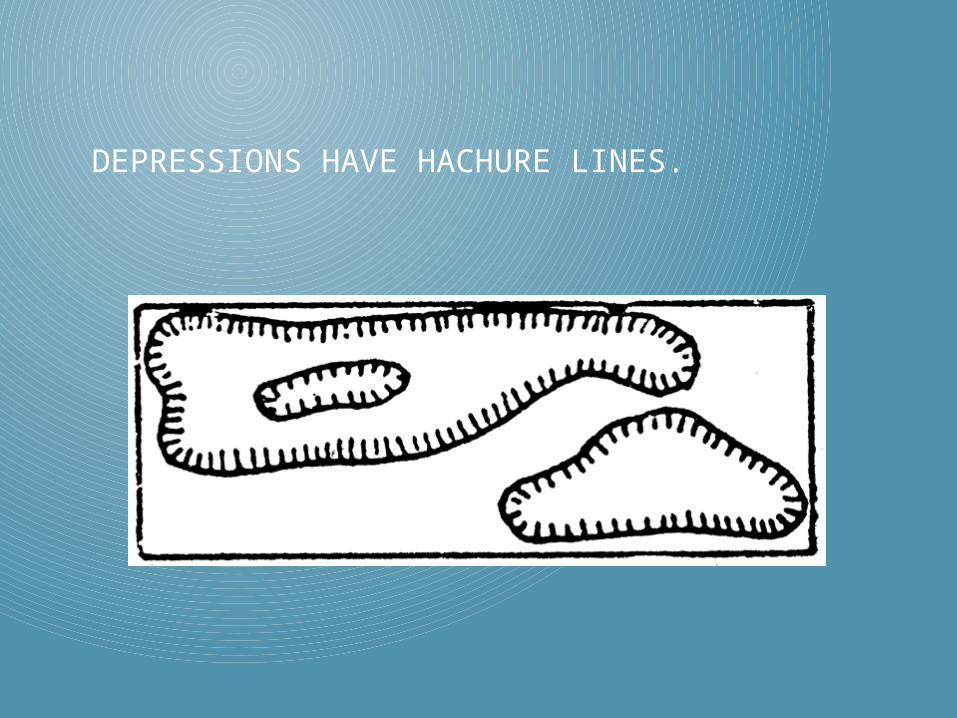
DEPRESSIONS HAVE HACHURE LINES.
Rules for depressions:• The first depression contour is the same elevation as the lowest regular contour line before it.
• The second depression contour (and so forth) is where the elevation DECREASES by the contour interval.
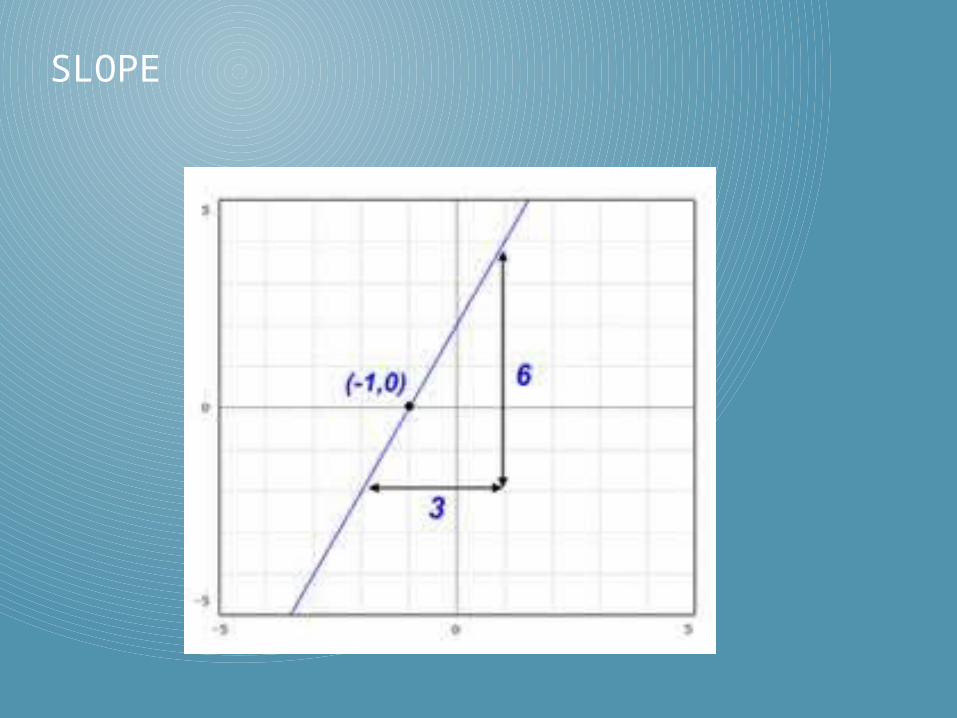
SLOPE
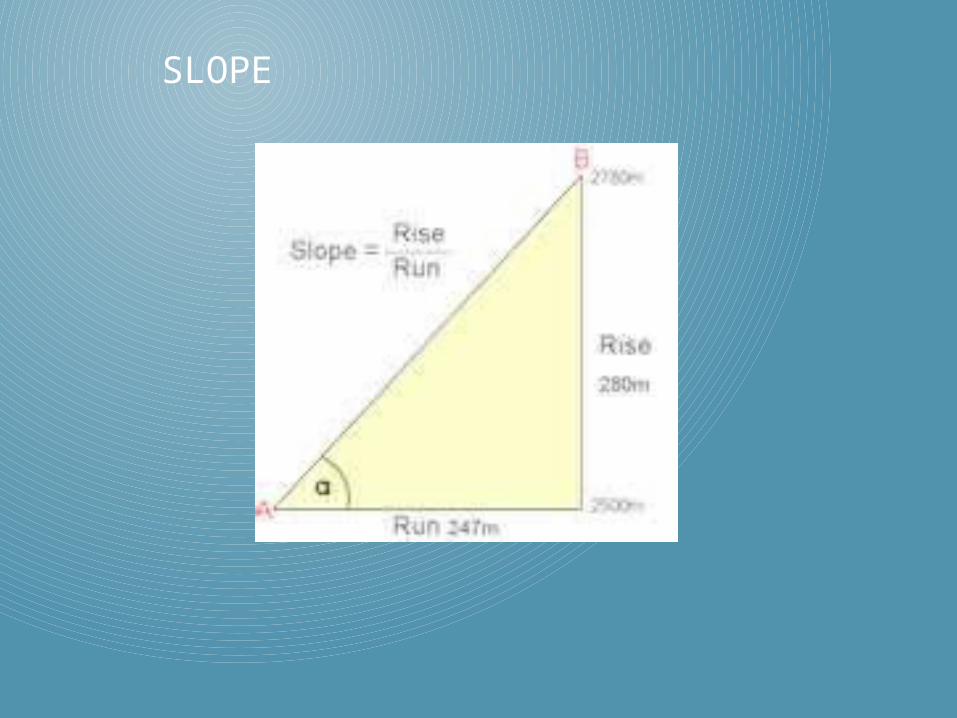
SLOPE
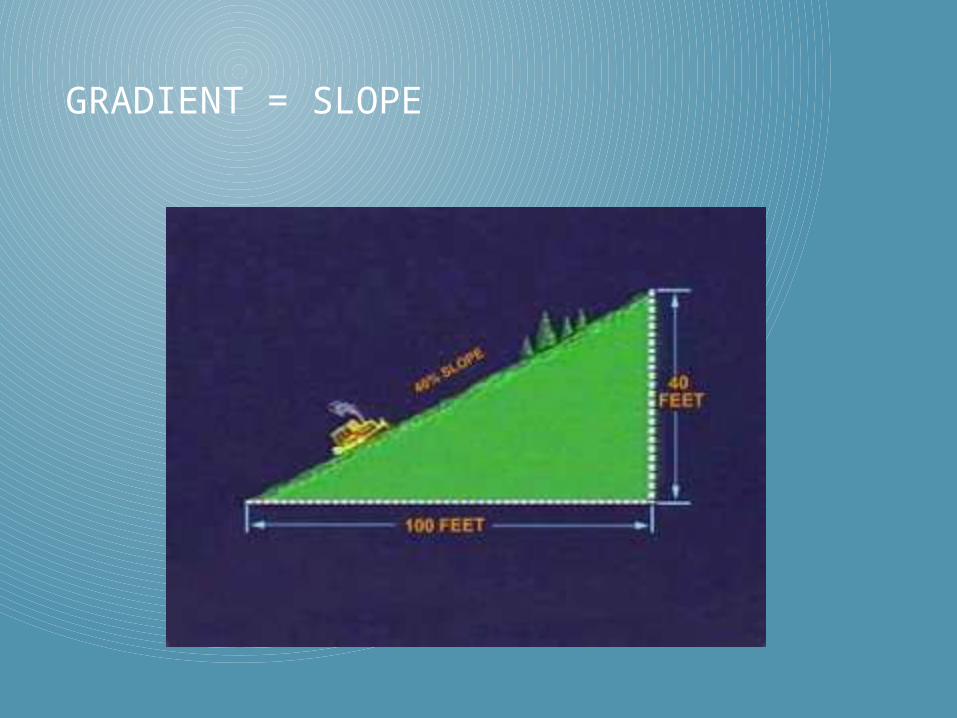
GRADIENT = SLOPE
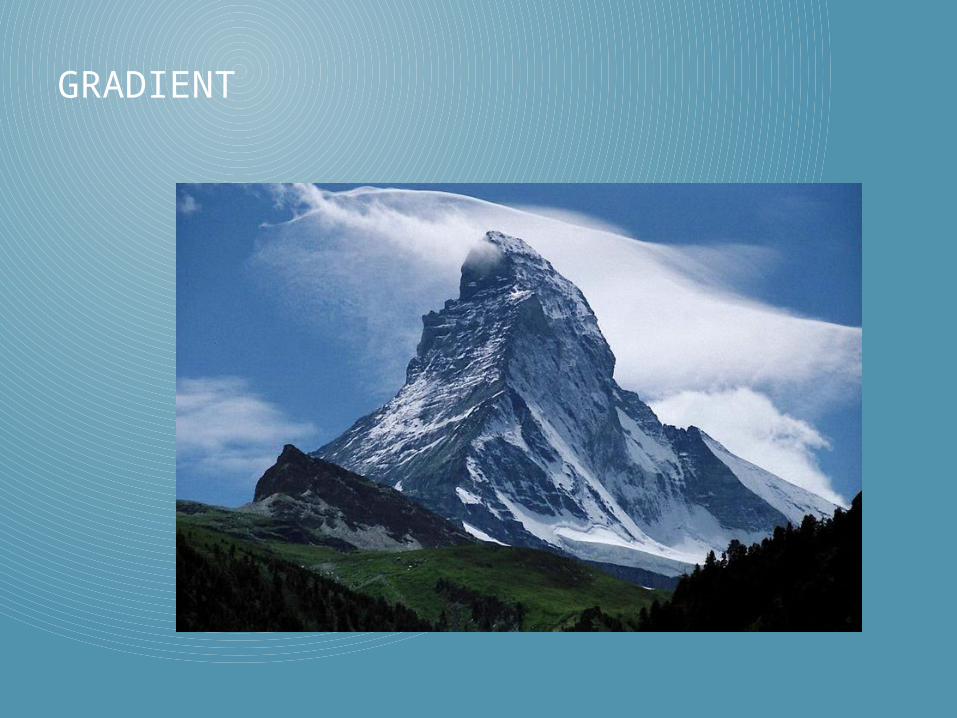
GRADIENT
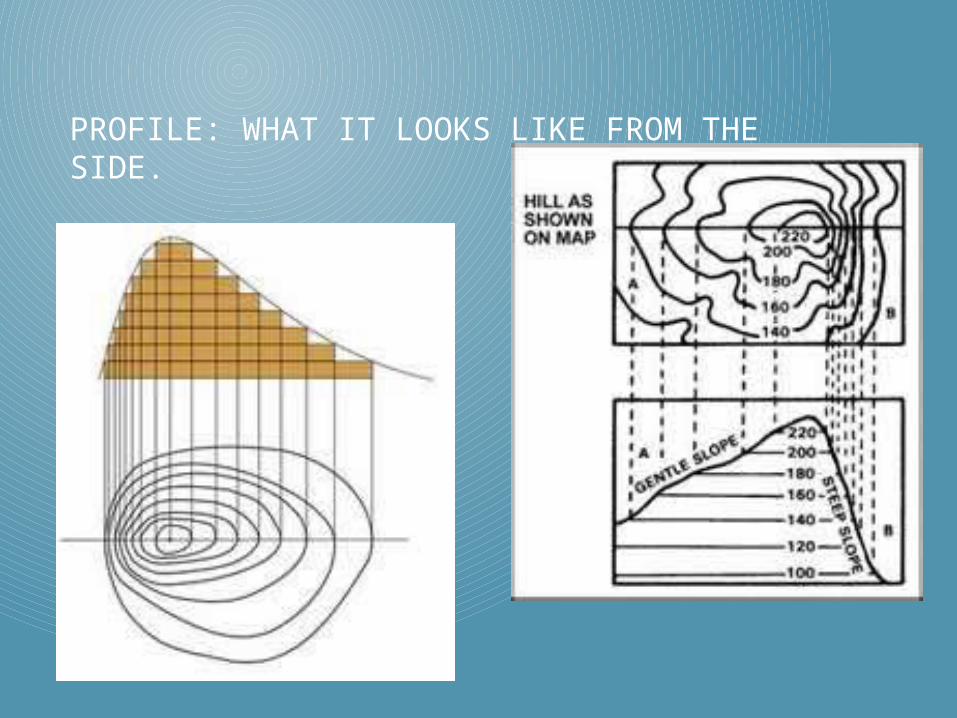
PROFILE: WHAT IT LOOKS LIKE FROM THE SIDE.

NEED PRACTICE DRAWING A PROFILE?
http://www.tasagraphicarts.com/activities/profile.html
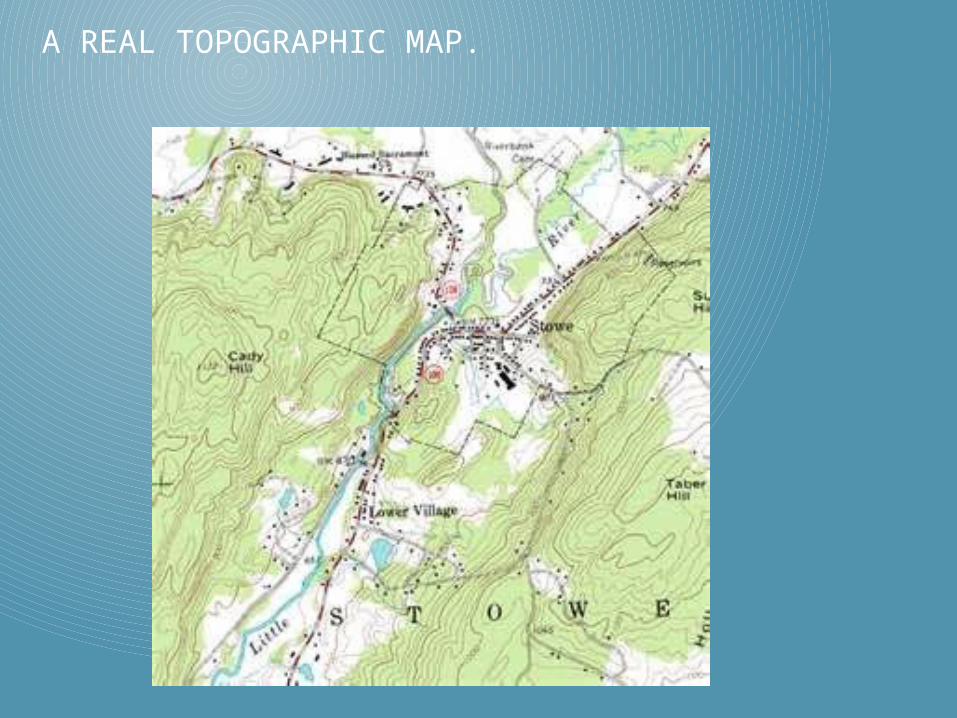
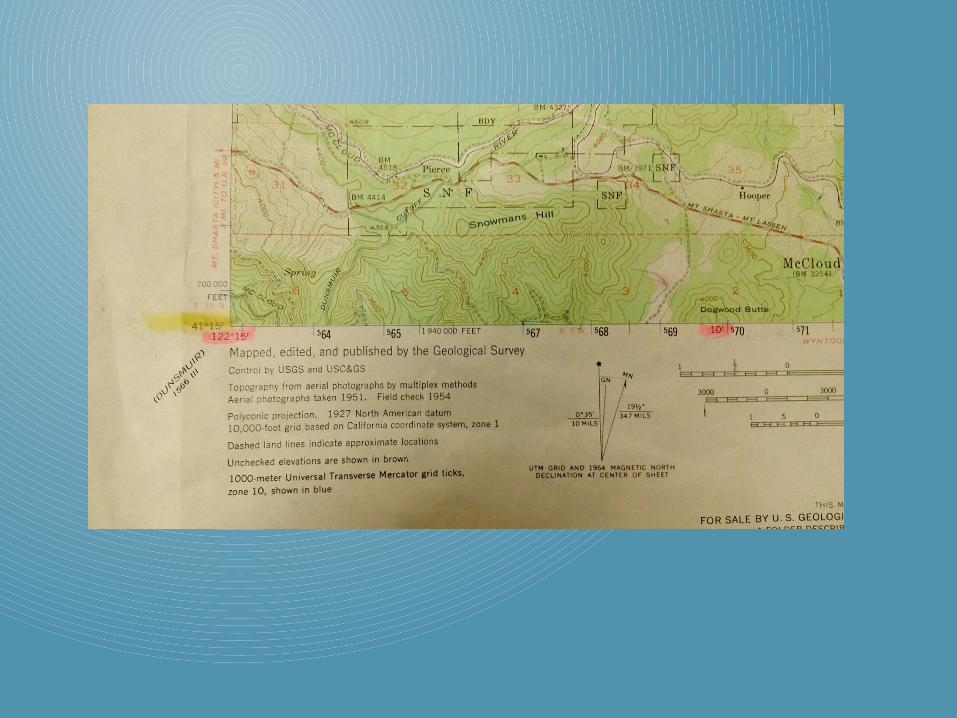
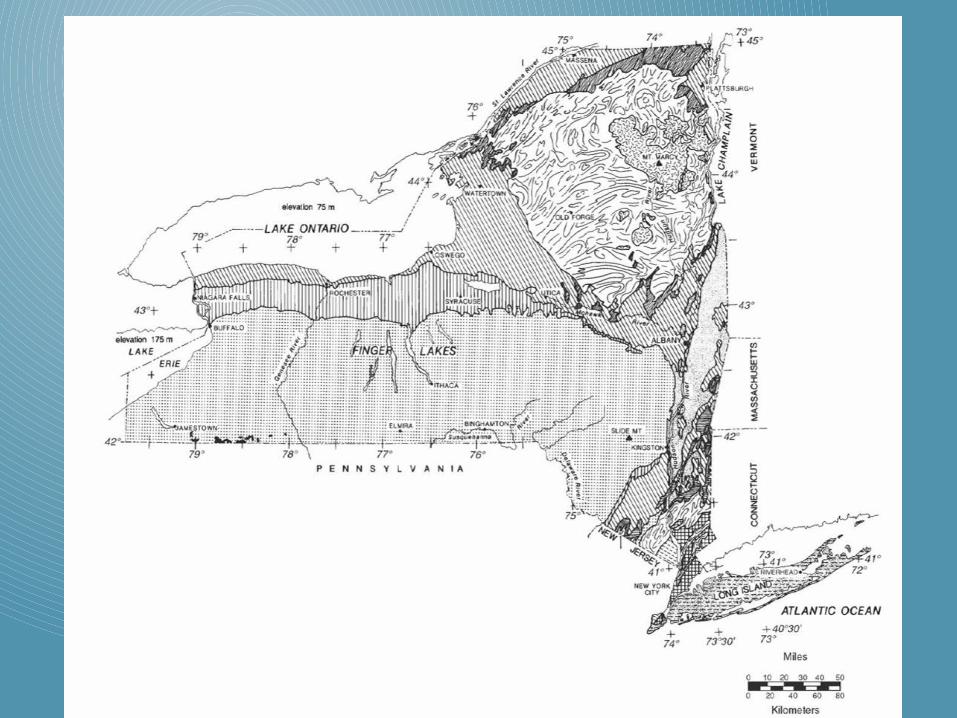
A REAL TOPOGRAPHIC MAP.
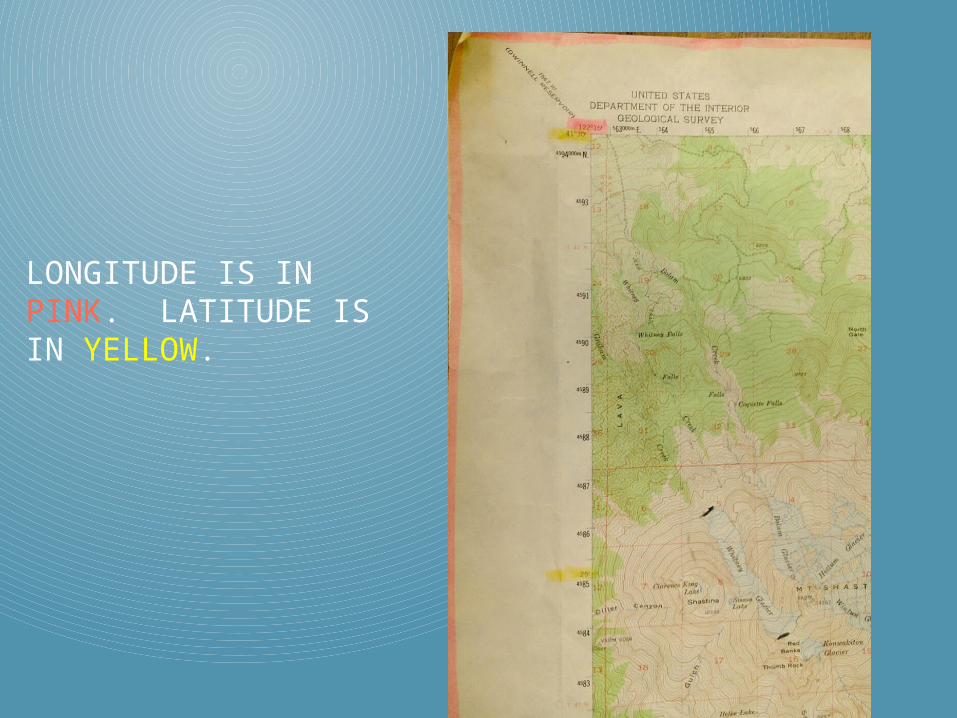
LONGITUDE IS IN PINK. LATITUDE IS IN YELLOW.