Embed Size (px)
Citation preview

Todd McElmurry [email protected] cbandco.com

Items we will discuss
• Pivot Tables• What Star Wars has taught me about Customer Support
• Keeping ourselves competitive• Technology changes

• Querying large data in many ways
• Subtotaling and aggregating numeric data, summarizing data by categories and subcategories, and creating custom calculations and formulas.
• Filtering, sorting, grouping, and conditionally formatting a specific subset of data to enable you focus on the information you want.
Pros of a Pivot Table:

• Drill Down Reporting
• Refreshed with Recent Data• You can setup a Pivot Table to query a database,
and by refreshing the data the entire report updates
• Formatting easily handles Data changes
• Flexibility
Pros of a Pivot Table:

• Difficulty in using the data• Making a Pivot Table can be done very quickly, but
not understanding the data can make the tool very intimidating
• Data Changes• Depending on how you setup your Pivot Tables
sometimes they may not refresh with current data
• Source Data formatting• Not only being familiar with your source data is
needed but cleaning it up is often needed.
Cons of a Pivot Table:

• Must have Excel• When sharing the data to another user that user will
need to have Excel to be able to access the workpaper where the Pivot Table is located in order to use it
• Limited Style Options
• PivotTables do not allow for Text to be entered in the data values area of the table.
Cons of a Pivot Table:

Pivot Table Notes
• The following notes have been made with Excel 2010 and Excel 2013– Creating a basic Pivot Table– Consolidating two worksheets into a Pivot Table– Combining multiple sheets/Workbooks into a Pivot Table (Excel 2013)

Creating a Basic Pivot Table
• Know your Data, make sure it is cleaned up and you know what you want from it. For the following example we will be creating a report showing the following:– Vendor ID– Invoice Credit/Debit– Invoice Gross– Invoice Year

Creating a Basic Pivot Table
• Select a field in the data we want to create the Pivot table from
• Choose Insert, Pivot Table• Select the Range or leave• the default selection.
• Set Destination to • “New Worksheet”

Creating a Basic Pivot Table
• Setup your report using Rows, Values, Column Labels and Report Filter (if needed)
• For our example:– Row Labels = Invoice year, Vendor ID– Values = Invoice Debit/Credit, Invoice Gross (may need to change Value Field Settings to SUM from Count)
• Now I can expand and collapse based on the year, and see my totals for Vendor ID as well as a Grand Total

Creating a Basic Pivot Table

Consolidating two Worksheets into one Pivot Table
• With this example I have a Site A and a Site B that I will create a consolidated Pivot Table of both locations.
• First you need to start the Pivot Table Wizard– Alt+D, P will launch the Pivot Table Wizard
Choose Multiple Consolidation ranges
Consolidating two Worksheets into one Pivot Table
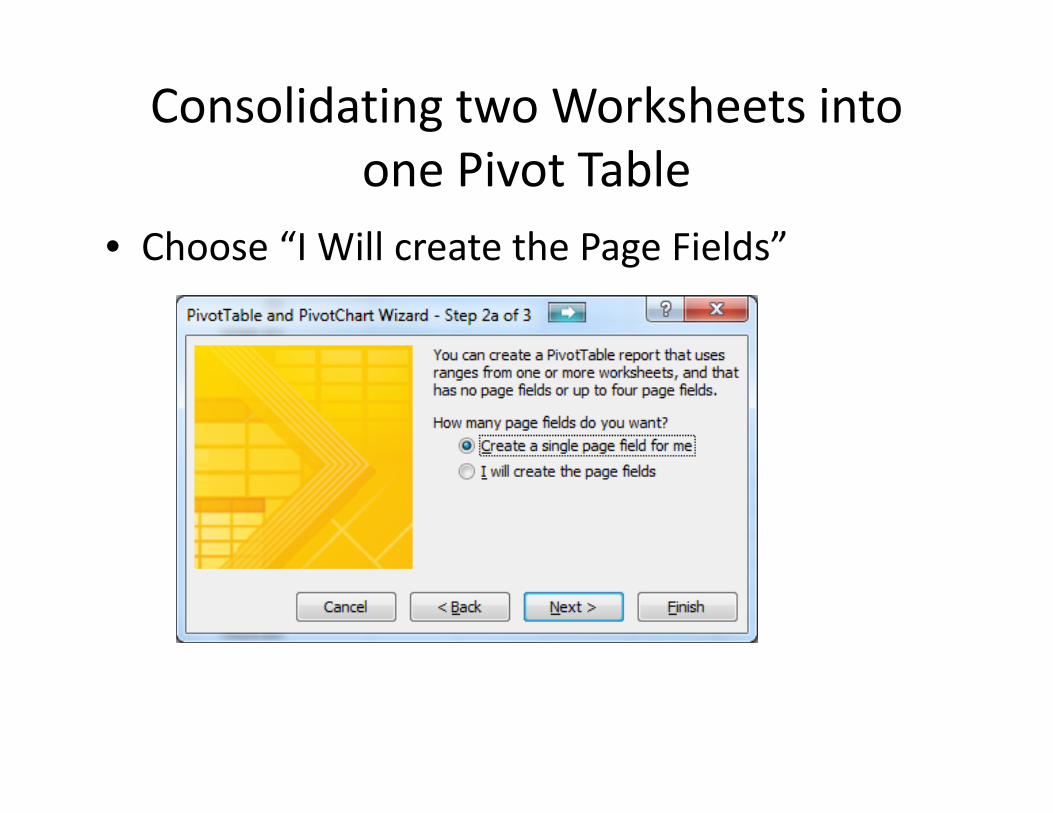
• Choose “I Will create the Page Fields”

Consolidating two Worksheets into one Pivot Table
• Choose the range from each sheet you want to add. Click Add after each range is selected.

Consolidating two Worksheets into one Pivot Table
• Select the number of Page Fields you want to add, I usually just use one so I can identify the groups. Give each Field a name. (i.e. SiteA, SiteB)
• To New Worksheet, and click Finish

Consolidating two Worksheets into one Pivot Table
• You can click on the drop down arrow next to each list in the PivotTable Field List to see what each one contains.
• Set the Column for the item you want to pull the Value from.
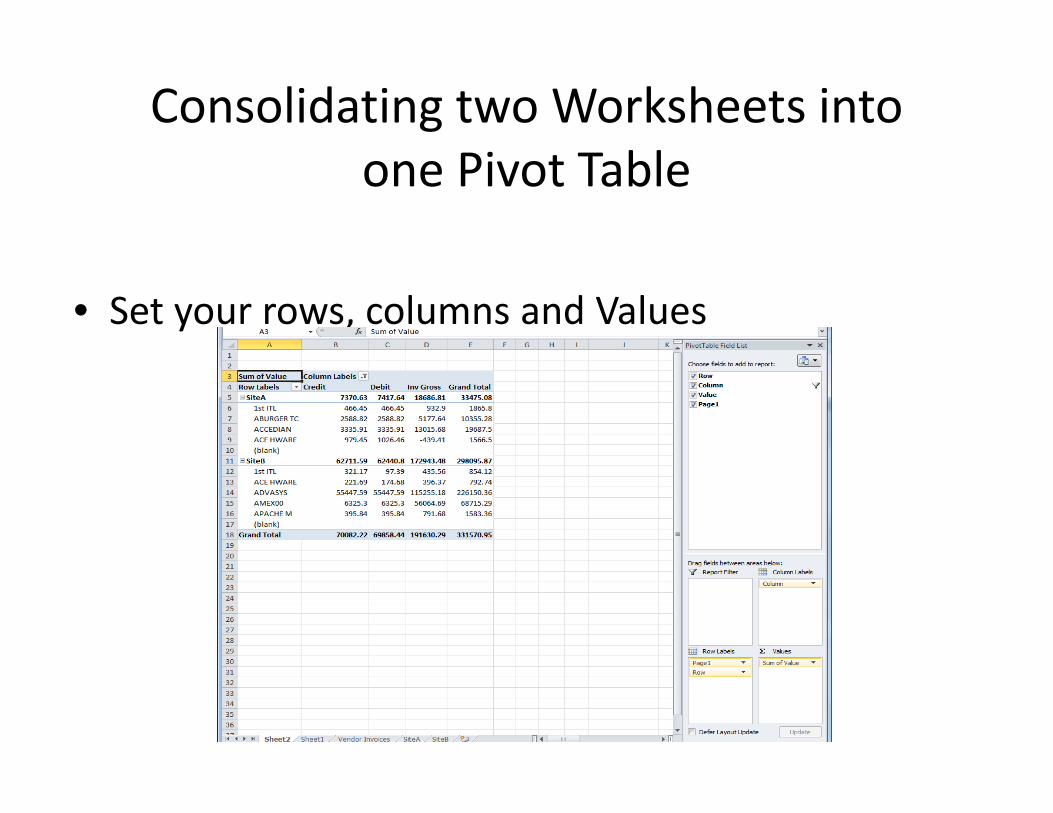
Consolidating two Worksheets into one Pivot Table
• Set your rows, columns and Values

Excel 2013 vs Multiple Sheets into a Pivot Table
Create Tables from your Data for better ability to see them in your PivotTable

Create Tables from your Data
• This makes the data easier to decipher on the Pivot Table sheet (Name the Tables accordingly)

Select one of the Tables, choose Insert Pivot Table
• Select “Add this Data to the Data Model” at the bottom of the Create PivotTable window

You will now need to create a relationship using a common field.
• On the PivotTable Sheet you will see ALL, under there you will see the Tables listed.
• Click on Relationships to create a relationship with the Tables.

Create the Relationship using a common column from both Sheets/Workbooks

The Below Example pulls data from two separate sheets to create one report within the Pivot Table.
• Now that you have a relationship you can set your Rows, Columns, Values and Report Filter from parts of all Tables.

What STAR WARS taught me about Customer Support

What Master Yoda can teach us about Customer Support
• “Do or do not, there is notry….”– Customers never want tohear the word “try”, theywant to hear you can solvethe problem; find out away to solve it; or just takeresponsibility for it.

What Master Yoda can teach us about Customer Support
• “Anger, Fear, Aggression.The Dark Side of the Forceare they.”– Some of the most importantCustomer Service training isthe ability to handle an upsetcustomer. A calm, proactiveresponse to an upsetcustomer versus an instinctivereactive one turns a volatileindividual into a satisfied, lifelong advocate.

What Master Yoda can teach us about Customer Support
• “Difficult to see, always inmotion is the future....”– In Customer Service, as inbusiness, we are alwayslooking ahead to newchannels and trends.Organizations must nowdevelop their support processand choose solutions that arefluid and flexible to adjust torapid changes rather thanplan for every 5 to 10 years.

What Master Yoda can teach us about Customer Support
• “You must unlearn what youhave learned.”– It’s easy to want to takeprocesses and habits fromother companies or roles, butwe must sometimes unlearnold habits and look to whatwe can learn from experts,peers, mentors and ourcustomers. Keep an openmind and be open to changeand learning.
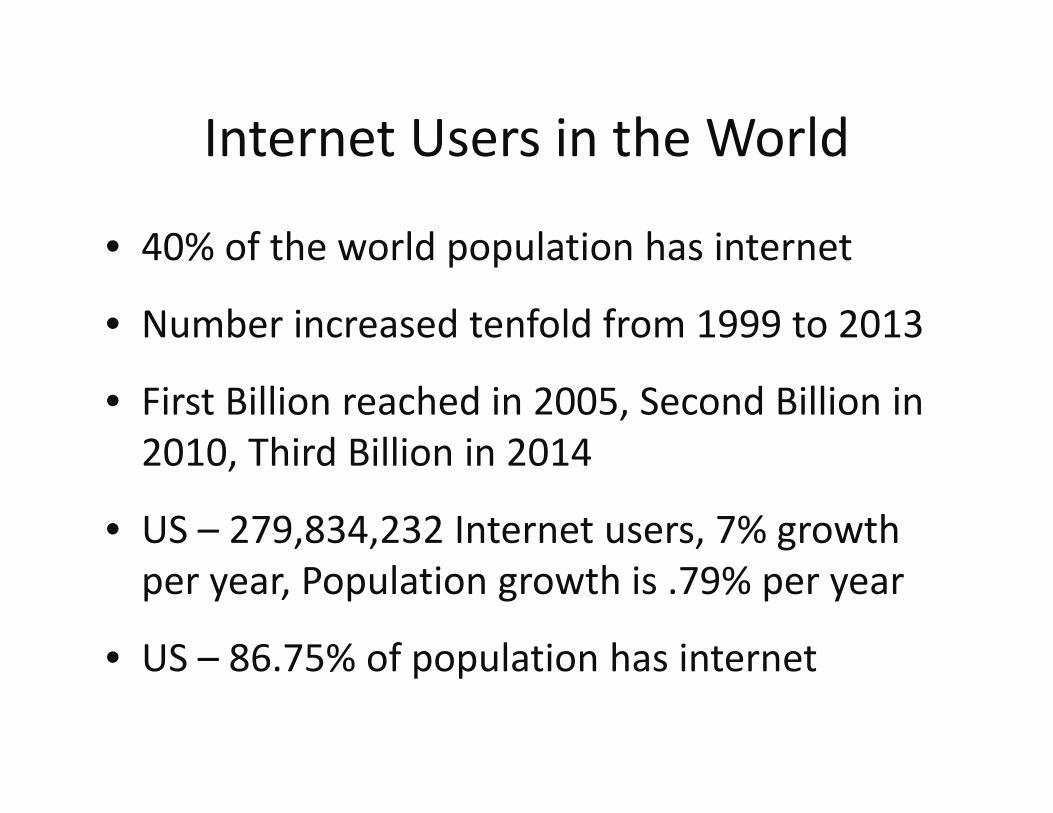
• 40% of the world population has internet
• Number increased tenfold from 1999 to 2013
• First Billion reached in 2005, Second Billion in 2010, Third Billion in 2014
• US – 279,834,232 Internet users, 7% growth per year, Population growth is .79% per year
• US – 86.75% of population has internet
Internet Users in the World

Broadband in Texas

WHAT IS DRIVING YOUR CUSTOMERS
• Access to Entertainment (Video, Radio, Podcasts, Streaming, etc.)
• Technology – Smart Homes, Smart Phones, Smart Watches, Smart TV’s, etc.
• Entrepreneurs need to stay competitive
• Ability to run a business successfully from Rural
• Staying Connected 24/7

WHAT IS DRIVING YOUR BUSINESS
• Profit• Staying Connected• Staying Competitive
• Keeping your Customers for life• You have to work harder now to be isolated than to be connected. Use resources available to keep in touch with your customers and their needs.
• Social Media, Support follow up emails, etc.

Stay on Target….Stay on target…
• Access to the clients is our main focus, right? Rural is finding a way to stay competitive and our clients are benefiting from that.
– FTTH
– DOCSIS 3.1
– Microcells, Distributed Antenna Systems (DAS), and picocells

Stay on Target….Stay on target…
• DSL is not dead; VDSL, NDSL, and eventually GDSL are finding ways to push the broadband strength to the consumer
• Stay ahead of the organic demands
– SmartPhones, SmartCars, SmartHomes, SmartWatches
– On Demand Services

Computing is becoming an accessory
• IOS – Apple iWatch
• Android Watches
• Neptune – Watch is the hub

Laptop Battery Life Tablet Battery Life
Lenovo ThinkPad T450s
15h 26m LG G Pad 10.1 13h 55m
Toshiba Protégé Z20t 14h 37m Lenovo Yoga 13h 1m
MacBook Air 13” 12h 20m Apple iPad Mini 2 11h 6m
MacBook Air 13” w/ Retina Display
12h 4m Amazon Fire HDX 8.9 10h 19m
Dell XPS 13 (non‐touch)
11h 42m Dell Venue 11 Pro 8h
Tablets vs LaptopsTop Battery Life in the current Market

USB 3.1/USB C Cabling

• No more worrying about the orientation when plugging in
• Faster Transfer rates (Gen1 –10GB, Gen2 – 20GB)
• Connected devices can be host, peripheral or both at the same time
• Smaller port means thinner/smaller devices
• Any device can charge another (tablet charges your phone, powers your monitor or vice verse

• Data and Video can be sent across more easily. (One cable to charge, and send video from smart phone to computer, etc.)
• Media Agnostic USB (MA USB)• Allow communication
using USB protocol over a wide range of physical communication media (WiFi, WiGig, etc.)
• Gigabit transfers wirelessly

Available as a free Upgrade for most Windows 7 and Windows 8 users on July 29, 2015 through the Windows Updates Service.
Major ChangesSay Goodbye to:
Windows Media CenterWindows 7 desktop gadgetsHearts
Early upgrades will have to have a separate playback software to watch DVD’s. Later updates will provide a DVD playback feature.
Updates are automatic with Home Users. Pro and Enterprise can still defer updates.

Available as a free Upgrade for most Windows 7 and Windows 8 users on July 29, 2015 through the Windows Updates Service.
System RequirementsPC’s and Tablets:
32 Bit 64Bit
1GHz Processor or SoC* 1GHz Processor or SoC
1GB RAM 2GB RAM
16GB available Space 20GB available Space
DirectX 9 or later video card DirectX 9 or later video card1024 X 600 display 1024 X 600 display
*SoC – System on a Chip

Windows 10• Start Menu/Start Screen can be interchanged
– Items pinned to the Start Menu now show up to the right of the menu when you press Start
– These can be turned off to allow for a clean Start menu as you had in Windows 7
• Ability to extend the task bar across multiple desktops is still available as it was in Windows 8, so you can have applications in the extended task bar for only what you are working on in that window without 3rd party applications needed

Windows 10
• Windows 8 Features are still there (Charm Bar, etc.)
• Additional Desktops
– Desktop environment that is not affected by other desktop environment
– If you accidentally close an additional desktop the applications will immediately come to the primary

Thank You!!
(903) 758‐0734 [email protected] cbandco.com
Todd C. McElmurryNetwork Administrator
Curtis Blakely & Co., PC2403 Judson Road
Longview, Texas 75608(903) 758‐0734
www.cbandco.com