Embed Size (px)
Citation preview

NOAA Data Report ERL PMEL-67
TOGA-TAO Shipboard ADCP Data Report,
1991–1995
Eric S. Johnson1 and Patricia E. Plimpton2
1Earth and Space Research1910 Fairview Ave. E.Seattle, WA 98102
2NOAA/Pacific Marine Environmental Laboratory7600 Sand Point Way NESeattle, WA 98115
May 1999
Contribution 2086 from NOAA/Pacific Marine Environmental Laboratory

NOTICE
Mention of a commercial company or product does not constitute an endorsement byNOAA/ERL. Use of information from this publication concerning proprietary products or the
tests of such products for publicity or advertising purposes is not authorized.
Contribution No. 2086 from NOAA/Pacific Marine Environmental Laboratory
For sale by the National Technical Information Service, 5285 Port Royal RoadSpringfield, VA 22161
ii

Contents iii
Contents
1. Introduction . . . . . . . . . . . . . . . . . . . . . . . . . . . . 12. Data Preparation . . . . . . . . . . . . . . . . . . . . . . . . . 23. Conclusion . . . . . . . . . . . . . . . . . . . . . . . . . . . . . 34. Acknowledgments . . . . . . . . . . . . . . . . . . . . . . . . . 35. References . . . . . . . . . . . . . . . . . . . . . . . . . . . . . 3Figures and Tables . . . . . . . . . . . . . . . . . . . . . . . . . . . 5
List of Figures
1a Figures 1a–f show the locations of fully navigated ADCP data foreach cruise by latitude and longitude . . . . . . . . . . . . . . . . . . 7
1b Same as Figure 1a. . . . . . . . . . . . . . . . . . . . . . . . . . . . . 81c Same as Figure 1a. . . . . . . . . . . . . . . . . . . . . . . . . . . . . 91d Same as Figure 1a. . . . . . . . . . . . . . . . . . . . . . . . . . . . . 101e Same as Figure 1a. . . . . . . . . . . . . . . . . . . . . . . . . . . . . 111f Same as Figure 1a. . . . . . . . . . . . . . . . . . . . . . . . . . . . . 122a Figures 2a-k show sections of zonal and meridional velocity from each
roughly meridional section of cruise track . . . . . . . . . . . . . . . 132b Same as Figure 2a. . . . . . . . . . . . . . . . . . . . . . . . . . . . . 142c Same as Figure 2a. . . . . . . . . . . . . . . . . . . . . . . . . . . . . 152d Same as Figure 2a. . . . . . . . . . . . . . . . . . . . . . . . . . . . . 162e Same as Figure 2a. . . . . . . . . . . . . . . . . . . . . . . . . . . . . 172f Same as Figure 2a. . . . . . . . . . . . . . . . . . . . . . . . . . . . . 182g Same as Figure 2a. . . . . . . . . . . . . . . . . . . . . . . . . . . . . 192h Same as Figure 2a. . . . . . . . . . . . . . . . . . . . . . . . . . . . . 202i Same as Figure 2a. . . . . . . . . . . . . . . . . . . . . . . . . . . . . 212j Same as Figure 2a. . . . . . . . . . . . . . . . . . . . . . . . . . . . . 222k Same as Figure 2a. . . . . . . . . . . . . . . . . . . . . . . . . . . . . 23
List of Tables
1 The dates (day-month-year) of the southernmost, equatorial, andnorthernmost data included in each plotted section. . . . . . . . . . 6

iv Contents
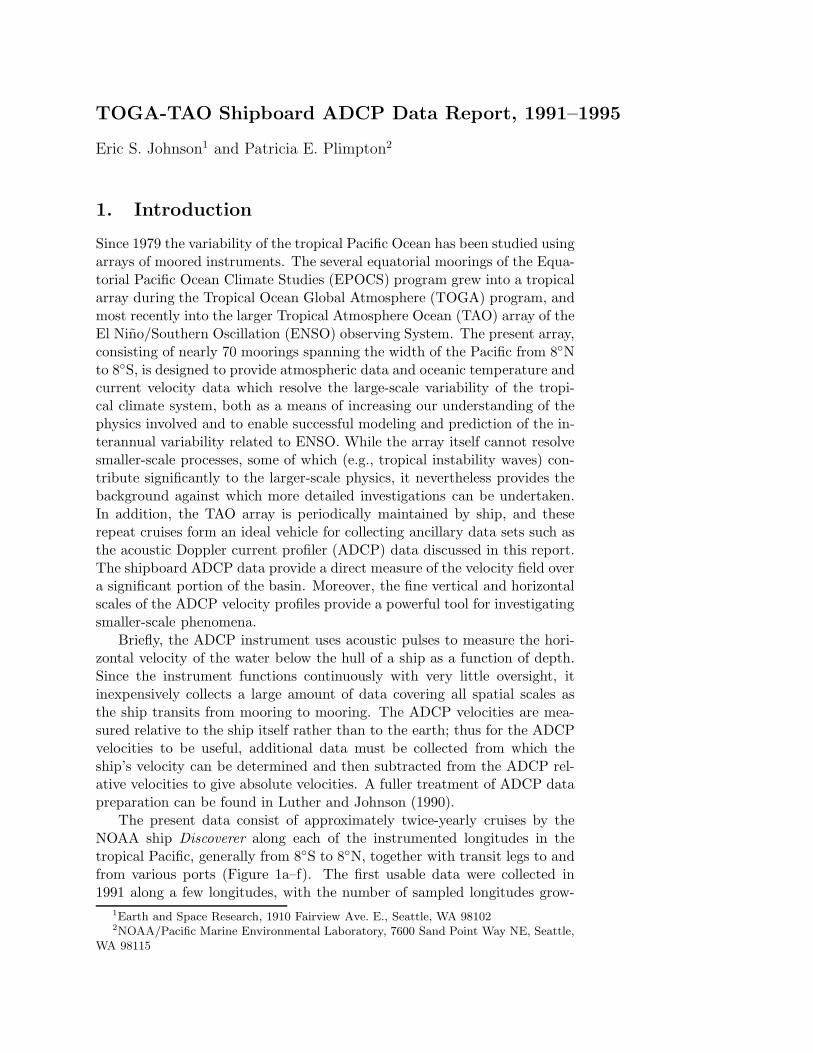
TOGA-TAO Shipboard ADCP Data Report, 1991–1995
Eric S. Johnson1 and Patricia E. Plimpton2
1. Introduction
Since 1979 the variability of the tropical Pacific Ocean has been studied usingarrays of moored instruments. The several equatorial moorings of the Equa-torial Pacific Ocean Climate Studies (EPOCS) program grew into a tropicalarray during the Tropical Ocean Global Atmosphere (TOGA) program, andmost recently into the larger Tropical Atmosphere Ocean (TAO) array of theEl Nino/Southern Oscillation (ENSO) observing System. The present array,consisting of nearly 70 moorings spanning the width of the Pacific from 8◦Nto 8◦S, is designed to provide atmospheric data and oceanic temperature andcurrent velocity data which resolve the large-scale variability of the tropi-cal climate system, both as a means of increasing our understanding of thephysics involved and to enable successful modeling and prediction of the in-terannual variability related to ENSO. While the array itself cannot resolvesmaller-scale processes, some of which (e.g., tropical instability waves) con-tribute significantly to the larger-scale physics, it nevertheless provides thebackground against which more detailed investigations can be undertaken.In addition, the TAO array is periodically maintained by ship, and theserepeat cruises form an ideal vehicle for collecting ancillary data sets such asthe acoustic Doppler current profiler (ADCP) data discussed in this report.The shipboard ADCP data provide a direct measure of the velocity field overa significant portion of the basin. Moreover, the fine vertical and horizontalscales of the ADCP velocity profiles provide a powerful tool for investigatingsmaller-scale phenomena.
Briefly, the ADCP instrument uses acoustic pulses to measure the hori-zontal velocity of the water below the hull of a ship as a function of depth.Since the instrument functions continuously with very little oversight, itinexpensively collects a large amount of data covering all spatial scales asthe ship transits from mooring to mooring. The ADCP velocities are mea-sured relative to the ship itself rather than to the earth; thus for the ADCPvelocities to be useful, additional data must be collected from which theship’s velocity can be determined and then subtracted from the ADCP rel-ative velocities to give absolute velocities. A fuller treatment of ADCP datapreparation can be found in Luther and Johnson (1990).
The present data consist of approximately twice-yearly cruises by theNOAA ship Discoverer along each of the instrumented longitudes in thetropical Pacific, generally from 8◦S to 8◦N, together with transit legs to andfrom various ports (Figure 1a–f). The first usable data were collected in1991 along a few longitudes, with the number of sampled longitudes grow-
1Earth and Space Research, 1910 Fairview Ave. E., Seattle, WA 981022NOAA/Pacific Marine Environmental Laboratory, 7600 Sand Point Way NE, Seattle,
WA 98115

2 Johnson and Plimpton
ing through the years along with the TAO array (e.g., McPhaden et al.,1998). Depth coverage extends from 19 m down to around 300 m, depend-ing on acoustic conditions. Navigation data consist of Global PositioningSystem (GPS) fixes and gyrocompass headings. The ADCP installationon the Discover was plagued by interference from bubbles entrained in theship’s boundary layer at higher speeds. Installation of a fairing to divert theboundary layer around the transducer reduced the problem to an intermit-tent nuisance.
2. Data Preparation
Preparation of the PMEL data consists of three stages: the timing adjust-ment, the navigation of the data, and the calibration of the ADCP. Each1-minute ADCP ensemble is recorded with a GMT timing mark, but thesetimes are derived from the recording computer’s internal clock, which issubject to a constant drift and to operator resets. The ADCP time marksare corrected to true GMT using the integrally recorded GPS navigationalfixes that include accurate GMT time. At the same time the measured rel-ative velocities are corrected for the true speed of sound at the transducer,determined using the water temperature as measured by the instrument’sthermistor and an assumed salinity of 35 psu. In situations where the ther-mistor was not working the speed-of-sound correction cannot be carried out,but its cruise-averaged value and the broadest scales of its spatial variabilityare necessarily incorporated in the time-dependent instrument calibrationdetailed below.
After the ADCP time marks are corrected the ship’s velocity is deter-mined using the ancillary GPS fixes. The resulting ship’s velocities aresubtracted from the ADCP relative velocities to give absolute water veloci-ties in a deep reference layer (139–195 m), chosen to minimize the expectedspatial variability of currents without severely taxing the instrument’s depthrange. Both computer and hand editing of the resulting velocities are usedto eliminate obviously bad fixes, whereupon the data is renavigated untilresults are satisfactory.
The resulting reference layer velocities are used to calibrate the ADCPinstrument for heading offsets and gain errors. The data are searched bycomputer for hour-long intervals containing large variations in ship’s veloc-ity. These intervals are used to estimate the heading bias and gain error ofthe instrument as in Joyce (1989). The calibrations are edited for obviousoutliers, filtered heavily in time to remove time scales shorter than 1.6 days,and fed back into a final, clean navigation of the data.
Routine navigational noise is then further reduced by time filtering theclean reference velocities to eliminate periods shorter than 2 hours (timescales shorter than 20 minutes), corresponding to space scales shorter than8 km when the ship is underway at 12 knots. Note that this filtering cannotbe done at any earlier stage of data preparation since the ADCP relativevelocities and ship velocities contain large, rapidly varying signals associ-ated with ship maneuvers. Filtering such maneuvers would aliase differences

TOGA-TAO Shipboard ADCP Data Report, 1991–1995 3
in sampling rate and coverage between the ADCP and the GPS data intospurious velocities, as well as eliminating the possibility of instrument cali-bration. Once the filtered reference level velocity is determined the velocitiesat other depths are built up using the observed shears in each profile; theresults are the ADCP absolute velocities.
Some cleaning of the data takes place during the navigational process:data that cannot produce reasonable reference layer velocities are flagged asunnavigable. However, additional sources of noise and error, such as the bub-bles while underway and lowered instruments while on station, are presentin the data. Users must be aware of such potential limitations and test forthose that might affect their particular analysis. The data are archived inoriginal depth bins rather than re-gridded, so depths are not corrected forthe small (∼2%) difference between nominal and local speed of sound. Ve-locity, AGC, and percent good are recorded at all depths: the shallowest binis centered at 19 m depth, with each succeeding bin located 8 m deeper. Thecombination of 8 m bin width and 8 m pulse length results in a triangularresponse function spanning 16 m depth. Thus the response functions of thesuccessive depth bins overlap by 50%.
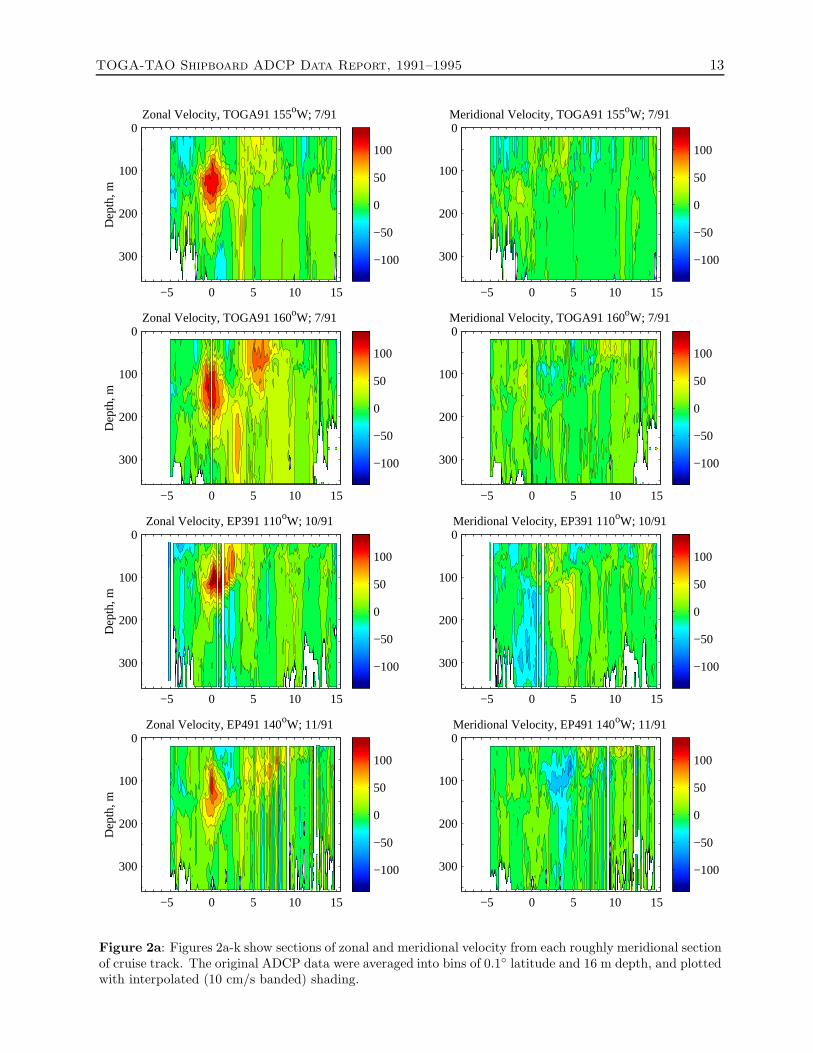
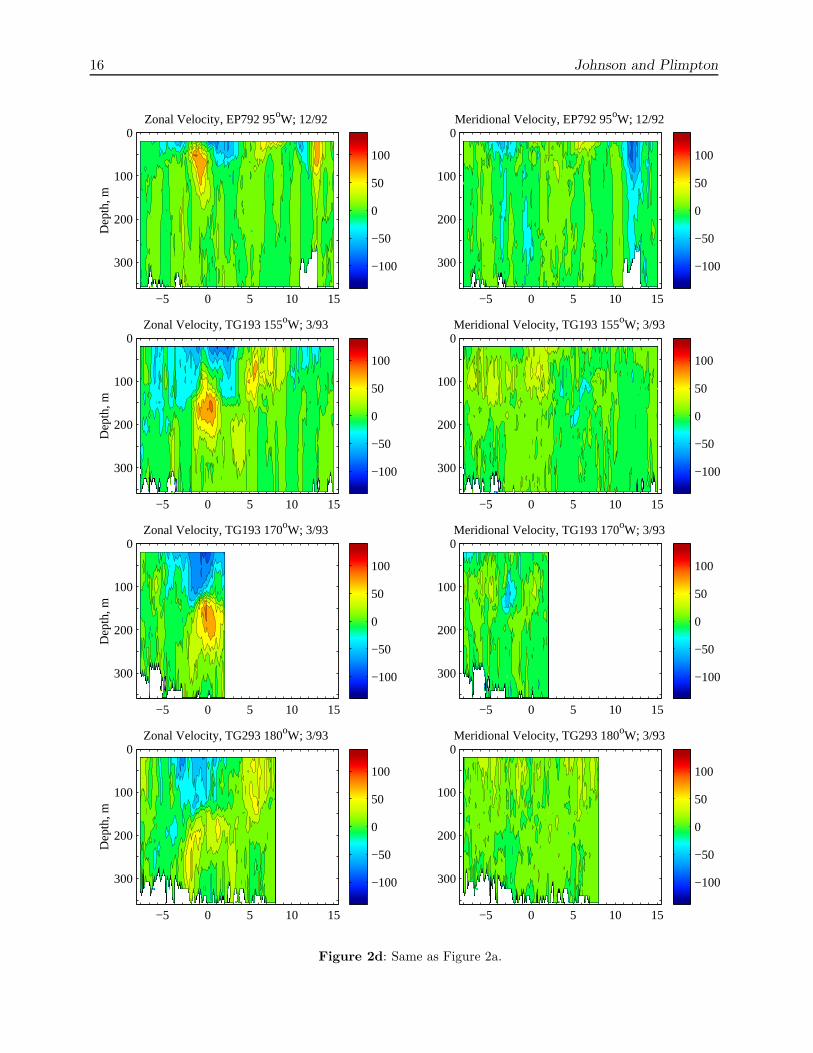
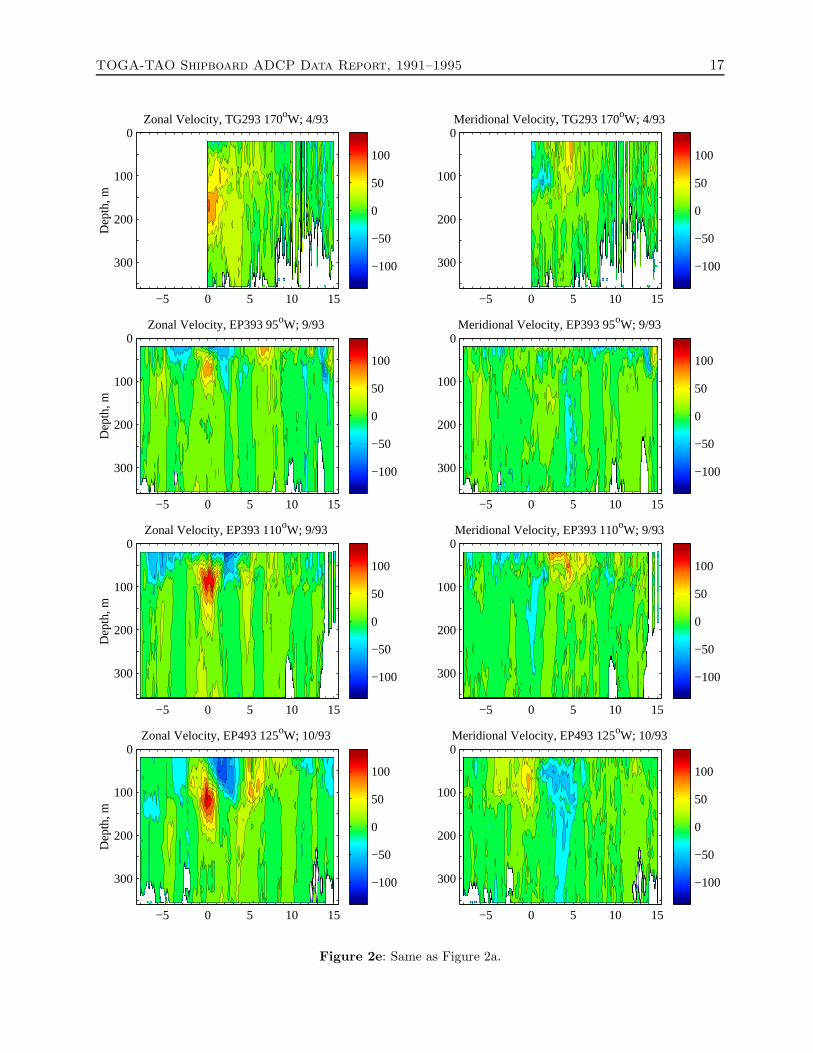
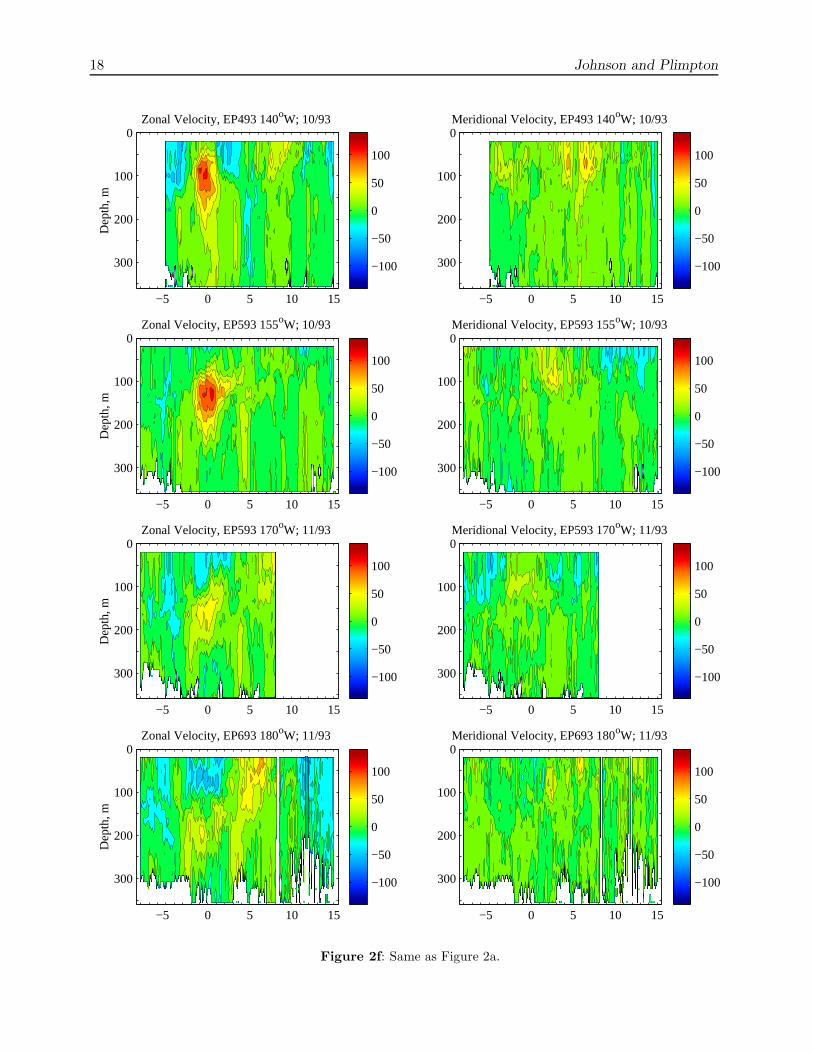
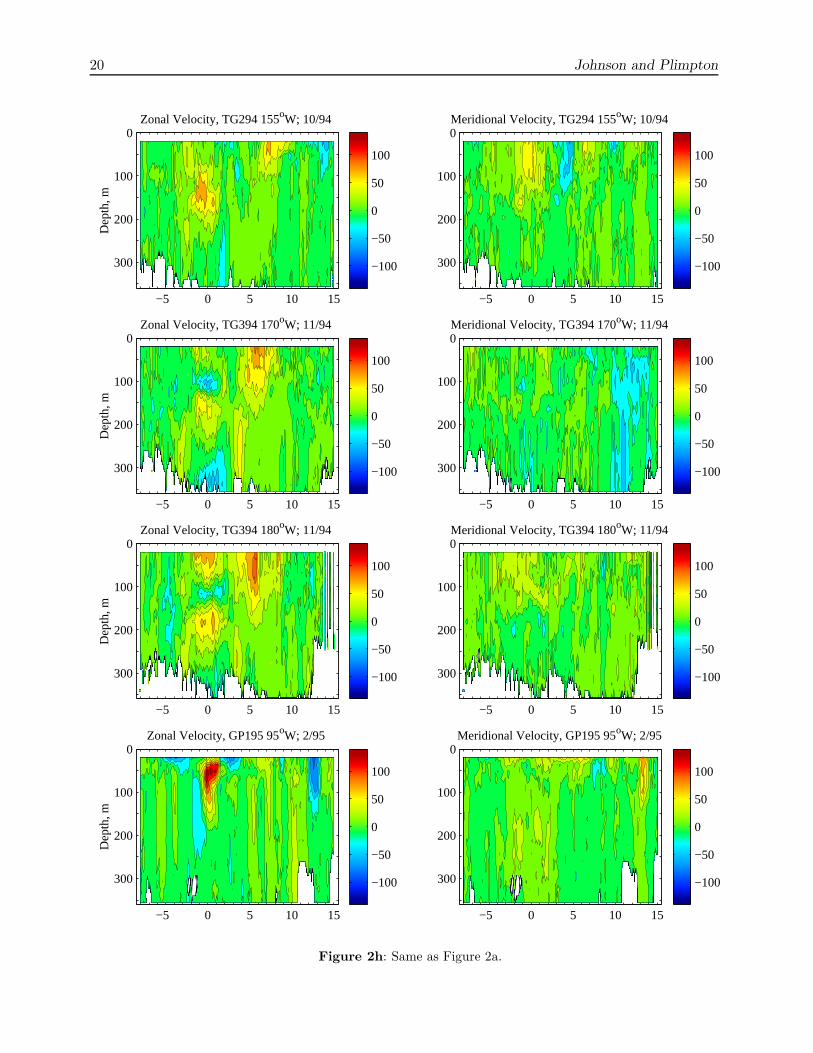
Roughly meridional sections of velocity data are shown in Figure 2. Sec-tions are presented in chronological order; each comprises about a week ofdata (Table 1).
3. Conclusion
The collection and processing of shipboard ADCP data from equatorialcruises by the NOAA ship Discoverer have produced 41 meridional sec-tions of absolute velocities for zonal and meridional currents. The sectionswere along eight different longitudes in the Pacific Ocean between 95◦W and165◦E during the period from 1991 to 1995. The sections have been incorpo-rated into the NODC data base of shipboard ADCP measurements locatedat the University of Hawaii.
4. Acknowledgments
We would like to thank the Pacific Marine Center engineers who installed andmaintained the ADCP on the NOAA ship Discoverer. We also appreciate thediligent work of the Discoverer’s officers and survey technicians, who oversaw theADCP operation during the cruises. This work was supported by NASA grantNAGW-5035 and by the TAO Project Office.
5. References
Joyce, T.M. (1989): On in situ “calibration” of shipboard ADCPs. J. Atmos.Oceanic Tech., 6, 169–172.
Luther, D.S., and E.S. Johnson (1990): Eddy energetics in the upper equatorialPacific during the Hawaii-to-Tahiti Shuttle Experiment. J. Phys. Oceanogr.,20, 913–944.
4 Johnson and Plimpton
McPhaden, M.J., A.J. Busalacchi, R. Cheney, J.R. Donguy, K.S. Gage, D. Halpern,M. Ji, P. Julian, G. Meyers, G.T. Mitchum, P.P. Niiler, J. Picaut, R.W.Reynolds, N. Smith, and K. Takeuchi (1998): The Tropical Ocean Global At-mosphere observing system: a decade of progress. J. Geophys. Res., 103(C7),14,169–14,240.
TOGA-TAO Shipboard ADCP Data Report, 1991–1995 5
FIGURES AND TABLES
6 Johnson and Plimpton
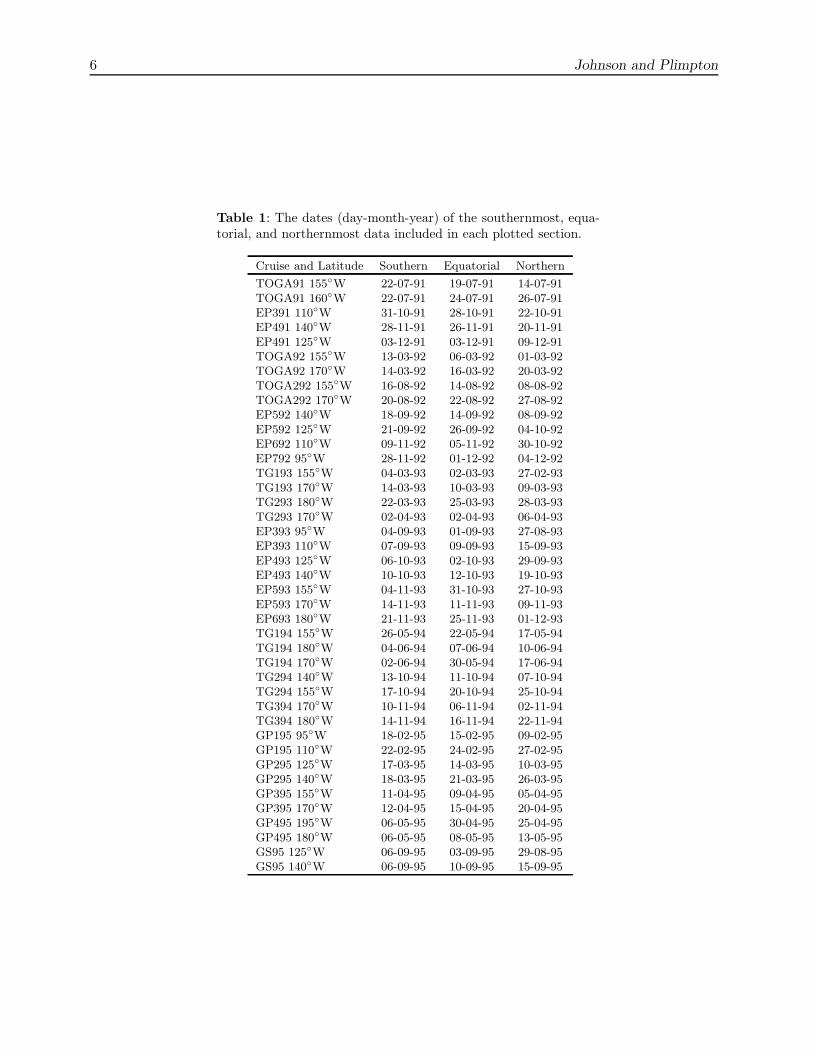
Table 1: The dates (day-month-year) of the southernmost, equa-torial, and northernmost data included in each plotted section.
Cruise and Latitude Southern Equatorial Northern
TOGA91 155◦W 22-07-91 19-07-91 14-07-91TOGA91 160◦W 22-07-91 24-07-91 26-07-91EP391 110◦W 31-10-91 28-10-91 22-10-91EP491 140◦W 28-11-91 26-11-91 20-11-91EP491 125◦W 03-12-91 03-12-91 09-12-91TOGA92 155◦W 13-03-92 06-03-92 01-03-92TOGA92 170◦W 14-03-92 16-03-92 20-03-92TOGA292 155◦W 16-08-92 14-08-92 08-08-92TOGA292 170◦W 20-08-92 22-08-92 27-08-92EP592 140◦W 18-09-92 14-09-92 08-09-92EP592 125◦W 21-09-92 26-09-92 04-10-92EP692 110◦W 09-11-92 05-11-92 30-10-92EP792 95◦W 28-11-92 01-12-92 04-12-92TG193 155◦W 04-03-93 02-03-93 27-02-93TG193 170◦W 14-03-93 10-03-93 09-03-93TG293 180◦W 22-03-93 25-03-93 28-03-93TG293 170◦W 02-04-93 02-04-93 06-04-93EP393 95◦W 04-09-93 01-09-93 27-08-93EP393 110◦W 07-09-93 09-09-93 15-09-93EP493 125◦W 06-10-93 02-10-93 29-09-93EP493 140◦W 10-10-93 12-10-93 19-10-93EP593 155◦W 04-11-93 31-10-93 27-10-93EP593 170◦W 14-11-93 11-11-93 09-11-93EP693 180◦W 21-11-93 25-11-93 01-12-93TG194 155◦W 26-05-94 22-05-94 17-05-94TG194 180◦W 04-06-94 07-06-94 10-06-94TG194 170◦W 02-06-94 30-05-94 17-06-94TG294 140◦W 13-10-94 11-10-94 07-10-94TG294 155◦W 17-10-94 20-10-94 25-10-94TG394 170◦W 10-11-94 06-11-94 02-11-94TG394 180◦W 14-11-94 16-11-94 22-11-94GP195 95◦W 18-02-95 15-02-95 09-02-95GP195 110◦W 22-02-95 24-02-95 27-02-95GP295 125◦W 17-03-95 14-03-95 10-03-95GP295 140◦W 18-03-95 21-03-95 26-03-95GP395 155◦W 11-04-95 09-04-95 05-04-95GP395 170◦W 12-04-95 15-04-95 20-04-95GP495 195◦W 06-05-95 30-04-95 25-04-95GP495 180◦W 06-05-95 08-05-95 13-05-95GS95 125◦W 06-09-95 03-09-95 29-08-95GS95 140◦W 06-09-95 10-09-95 15-09-95

TOGA-TAO Shipboard ADCP Data Report, 1991–1995 7
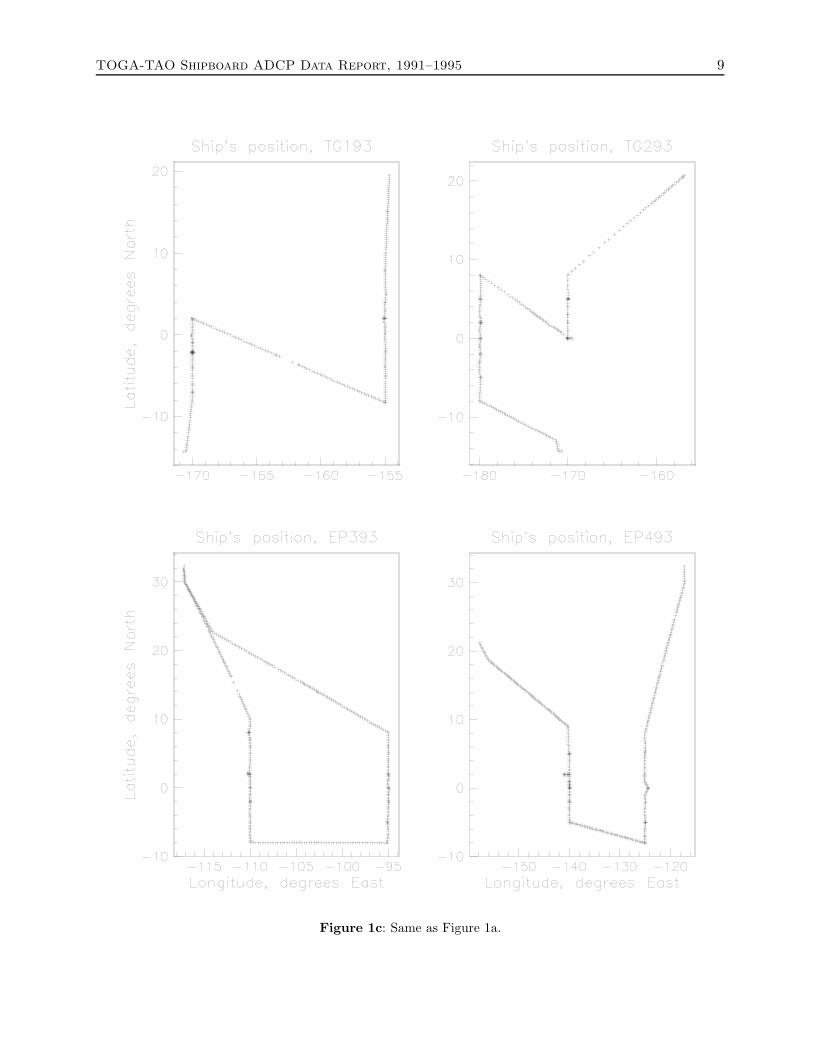
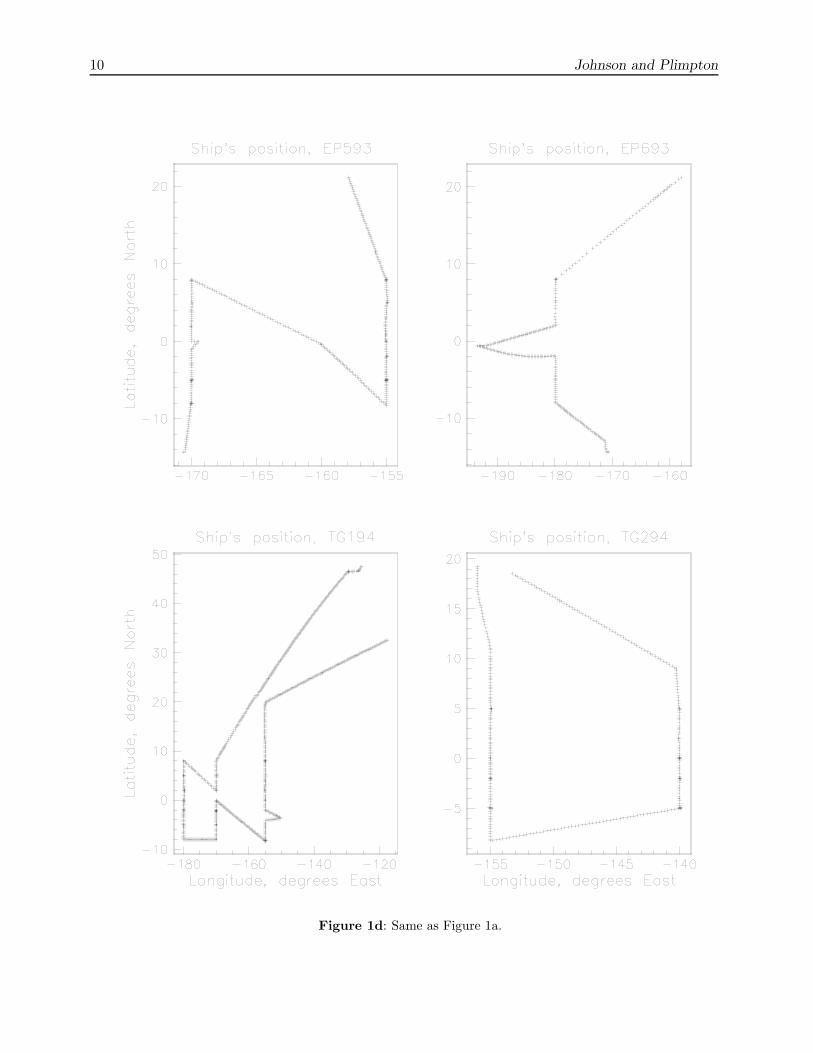
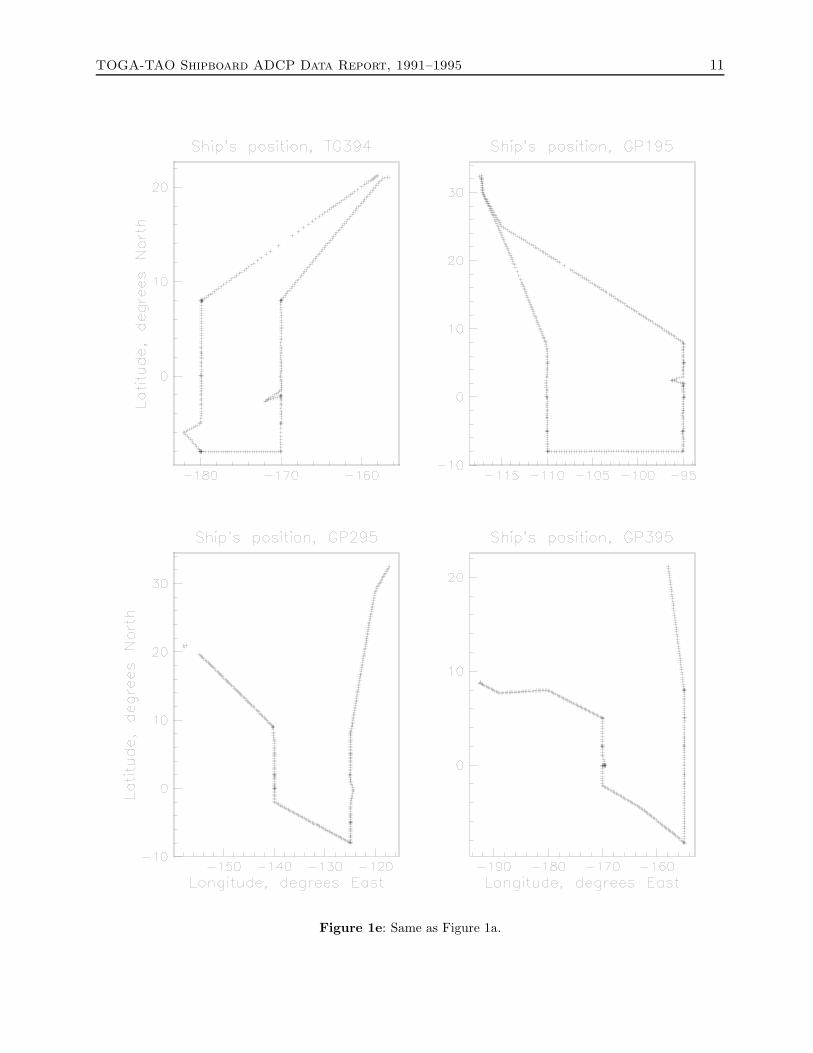
Figure 1a: Figures 1a–f show the locations of fully navigated ADCP data for each cruise by latitude andlongitude: each cross represents one hour of data. Regions of sparser coverage were generally due to dataloss through bubble interference.

8 Johnson and Plimpton
Figure 1b: Same as Figure 1a.
TOGA-TAO Shipboard ADCP Data Report, 1991–1995 9
Figure 1c: Same as Figure 1a.
10 Johnson and Plimpton
Figure 1d: Same as Figure 1a.
TOGA-TAO Shipboard ADCP Data Report, 1991–1995 11
Figure 1e: Same as Figure 1a.

12 Johnson and Plimpton
Figure 1f: Same as Figure 1a.
TOGA-TAO Shipboard ADCP Data Report, 1991–1995 13
−5 0 5 10 15
0
100
200
300
Zonal Velocity, TOGA91 155 oW; 7/91D
epth
, m
−100
−50
0
50
100
−5 0 5 10 15
0
100
200
300
Meridional Velocity, TOGA91 155 oW; 7/91
−100
−50
0
50
100
−5 0 5 10 15
0
100
200
300
Zonal Velocity, TOGA91 160 oW; 7/91
Dep
th, m
−100
−50
0
50
100
−5 0 5 10 15
0
100
200
300
Meridional Velocity, TOGA91 160 oW; 7/91
−100
−50
0
50
100
−5 0 5 10 15
0
100
200
300
Zonal Velocity, EP391 110 oW; 10/91
Dep
th, m
−100
−50
0
50
100
−5 0 5 10 15
0
100
200
300
Meridional Velocity, EP391 110 oW; 10/91
−100
−50
0
50
100
−5 0 5 10 15
0
100
200
300
Zonal Velocity, EP491 140 oW; 11/91
Dep
th, m
−100
−50
0
50
100
−5 0 5 10 15
0
100
200
300
Meridional Velocity, EP491 140 oW; 11/91
−100
−50
0
50
100
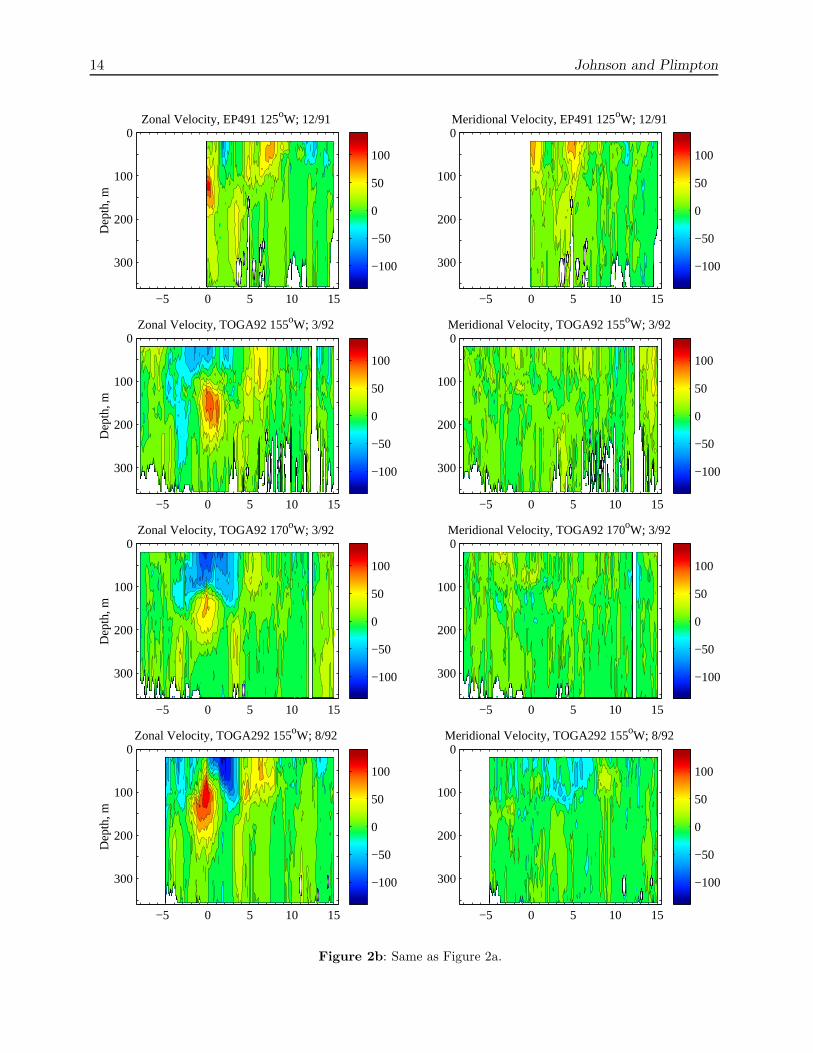
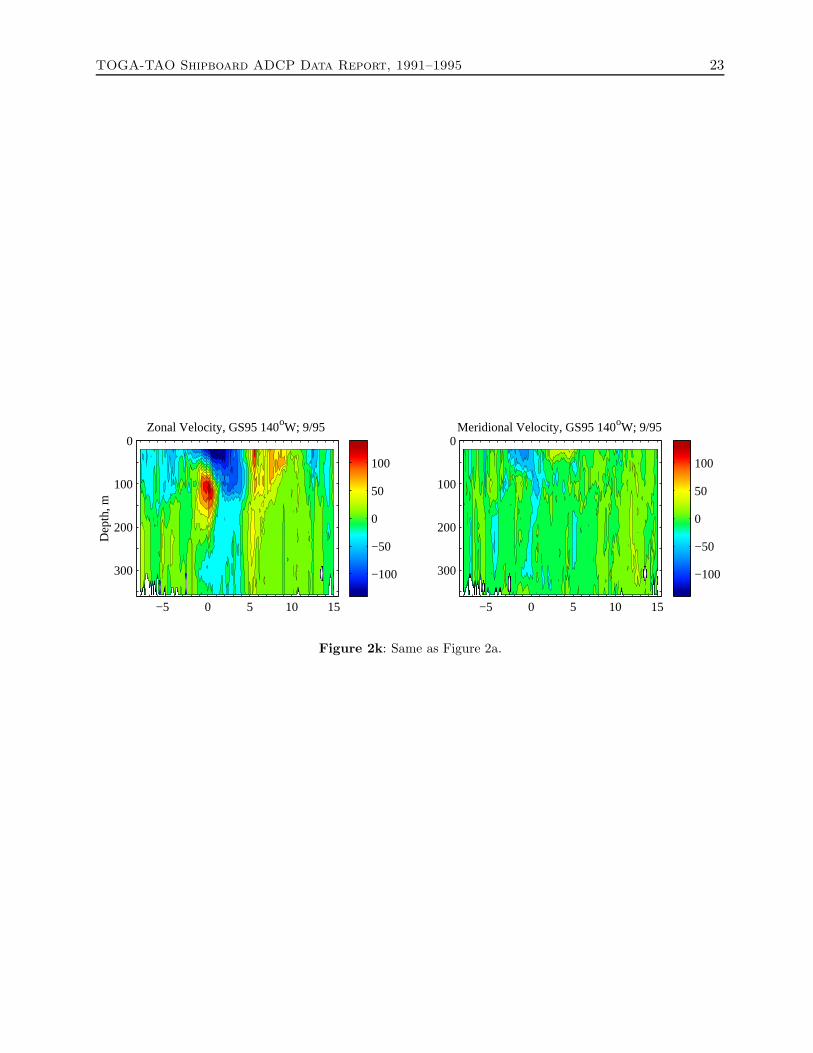
Figure 2a: Figures 2a-k show sections of zonal and meridional velocity from each roughly meridional sectionof cruise track. The original ADCP data were averaged into bins of 0.1◦ latitude and 16 m depth, and plottedwith interpolated (10 cm/s banded) shading.
14 Johnson and Plimpton
−5 0 5 10 15
0
100
200
300
Zonal Velocity, EP491 125 oW; 12/91D
epth
, m
−100
−50
0
50
100
−5 0 5 10 15
0
100
200
300
Meridional Velocity, EP491 125 oW; 12/91
−100
−50
0
50
100
−5 0 5 10 15
0
100
200
300
Zonal Velocity, TOGA92 155 oW; 3/92
Dep
th, m
−100
−50
0
50
100
−5 0 5 10 15
0
100
200
300
Meridional Velocity, TOGA92 155 oW; 3/92
−100
−50
0
50
100
−5 0 5 10 15
0
100
200
300
Zonal Velocity, TOGA92 170 oW; 3/92
Dep
th, m
−100
−50
0
50
100
−5 0 5 10 15
0
100
200
300
Meridional Velocity, TOGA92 170 oW; 3/92
−100
−50
0
50
100
−5 0 5 10 15
0
100
200
300
Zonal Velocity, TOGA292 155 oW; 8/92
Dep
th, m
−100
−50
0
50
100
−5 0 5 10 15
0
100
200
300
Meridional Velocity, TOGA292 155 oW; 8/92
−100
−50
0
50
100
Figure 2b: Same as Figure 2a.

TOGA-TAO Shipboard ADCP Data Report, 1991–1995 15
−5 0 5 10 15
0
100
200
300
Zonal Velocity, TOGA292 170 oW; 8/92D
epth
, m
−100
−50
0
50
100
−5 0 5 10 15
0
100
200
300
Meridional Velocity, TOGA292 170 oW; 8/92
−100
−50
0
50
100
−5 0 5 10 15
0
100
200
300
Zonal Velocity, EP592 140 oW; 9/92
Dep
th, m
−100
−50
0
50
100
−5 0 5 10 15
0
100
200
300
Meridional Velocity, EP592 140 oW; 9/92
−100
−50
0
50
100
−5 0 5 10 15
0
100
200
300
Zonal Velocity, EP592 125 oW; 9/92
Dep
th, m
−100
−50
0
50
100
−5 0 5 10 15
0
100
200
300
Meridional Velocity, EP592 125 oW; 9/92
−100
−50
0
50
100
−5 0 5 10 15
0
100
200
300
Zonal Velocity, EP692 110 oW; 11/92
Dep
th, m
−100
−50
0
50
100
−5 0 5 10 15
0
100
200
300
Meridional Velocity, EP692 110 oW; 11/92
−100
−50
0
50
100
Figure 2c: Same as Figure 2a.
16 Johnson and Plimpton
−5 0 5 10 15
0
100
200
300
Zonal Velocity, EP792 95 oW; 12/92D
epth
, m
−100
−50
0
50
100
−5 0 5 10 15
0
100
200
300
Meridional Velocity, EP792 95 oW; 12/92
−100
−50
0
50
100
−5 0 5 10 15
0
100
200
300
Zonal Velocity, TG193 155 oW; 3/93
Dep
th, m
−100
−50
0
50
100
−5 0 5 10 15
0
100
200
300
Meridional Velocity, TG193 155 oW; 3/93
−100
−50
0
50
100
−5 0 5 10 15
0
100
200
300
Zonal Velocity, TG193 170 oW; 3/93
Dep
th, m
−100
−50
0
50
100
−5 0 5 10 15
0
100
200
300
Meridional Velocity, TG193 170 oW; 3/93
−100
−50
0
50
100
−5 0 5 10 15
0
100
200
300
Zonal Velocity, TG293 180 oW; 3/93
Dep
th, m
−100
−50
0
50
100
−5 0 5 10 15
0
100
200
300
Meridional Velocity, TG293 180 oW; 3/93
−100
−50
0
50
100
Figure 2d: Same as Figure 2a.
TOGA-TAO Shipboard ADCP Data Report, 1991–1995 17
−5 0 5 10 15
0
100
200
300
Zonal Velocity, TG293 170 oW; 4/93D
epth
, m
−100
−50
0
50
100
−5 0 5 10 15
0
100
200
300
Meridional Velocity, TG293 170 oW; 4/93
−100
−50
0
50
100
−5 0 5 10 15
0
100
200
300
Zonal Velocity, EP393 95 oW; 9/93
Dep
th, m
−100
−50
0
50
100
−5 0 5 10 15
0
100
200
300
Meridional Velocity, EP393 95 oW; 9/93
−100
−50
0
50
100
−5 0 5 10 15
0
100
200
300
Zonal Velocity, EP393 110 oW; 9/93
Dep
th, m
−100
−50
0
50
100
−5 0 5 10 15
0
100
200
300
Meridional Velocity, EP393 110 oW; 9/93
−100
−50
0
50
100
−5 0 5 10 15
0
100
200
300
Zonal Velocity, EP493 125 oW; 10/93
Dep
th, m
−100
−50
0
50
100
−5 0 5 10 15
0
100
200
300
Meridional Velocity, EP493 125 oW; 10/93
−100
−50
0
50
100
Figure 2e: Same as Figure 2a.
18 Johnson and Plimpton
−5 0 5 10 15
0
100
200
300
Zonal Velocity, EP493 140 oW; 10/93D
epth
, m
−100
−50
0
50
100
−5 0 5 10 15
0
100
200
300
Meridional Velocity, EP493 140 oW; 10/93
−100
−50
0
50
100
−5 0 5 10 15
0
100
200
300
Zonal Velocity, EP593 155 oW; 10/93
Dep
th, m
−100
−50
0
50
100
−5 0 5 10 15
0
100
200
300
Meridional Velocity, EP593 155 oW; 10/93
−100
−50
0
50
100
−5 0 5 10 15
0
100
200
300
Zonal Velocity, EP593 170 oW; 11/93
Dep
th, m
−100
−50
0
50
100
−5 0 5 10 15
0
100
200
300
Meridional Velocity, EP593 170 oW; 11/93
−100
−50
0
50
100
−5 0 5 10 15
0
100
200
300
Zonal Velocity, EP693 180 oW; 11/93
Dep
th, m
−100
−50
0
50
100
−5 0 5 10 15
0
100
200
300
Meridional Velocity, EP693 180 oW; 11/93
−100
−50
0
50
100
Figure 2f: Same as Figure 2a.

TOGA-TAO Shipboard ADCP Data Report, 1991–1995 19
−5 0 5 10 15
0
100
200
300
Zonal Velocity, TG194 155 oW; 5/94D
epth
, m
−100
−50
0
50
100
−5 0 5 10 15
0
100
200
300
Meridional Velocity, TG194 155 oW; 5/94
−100
−50
0
50
100
−5 0 5 10 15
0
100
200
300
Zonal Velocity, TG194 180 oW; 6/94
Dep
th, m
−100
−50
0
50
100
−5 0 5 10 15
0
100
200
300
Meridional Velocity, TG194 180 oW; 6/94
−100
−50
0
50
100
−5 0 5 10 15
0
100
200
300
Zonal Velocity, TG194 170 oW; 6/94
Dep
th, m
−100
−50
0
50
100
−5 0 5 10 15
0
100
200
300
Meridional Velocity, TG194 170 oW; 6/94
−100
−50
0
50
100
−5 0 5 10 15
0
100
200
300
Zonal Velocity, TG294 140 oW; 10/94
Dep
th, m
−100
−50
0
50
100
−5 0 5 10 15
0
100
200
300
Meridional Velocity, TG294 140 oW; 10/94
−100
−50
0
50
100
Figure 2g: Same as Figure 2a.
20 Johnson and Plimpton
−5 0 5 10 15
0
100
200
300
Zonal Velocity, TG294 155 oW; 10/94D
epth
, m
−100
−50
0
50
100
−5 0 5 10 15
0
100
200
300
Meridional Velocity, TG294 155 oW; 10/94
−100
−50
0
50
100
−5 0 5 10 15
0
100
200
300
Zonal Velocity, TG394 170 oW; 11/94
Dep
th, m
−100
−50
0
50
100
−5 0 5 10 15
0
100
200
300
Meridional Velocity, TG394 170 oW; 11/94
−100
−50
0
50
100
−5 0 5 10 15
0
100
200
300
Zonal Velocity, TG394 180 oW; 11/94
Dep
th, m
−100
−50
0
50
100
−5 0 5 10 15
0
100
200
300
Meridional Velocity, TG394 180 oW; 11/94
−100
−50
0
50
100
−5 0 5 10 15
0
100
200
300
Zonal Velocity, GP195 95 oW; 2/95
Dep
th, m
−100
−50
0
50
100
−5 0 5 10 15
0
100
200
300
Meridional Velocity, GP195 95 oW; 2/95
−100
−50
0
50
100
Figure 2h: Same as Figure 2a.

TOGA-TAO Shipboard ADCP Data Report, 1991–1995 21
−5 0 5 10 15
0
100
200
300
Zonal Velocity, GP195 110 oW; 2/95D
epth
, m
−100
−50
0
50
100
−5 0 5 10 15
0
100
200
300
Meridional Velocity, GP195 110 oW; 2/95
−100
−50
0
50
100
−5 0 5 10 15
0
100
200
300
Zonal Velocity, GP295 125 oW; 3/95
Dep
th, m
−100
−50
0
50
100
−5 0 5 10 15
0
100
200
300
Meridional Velocity, GP295 125 oW; 3/95
−100
−50
0
50
100
−5 0 5 10 15
0
100
200
300
Zonal Velocity, GP295 140 oW; 3/95
Dep
th, m
−100
−50
0
50
100
−5 0 5 10 15
0
100
200
300
Meridional Velocity, GP295 140 oW; 3/95
−100
−50
0
50
100
−5 0 5 10 15
0
100
200
300
Zonal Velocity, GP395 155 oW; 4/95
Dep
th, m
−100
−50
0
50
100
−5 0 5 10 15
0
100
200
300
Meridional Velocity, GP395 155 oW; 4/95
−100
−50
0
50
100
Figure 2i: Same as Figure 2a.

22 Johnson and Plimpton
−5 0 5 10 15
0
100
200
300
Zonal Velocity, GP395 170 oW; 4/95D
epth
, m
−100
−50
0
50
100
−5 0 5 10 15
0
100
200
300
Meridional Velocity, GP395 170 oW; 4/95
−100
−50
0
50
100
−5 0 5 10 15
0
100
200
300
Zonal Velocity, GP495 195 oW; 4/95
Dep
th, m
−100
−50
0
50
100
−5 0 5 10 15
0
100
200
300
Meridional Velocity, GP495 195 oW; 4/95
−100
−50
0
50
100
−5 0 5 10 15
0
100
200
300
Zonal Velocity, GP495 180 oW; 5/95
Dep
th, m
−100
−50
0
50
100
−5 0 5 10 15
0
100
200
300
Meridional Velocity, GP495 180 oW; 5/95
−100
−50
0
50
100
−5 0 5 10 15
0
100
200
300
Zonal Velocity, GS95 125 oW; 9/95
Dep
th, m
−100
−50
0
50
100
−5 0 5 10 15
0
100
200
300
Meridional Velocity, GS95 125 oW; 9/95
−100
−50
0
50
100
Figure 2j: Same as Figure 2a.
TOGA-TAO Shipboard ADCP Data Report, 1991–1995 23
−5 0 5 10 15
0
100
200
300
Zonal Velocity, GS95 140 oW; 9/95
Dep
th, m
−100
−50
0
50
100
−5 0 5 10 15
0
100
200
300
Meridional Velocity, GS95 140 oW; 9/95
−100
−50
0
50
100
Figure 2k: Same as Figure 2a.