Embed Size (px)
Citation preview

TOGETHER WE ACHIEVE MORE
Alliance Pharma plc Annual Report and Accounts 2017

ALLIANCE PHARMA PLC IS AN INTERNATIONAL SPECIALTY
PHARMACEUTICAL COMPANY.
Overview01 2017 Highlights02 At a Glance
Strategic Report06 Investment Case08 Chairman’s and Chief
Executive’s Review14 Our Business Model and Strategy16 Strategy in Action – Buy18 Strategy in Action – Build20 Strategy in Action – Kelo-cote22 Strategy in Action – MacuShield24 Our People26 Financial Review28 Risk Management and
Internal Controls30 Principal Risks and Uncertainties
Governance38 Board of Directors 40 Corporate Governance44 Remuneration Report47 Directors’ Report
Financial Statements52 Independent Auditor’s Report56 Consolidated Income Statement57 Consolidated Statement
of Comprehensive Income58 Consolidated Balance Sheet59 Company Balance Sheet60 Consolidated Statement
of Changes in Equity61 Company Statement of
Changes in Equity62 Consolidated and Company
Cash Flow Statements63 Notes to the Financial Statements
Additional Information100 Shareholder Information101 Five Year Summary102 Advisors and Key
Service Providers103 Cautionary statement 104 Trade marks
CONTENTS
For more information visit alliancepharmaceuticals.com
Headquartered in Chippenham, UK, Alliance commenced trading in 1998 and has been listed on AIM since 2003.
Alliance has a strong track record of acquiring established niche products and it currently owns or licenses the rights to approximately 90 pharmaceutical and consumer healthcare
products. It has sales in more than 100 countries either directly via its affiliates or through its selected network
of distributor partners.
Alliance Pharma plc Annual Report and Accounts 2017

Revenue
£103.3m+6%(2016: £97.5m)
Dividend
1.331p+10%(2016: 1.210p)
Underlying Profit Before Tax*
£24.0m+8%(2016: £22.2m)
Underlying adjusted basic EPS**
4.06p+10%(2016: 3.69p)
Free Cash Flow**
£21.7m+67%(2016: £13.0m)
2017 HIGHLIGHTS
* Underlying Profit Before Tax excludes Sinclair settlement income
** For definitions of non IFRS alternative performance measures see note 33
CHAIRMAN'S AND CHIEF EXECUTIVE’S REVIEW
08
INTERNATIONAL BUSINESS
18
OPERATIONAL HIGHLIGHTS
• Strong organic performance, driven by our International Star brands
– Kelo-cote, our scar reduction brand, grew 34% to £13.3m (2016: £10.0m)
– MacuShield, the No.1 macular pigment supplement recommended by eye experts, grew 38% to £7.3m (2016: £5.3m)
• Agreed a settlement in March 2017 with Sinclair, including £5.0m cash compensation, in relation to the material reduction of business in Kelo-stretch
• Acquisition of Vamousse in December 2017, adding a third International Star brand and creating a US operation for the Group
• Acquisition of Ametop in December 2017 to complement our Bedrock portfolio
• Now a £100m+ revenue business involving operations on three continents, with good progress in Asia Pacific through our distributor network
Reported Profit Before Tax
£28.4m+28%(2016: £22.2m)
Reported Basic EPS
6.10p+58%(2016: 3.85p)
01
Ove
rview
Fina
ncia
l State
men
tsA
dd
ition
al in
form
atio
nG
ove
rna
nce
Strate
gic R
ep
ort
Overview | 2017 Highlights

AT A GLANCE
Local Heroes that provide important growth at a national level include: Aloclair, Oxyplastine, Hydromol
Three International Stars that offer international growth and receive the highest level of investment:
8
Kelo-coteSee pages 20 and 21
MacuShieldSee pages 22 and 23
VamousseSee pages 16 and 17
Bedrock of non-promoted brands that provide stable cash generation
What we doWith a proven acquisition-led growth strategy, we own or license the rights to approximately 90 pharmaceutical and consumer healthcare products. We outsource capital-intensive activities such as manufacturing, warehousing and logistics to specialist providers, and focus on marketing and all the associated business and regulatory activities.
We distribute our products through wholesalers, retail pharmacies, hospitals and a well-respected international network of distributors.
Our portfolio We manage our portfolio and direct our promotional resources accordingly:
We sell our specialty pharmaceutical and consumer healthcare products in more than 100 countries.
12% Kelo-cote
77% Bedrock products & Local Hero brands
4% Vamousse
7% MacuShield
* Pro-forma revenue includes pre-acquisition revenue in the 12 months to 31 December 2017
Revenue by product*
Alliance Pharma plc Annual Report and Accounts 201702

23
1
4
7
6
9
10
5
10OFFICES AND A BROAD INTERNATIONAL BASE OF DISTRIBUTORS
210STRONG DEDICATED TEAM OF PEOPLE
50% UK
22% Western Europe (exc. UK)
28% International
International offices
Country with international office
Distributor relationships
Geographic footprint
Chester Madrid
Chippenham (HQ) Milan
Dublin North Carolina
Paris Shanghai
Düsseldorf Singapore
1 6
2 7
3 8
4 9
5 10
Revenue by geography*
03
Ove
rview
Fina
ncia
l State
men
tsA
dd
ition
al in
form
atio
nG
ove
rna
nce
Strate
gic R
ep
ort
Overview | At a Glance

Maximising our strategic
advantage
Alliance Pharma plc Annual Report and Accounts 201704

Strategic Report06 Investment Case08 Chairman’s and Chief
Executive’s Review14 Our Business Model and Strategy16 Strategy in Action – Buy18 Strategy in Action – Build20 Strategy in Action –
Spotlight on Kelo-cote22 Strategy in Action –
Spotlight on MacuShield24 Our People26 Financial Review28 Risk Management and
Internal Controls30 Principal Risks and
Uncertainties
Ove
rview
Fina
ncia
l State
men
tsA
dd
ition
al in
form
atio
nG
ove
rna
nce
05Strategic Report
Strate
gic R
ep
ort

INVESTMENT CASE
Alliance Pharma is a profitable, cash-generative, dividend-paying group with a proven business model and identified strategies for growth.
Proven model
Balanced portfolio
Highly selective
acquisition strategy
International speciality pharma group with successful record of executing a proven ‘buy & build’ strategy
Asset-light operations and no R&D risk, leading to high cash conversion
Investment is focused on three International Star growth brands and a select number of Local Hero brands, supported by ‘Bedrock’ products requiring minimal promotional support
Balanced exposure to Rx (prescription), OTC (over the counter) and OTx (dual channel) segments
Strategy combines growth and stability
For growth, we seek well-differentiated brands
For stability, we seek products that are tried and tested with sustainable sales
Read more on page 08 (Chairman’s and Chief
Executive’s Review)
Read more on page 14 (Our Business Model
and Strategy)
Read more on page 14 (Our Business Model
and Strategy)
20YEARS OF OPERATION
23%REVENUES FROM INTERNATIONAL STAR GROWTH BRANDS
35ACQUISITIONS
Alliance Pharma plc Annual Report and Accounts 201706Alliance Pharma plc Annual Report and Accounts 2017

Ambitious and
experienced team
Strong financial
performance
Scalable platform
Stable and entrepreneurial Senior Leadership Team (SLT) with deep sector and functional expertise
Short lines of communication and ‘can do’ culture
High cash generation
Record of consistent growth
Paying dividends since 2009, with average annual growth of 10%
Broad geographic footprint, differentiated portfolio, IT infrastructure and experienced management team provide a sound platform for growth
Clear strategy to build on track record of organic growth, complemented with ability to identify, acquire and integrate attractive assets
Read more on page 24 (Our People)
Read more on page 26 (Financial Review)
Read more on page 26 (Financial Review)
26%EBITDA MARGIN
9 COUNTRIES WITH AN ALLIANCE OFFICE
25AVERAGE NUMBER OF YEARS’ INDUSTRY EXPERIENCE OF THE SLT
Ove
rview
Fina
ncia
l State
men
tsA
dd
ition
al in
form
atio
nG
ove
rna
nce
Strate
gic R
ep
ort
07Strategic Report | Investment Case

After another year’s strong performance we
have exceeded £100m of revenue for the
first time, marking an important milestone
in the development of the Group.
Alliance Pharma plc Annual Report and Accounts 201708

Revenue
£103.3m(2016: £97.5m)
Free Cash Flow
£21.7m(2016: £13.0m)
CHAIRMAN'S AND CHIEF EXECUTIVE’S REVIEW
Gross margin improved from 56.3% to 57.1%, reflecting an improving sales mix. EBITDA margin was 26%, in line with our stated target after increasing investment behind our International Star brands to grow the business.
There was a marked increase in underlying free cash flow in 2017 to £21.7m, up from £13.0m in 2016. The improvement on the prior year was due to the continued strong cash generation of the Alliance business and the normalisation of working capital following the build-up in H1 2016, due to the acquisition of the Healthcare Products Business from Sinclair Pharma plc.
We were also pleased to be able to announce two acquisitions during December 2017, both funded from existing cash and bank facilities: Ametop, a topical anaesthetic gel, acquired from Smith and Nephew, and Vamousse, for the prevention and treatment of human head lice, acquired from TyraTech. These products were acquired for US$7.5m (£5.6m) and an initial consideration of US$13.0m (£9.7m) respectively, together with inventory totalling $0.9m (£0.7m).
Despite cash outflows of £16.0m for the acquisitions of Vamousse and Ametop, the Group’s strong underlying cash generation, together with the £4.0m settlement claim receipt from Sinclair, resulted in the Group’s net debt reducing to £72.3m as at 31 December 2017 (31 December 2016: £76.1m). Adjusted net debt/EBITDA leverage therefore decreased from 2.83 times to 2.46 times in the year (and would have been 2.06 times had we not made the two acquisitions). As announced in December, we have renegotiated our banking covenants, and our net debt to EBITDA covenant has been increased from 2.5x to 3.0x for the life of the credit agreement through December 2020 to provide sufficient headroom when making acquisitions. Based on current business performance and excluding any prospective acquisitions, we expect leverage to continue to reduce to below 2.0 times by the end of this financial year.
2017 Highlights• Strong organic performance,
driven by our International Star brands.
• Acquisition of Vamousse in December 2017, adding a third International Star brand and creating a US operation for the Group.
• Now a £100m+ revenue business involving operations on three continents, with good progress in Asia Pacific through our distributor network.
• Grew underlying profits before tax by £1.8m (8%) and generated £21.7m free cash flow.
Financial resultsWe are pleased to report the results of another good year for the Group. Revenue grew by 6% to reach £103.3m (2016: £97.5m). At £24.0m (2016: £22.2m), underlying profit before tax increased by 8%, in line with the Board’s expectations.
Our International Star brands continued their strong performance in 2017. Sales of our scar reduction brand Kelo-cote grew across many international territories to reach £13.3m, an increase of 34% (2016: £10.0m). MacuShield, the No.1 macular pigment supplement recommended by eye experts, saw sales increase by 38% to £7.3m (2016: £5.3m). Overall, our other brands performed in line with expectations.
Foreign exchange rate movements had a favourable effect on revenues of approximately £2.7m on account of the weakening of Sterling against the Euro and US Dollar. On a constant currency basis, the Group delivered a like-for-like sales increase of 3.2%. The currency impact on operating profits is much smaller due to the larger proportion of cost of goods and operating costs denominated in these currencies.
“ Following a transformational 2016 in which the Sinclair Healthcare Products business was integrated into the Group, the business delivered strongly in 2017. The strength of cash generation, coupled with the opportunities from our International Star brands, means we are well positioned to pursue growth both organically and through further acquisitions in 2018.
The year has started well, including the establishment of a US affiliate, and we look forward to leveraging our expanded footprint.”
David Cook Chairman
Ove
rview
Fina
ncia
l State
men
tsA
dd
ition
al in
form
atio
nG
ove
rna
nce
Strate
gic R
ep
ort
09Strategic Report | Chairman’s and Chief Executive’s Review

2007Forceval China
£1.95m
2008Pavacol D
£0.6m
2010Cambridge Laboratories
£16.4m
2009Buccastem Timodine
£7.5m
2011Quinoderm Ceanel
£1.5mRizuderm + 5 Products
£2.4m
CHAIRMAN'S AND CHIEF EXECUTIVE’S REVIEW CONTINUED
Performance by regionUK and Republic of IrelandSales in our largest market grew to £56.3m, an increase of 4% on a like-for-like basis, driven primarily by MacuShield, which responded well to increased marketing investment and wider distribution, to achieve sales of £6.2m (2016: £4.6m). Similarly, Kelo-cote performed well during the year, with our renewed focus on the brand generating 38% growth to £0.8m. Sales of Hydromol remained static at £7.0m as the emollient market slowed considerably.
Other highlights include our local hero brand Lypsyl, which grew by 32% to £1.2m, as a result of a product refresh and increased marketing effort.
Mainland EuropeIn aggregate, the sales in our direct European territories (France, Germany, Switzerland, Austria, Italy, Spain and Portugal) were up 2% to £20.6m (decreasing by 4% on a constant currency basis relative to 2016). We saw a strong performance from Kelo-cote of £3.2m (2016: £1.4m), particularly since we repatriated our distribution agreements in France and Italy, but
this was offset by distributor stocking patterns in Spain and Italy, primarily for Aloclair, as we completed livery changes. We are working to solidify our position in these markets. We will evaluate opportunities to introduce Vamousse where appropriate and continue to analyse further acquisition prospects to leverage our footprint.
InternationalWe were particularly pleased with our sales in our International business, which grew by 13% to £26.4m compared with 2016 (7% on a constant currency basis). Asia Pacific was the primary engine of growth, with sales increasing by 35% (28% in constant currency) thanks to robust sales of Kelo-cote and Aloclair through our distribution partners. Our Chinese business saw sales grow by 61% (54% in constant currency), with Kelo-cote the principal driver.
StrategyOur Buy & Build model continues to perform well, providing growth, profitability and cash generation.
A key part of the model is our portfolio strategy. We segment out our high growth International Star brands as the top priority for promotional
A DECADE OF BUY AND BUILD
Underlying Profit Before Tax
£24.0m(2016: £22.2m)
23%*REVENUES FROM INTERNATIONAL STAR GROWTH BRANDS
* Pro-forma including acquisition revenue
2007: Sales £18.2m Underlying PBT £0.4m
Alliance Pharma plc Annual Report and Accounts 201710

2012Opus
£8.0mAvloclor + 2 Products
£4.2m
2014Irenat (Germany)Undisclosed
2016Diclectin EU
£1.0m
2017Vamousse
$13–17.5mAmetop
$7.5m
2013Lypsyl
£1.9mSyntometrine (excl. UK)
£7.5m
2015Sinclair
£127.5mDiclectin UK
£1.5m
Lefuhzi + 4 Products
£1.4mMacuShield
£10.8m
investment. These are Kelo-cote, our patented scar reduction product and MacuShield, our supplement product that replenishes the layer of protective pigment on the macula, a critical region at the back of the eye. MacuShield is the No.1 macula pigment supplement recommended by UK eye experts. Following the acquisition at the end of 2017, we now have a third International Star brand in Vamousse, a novel, naturally based, pesticide-free treatment for headlice. Each of these products has international potential. Their individual marketing strategies are created centrally and adapted locally to suit different therapeutic and cultural approaches to treatment.
Vamousse is of special strategic relevance in that it was developed in the US, where it records over 80% of its current sales. Acquiring Vamousse has enabled us to establish a low-risk entry into the world’s largest healthcare market with immediate profitability. This will undoubtedly allow us to benefit from further opportunities as we establish ourselves in this major market. Vamousse also has good UK sales, and the brand fits neatly into our existing UK OTC portfolio.
As well as our International Stars, we have several Local Heroes which are national growth brands that excel in one or two markets without necessarily having broader global potential. Examples are Hydromol, our UK dermatology brand, Aloclair our brand for mouth ulcers that performs very well in Italy and Spain, and Oxyplastine, a well-known nappy rash product in France and Francophone Africa.
Of fundamental importance for providing profitability and cash contribution are our numerous Bedrock products. This part of the portfolio contains around 70 of our 90 brands and provides around 50% of our sales, providing a sustainable base for the business. These products are very well established in market niches and need minimal promotional support. Our Bedrock products were recently boosted by the acquisition of Ametop from Smith & Nephew in December 2017. Ametop is a well-established and widely used local anaesthetic gel, used on the skin prior to injections or cannulations.
We continue to work with the Medicines and Healthcare products Regulatory Agency (MHRA) on
Diclectin, a treatment for nausea and vomiting of pregnancy. We in-licensed the product from the Canadian group, Duchesnay Inc. for the UK in 2015 and for a further nine European territories in 2016. Working with Duchesnay, we believe that we are making good progress in resolving some of the issues initially expressed by the regulator in July 2017. We expect to have more clarity on the regulatory position within the next few months. There are currently no licensed treatments for nausea and vomiting of pregnancy in the UK, highlighting a clear unmet medical need. If approved, Diclectin would represent a sizeable mid-term opportunity, once the initial marketing investments have paid back.
Over and above our organic growth opportunities, we will continue to look for good bolt-on acquisitions that will further enhance our growth. Our ability to conclude such acquisitions is facilitated by our strong cash generation and our falling debt leverage position, as outlined in our financial review. Our ability to integrate acquisitions has been finely honed through 35 deals in the last 20 years.
2007: Sales £18.2m Underlying PBT £0.4m 2017: Sales £103.3m Underlying PBT £24.0m
Ove
rview
Fina
ncia
l State
men
tsA
dd
ition
al in
form
atio
nG
ove
rna
nce
Strate
gic R
ep
ort
11Strategic Report | Chairman’s and Chief Executive’s Review
CHAIRMAN'S AND CHIEF EXECUTIVE’S REVIEW CONTINUED
OperationsOur new enterprise resource planning system, Microsoft AX, is anticipated to be operational by the end of 2018. By bringing several legacy systems onto a single platform that will handle all our financial and supply chain planning and fulfilment activities, this will streamline our processes and provide a scalable platform as we pursue further growth.
We continue to keep a close eye on the unfolding situation with regards to Brexit. Many of our licences for medicines were granted on a national basis, so will remain unaffected. However, we are taking proactive steps to ensure that our regulatory, pharmacovigilance and quality functions can continue to operate effectively in the post Brexit environment. The presence of our European affiliates affords us a good degree of optionality in this respect and we expect minimal changes to our operational cost base as a result.
Working in conjunction with our contract manufacturers, we are also well advanced in our preparations to upgrade our product packs and distribution systems to comply with the forthcoming obligations of the EU Falsified Medicines Directive legislation (FMD), which is designed to prevent counterfeit medicines reaching patients.
PeopleAt Board level, Peter Butterfield was appointed Chief Operating Officer in June 2017, to add to his duties as Deputy Chief Executive. This shift in responsibilities has allowed John Dawson to be able to focus more on outward-facing initiatives, and Peter to continue the transition to CEO. In March we announced that following this planned transition period, Peter will step into the CEO role from the 1 May 2018 and John will become a Non-executive Director. Peter has almost 20 years of commercial and operational healthcare experience,
the last eight being spent at Alliance. The Chairman, Andrew Smith, stepped down from the Board on 1 March 2018, and was succeeded by David Cook, who has been a Non-executive Director of the Company for almost four years.
We thank Andrew for his valuable contribution to the Company over the past eleven years that has seen our underlying PBT grow from £0.5m to £24.0m and our market capitalisation from £22m to £320m.
To complement our internal promotions, during the year we appointed several external candidates to round out the Group’s capabilities. These included Amanda Sicvol, our General Manager for the US market, who joined Alliance Pharma with the acquisition of Vamousse; Chris Delafield, who joined us from Sanofi as the new Global Marketing Head for Kelo-cote; and Chris Chrysanthou, who joined us from Fladgate LLP to create our own in-house commercial legal function.
The performance of the business is built upon the hard work of our valued employees, and we wish to thank all our people for their dedication and contributions to the success of the Group. In addition to our ongoing investment in training and development, in the last couple of years we have enhanced our working environments, with significant refurbishment of our offices in Chippenham, as well as new offices in Madrid, Singapore, and – most recently – in the United States with the establishment of Alliance Pharma Inc. in Cary, North Carolina.
We are delighted to report that in our most recent survey, we received our highest ever rating on employee engagement and look forward to continuing our efforts to make Alliance a great place to work and an employer of choice.
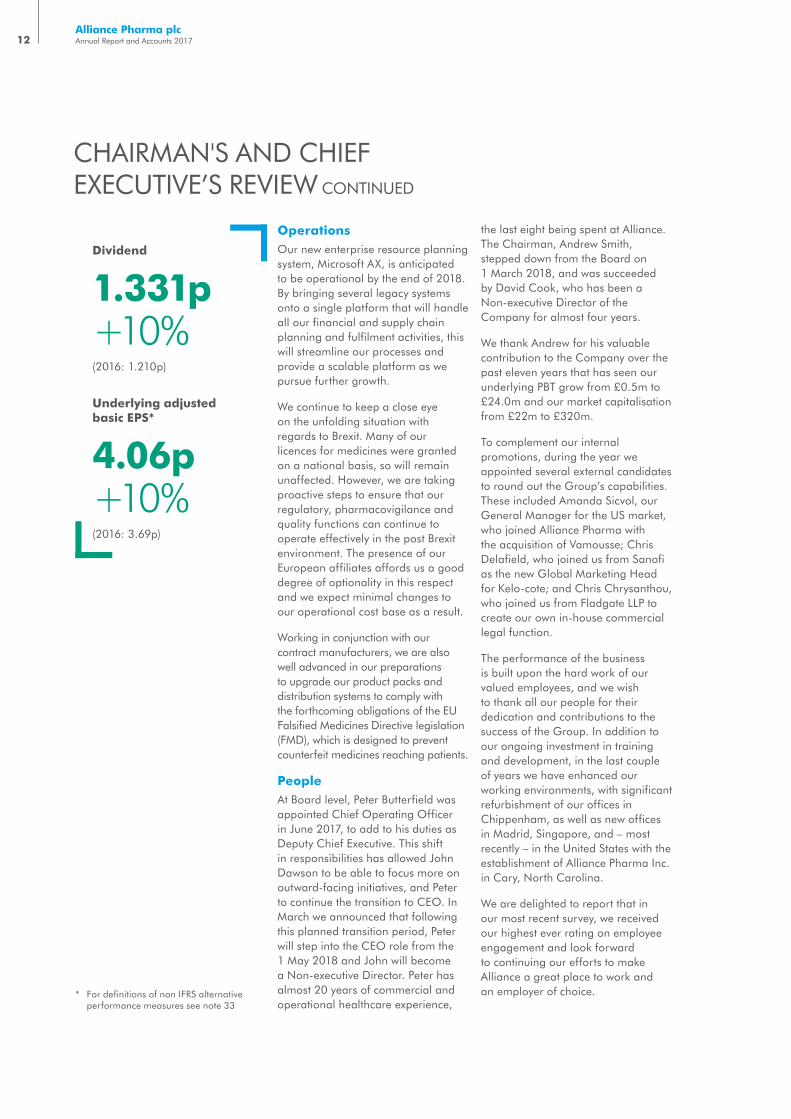
Dividend
1.331p+10%(2016: 1.210p)
Underlying adjusted basic EPS*
4.06p+10%(2016: 3.69p)
* For definitions of non IFRS alternative performance measures see note 33
Alliance Pharma plc Annual Report and Accounts 201712

Corporate CitizenshipWe contribute to our communities, and to many local and national charities. Our primary fundraising initiative for the year was, alongside our employees, to raise £30,000 for SANDS, the stillbirth and neonatal death charity, through activities across the Company including sponsored walks and a 250 mile cycle ride between our Paris and Chippenham offices. We also have a long-established relationship with International Health Partners, to which we donate products for distribution to health practitioners in areas of great need around the world.
DividendWe are recommending a final payment of 0.888p per ordinary share, which would bring the total for the year of 1.331p. The final dividend will be paid on 11 July 2018 to shareholders on the register on 15 June 2018. Including the £2.1m interim payment, the total dividend payment for the year will be £6.3m.
OutlookWe ended the year strongly, with good levels of organic growth complemented by the two acquisitions made at the close of the financial year. We see exciting prospects for our newly acquired brand Vamousse, which alongside Kelo-cote and MacuShield increases the growth capacity of the International Star section of our portfolio.
Our geographic operations have been greatly enhanced by the creation of our new affiliate in the US, the world’s largest healthcare market, where in the medium term we anticipate finding further good opportunities.
Our strong cash generation and access to debt capital give us firepower to make further acquisitions, in line with our proven strategy, and should we achieve a favourable regulatory outcome in relation to Diclectin, this would further enhance our growth prospects.
We are now a business with more than £100m of revenues, an international geographical presence and a strong, capable and ambitious management team. We have the scale and infrastructure in place for further growth and we look forward to the future with great confidence.
David Cook John DawsonChairman Chief Executive
27 March 2018
£100m+OF REVENUE AND AN INTERNATIONAL GEOGRAPHICAL PRESENCE
Ove
rview
Fina
ncia
l State
men
tsA
dd
ition
al in
form
atio
nG
ove
rna
nce
Strate
gic R
ep
ort
13Strategic Report | Chairman’s and Chief Executive’s Review

Employees• Rewarding careers for our staff
• Active participation in the ownership of the business as all employees hold share options
Patients• Improved quality of life
THE VALUE WE SHARE WITH STAKEHOLDERS
OUR BUSINESS MODEL AND STRATEGY
THE VALUE WE CREATE
Revenue
£103.3m
EBITDA*
£26.8m
Progress in 2017The acquisition in December 2017 of head lice treatment range Vamousse brought a third international growth brand to the Group. Topical anaesthetic gel, Ametop, purchased from Smith & Nephew in December 2017, adds to the bedrock range in the UK and Ireland.
Sources of competitive advantage• Extensive networking delivering a
rich pipeline of opportunities
• Strong due diligence team to evaluate acquisitions
• Efficient integration of acquisitions
• Successful record of securing finance
Acquiring products and companies that fit our strategy at an appropriate price to increase our corporate value, and integrating them seamlessly.We have an effective and established approach to identifying, screening, negotiating and integrating acquired brands and companies.
Buy
35 DEALS OVER 20 YEARS
Our simple, proven model and clear Buy and Build strategy create value for stakeholders.
Alliance Pharma plc Annual Report and Accounts 201714

Healthcare providers• Efficacious and cost-effective
therapies
Business partners• Attractive and growing business
for our manufacturing and distribution partners, and all the other businesses we interact with
Shareholders• Ownership of a stronger
business
• Growing dividend
Underlying PBT
£24.0m
Underlying adjusted basic EPS*
4.06p
Free cash flow*
£21.7m
* See note 33
Sources of competitive advantage• Diversified range, balanced between reimbursed and
over-the-counter products
• Portfolio management skills with promotional investment allocated between International Star growth brands and Local Heroes, with non-promoted brands forming a Bedrock of cash generation
• Strong routes to market in more than 100 countries
• Asset-light, cash-generative model, with capital-intensive activities such as manufacturing and logistics outsourced
• Pan-European and newly acquired US footprint
Maximising brand potential through skilled portfolio management, effective promotional programmes and distribution gains.With our clear segmentation model, our brands play explicit roles in our portfolio and are allocated appropriate levels of investment accordingly.
Build
20+YEARS FOCUSED ON GROWTH
Progress in 2017Our International Star brands Kelo-cote and MacuShield achieved sales of £13.3m and £7.3m respectively, driven by marketing initiatives, expansion into new markets and partnering activities. Asia Pacific was a particular engine of growth for Kelo-cote. In Europe, where we have our own infrastructure, the repatriation of distribution agreements for Kelo-cote in Germany, France, Italy and the UK is intended to bring new momentum in these markets.
Ove
rview
Fina
ncia
l State
men
tsA
dd
ition
al in
form
atio
nG
ove
rna
nce
Strate
gic R
ep
ort
15Strategic Report | Our Business Model

STRATEGY IN ACTION – BUY
Vamousse treatment kills 100% of lice and eggs within 15 minutes of contact.
Vamousse is an innovative, pesticide-free range of consumer healthcare products for the prevention and treatment of human head lice.
With a unique formulation and requiring only a single application, Vamousse Head Lice Treatment has been proven to kill 100% of lice and eggs within 15 minutes of contact in scientific tests. The mousse format allows quick and accurate application. The range is non-toxic, pesticide-free and can be used for children 2 years and older.
Launched in 2014, the brand has gained wide distribution and grown ahead of the category in the US and UK. Vamousse now holds the #5 position in the US market, where more than 80% of its sales are generated; the UK is the brand’s other core market. The global head lice treatment market was worth an estimated $370m in 2016* and is growing at an average rate of 5% to 8% per year.
Alliance acquired the exclusive global rights to the brand at the end of 2017, and sees further international sales growth potential through the Group’s EU affiliates and global distributor network. The acquisition brought a presence for Alliance in the key US market, and the move of Vamousse’s US Marketing Director to Alliance will help ensure a seamless transfer of knowledge and brand management.
SPOTLIGHT ON VAMOUSSE
* Nicholas Hall DB6 ‘head lice treatments’, January 2017, based on manufacturers’ selling prices
Alliance Pharma plc Annual Report and Accounts 201716

TOTAL REVENUE OF £4.9M
#5 IN US HEAD LICE TREATMENT MARKET
Ove
rview
Fina
ncia
l State
men
tsA
dd
ition
al in
form
atio
nG
ove
rna
nce
Strate
gic R
ep
ort
17Strategic Report | Strategy in Action

KELO-COTE is an advanced formula silicone treatment which helps improve the appearance of scars and helps prevent them from forming.
STRATEGY IN ACTION – BUILD
SPOTLIGHT ON INTERNATIONALBUSINESSWhilst Alliance has its own operations selling directly to customers across Europe, and more recently the US, of vital importance is its network of specially selected distribution partners to access customers in over 90 other countries.
These partners are managed by a hand-picked unit operating out of Paris, where Alliance has been able to build a team that is highly experienced in pharmaceuticals and proficient in many languages.
International is a fast growing part of our business and our success is down to the fact that we approach our relationships with our distributors as true partners. We work together in understanding and responding to the needs of the various markets. We stay close to each other through frequent visits and gathering together for conferences and training events on key products.
With our partners in China and Asia-Pacific, we have been able to benefit from the fast growing economies in this region.
Across our international business, our most important products are Kelo-cote, our class-leading scar reduction product; MacuShield, No.1 recommended supplement by eye experts; Flammazine for preventing infections in serious burns; and Aloclair for mouth ulcers.
MacuShield a dietary supplement derived from the marigold flower (Tagetes Erecta) that combines the three macular carotenoids: Meso-zeaxanthin, Lutein and Zeaxanthin.
Alliance Pharma plc Annual Report and Accounts 201718

70%OF KELO-COTE BRAND REVENUE FROM INTERNATIONAL BUSINESS
25%OF GROUP REVENUE FROM INTERNATIONAL DISTRIBUTOR BUSINESS IN PARIS
Our International business, built on
partnerships with distributors in
100 countries, is a core part of our growth.
Ove
rview
Ad
ditio
na
l info
rma
tion
Gove
rna
nce
Strate
gic R
ep
ort
19
Fina
ncia
l State
men
ts
Strategic Report | Strategy in Action

STRATEGY IN ACTION
Based on a patented silicone formulation, our Kelo-cote scar treatment range is sold in over 65 markets around the world.
OverviewKelo-cote is a range of quick-drying silicone gels for the management and prevention of hypertrophic and keloid scars. By supporting the normalisation of collagen production, it helps to relieve the itching, discomfort and redness associated with scars, as well as helping to flatten and soften raised scars.
Once applied, Kelo-cote forms an invisible and odourless layer over the skin and can be used underneath make-up or sun cream. As well as gel formats with added UV protection, Kelo-cote is available as a spray, which allows the gel to be applied without the need for rubbing or touching, making it particularly useful for large, painful and sensitive scars, or those in hard to reach places.
With the exception of the USA, Alliance owns the global rights to the Kelo-cote trademark. The formulation is patented to 2023, and has FDA approval to make claims that are substantiated with clinical data.
MarketThe global market for scar treatment products is estimated to be worth £600m. The category is expected to grow at around 10% per year, driven by increasing awareness and cultural change. There is also an increasing desire for perfect skin, use of aesthetic surgery and elective C-sections, particularly in Asia Pacific and Latin America. The market is fragmented, but Kelo-cote is among the leading brands on a global basis. There is a great opportunity both to grow the category and to gain share in existing markets and expand into new.
PerformanceEndorsed by Key Opinion Leaders and with a global marketing strategy, Kelo-cote has grown strongly. 2017 sales were £13.3m, and management sees potential to reach £25m within five years.
Growth has been strong in China, Kelo-cote’s largest individual territory, and in the Asia Pacific region more broadly. Distribution was brought in-house in France, Italy and the DACH region (Germany, Austria and Switzerland) as these businesses reached critical mass.
SPOTLIGHT ON KELO-COTE
Alliance Pharma plc Annual Report and Accounts 201720

REVENUES
£13.3m+34%
The global market for
scar treatment products is
estimated to be worth
£600m.
Ove
rview
Fina
ncia
l State
men
tsA
dd
ition
al in
form
atio
nG
ove
rna
nce
Strate
gic R
ep
ort
21Strategic Report | Strategy in Action

STRATEGY IN ACTION
Prescribed by ophthalmologists, MacuShield is the most recommended eye care supplement in the UK and Ireland.
SPOTLIGHT ON MACUSHIELD
OverviewMacuShield is a once-a-day, easy to take, food supplement which combines all three macula carotenoids, Lutein, Meso-Zeaxanthin and Zeaxanthin, in a formula developed in collaboration with leading eye experts. Scientific research shows that these three nutrients are found at the back of the eye, at the macula, where they form the macular pigment. MacuShield is recommended by ophthalmologists as it replenishes the three macular pigments found at the back of the eye.
MarketThe global market for eye health supplements is estimated by Euromonitor to be worth $1.1 billion*. AMD is the most common form of blindness in the Western world, with over 500,000 cases in the UK alone. The total market
grew by 4% in the year to 2016, but the superior qualities of LMZ-based products saw a higher rate of growth for that sub-category.
PerformanceSales of MacuShield grew by 38% in 2017, driven by increased distribution in its domestic market and strong growth in new territories Romania, Serbia and Greece. Alliance has the rights to sell the MacuShield trademark in any market outside of the Americas and the Caribbean. The product is currently sold in 16 markets, and has potential for further expansion to achieve sales of £15m in five years.
* Euromonitor Global Eye Health Supplements, 2016
Alliance Pharma plc Annual Report and Accounts 201722

Sales of MacuShield grew
by 38% in 2017
REVENUES
£7.3m+38%
#1 RECOMMENDED EYE CARE SUPPLEMENT IN UK & ROI
Ove
rview
Fina
ncia
l State
men
tsA
dd
ition
al in
form
atio
nG
ove
rna
nce
Strate
gic R
ep
ort
23Strategic Report | Strategy in Action
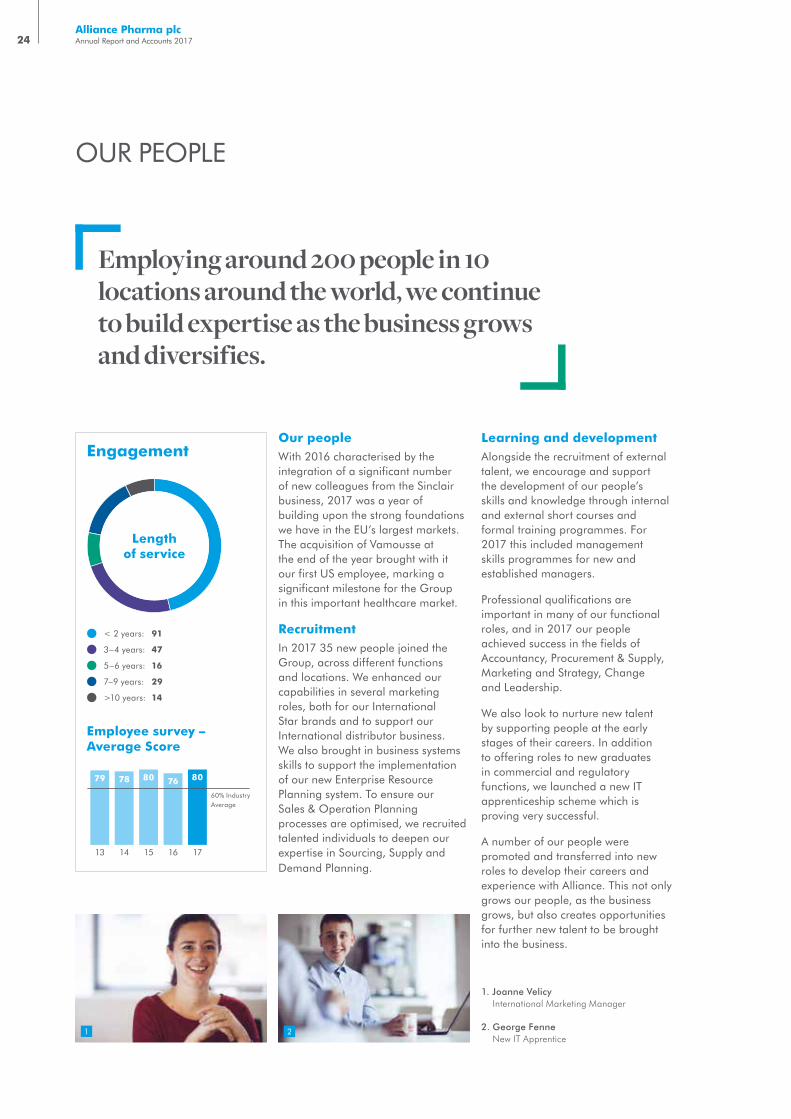
Length of service
OUR PEOPLE
Employing around 200 people in 10 locations around the world, we continue to build expertise as the business grows and diversifies.
Our peopleWith 2016 characterised by the integration of a significant number of new colleagues from the Sinclair business, 2017 was a year of building upon the strong foundations we have in the EU’s largest markets. The acquisition of Vamousse at the end of the year brought with it our first US employee, marking a significant milestone for the Group in this important healthcare market.
RecruitmentIn 2017 35 new people joined the Group, across different functions and locations. We enhanced our capabilities in several marketing roles, both for our International Star brands and to support our International distributor business. We also brought in business systems skills to support the implementation of our new Enterprise Resource Planning system. To ensure our Sales & Operation Planning processes are optimised, we recruited talented individuals to deepen our expertise in Sourcing, Supply and Demand Planning.
Learning and developmentAlongside the recruitment of external talent, we encourage and support the development of our people’s skills and knowledge through internal and external short courses and formal training programmes. For 2017 this included management skills programmes for new and established managers.
Professional qualifications are important in many of our functional roles, and in 2017 our people achieved success in the fields of Accountancy, Procurement & Supply, Marketing and Strategy, Change and Leadership.
We also look to nurture new talent by supporting people at the early stages of their careers. In addition to offering roles to new graduates in commercial and regulatory functions, we launched a new IT apprenticeship scheme which is proving very successful.
A number of our people were promoted and transferred into new roles to develop their careers and experience with Alliance. This not only grows our people, as the business grows, but also creates opportunities for further new talent to be brought into the business.
< 2 years: 91
>10 years: 14
5–6 years: 16
3–4 years: 47
7–9 years: 29
Employee survey – Average Score
14 1613 15 17
Engagement
79 78 80 76 80
60% Industry Average
1. Joanne Velicy International Marketing Manager
2. George Fenne New IT Apprentice
1 2
Alliance Pharma plc Annual Report and Accounts 201724

PRAISE valuesOur company values remain at the forefront of our minds as we deliver our day to day business, and every month we celebrate great examples of our values in practice in our global briefing. The achievements are many and varied; from providing excellent customer service to a concerned patient, to delivery of challenging projects, be they commercial, technical, system and process, or organisational infrastructure.
Our people take pride in what they do, demonstrate an entrepreneurial spirit and work together to achieve more. As an example, we were proud to receive an industry award at the OTC Marketing awards 2018 for Best New OTC Packaging Design for the Lypsyl Mirror Compact. This demonstrated all of our PRAISE values in action for a cross-functional team, working with a number of partners, to develop and launch an innovative, new approach in a competitive market.
Employee satisfactionOur people are committed to and motivated by the success of the company. Although our employee surveys have reflected this consistently, in 2017 we achieved our highest ever rating, with 80% of people positive and motivated in their work. Some aspects reached levels of satisfaction exceeding 90%.
During the year we participated in Britain’s Healthiest Workplace – the UK’s most comprehensive workplace
wellness study – for the first time. In addition to the ability to benchmark against comparable companies, participating employers receive an in-depth report detailing the health profile of their organisation, while employees receive Personal Health Reports. We are proud to have scored among the top quartile in the small business category.
We also drive engagement by working together to achieve more for others. In 2017 we held our biggest ever charity team challenge. Through a range of endeavours, from gym competitions to cycling from our Paris office to our Chippenham UK HQ, we raised over £30,000 for our people’s chosen charity, Sands.
It is this level of engagement that powers Alliance.
3 4
5 6
3. Amanda Sicvol– Country Manager, USA
4. Dean Willacy – Management Accountant Rhodri Smith – Head of Sourcing Tracy Ford Stuart – Demand Manager
5. Vikki O’Sullivan – Customer Service Executive Michael Buswell – Group Finance Manager
Andy Pearce – IT Business Systems & Projects Manager Michelle Newman – Project Coordinator Ranjit Badesha – ERP Report Developer Michael Kilmister – ERP Business Systems Manager
6. Lypsyl Best New OTC Packaging Design award
PERFORMANCEOur high performing people continually drive business success.
INTEGRITYWe build trust in all our relationships through openness and fairness.
REALISMWe set stretching goals and targets we believe are achievable.
SKILLWe recruit highly skilled people and develop their talents to the full.
ACCOUNTABILITYWe take responsibility and deliver what we promise.
ENTREPRENEURSHIPOur people think of the business as if it was their own.
Our PRAISE values
Ove
rview
Fina
ncia
l State
men
tsA
dd
ition
al in
form
atio
nG
ove
rna
nce
Strate
gic R
ep
ort
25Strategic Report | Our People

FINANCIAL REVIEW
Group performanceThe Group achieved a strong financial performance with revenue increasing 6% to £103.3m (2016: £97.5m) and underlying profit before tax increasing 8% to £24.0m (2016: £22.2m).
The Group’s revenue was enhanced by approximately £2.7m due to the weakening of Sterling, primarily against the Euro and US Dollar. However, the effect on operating profits was much lower at approximately £0.3m due to the natural Euro hedge that exists, whereby Euro-denominated movements in sales are matched by corresponding movements in Euro-denominated cost of goods and operating costs.
Gross profit increased at a faster rate than revenue, increasing 8% to £59.0m (2016: £54.8m), resulting in a gross margin up 0.8% for the year to 57.1% (2016: 56.3%). The increase in margin percentage resulting from the performance of our International Star growth brands, Kelo-cote and MacuShield, and we expect this trend to continue in 2018.
As planned, the Group increased investment in sales and marketing during 2017, focussing on our International Star growth brands to support sales growth; this additional spend resulted in an increase in administration and marketing costs (excl. depreciation and amortisation) of £2.4m to £30.8m, representing 29.8% of sales. The IFRS2 share options charge also increased from £0.7m to £1.5m following the increase in employees resulting from the Sinclair acquisition.
Earnings before interest, taxes, depreciation and amortisation (EBITDA), as per note 33, increased by 3% to £26.8m (2016: £26.0m). Excluding the IFRS2 share options charge, EBITDA increased by 6% to £28.2m (2016: £26.7m); maintained at 27% of sales.
Finance costFinance costs reduced by £1.6m on the prior year to £1.8m (2016: £3.4m), due to a reduction in overall gross debt and a release of £0.6m estimated deferred consideration (2016: £0.8m charge).
The average interest charge on gross debt during the year was 2.96%.
TaxationThe total tax credit for the year of £0.5m (2016: £4.1m tax charge) is due to several events occurring in 2017: the enacted reduction in Corporate Income Taxes in the US and France reducing our deferred tax balances relating to intangible assets held in these jurisdictions, and the £5.0m compensation from Sinclair in respect of Kelo-stretch. As illustrated in note 33, excluding the impact of these events and the residual impact of the UK rate reduction results in a revised underlying tax charge of £4.8m, representing an effective tax rate (ETR) of 19.8%. This revised ETR is in line with expectations and better reflects the Group’s underlying ETR for the foreseeable future.
Sinclair settlementAs announced on 21 March 2017, the Group reached agreement with Sinclair Pharma plc in connection with the material reduction of business
Key Financial Highlights• Revenue up 6% to £103.3m
(2016: £97.5m)
• PBT up 8% to £24.0m (2016: £22.2m)
• Free cash flow up 67% to £21.7m (2016: £13.0m)
• Net debt reduced to £72.3m (2016: £76.1m), whilst investing £16.0m in acquisitions
• Dividend up 10% to 1.331p (2016: 1.210p)
The Group achieved a strong financial performance with revenue increasing 6% to £103.3m (2016: £97.5m), underlying profit before tax increasing 8% to £24.0m (2016: £22.2m) and free cash flow increasing 67% to £21.7m (2016: £13.0m).
Alliance Pharma plc Annual Report and Accounts 201726

in Kelo-stretch, acquired in 2015. The terms of the compensation agreement were a £4.0m cash payment to Alliance (received in April 2017) and a deferred cash payment of a further £1.0m to be paid on or before 30 June 2018.
Net compensation of £4.4m is recognised as non-underlying exceptional income in the Income Statement, representing the £5.0m settlement net of an impairment charge for Kelo-stretch and associated costs of £0.6m.
Earnings per shareReported basic earnings per share increased 58% to 6.10p (2016: 3.85p) due primarily to the Sinclair settlement and the impact of the reduction in US tax rate.
Adjusting underlying basic earnings per share to exclude non-underlying items and the effect of tax rate changes, this metric increased by 10% to 4.06p (2016: 3.69p). The increase reflects the Group’s higher underlying profit after tax and is the measure used by the Board and Management in assessing earnings performance.
DividendThe Directors propose to maintain a progressive dividend policy and are recommending a final payment of 0.888p per ordinary share to give a total for the year of 1.331p. This represents an increase of 10% on 2016.
The final dividend, subject to approval at the Company’s AGM on 24 May 2018, will be paid on 11 July 2018 to shareholders on the register on 15 June 2018.
The level of dividend cover in 2017 remained prudent at over three times. The total dividend payment for 2017, including the £2.1m interim payment, will be £6.3m.
Intangible assetsIntangible assets increased by £13.8m to £278.6m (2016: £264.8m) due to the acquisition of the worldwide rights to Ametop announced on 1 December 2017 for $7.5m (£5.6m); the acquisition of the worldwide rights to Vamousse announced on 28 December 2017 for estimated consideration of $15.5m (£11.6m); and £0.5m of development costs; less foreign exchange adjustments of £3.4m; and also less the £0.5m impairment for Kelo-stretch described above.
Cash flow and net debtDemonstrating the strong cash generative nature of the Group, free cash flow (defined as cash generated from operating activities (excluding non-underlying items) less interest, tax and capital expenditure) increased 67% in 2017 to £21.7m (2016: £13.0m).
The increase is driven by the trading strength of the Group and the stabilising of working capital in 2017 following its build-up in 2016 after the Sinclair acquisition.
The Group’s strong underlying cash generation, together with the £4.0m settlement claim receipt from Sinclair, resulted in a reduction in the Group’s net debt to £72.3m as at 31 December 2017 (31 December 2016: £76.1m) despite the £16.0m investment in acquisitions.
Consequently, adjusted net debt/EBITDA leverage fell to 2.46 times (2016: 2.83 times) against our covenant limit of 3.0 times (31 December 2016: 3.0 times). As announced in December, we renegotiated our banking covenants, and our net debt to EBITDA covenant has been increased from 2.5x to 3.0x for the life of the credit agreement through to December 2020. Excluding the acquisitions completed in December 2017, our leverage at 31 December 2017 would have been 2.06 times.
Based on current business performance and excluding any acquisitions we may make during the year, we expect leverage to continue to reduce during 2018 to below 2.0 times by the end of the 2018 financial year.
The Group has total bank facilities of £100m of which £50.3m (31 December 2016: £66.5m) was drawn on the Term Loan with £34.0m (31 December 2016: £18.0m) utilised from the Revolving Credit Facility. In addition to this, the Group also has access to a £4.5m working capital facility, which was undrawn at 31 December 2017, and an additional undrawn £25.0m facility available with bank approval.
Going concernAs described above, the current rate of cash generation by the Group comfortably exceeds the capital and debt servicing needs of the business. The Board remains confident that all the bank covenants will continue to be met and the Group will be able to meet its working capital needs for at least the next 12 months. For this reason, the Directors continue to adopt the going concern basis in preparing the financial statements.
Andrew FranklinChief Financial Officer
27 March 2018
Ove
rview
Fina
ncia
l State
men
tsA
dd
ition
al in
form
atio
nG
ove
rna
nce
Strate
gic R
ep
ort
27Strategic Report | Financial Review

RISK MANAGEMENT AND INTERNAL CONTROLS
Risk managementThe Board, assisted by the Audit & Risk Committee, is ultimately responsible for overseeing management’s activities in identifying, evaluating and managing the risks facing the Group. Where these risks are not ones which the Board is prepared to take, these are avoided, eliminated as far as possible and/or transferred to insurers.
In 2017, the Group completed the development and introduction of a new process for the identification, assessment and management of risks in the business, which is driven and monitored by the Senior Leadership Team with the support of the Company Secretary.
There are risk registers in place at a departmental and functional level. Risks are identified and assessed by the likelihood of them occurring and their potential impact on the business. These are then categorised to identify those that can be effectively managed at a functional or departmental level and those that need to be addressed
at a cross-functional business level. Existing mitigations are considered for each risk and the residual levels of exposure assessed. Each risk is allocated a business owner, who is responsible for implementing the mitigating actions and reporting on progress with those improvements and the status of the risk to the Senior Leadership Team. The Senior Leadership Team reviews all identified risks on a quarterly basis, with the principal risks being monitored monthly and, in the case of principal risks and uncertainties, such risks are reported to and reviewed by the Audit & Risk Committee and the Board.
Our approach to risk
IdentifyThe existence of a risk is identified from either a ‘bottom-up’ process involving line management or a ‘top-down’ review by the Senior Leadership Team.
ReportThe Senior Leadership Team reviews all identified risks on a quarterly basis, with the principal risks being monitored monthly and, in the case of principal risks and uncertainties, such risks are reported to and reviewed by the Audit & Risk Committee and the Board.
AssessThe likelihood and impact of each risk is assessed to calculate the potential level of exposure on the business.
MitigateActions being taken to help mitigate and reduce the potential exposure to the risks are regularly reviewed to ensure actions remain effective.
ReviewRisk registers are regularly reviewed to capture and identify new risks and identify opportunities to improve the mitigating actions.
At a global level, Alliance Pharma plc recognises that it is essential that we actively manage our risks and opportunities. This means balancing risks and opportunities to not only meet the Group’s strategic objectives and deliver value to our shareholders but to do so in a sustainable and considered way. We remain focused on our values and believe that adopting responsible behaviour across our business activities plays an important part in achieving our purpose.
Alliance Pharma plc Annual Report and Accounts 201728

Internal controlsThe Group maintains systems of internal control appropriate to a business of this size and complexity and which includes taking into account the applicable requirements of pharmaceutical regulators in the various markets in which the business operate.
The key components of the current system of internal control are:
• Setting and communicating clear strategic goals
• Developing business plans and budgets in line with strategy, supported by intra-year forecasting
• Regular reporting of actual performance relative to those strategic goals, plans, budgets and forecasts
• Working within a defined set of delegated authorities approved by the Board to the CEO, and through him, to the Senior Leadership Team and their delegates through authorisation registers managed at a departmental and functional level
• Creating an appropriate structure of responsibility and accountability, including segregation of duties, appropriate reporting lines for key managers and regular line management communications and 1:1 meetings where performance is discussed, supported by an appraisal process
• The Audit & Risk Committee reviews the systems of internal control for the Group alongside the Group's process for risk management and reports its findings to the Board
Enterprise Resource Planning SystemTo further enhance the Group’s systems of internal control, a new enterprise resource planning system (Microsoft Dynamics AX) is expected to be implemented by the end of 2018. Once the installation is complete it will support systems of control relating to the Group’s sourcing, distribution, sales and accounting processes as well as provide significantly enhanced management information and an enhanced internal control environment.
The Group does not intend to customise the base system, thus retaining the strong control environment inherent in this market-leading product. The implementation of the ERP system also provides an opportunity to review processes and reporting practices throughout the Group.
Each year, the Audit & Risk Committee and the Board separately consider the need for an internal audit function and given its current size, does not judge it appropriate to maintain a dedicated internal audit function. This position is kept under review.
Ove
rview
Fina
ncia
l State
men
tsA
dd
ition
al in
form
atio
nG
ove
rna
nce
Strate
gic R
ep
ort
29Strategic Report | Risk Management and Internal Controls

OUR PRINCIPAL RISKS AND UNCERTAINTIES
The Board has assessed what it believes are the principal risks facing the Group, being those that could threaten our business model, reputation, future performance, solvency or liquidity of the business, and these have been linked to the key elements of our strategy as described on pages 14 and 15. The risks have been assessed on a residual basis according to our current view of their potential severity (being the combination of impact and
probability), assuming that existing internal controls and strategies for mitigation are and remain effective.
The table below is not an exhaustive list of all risks the Group faces but are the principal risks and uncertainties (which the directors believe include all known material risks in relation to the Group and the markets and industry within which we operate. The environment in which we operate is constantly evolving and can be
affected by externalities that are outside of our control and which may impact on us operationally. New risks may arise, the potential impact of known risks may increase or decrease, and/or our assessment of these risks may need to change. We have explained how each risk is being managed or mitigated. Our approach to risk management has been explained on pages 28 and 29.
As we continue to grow as a business, the risks we face continue to be carefully managed.
Market competition – the products we buy/sell are subject to the market forces of supply and demand and new competition
Link to strategy Risk description and impact Management and mitigation Trend
Maximising and extending brand potential International expansion
The products we sell are subject to normal market forces, so demand may fall, our products may face new or increased competition or the price we can achieve may be reduced.
Our inability to generate profits from sales, or to convert those profits into cash flow result in insufficient cash to reinvest into the business, or to service our debt or equity capital. Any inability to generate cash would impact on our liquidity and could lead to non-compliance with the covenants to which our debt facilities are subject or our ability to maintain dividend payments.
Competition comes from several different sources. The Group has to ensure it has adequate resources to respond to any increased competition which includes new entrants into UK or overseas markets.
These risks have the potential to compromise our future performance and, in an extreme scenario, cash generation.
– The Group constantly monitors that marketing campaigns deliver to support the strategy.
– We continue to monitor and regularly forecast sales, costs, profits and cash flows.
– We have a model for debt covenant compliance and where necessary, mitigating actions could be taken to ensure we remain within our debt covenants and are able to meet scheduled payments and therefore our liabilities.
This risk has not changed materially since last year.
Alliance Pharma plc Annual Report and Accounts 201730

Continued expansion and growth of the business
Link to strategy Risk description and impact Management and mitigation Trend
Maximising and extending brand potential International expansion
There can be no guarantee that the Group will be able to identify suitable targets to continue its expansion. The market for high quality products (whether bedrock or growth) is highly competitive and the Group may find itself unable to compete in such a market if the pricing of such targets proves prohibitive.
As the Group looks to increase the size of its targets, the complexity around acquisition and integration of such targets can also increase. The financial impact of such potential risks (unidentified risks during due diligence, external advisers, additional staff etc) could impact on the profitability of such targets and the Group as a whole.
– Pipeline – We monitor the market for attractive acquisitions to develop a pipeline of opportunities that we could potentially bring into our portfolio of products thereby ensuring that we remain competitive in the industry. Our dedicated Corporate Development Team has many years’ experience in identifying and completing transactions, as well as a wide network of contacts in both medium and big pharma.
– Integration – continue to ensure that we integrate acquisitions into the business in an effective, and efficient manner, with an experienced due diligence and integration team within the various functions.
– Business development skills and expertise have been bolstered by new in-house legal counsel with many years’ experience in M&A transactions.
This risk has not changed materially since last year.
Supply chain, sourcing and logistics – potential constraints on our ability to supply and deliver products to our customers
Link to strategy Risk description and impact Management and mitigation Trend
Maximising and extending brand potential
Manufacturing, sourcing or distribution issues, including an inability to increase production volumes to meet demand or failing to create demand for forecast and manufactured production volumes, impinges on our potential sales. These risks have the potential to compromise our future performance and, in an extreme scenario, cash generation.
The products we sell could risk losing their regulatory approval in the relevant territory or could become subject to public procurement processes resulting in constraints on either our ability to supply or the prices that can be achieved.
– We have developed forecasting systems that allow us to work with our contracted manufacturers to ensure production volumes meet our ability to supply products.
– Where necessary and appropriate, we ensure that the investment in capacity or sourcing of components from within our supply chain is increased.
– Generally, we ensure sufficient stock is held in the supply chain for most products. This is bolstered by the dual sourcing of our brands where it is deemed appropriate. The diversification through selling a wide range of products, many of which do not require regulatory approval, or are not subject to public procurement processes.
– Our experienced technical and regulatory staff build and maintain their knowledge of the public-sector procurement process.
This risk has not changed materially since last year.
Ove
rview
Fina
ncia
l State
men
tsA
dd
ition
al in
form
atio
nG
ove
rna
nce
Strate
gic R
ep
ort
31Strategic Report | Our Principal Risks and Uncertainties

Product regulation – our products are subject to UK and overseas regulatory requirements
Link to strategy Risk description and impact Management and mitigation Trend
Maximising and extending brand potential
Some of our products may not gain regulatory approval or could face risk of having their regulatory status challenged or adversely altered. This could affect the group’s ability to launch any new products or expand geographically. These risks have the potential to compromise our future performance and, in an extreme scenario, cash generation.
– The business allocates significant and experienced resources to supporting the regulatory approval of products, including any extensions to other markets.
– The business engages in regular discussions with local regulatory advisers (internal and external) to monitor any products that may be subject to challenge.
This risk has not changed materially since last year.
Attraction and retention of key employees – losing good people to competitors or failing to recruit qualified people
Link to strategy Risk description and impact Management and mitigation Trend
Investing in people Competitor’s may try to recruit some of our key employees. The business recruits and is dependent on certain key executive employees. Whilst the business has entered into employment arrangements with the view of securing their service we cannot guarantee their retention which means we run the risk of losing good people, and with it their knowledge, skills and expertise.
Working at an international level means we must be able to access good qualified people to support the business both from the UK and in our overseas territories. Changes in political landscapes, and local rules and regulations can have an impact on our ability to recruit foreign nationals.
The loss of those employees could weaken the Group’s management capabilities, impacting on our day-to-day operations.
– The Group is committed to putting in place incentive and reward structures that are regularly reviewed to ensure we remain a competitive employer.
– We ensure that roles and responsibilities are clearly defined and are supported by documented systems and procedures to provide a level of continuity in the event an employee moves on in their career.
– We work with international and local country agencies to ensure we find and recruit good quality employees. Working with existing foreign nationals based in the UK to support their employment in the Group, as the political landscape changes.
– Induction and training for new employees – the Group has a structured and wide-ranging induction process for new joiners to ensure that they understand the Group, its business and how important the role they will play is within the Group. This has helped nurture a positive team and work ethic within the Group.
This risk has not changed materially since last year.
OUR PRINCIPAL RISKS AND UNCERTAINTIES CONTINUED
Alliance Pharma plc Annual Report and Accounts 201732

Group-wide financial, legal and regulatory compliance – failing to meet legal or regulatory compliance
Link to strategy Risk description and impact Management and mitigation Trend
Maximising and extending brand potential
As we enter new territories and overseas markets, the risks we are exposed to in those overseas territories and markets means we could be subject to matters such as bribery and corruption.
The Group operates in a highly regulated sector and in markets and geographies around the world each with differing requirements. As a result, and in the normal course of business, the Group can be subject to several regulatory inspections/investigations on an ongoing basis. It is therefore possible that the Group may incur penalties for non-compliance and potentially impact on the sales of our products and cause damage to our brands and our reputation.
In addition, several of the Group’s brands and products are subject to pricing controls and other forms of legal or regulatory restrictions from both governmental/regulatory bodies and also from third parties.
The Group has ongoing regulatory requirements (pharmacovigilance etc) which could, if not adhered to, lead to substantial fines and impact on the group’s ability to sell certain products.
As the Group expands its operations, the general tax environment in which it operates becomes more complex and the risk to incorrectly report and pay relevant taxes increases.
– The business carries out careful assessments with its legal, commercial and operational teams, to determine whether to recognise a provision in respect of these matters. These judgements are often complex and rely on estimates and assumptions as to future events.
– In-house legal function has been bolstered in order to increase the internal management of legal compliance.
– The Group has engaged external consultants to implement control improvements using current systems. This will be further supported by the introduction of the new ERP system which will assist with supply chain management.
– Third party experts are engaged in our overseas territories to help us comply with local rules and regulations and ensure that our operations are monitors against them. We request training and support from service providers (UK and overseas) to widen internal knowledge for our employees for legal and regulatory issues.
– Induction and training for new employees – the Group has a structured and wide-ranging induction process for new joiners to ensure that they understand their individual, and the Group’s, obligations in relation to such matters as adverse event reporting. Furthermore, the Group has a programme of periodic training around legal and regulatory compliance.
This risk has not changed materially since last year.
Ove
rview
Fina
ncia
l State
men
tsA
dd
ition
al in
form
atio
nG
ove
rna
nce
Strate
gic R
ep
ort
33Strategic Report | Our Principal Risks and Uncertainties

Foreign exchange risk – volatility in reported profits
Link to strategy Risk description and impact Management and mitigation Trend
International expansion
The Group now earns a proportion of its profits in currencies other than sterling, but accounts for the business in sterling. The reporting of profits earned outside the UK may therefore become more volatile. In an extreme scenario, were exchange controls imposed it may become difficult or even impossible to repatriate cash earned in some markets.
The risk is primarily to reported profits rather than cash, but in an extreme scenario could compromise our cash generation and liquidity position.
The Group is funded by a combination of sterling-, dollar- and euro-denominated debt, which provides a natural hedge to some of these exposures. In addition, we can use financial instruments such as forward contracts, to help manage these risks.
This risk has not changed materially since last year.
Product liability – defective products etc
Link to strategy Risk description and impact Management and mitigation Trend
Maximising and extending brand potential
The Group produces a wide range of medicines, medical devices, food supplements and cosmetics. There are inherent risks that some of these products could cause adverse reactions exposing the Group to the risk that (i) the product must be withdrawn from sale and (ii) that we may have legal liability to those injured by that product.
These risks have the potential to damage our reputation and compromise our future performance and, in an extreme scenario, liquidity position or even solvency.
– Dedicated in-house Quality function, supplier audits.
– The Group’s products are well tolerated, and many have been in existence for decades.
– All products have regulatory approval in the markets we trade in.
– We also carry public and products liability insurance to provide a level of protection for the Company.
This risk has not changed materially since last year.
Information security and data protection
Link to strategy Risk description and impact Management and mitigation Trend
Maximising and extending brand potential
We hold significant amounts of confidential data on our customers and employees. Some of that data is being collected via our transaction processes, which includes financial information and other personal data. A failure to abide by data protection rules or incur a breach of data security could post a financial and reputational risk to the Group.
We co-ordinate a complex supply chain with many contract manufacturers, logistics intermediaries and distributors, all of which rely on the availability of our IT systems. In addition, we sell some products directly through our website and therefore hold some customer data, the loss of which (whether accidental or following hacking) would cause disruption and cost to the Group.
As the Group now supplies a wider range of products and has become more geographically diverse, it is more reliant on its IT systems, so this risk is increasing.
These risks are likely to be short-term in nature, but could affect our performance and, potentially, cash generation. There would also be a reputational impact if we suffered a major loss of personal data.
– The Group has a range of measures in place to monitor and mitigate this risk including anti-virus software, firewalls and network segmentation that are regularly updated; regular introduction of more up to date software also provides additional in-built security; and incident management, business continuity management and IT disaster recovery plans are in place.
– Appropriate physical and cyber security measures are in place to prevent unauthorised access to information.
– We provide training and alerts to staff members to ensure that they are fully aware of technical data protocols.
– Third parties are engaged to review and recommend ongoing improvements to enhance IT security and resilience.
This risk has increased since last year
Expanded to consider the impact and changes required under wider data protection changes in 2018.
OUR PRINCIPAL RISKS AND UNCERTAINTIES CONTINUED
Alliance Pharma plc Annual Report and Accounts 201734

Business systems – ERP and other systems
Link to strategy Risk description and impact Management and mitigation Trend
Integrating acquired products and companies
Maximising and extending brand potential International expansion
There is always a risk to our business systems that means we could lose functionality, end up with corrupted files or suffer errors in our master data systems.
The ERP system may not be implemented on time, fails to work as intended or deliver the expected benefits. In addition, while this is expected to improve the internal control environment, the transition from, and eventual removal of, legacy IT systems creates continuity risks. In addition, the design and implementation of new operating practices and culture needed to bring the ERP system into full effect creates further risk to the Group’s business.
These risks have the potential to compromise our future performance and, in an extreme scenario, cash generation.
– The Group continues to invest in its systems generally and has also introduced an IT Steering Group to provide oversight of core systems across the business and lead on changes required as a result of systems development or regulatory changes.
– We have selected an ERP system with a good track record and an experienced company to support Alliance in the implementation through a structured process, developed a carefully-considered project plan, hired experienced project managers and released staff from their normal roles to focus on the project.
– The project continues to have the support of the Board and the Audit & Risk Committee and is regularly reviewed by the Senior Leadership Team and reported on at Board level.
– We continue to work towards successful implementation of the ERP system alongside stringent testing before retiring the legacy systems.
This risk has not changed materially since last year.
Business continuity – the ability to continue operating in the event of extreme events
Link to strategy Risk description and impact Management and mitigation Trend
Sustained growth As with many businesses, we are at risk of problems affecting our ability to continue operations because of extreme events. This could be an event that affects our people, operational sites, offices or equipment and systems, which would prevent our business from functioning as normal.
– The Group has implemented and continues to monitor the suitability of disaster recovery plans to ensure an ability to continue with its operations in the event of a disruption to any of its operating facilities or systems.
– We use third parties to support and review resilience of our operating platforms and recommendations are implemented as appropriate.
This risk has not changed materially since last year.
Political uncertainty – Brexit
Link to strategy Risk description and impact Management and mitigation Trend
Sustained growth The business, its management and employees are all aware of the potential risks and uncertainties created as a result of the UK’s vote to leave the EU (Brexit). The potential impact of Brexit affects aspects across our business, including product regulation, ability to trade cross-border, ability to continue to supply under existing terms, and our ability to recruit foreign nationals to work with us in the UK.
– The business continues to monitor the developments affecting our industry and markets and we contemplate ‘what-if’ strategies where we have been alerted to potential changes that could occur.
– The Group has established an internal Brexit Strategy Group to actively manage this uncertainty.
This risk has not changed materially since last year.
Ove
rview
Fina
ncia
l State
men
tsA
dd
ition
al in
form
atio
nG
ove
rna
nce
Strate
gic R
ep
ort
35Strategic Report | Our Principal Risks and Uncertainties

Building our performance
through M&A
Alliance Pharma plc Annual Report and Accounts 201736

With 35 acquisitions in 20 years, our model of identifying, acquiring and integrating assets is well established.
Governance38 Board of Directors 40 Corporate Governance44 Remuneration Report47 Directors’ Report
37Governance
Ove
rview
Fina
ncia
l State
men
tsA
dd
ition
al in
form
atio
nG
ove
rna
nce
Strate
gic R
ep
ort

BOARD OF DIRECTORS
David CookIndependent Non-Executive Chairman
David joined the board of Alliance as a non-executive director in 2014 and was appointed Chairman of the Board on 1 March 2018. He is currently Chief Financial Officer and an Executive Director of Ellipses Pharma, a global cancer drug development company, and was previously Chief Financial Officer and Chief Business Officer of Biotie Therapies Corp, a drug development company quoted in Helsinki and on NASDAQ. He has previously held senior financial positions with Jazz Pharmaceuticals International, EUSA Pharma and Zeneus Pharma. David qualified as a chartered accountant with PricewaterhouseCoopers after graduating in chemistry from the University of Oxford.
David has extensive experience of financial and general business management (including the implementation of buy and build strategies) in the life sciences sector, of financing those businesses and managing investor relations across a number of stock markets globally.
Biographical details of the Directors in office at the date of this report, all of whom held office throughout the year, are set out below.
Committee Membership key
Nomination Committee
Remuneration CommitteeAudit & Risk Committee
Committee Chair
Peter ButterfieldExecutive Director, Deputy Chief Executive Officer
Peter joined the board of Alliance in 2010 with the acquisition of Cambridge Laboratories where he spent five years, latterly as UK Commercial Director. Peter was previously the company’s Chief Commercial Officer and was appointed to his present office in June 2017. He served eight years as a Board Member of the Association of the British Pharmaceutical Industry and was an integral part of the 2014 PPRS negotiation team with the UK Government. Prior to joining Cambridge Laboratories, Peter spent six years at GlaxoSmithKline in a variety of marketing and sales roles. He holds an honours degree in Pharmacology from the University of Edinburgh.
Peter has significant commercial experience in the life sciences sector and strong leadership experience gained in a variety of contexts.
Peter will take over as CEO on 1 May 2018.
John DawsonExecutive Director, Chief Executive Officer
John founded Alliance in 1996. He gained multi-disciplinary experience in the pharmaceutical industry over thirty years, including various senior roles at Sandoz (now Novartis AG) as Director of Finance and Administration and Deputy Managing Director. John has a BSc (Pharmacy) and an MSc (Finance) from the London Business School.
John’s vast industry and managerial experience has equipped him to provide the leadership that has enabled Alliance to transform from an entrepreneurial start-up to a well-managed and fast growing international pharma company.
John will step down from the CEO role on 1 May 2018 and become a Non-Executive Director of the Company.
Alliance Pharma plc Annual Report and Accounts 201738

Andrew FranklinExecutive Director, Chief Financial Officer
Andrew joined Alliance in September 2015 from Panasonic Europe Ltd, where he was General Manager, European Tax and Accounting. From 2010 to 2012 Andrew was Finance Director and Company Secretary of Genzyme Therapeutics Ltd, the UK & Ireland subsidiary of Genzyme Corporation. Prior to that, he gained 12 years’ pharmaceutical experience with Wyeth in a variety of senior financial positions. Andrew holds an honours degree in Civil Engineering from the University of Wales, Cardiff.
Andrew is a Fellow of the Institute of Chartered Accountants in England and Wales with extensive experience of financial management of international businesses, including significant prior experience in life science companies.
Thomas CasdagliNon-Executive Director
Thomas joined the board of Alliance as a non-executive director in 2009. He is a partner at MVM Partners LLP, a healthcare private equity firm, and has been an active investor in the sector since 2002. Before joining MVM, Thomas worked at PricewaterhouseCoopers LLP where he qualified as a Chartered Accountant. Thomas graduated in Molecular and Cellular Biochemistry from the University of Oxford.
Thomas brings extensive experience in the evaluation and financing of life sciences businesses and in the investment management sector to the board. He was nominated as a director by MVM under an agreement entered into in 2009 and, provided he remains connected with MVM, will continue to hold office while they hold more than 9% of the company’s equity.
Nigel CliffordIndependent Non-Executive Director
Nigel joined the board of Alliance as a non-executive director in 2015. He is currently chief executive officer of Ordnance Survey and formerly a non-executive director of Anite plc. He has previously held Chief Executive and senior positions at Procserve Holdings, Micro Focus International plc, Nokia, Symbian Software, Tertio Telecoms, Cable and Wireless plc, Glasgow Royal Infirmary NHS Trust and BT plc. Nigel graduated in Geography from the University of Cambridge and has an MBA from Strathclyde University.
Nigel brings significant experience of the strategic and commercial management of complex global businesses, gained in a variety of industry sectors and under a variety of ownership structures.
Peter Butterfield, John Dawson and David Cook.
39
Ove
rview
Fina
ncia
l State
men
tsA
dd
ition
al in
form
atio
nG
ove
rna
nce
Strate
gic R
ep
ort
Governance | Board of Directors

CORPORATE GOVERNANCE
Chairman’s introduction to Governance at Alliance Pharma plcAs Chairman, I am pleased to introduce this section of the annual report. Governance continues to be crucial to any company’s future development. Your Board recognises that good governance can help create value by reducing the risks that we face as we seek to create value for our shareholders and can be used to support our values and behaviours.
As an AIM quoted company, Alliance Pharma plc has chosen to follow the QCA’s Corporate Governance Code for small and mid-size quoted companies 2013 (the ‘Code’). The Board believes that this provides an appropriate and suitable governance framework for a group of our size and complexity. Alongside this, we monitor developments in the UK Corporate Governance Code, applicable to listed companies traded on the main market, to keep abreast of best practice but we are not required to apply it.
A good governance framework can provide solid foundations from which to support leadership, accountability, transparency and disclosure. Strong systems and processes for informed decision-making ensures that the Board and its Committees are provided with clear agendas, timely information that is delivered through good quality briefing materials; and, which cover all relevant factors and that our deliberations consider the risks, as well as the opportunities, inherent in the topic before us.
On 1 March 2018, we announced Andrew Smith’s departure from the Company. As Chairman I will oversee all matters relating to good governance. The Nominations Committee and the Board is mindful of the current composition and membership of the Board and all of the Committees and we are working with advisers to ensure we continue our succession planning and search for high-calibre individuals to join our Board and management team who possess the right skills and experience necessary to complement our Board. Having a Board that consists of Directors drawn from a range of backgrounds, skills and experience ensures we are able to continue to take decisions in the interests of all stakeholders and good governance plays a vital part in helping support the Company’s growth strategy and in turn its long-term success.
As we continue to deliver on our strategy and grow as a business, we have been focussed on our systems of risk management and internal controls. We are now in the final stages of implementing and rolling out a Group-wide Enterprise, Resource and Planning system designed to embed and systematise controls to support the business, and we have implemented a revised risk management system, managed by the Senior Leadership Team and reporting directly to both the Board and Audit & Risk Committee.
Details of our principal risks and uncertainties can be found on pages 30 to 35.
The remainder of this section provides an update of our Corporate Governance, the Remuneration Report and the Directors’ Report. In these reports we set out our governance structures and explain how we have applied the Code during the year under review.
Thank you for your continued support and the Board looks forward to meeting any shareholder who can join us at our Annual General Meeting on 24 May 2018.
David CookChairman
Alliance Pharma plc Annual Report and Accounts 201740

Board and Committee balance, compositionThe Board currently comprises six Directors, being the Chairman, three Executive Directors and three Non-Executive Directors (including the Chairman). The Board keeps under review its current balance of composition, which provides a sufficiently wide range of skills and experience to enable it to pursue its strategic goals and to address anticipated issues in the foreseeable future. Its deliberations are not dominated by one person or a group of people.
Having considered the guidelines on independence, on appointment as Chairman, David Cook was independent and continues to be regarded by the Board as independent alongside Nigel Clifford. While Thomas Casdagli fulfils his duties to the Company in an exemplary way and demonstrates independence of character and judgement, since he was nominated as a Director by a significant shareholder, the Board does not therefore regard him as independent.
The Board is comfortable with the current composition of the Board however, as part of the on-going succession planning, which includes the changes which are coming into effect on 1 May 2018, the Board continues, with the advice Nominations Committee, to consider any additions to the Board to further broaden the experience and effectiveness of the Board as the Group continues to grow. As part of this process the Board has also considered and concluded that, the appointment of Senior Independent Director was not necessary at this time but keeps this issue under review.
Board supportThe Company Secretary plays a vital role in ensuring good governance, assisting the Chairman. On behalf of the Chairman, Chris Chrysanthou is responsible for ensuring that all Board and Committee meetings are conducted properly, that the Directors are properly briefed on any item of business to be discussed and for
ensuring that governance requirements are considered and implemented and for accurately recording each meeting.
Procedures are in place for distributing meeting agendas and reports so that they are received in good time, with the appropriate information. Ahead of each Board meeting, the Directors each receive reports which include updates on finance and monthly management accounts, operations including regulatory, commercial activities, business development, risk management, legal and regulatory, HR and investor relations issues.
The Directors may have access to independent professional advice, where needed, at the Group’s expense.
Leadership: Roles and ResponsibilitiesResponsibilities of the BoardThe Board is responsible to the Company’s shareholders for:
• Setting the Group’s strategy
• Maintaining the policy and decision-making process through which the strategy is implemented
• Checking that necessary financial and human resources are in place to meet strategic aims
• Providing entrepreneurial leadership within a framework of good governance and sound risk management
• Monitoring performance against key financial and non-financial indicators
• Overseeing the systems of risk management and internal control
• Setting values and standards in corporate governance matters.
There is a formal list of matters reserved for the Board, which may only be amended by the Board.
Chairman and Chief Executive Officer (CEO)The respective responsibilities of the Chairman and CEO are very clearly understood. The Chairman is responsible for leading the Board, facilitating the effective contribution of all members and ensuring that it
operates effectively in the interests of the shareholders. The CEO is responsible for the leadership of the business and implementation of the strategy.
Non-Executive DirectorsThe role of our Non-Executive Directors is to:
• Challenge constructively and help develop proposals on strategy
• Satisfy themselves as to the integrity of the financial reporting systems and the information they provide
• Satisfy themselves as to the robustness of the internal controls
• Ensure that the systems of risk management are robust and defensible
• Review corporate performance and the reporting of such performance to shareholders.
Each of the Non-Executive Directors sits on the Nominations and Remuneration Committees, enabling them to have a role in determining the pay and benefits of the Executive Directors and to play a key role in planning Board succession including the appointment and, if necessary, removal of Executive Directors.
In addition, each independent Non-Executive Director sits on the Audit & Risk Committee, enabling them to review internal control and financial reporting matters at first hand, and have a direct relationship with the external auditors.
Board and Committee meetings and attendance The Board and its Committees meet regularly on scheduled dates, including a two-day strategy meeting each year which is also attended by senior executives of the Group, the purpose of which is to review progress in delivering agreed plans and to develop and settle the Group’s business plans and long-term strategic targets and set the framework for the achievement of those goals. During 2017 the Board held eleven scheduled meetings, with a number of additional ad-hoc meetings to discuss specific issues or grant formal approvals of non-substantive matters.
41
Ove
rview
Fina
ncia
l State
men
tsA
dd
ition
al in
form
atio
nG
ove
rna
nce
Strate
gic R
ep
ort
Governance | Corporate Governance

CORPORATE GOVERNANCE CONTINUED
Leadership: Roles and Responsibilities continuedBoard and Committee meetings and attendance continuedIn leading and controlling the Company, the table below sets out the total number of meetings held by the Board and its Committees and records attendance by each member eligible to attend during the year ended 31 December 2017:
BoardAudit
CommitteeNomination Committee
Remuneration Committee
No. of scheduled meetings 11 3 3 4
DirectorsAndrew Smith1 11 3 3 4Peter Butterfield 11 – – –Thomas Casdagli 11 – 3 4Nigel Clifford 10 2 3 4David Cook 11 3 3 4John Dawson 11 – – –Andrew Franklin 11 – – –
1 Andrew Smith resigned from the Board on 1 March 2018.
Board Effectiveness ReviewIt is the Company’s policy that a Board effectiveness review is undertaken biennially, with the next one due in 2018. Generally, any such review is done in the form of a structured questionnaire circulated to all Directors, asking them to rate the Board’s performance in a number of strategically important areas and provide a rationale for their view. Results and outcomes are analysed by the Company Secretary and Chairman and any key themes are reported and discussed with the Board. Any recommendations arising from such review which are designed to specifically address any issues identified are implemented by the Board.
DiversityThe Board is aware of the continued focus on diversity in relation to Board and senior management appointments, which tends to focus on gender and race. The Company and the Board always seeks to search for, recruit and appoint the best available person on the basis of aptitude and ability, regardless of sex, marital or civil partnership status, race, colour, nationality, ethnic or national origins, pregnancy, disability, age, sexual orientation, religion, belief or gender reassignment.
Board CommitteesThe Board has delegated and empowered an Audit & Risk Committee, a Nominations Committee and a Remuneration Committee, each of which is accountable to the Board on all matters within its remit. Each committee has written terms of reference, which are available on the Company’s website. A summary of the responsibilities of each committee and their work during the year follows.
Remuneration CommitteeThe role of the Remuneration Committee is to review and determine on behalf of the Board the pay, benefits and other terms of service of the Executive Directors of the Company and the broad pay strategy with respect to other senior executives. The terms of reference of the Remuneration Committee are available on the Company’s website. In addition to general matters within its remit, the Remuneration Committee was involved in the succession planning process and the remuneration matters related thereto.
The current members of the Remuneration Committee, all of whom held office throughout the year and to the date of his report, are:
• Nigel Clifford (Chairman of the Remuneration Committee)
• Thomas Casdagli
• David Cook
The Company Secretary acts as secretary to the Remuneration Committee. The CEO, the Deputy CEO (since appointment) and the Chief HR Officer are also invited to attend certain meetings of the Remuneration Committee. However, no executive participates when their own remuneration is being discussed.
The committee held five formal meetings during the year.
The Company’s remuneration policy and details of the amounts due to the Directors of the Company in respect of the year are set out in the Remuneration Report on pages 44 to 46. As the Company is not listed, it is not required to produce a formal remuneration policy or seek shareholder approval of that policy.
Andrew Smith chaired the Remuneration Committee until 1 March 2018 when he stepped down as a director.
Nominations Committee
The role of the Nominations Committee is to review the structure, size and composition of the Board (including in terms of skills, knowledge, experience and diversity) and to identify and nominate candidates to fill Board vacancies.
Alliance Pharma plc Annual Report and Accounts 201742

The Committee also reviews the leadership needs of the organisation and monitors succession planning for both Board and senior executive roles. The terms of reference of the Nominations Committee are available on the Company’s website. During the year, in addition to its general role, the Nomination Committee undertook and managed the succession planning process, as part of which it carried out an internal and external review of potential candidates for the position of Chair of the Board.
The members of the Nominations Committee, all of whom held office throughout the year and to the date of this report, are:
• Nigel Clifford (Chairman of the Nominations Committee)
• Thomas Casdagli
• David Cook
The Company Secretary acts as secretary to the Nominations Committee. In addition, John Dawson has a standing invite for all meetings and, during this year, the Chief HR Officer was invited to attend certain meetings of the Committee, particularly when succession planning was being discussed. The committee held three formal meetings during the year.
Andrew Smith chaired the Nominations Committee until 1 March 2018 when he stepped down as a director.
Audit & Risk CommitteeThe role of the Audit & Risk Committee is set out in formal terms of reference, available on the Company’s website, and is to:
• consider the appointment of external auditors and the frequency of re-tendering and rotation of the audit oversee the relationship with, and the independence and objectivity of, the external auditors
• set policy in relation to the use of the external auditors for non-audit services
• review the management and reporting of financial matters including key accounting policies
• advise the Board on the Company’s appetite for and tolerance of risk and the strategy in relation to risk management and review any non-conformances with these
• review the Company’s risk management and internal control systems and their effectiveness
The members of the the Audit & Risk Committee, both of whom held office throughout the year and to the date of this report are:
• David Cook (Chairman of the Audit & Risk Committee)
• Nigel Clifford
The Company Secretary acts as secretary to the Audit & Risk Committee. Thomas Casdagli, the CEO, the Deputy CEO, CFO and the Group Financial Controller are invited to attend all meetings, while other senior financial managers will attend as necessary. The external auditors attend the meetings to discuss the planning and conclusions of their work and meet with the members of the Committee without any members of the executive team present after each meeting. The Committee is able to call for information from management and consults with the external auditors directly if required.
The objectivity and independence of the external auditors is safeguarded by reviewing the auditors’ formal declarations, monitoring relationships between key audit staff and the Company and tracking the level of non-audit fees payable to the auditors. The Audit & Risk Committee continued to manage and oversee the relationship between management and KPMG to ensure that the processing around audit worked effectively and were there were any particular issues they were resolved.
The Committee held three formal meetings during the year.
Andrew Smith was a member of the Audit & Risk Committee until 1 March when he stepped down as a director.
Share dealingThe Group has put in place a share dealing code appropriate to an AIM listed company, and the Group has in
place procedures to ensure that the Directors, and all employees of the Group, are aware of and understand the code and the importance of compliance with it.
Relations with shareholdersThroughout the year the CEO, Deputy CEO and CFO meet with the institutional shareholders who hold the majority of the shares and the Board is provided with feedback from all meetings and communications with shareholders. The Board is provided with an analysis of the investor base at each meeting and research notes by sell-side analysts are circulated to all Directors. Further information on investor sentiment is provided to the Board by the Company’s brokers and financial PR advisors.
The Group recognises the importance of retail shareholders and the Investor Relations section of the Group’s website is regularly updated with the aim of providing good information for all investors, but particularly retail shareholders. The website offers a facility to sign up for email alert notifications of Company news and regulatory announcements. In addition, the CEO, the Deputy CEO and CFO regularly present at conferences attended by many potential and current retail investors and meet with specialist private client fund managers, following which feedback is given to the Board.
Annual General Meeting (“AGM”)All Directors attend the Annual General Meeting at which the Chairman presents a statement on current trading and there is an opportunity to ask questions formally. Directors are available following the meeting for informal discussions. While voting at the AGM is on a show of hands, the proxy voting results (including any votes withheld) are announced at the meeting. Voting results are announced to the market and published on the website.
This year’s AGM will take place at 10.00am on 24 May at the offices of Buchanan Communications, 107 Cheapside, London EC2V 6DN.
43
Ove
rview
Fina
ncia
l State
men
tsA
dd
ition
al in
form
atio
nG
ove
rna
nce
Strate
gic R
ep
ort
Governance | Corporate Governance

Remuneration PolicyThe objective of the Company’s remuneration policy is to facilitate the recruitment and retention of executives of an appropriate calibre, to ensure that the senior executives of the Company are provided with appropriate incentives to encourage enhanced performance and are, in a fair and responsible manner, rewarded for their individual contributions to the success of the Company.
Strategic alignmentThe Remuneration Committee is satisfied that the pay that can be earned is appropriate for a company of comparable size and complexity, at each level of performance.
The delivery of the Company’s short-term corporate goals is incentivised by offering a cash-settled bonus linked to the achievement of pre-defined levels of profit before tax, which is the key metric the Board considers in monitoring corporate performance.
All of the Executive Directors have significant exposure to the Company’s share price: John Dawson has a significant personal shareholding in the Company and the other Executive Directors hold options over the Company’s shares. Certain of the options granted will only vest if targets for growth in the Company’s diluted earnings per share are met over a period of five years. EPS is an important metric which provides a strong incentive to drive the Company’s business over that longer-term period and to mitigate downside risks that could affect the Company’s profitability. Reputational risks could reasonably be expected to affect the share price, so the executive is further incentivised to mitigate these exposures, if they wish to maximise the potential value of their options.
Remuneration in practiceThe remuneration that the Company offers to its Executive Directors continues to be based on four principal components:
1. Basic Salaries and Benefits in kind – Basic salaries are determined by the Remuneration Committee bearing in mind the salaries paid in AIM-quoted and other pharmaceutical businesses of similar size and complexity. Within that frame of reference, it is intended that guaranteed pay should be at or near the median level. Benefits in kind include life assurance, healthcare and the provision of a cash allowance in lieu of a company car.
2. Pensions – The Company operates a defined contribution scheme for all Executive Directors and employees. Only basic salaries are pensionable.
3. Short-term incentives – Bonuses are payable to staff (including the Executive Directors) according to the achievement by the Group of certain pre-determined profit targets. The amount of bonus payable on achievement of the target is set at the level felt appropriate to provide the necessary incentive, with appropriate adjustments to the bonus payable in the event of over- or under-achievement against those targets. In addition, bonuses are adjusted for personal performance and the amount of bonus paid can also reflect any substantial periods of absence or unavailability of the employee.
4. Long-term incentives – The Company operates a share option scheme covering all permanent employees (including the Executive Directors, other than John Dawson) under which share options are normally granted once in each year, or on promotion. Options normally vest on the third anniversary of the date of grant and can then be exercised until the tenth anniversary. The exercise price of the options is set at the market value of the Company’s shares at the time of grant, so that the individual only benefits if there has been share price growth. In addition, certain tranches of options can only vest if there have been pre-defined levels of growth in the Company’s earnings per share, on a diluted basis. The share option scheme is overseen by the Remuneration Committee which determines the terms under which eligible individuals may be invited to participate, including the level of awards. The scheme utilises HMRC approved options to the extent possible and tax-unapproved options thereafter.
Directors’ Service ContractsAll Executive Directors are employed under service contracts. The services of all Executive Directors may be terminated by the Company or individual giving 12 months’ notice.
The Non-Executive Directors are employed under letters of engagement for fixed terms of up to five years, which may be terminated by the Company (i) giving 12 months’ notice or (ii) immediately, in the event that the Director is not re-elected by shareholders at an AGM.
REMUNERATION REPORT
Alliance Pharma plc Annual Report and Accounts 201744

Directors’ RemunerationThe aggregate remuneration payable to the Directors in respect of the period was as follows:
Salary or fees Other Pension BonusTotal
remunerationShare option
gains Total
2017 2016 2017 2016 2017 2016 2017 2016 2017 2016 2017 2016 2017 2016
Peter Butterfield 206,667 199,667 10,812 11,111 20,583 20,000 54,664 82,500 292,726 313,278 13,984 – 306,710 313,278
John Dawson3 244,000 240,886 13,464 13,495 113,899 10,000 62,546 59,400 433,909 323,781 – – 433,909 323,781
Andrew Franklin 165,000 150,000 10,967 10,441 16,500 15,000 34,578 42,624 227,045 218,065 – – 227,045 218,065
Thomas Casdagli – – – – – – – – – – – – – –
Nigel Clifford 36,001 35,411 – – – – – – 36,001 35,411 – – 36,001 35,411
David Cook 37,668 35,411 – – – – – – 37,668 35,411 – – 37,668 35,411
689,336 661,375 35,243 35,047 150,982 45,000 151,788 184,524 1,027,349 925,946 13,984 – 1,041,333 925,946
Former Directors:
Anthony Booley1 – 106,766 – – – – – – – 106,766 – – – 106,766
Andrew Smith2 72,946 71,750 – – – – – – 72,946 71,750 – – 72,946 71,750
Total3 762,282 839,891 35,243 35,047 150,982 45,000 151,788 184,524 1,100,295 1,104,462 13,984 – 1,114,279 1,104,462
Notes:
1 Anthony Booley ceased to serve as a Director on 30 June 2016.
2 Andrew Smith ceased to serve as a Director on 1 March 2018.
3 The increased pension contribution in respect of John Dawson is a catch-up of contractual payment entitlement due to underpayment in previous years.
No Director received any remuneration from a third party in respect of their service as a Director of the Company.
BenefitsThe column headed ‘Other’ in the table above shows the value of benefits provided to each executive Director, including a cash allowance in lieu of a company car and healthcare.
As seen from the table, three Directors are accruing retirement benefits, all of whom do so through defined contribution (money purchase) schemes. The Company does not operate a defined benefit scheme. No Director or former Director received any benefits from a retirement benefit scheme that were not otherwise available to all members of the scheme.
45
Ove
rview
Fina
ncia
l State
men
tsA
dd
ition
al in
form
atio
nG
ove
rna
nce
Strate
gic R
ep
ort
Governance | Remuneration Report

Directors’ Share OptionsDetails of options held under the Company’s employee share schemes by the Directors who served during the year are as follows:
Director
2016 Changes in the year 2017
Date of Grant
Exercise price
(pence) Performance
condition?Number
of shares Granted Exercised LapsedNumber
of sharesExercisable
fromExercisable
to
Peter Butterfield
26-Mar-10 33.25 No 1,000,000 – (90,222) – 909,778 26-Mar-13 26-Mar-20
29-Apr-10 34.25 No 115,000 – – – 115,000 29-Apr-13 29-Apr-20
28-Apr-11 34.12 No 1,130,000 – – – 1,130,000 28-Apr-14 28-Apr-21
19-Oct-12 29.25 No 140,000 – – – 140,000 19-Oct-15 19-Oct-22
06-Jun-13 37.25 No 144,200 – – – 144,200 06-Jun-16 06-Jun-23
23-Oct-13 35.75 EPS growth 400,000 – – – 400,000 23-Oct-18 23-Oct-23
11-Apr-14 33.75 EPS growth 144,200 – – – 144,200 11-Apr-17 11-Apr-24
27-May-15 43.75 EPS growth 166,625 – – – 166,625 27-May-18 27-May-25
27-Oct-16 47.50 EPS growth 200,000 – – – 200,000 27-Oct-19 27-Oct-26
27-Oct-16 47.50 EPS growth 1,000,000 – – – 1,000,000 27-Oct-21 27-Oct-26
15-Sep-17 53.00 EPS growth – 148,397 – – 148,397 15-Sep-20 15-Sep-27
15-Sep-17 53.00 No – 56,603 – – 56,603 15-Sep-20 15-Sep-27
4,440,025 205,000 (90,222) – 4,554,803
Andrew Franklin
04-Dec-15 46.75 No 2,000,000 – – – 2,000,000 04-Dec-18 04-Dec-25
27-Oct-16 47.50 EPS growth 155,000 – – – 155,000 27-Oct-19 27-Oct-26
27-Oct-16 47.50 EPS growth 400,000 – – – 400,000 27-Oct-21 27-Oct-26
15-Sep-17 53.00 EPS growth – 170,000 – – 170,000 15-Sep-20 15-Sep-27
2,555,000 170,000 – – 2,725,000
The closing mid-market price of ordinary shares on 29 December 2017 (being the last dealing day in the calendar year) was 67.13p and the range during the year was from 45.13p to 67.13p.
REMUNERATION REPORT CONTINUED
Alliance Pharma plc Annual Report and Accounts 201746

Scope of this reportThe Directors’ biographies on pages 38 and 39, the discussion of corporate governance matters on pages 40 to 43 and the remuneration report on pages 44 to 46 are hereby incorporated by reference to form part of this Directors’ report.
As permitted under the Companies Act, certain matters which would otherwise need to be included in this Directors’ report are instead part of the strategic report. These matters are the discussion of the likely future developments in the business of the Company and its subsidiaries, the activities of the Company and its subsidiaries, including, to the extent applicable, in the field of research and development, the Company’s use of financial instruments and an indication of its financial risk management objectives and policies.
Principal activitiesThe principal activity of the Group is the acquisition, marketing and distribution of pharmaceutical products. The principal activity of the Company is to act as a holding company.
DirectorsNames and biographical details of the Directors of the Company at the date of this report are shown on pages 38 and 39. In addition, Andrew Smith served as Non-executive Chairman until 1 March 2018.
Directors’ interestsThe following table shows the interests of the Directors (and their spouses and minor children) in the shares of the Company.
Director
At 31 December 2016 At 31 December 2017
(or earlier date of leaving)
Beneficial Non-
beneficial Total Beneficial Non-
beneficial Total
Peter Butterfield – – – 28,376 – 28,376
Tom Casdagli 78,518 55,483,382 55,561,900 78,518 55,483,382 55,561,900
Nigel Clifford 180,663 – 180,663 180,663 – 180,663
David Cook 102,371 – 102,371 102,371 – 102,371
John Dawson 36,576,402 20,000,000 56,576,402 36,576,402 20,000,000 56,576,402
Andrew Franklin – – – – – –
Andrew Smith1 275,000 – 275,000 275,000 – 275,000
Notes:
1 Andrew Smith ceased to serve as a Director on 1 March 2018.
In addition, Peter Butterfield and Andrew Franklin both hold options over shares of the Company through their participation in the Company’s Share Option Plan, as set out in the Remuneration Report on page 46.
Directors’ liabilitiesThe Company’s articles of association contain provision for Directors to be indemnified (including the funding of defence costs) to the extent permitted by the Companies Act 2006. This indemnity would only be available if judgement was given in the individual’s favour, or he or she was acquitted, or relief under the Act was granted by the court.
There were no qualifying pension scheme indemnity provisions in force during the year.
DIRECTORS’ REPORT
47
Ove
rview
Fina
ncia
l State
men
tsA
dd
ition
al in
form
atio
nG
ove
rna
nce
Strate
gic R
ep
ort
Governance | Directors’ Report

Our employeesThe Group places great importance on attracting and retaining high quality employees and aligning the success of the Group with their rewards. As part of this the Group operates a share option plan which aims to ensure that each employee has a direct benefit from the growth of the business as it translates to the Company’s share price. Further information about our values and our people can be found on pages 24 and 25.
Directors’ Responsibilities StatementThe Directors are responsible for preparing the Annual Report and the Group and parent Company financial statements in accordance with applicable law and regulations.
Company law requires the Directors to prepare Group and parent Company financial statements for each financial year. As required by the AIM Rules of the London Stock Exchange they are required to prepare the Group financial statements in accordance with International Financial Reporting Standards as adopted by the EU (IFRSs as adopted by the EU) and applicable law and have elected to prepare the parent Company financial statements on the same basis.
Under company law the Directors must not approve the financial statements unless they are satisfied that they give a true and fair view of the state of affairs of the Group and parent Company and of their profit or loss for that period. In preparing each of the Group and parent Company financial statements, the Directors are required to:
• select suitable accounting policies and then apply them consistently;
• make judgements and estimates that are reasonable, relevant and reliable;
• state whether they have been prepared in accordance with IFRSs as adopted by the EU;
• assess the Group and parent Company’s ability to continue as a going concern, disclosing, as applicable, matters related to going concern; and
• use the going concern basis of accounting unless they either intend to liquidate the Group or the parent Company or to cease operations, or have no realistic alternative but to do so.
The Directors are responsible for keeping adequate accounting records that are sufficient to show and explain the parent Company’s transactions and disclose with reasonable accuracy at any time the financial position of the parent Company and enable them to ensure that its financial statements comply with the Companies Act 2006. They are responsible for such internal control as they determine is necessary to enable the preparation of financial statements that are free from material misstatement, whether due to fraud or error, and have general responsibility for taking such steps as are reasonably open to them to safeguard the assets of the Group and to prevent and detect fraud and other irregularities.
Under applicable law and regulations, the Directors are also responsible for preparing a Strategic Report and a Directors’ Report that complies with that law and those regulations.
Directors’ obligations to the auditorThe Directors confirm that:
• so far as each of the Directors is aware, there is no relevant audit information of which the Company’s auditor is unaware; and
• they have each taken all the steps that they ought to have taken as Directors to make themselves aware of any relevant audit information and to establish that the auditor is aware of that information.
DividendsThe Board declared an interim dividend in respect of the year of 0.443 pence per share (2016: 0.403p) which was paid on 11 January 2018. The Directors are recommending a final dividend of 0.888 pence per share (2016: 0.807p) which, subject to shareholders’ approval at the annual general meeting, will be paid on 11 July 2018 to shareholders on the register at the close of business on 15 June 2018. The total dividends paid and proposed in respect of the year ended 31 December 2017 is therefore 1.331 pence per share (2016: 1.210p).
DIRECTORS’ REPORT CONTINUED
Alliance Pharma plc Annual Report and Accounts 201748

BranchesThere are no branches of the Company outside the UK.
Political donationsNo political donations were made, or political expenditure incurred during the period.
AuditorOur auditor, KPMG LLP, has expressed its willingness to continue in office and a resolution to re-appoint KPMG LLP as auditor for the next year will be proposed at the Annual General Meeting.
Annual General MeetingThe 2018 Annual General Meeting of the Company will be held on 24 May 2018, the business of which is set out in the notice of meeting. A circular containing the notice of meeting and an explanatory letter from the Chairman is being posted to shareholders and is also available on the Company’s website.
On behalf of the Board
Chris ChrysanthouCompany Secretary27 March 2018
49
Ove
rview
Fina
ncia
l State
men
tsA
dd
ition
al in
form
atio
nG
ove
rna
nce
Strate
gic R
ep
ort
Governance | Directors’ Report

Realising value through our skills and
capabilities
Alliance Pharma plc Annual Report and Accounts 201750

We have a proven record of generating organic growth through adept portfolio management, targeted marketing investment and relationships with effective distributors.
Financial Statements52 Independent Auditor’s
Report56 Consolidated Income
Statement57 Consolidated Statement of
Comprehensive Income58 Consolidated Balance
Sheet59 Company Balance Sheet60 Consolidated Statement
of Changes in Equity61 Company Statement
of Changes in Equity62 Consolidated and
Company Cash Flow Statements
63 Notes to the Financial Statements
Ove
rview
Ad
ditio
na
l info
rma
tion
Gove
rna
nce
Strate
gic R
ep
ort
Fina
ncia
l State
men
ts
51Financial Statements
1. Our opinion is unmodified We have audited the financial statements of Alliance
Pharma plc (“the Company”) for the year ended 31 December 2017 which comprise the Consolidated Income Statement, Consolidated Statement of Comprehensive Income, Consolidated Balance Sheet, Company Balance Sheet, Consolidated Statement of Changes in Equity, Company Statement of Changes in Equity, Consolidated and Company Cash Flow Statements, and the related notes, including the accounting policies in note 2.
In our opinion: – the financial statements give a true and fair view
of the state of the Group’s and of the parent Company’s affairs as at 31 December 2017 and of the Group’s profit for the year then ended;
– the group financial statements have been properly prepared in accordance with International Financial Reporting Standards as adopted by the European Union (IFRSs as adopted by the EU);
– the parent Company financial statements have been properly prepared in accordance with IFRSs as adopted by the EU and as applied in accordance with the provisions of the Companies Act 2006; and
– the financial statements have been prepared in accordance with the requirements of the Companies Act 2006.
Basis for opinion We conducted our audit in accordance with International Standards on Auditing (UK) (“ISAs (UK)”) and applicable law. Our responsibilities are described below. We have fulfilled our ethical responsibilities under, and are independent of the Group in accordance with, UK ethical requirements including the FRC Ethical Standard as applied to listed entities. We believe that the audit evidence we have obtained is a sufficient and appropriate basis for our opinion.
Overview
Materiality: Group financial statements as a whole
£1.1m (2016:£1.0m)
4.7% (2016:4.5%) of Group profit before tax*
* Group profit before tax is normalised to exclude the 2017 exceptional compensation income of £4.9 million (net of costs) as disclosed in note 5.
Coverage 91% (2016: 94%) of Group profit before tax*
Risks of material misstatement vs 2016
Recurring risks
Impairment of indefinite useful economic life intangible assets (excluding Goodwill)
Recoverability of parent company’s investment in subsidiaries
Independent auditor’s report to the members of Alliance Pharma plc
52

2. Key audit matters: our assessment of risks of material misstatement Key audit matters are those matters that, in our professional judgment, were of most significance in the audit of the
financial statements and include the most significant assessed risks of material misstatement (whether or not due to fraud) identified by us, including those which had the greatest effect on: the overall audit strategy; the allocation of resources in the audit; and directing the efforts of the engagement team. These matters were addressed in the context of our audit of the financial statements as a whole, and in forming our opinion thereon, and we do not provide a separate opinion on these matters. In arriving at our audit opinion above, the key audit matters, in decreasing order of audit significance, were as follows (unchanged from 2016):
The risk Our response
Impairment of indefinite useful economic life intangible assets (excluding Goodwill)
(£256.7 million; 2016: £243.3 million)
Refer to page 63 (accounting policy) and page 74 (financial disclosures).
Forecast-based valuation
The estimated recoverable amount is subjective due to the inherent uncertainty involved in forecasting and discounting future cash flows.
This assessment is based on assumptions (such as discount rates and growth rates), which are inherently highly judgemental.
Scoping: We adopted a risk based approach by selecting higher risk assets for detailed testing based on historic headroom levels, sensitivities, historic forecasting accuracy, issues identified from discussions with commercial, regulatory and financial management and information about the products in the public domain.
For the assets scoped in, our procedures included:
– Benchmarking assumptions: Using our own valuations specialist, we challenged the Group’s selection of discount and growth rates by comparing those used to externally derived data (including competitor analysis) In addition, assessing whether the forecasts (including growth rate) were consistent with current business strategies in place;
– Sensitivity analysis: performing our own analysis to assess the sensitivity of the impairment reviews to changes in the key assumptions, including the discount rate, growth rate and the forecast cash flows;
– Historical comparisons: comparing the previously forecast cash flows to actual results to assess the historical accuracy of forecasting;
– Assessing transparency: assessing the adequacy of the Group’s disclosures in respect of the sensitivity to changes in key assumptions.
Recoverability of parent company’s investment in subsidiaries
(£145.5 million; 2016: £140.0m)
Refer to page 63 (accounting policy) and page 79 (financial disclosures).
Low risk, high value
The carrying amount of the parent company’s investments in subsidiaries represents 99.9% (2016: 99.9%) of the company’s total assets.
Their recoverability is not at a high risk of significant misstatement or subject to significant judgement. However, due to their materiality in the context of the parent company financial statements, this is considered to be the area that had the greatest effect on our overall parent company audit.
Our procedures included:
– Tests of detail: We compared the carrying amount of 100% of the investments with the net assets value of the respective subsidiary, being an approximation of their minimum recoverable amount, to identify whether the net asset values were in excess of the carrying amounts and assessing whether those subsidiaries have historically been profit-making. The Group audit team performs the statutory audit of all material investments;
– Our sector experience: Where the carrying value of the investment exceeded the net assets of the subsidiary we obtained the forecasts used by the directors’ in their assessment of the recoverability of their investments. We challenged the underlying assumptions used in these forecasts, taking into consideration the assumptions used by the directors in testing the recoverability of the intangible assets at a group level.
53
Ove
rview
Fina
ncia
l State
men
tsA
dd
ition
al in
form
atio
nG
ove
rna
nce
Strate
gic R
ep
ort
Financial Statements | Independent auditor’s report

3. Our application of materiality and an overview of the scope of our audit
Materiality for the group financial statements as a whole was set at £1.1 million, determined with reference to a benchmark of Group profit before tax normalised to exclude the 2017 exceptional compensation income of £4.9 million (net of costs) as disclosed in note 5, of which it represents 4.7% (2016: 4.5%).
Materiality for the parent company financial statements as a whole was set at £0.8 million (2016: £0.8 million), determined with reference to a benchmark of company total assets, of which it represents 0.5% (2016: 0.5%).
We agreed to report to the Audit Committee any corrected or uncorrected identified misstatements exceeding £55,000, in addition to other identified misstatements that warranted reporting on qualitative grounds.
Of the Group’s 18 (2016: 18) reporting components, we subjected 5 (2016: 5) to full scope audits for group purposes. We conducted reviews of financial information (including enquiry) at a further 3 (2016: 3) non-significant components. These non-significant components are not material from a profit or net assets perspective nor do they include a significant risk. However they do include individually material revenues, costs, assets or liabilities.
The components within the scope of our work accounted for the percentages illustrated opposite.
For the residual components, we performed analysis at an aggregated group level to re-examine our assessment that there were no significant risks of material misstatement within these.
The Group team instructed component auditors as to the significant areas to be covered, including the relevant risks detailed above and the information to be reported back. The Group team approved the component materialities, which ranged from £0.1 million to £0.9 million (2016: £0.5 million to £0.8 million), having regard to the mix of size and risk profile of the Group across the components. The work on 1 of the 5 components (2016: 1 of the 5 components) was performed by component auditors and the rest, including the audit of the parent company, was performed by the Group team. The group team performed procedures on the items excluded from normalised group profit before tax.
The Group team visited one (2016: none) component location in France (2016: none) to assess the audit risk and strategy. Telephone conference meetings were also held with the component auditor. At these visits and meetings, the findings reported to the Group team were discussed in more detail, and any further work required by the Group team was then performed by the component auditor.
Group revenue Group profit before tax
Group total assets
Full scope for group audit purposes 2017
Reviews of financial information (including enquiry) 2017
Full scope for group audit purposes 2016
Reviews of financial information (including enquiry) 2016
Residual components
Group PBT*
Group materiality
Group profit before tax*£23.5m (2016: £22.2m)
Group Materiality£1.1m (2016: £1.0m)
£1.1 million Whole financial statements materiality (2016: £1.0m)
£0.9 million Range of materiality at five components (£0.1m to £0.9m) (2016: £0.5m to £0.8m)
£55,000 Misstatements reported to the audit committee (2016: £50,000)
INDEPENDENT AUDITOR’S REPORT CONTINUED
* Group profit before tax is normalised to exclude the 2017 exceptional compensation income of £4.9 million (net of costs) as disclosed in note 5.
88%(2016: 88%)
1012
8888
74
9491
91%(2016: 94%)
9098
13
90%(2016: 98%)
54

4. We have nothing to report on going concern
We are required to report to you if we have concluded that the use of the going concern basis of accounting is inappropriate or there is an undisclosed material uncertainty that may cast significant doubt over the use of that basis for a period of at least twelve months from the date of approval of the financial statements. We have nothing to report in these respects.
5. We have nothing to report on the other information in the Annual Report
The directors are responsible for the other information presented in the Annual Report together with the financial statements. Our opinion on the financial statements does not cover the other information and, accordingly, we do not express an audit opinion or, except as explicitly stated below, any form of assurance conclusion thereon.
Our responsibility is to read the other information and, in doing so, consider whether, based on our financial statements audit work, the information therein is materially misstated or inconsistent with the financial statements or our audit knowledge. Based solely on that work we have not identified material misstatements in the other information.
Strategic report and directors’ report Based solely on our work on the other information:
– we have not identified material misstatements in the strategic report and the directors’ report;
– in our opinion the information given in those reports for the financial year is consistent with the financial statements; and
– in our opinion those reports have been prepared in accordance with the Companies Act 2006.
6. We have nothing to report on the other matters on which we are required to report by exception
Under the Companies Act 2006, we are required to report to you if, in our opinion:
– adequate accounting records have not been kept by the parent Company, or returns adequate for our audit have not been received from branches not visited by us; or
– the parent Company financial statements are not in agreement with the accounting records and returns; or
– certain disclosures of directors’ remuneration specified by law are not made; or
– we have not received all the information and explanations we require for our audit.
We have nothing to report in these respects.
7. Respective responsibilities Directors’ responsibilities As explained more fully in their statement set out
on page 48, the directors are responsible for: the preparation of the financial statements including being satisfied that they give a true and fair view; such internal control as they determine is necessary to enable the preparation of financial statements that are free from material misstatement, whether due to fraud or error; assessing the Group and parent Company’s ability to continue as a going concern, disclosing, as applicable, matters related to going concern; and using the going concern basis of accounting unless they either intend to liquidate the Group or the parent Company or to cease operations, or have no realistic alternative but to do so.
Auditor’s responsibilities Our objectives are to obtain reasonable assurance
about whether the financial statements as a whole are free from material misstatement, whether due to fraud or error, and to issue our opinion in an auditor’s report. Reasonable assurance is a high level of assurance, but does not guarantee that an audit conducted in accordance with ISAs (UK) will always detect a material misstatement when it exists. Misstatements can arise from fraud or error and are considered material if, individually or in aggregate, they could reasonably be expected to influence the economic decisions of users taken on the basis of the financial statements.
A fuller description of our responsibilities is provided on the FRC’s website at www.frc.org.uk/auditorsresponsibilities.
8. The purpose of our audit work and to whom we owe our responsibilities
This report is made solely to the Company’s members, as a body, in accordance with Chapter 3 of Part 16 of the Companies Act 2006. Our audit work has been undertaken so that we might state to the Company’s members those matters we are required to state to them in an auditor’s report and for no other purpose. To the fullest extent permitted by law, we do not accept or assume responsibility to anyone other than the Company and the Company’s members, as a body, for our audit work, for this report, or for the opinions we have formed.
Andrew Campbell-Orde (Senior Statutory Auditor)
for and on behalf of KPMG LLP, Statutory Auditor
Chartered Accountants 66 Queen Square Bristol BS1 4BE
27 March 2018
55
Ove
rview
Fina
ncia
l State
men
tsA
dd
ition
al in
form
atio
nG
ove
rna
nce
Strate
gic R
ep
ort
Financial Statements | Independent auditor’s report

CONSOLIDATED INCOME STATEMENT
Year ended 31 December 2017 Year ended 31 December 2016
Note Underlying
£000s
Non-Underlying
(note 5)£000s
Total£000s
Underlying£000s
Non-Underlying
(note 5)£000s
Total£000s
Revenue 3 103,315 – 103,315 97,492 – 97,492
Cost of sales (44,354) – (44,354) (42,643) – (42,643)
Gross profit 58,961 – 58,961 54,849 – 54,849
Operating expenses
Administration and marketing expenses (31,706) – (31,706) (28,842) – (28,842)
Share-based employee remuneration 7 (1,453) – (1,453) (696) – (696)
Share of Joint Venture profits 19 – 19 299 – 299
(33,140) – (33,140) (29,239) – (29,239)
Operating profit excluding exceptional item 25,821 – 25,821 25,610 – 25,610
Net exceptional compensation income 5 – 4,356 4,356 – – –
Operating profit 25,821 4,356 30,177 25,610 – 25,610
Finance costs
Interest payable and similar charges 6 (3,064) – (3,064) (3,355) – (3,355)
Change in deferred consideration 6 618 – 618 (840) – (840)
Finance income 6 638 – 638 804 – 804
(1,808) – (1,808) (3,391) – (3,391)
Profit before taxation 4 24,013 4,356 28,369 22,219 – 22,219
Taxation 8 1,305 (764) 541 (4,127) – (4,127)
Profit for the year attributable to equity shareholders 25,318 3,592 28,910 18,092 – 18,092
Earnings per share
Basic (pence) 10 5.34 – 6.10 3.85 3.85
Diluted (pence) 10 5.28 – 6.03 3.82 3.82
All of the activities of the Group are classed as continuing.
The accompanying accounting policies and notes form an integral part of these financial statements.
Alliance Pharma plc Annual Report and Accounts 201756

CONSOLIDATED STATEMENT OF COMPREHENSIVE INCOME
Year ended 31 December
2017£000s
Year ended 31 December
2016£000s
Profit for the year 28,910 18,092
Other comprehensive income
Items that may be reclassified to profit or loss
Net foreign exchange (loss)/gain on investment in foreign subsidiaries (net of hedged items) (1,718) 2,076
Interest rate swaps – cash flow hedge (net of deferred tax) 202 (221)
Total comprehensive income for the year 27,394 19,947
57
Ove
rview
Fina
ncia
l State
men
tsA
dd
ition
al in
form
atio
nG
ove
rna
nce
Strate
gic R
ep
ort
Financial Statements | Consolidated Statement of Comprehensive Income

CONSOLIDATED BALANCE SHEET
Note
31 December 2017
£000s
31 December 2016
£000s
Assets
Non-current assets
Goodwill and intangible assets 11 278,623 264,833
Property, plant and equipment 12 3,377 1,806
Joint Venture investment 31 1,483 1,464
Joint Venture receivable 31 1,462 1,462
Deferred tax asset 22 2,174 1,709
Other non-current assets 229 180
287,348 271,454
Current assets
Inventories 14 14,248 15,356
Trade and other receivables 15 23,695 26,706
Cash and cash equivalents 16 11,184 7,221
49,127 49,283
Total assets 336,475 320,737
Equity
Ordinary share capital 23 4,750 4,726
Share premium account 110,252 109,594
Share option reserve 5,073 3,306
Reverse takeover reserve (329) (329)
Other reserve (117) (319)
Translation reserve 390 2,108
Retained earnings 83,358 60,177
Total equity 203,377 179,263
Liabilities
Non-current liabilities
Loans and borrowings 18 41,780 57,554
Other liabilities 19 3,525 1,817
Deferred tax liability 22 26,920 31,442
Derivative financial instruments 21 63 384
72,288 91,197
Current liabilities
Loans and borrowings 18 41,719 25,782
Corporation tax 2,436 2,543
Trade and other payables 17 16,576 21,952
Derivative financial instruments 21 79 –
60,810 50,277
Total liabilities 133,098 141,474
Total equity and liabilities 336,475 320,737
The financial statements were approved by the Board of Directors on 27 March 2018.
John Dawson Andrew FranklinDirector Director
The accompanying accounting policies and notes form an integral part of these financial statements. Company number 04241478
Alliance Pharma plc Annual Report and Accounts 201758

COMPANY BALANCE SHEET
Note
31 December 2017 31 December 2016
£000s £000s £000s £000s
Assets
Non-current assets
Investment in subsidiaries 13 145,469 140,008
Deferred tax asset 314 –
145,783 140,008
Current assets
Trade and other receivables 15 21 119
Cash and cash equivalents 16 71 90
92 209
Total assets 145,875 140,217
Equity
Ordinary share capital 23 4,750 4,726
Share premium account 110,252 109,594
Share option reserve 5,073 3,306
Retained earnings 25,052 22,382
Total equity 145,127 140,008
Liabilities
Current liabilities
Trade and other payables 17 262 159
Corporation tax 486 50
748 209
Total liabilities 748 209
Total equity and liabilities 145,875 140,217
The financial statements were approved by the Board of Directors on 27 March 2018.
John Dawson Andrew FranklinDirector Director
The accompanying accounting policies and notes form an integral part of these financial statements. Company number 04241478
59
Ove
rview
Fina
ncia
l State
men
tsA
dd
ition
al in
form
atio
nG
ove
rna
nce
Strate
gic R
ep
ort
Financial Statements | Company Balance Sheet

CONSOLIDATED STATEMENT OF CHANGES IN EQUITY
Ordinary share
capital£000s
Share premium
account £000s
Reverse takeover
reserve£000s
Other reserve
£000s
Translation reserve
£000s
Share option
reserve£000s
Retained earnings
£000s
Total equity£000s
Balance 1 January 2016 4,682 108,308 (329) (98) 32 2,610 47,237 162,442
Issue of shares 44 – – – – – – 44
Share premium – 1,286 – – – – – 1,286
Dividend paid – – – – – – (5,152) (5,152)
Share options charge – – – – – 696 – 696
Transactions with owners 44 1,286 – – – 696 (5,152) (3,126)
Profit for the period – – – – – – 18,092 18,092
Other comprehensive income
Interest rate swaps – cash flow hedge (net of deferred tax) – – – (221) – – – (221)
Foreign exchange translation differences – – – – 2,076 – – 2,076
Total comprehensive income for the period – – – (221) 2,076 – 18,092 19,947
Balance 31 December 2016 4,726 109,594 (329) (319) 2,108 3,306 60,177 179,263
Balance 1 January 2017 4,726 109,594 (329) (319) 2,108 3,306 60,177 179,263
Issue of shares 24 – – – – – – 24
Share premium – 658 – – – – – 658
Dividend paid – – – – – – (5,729) (5,729)
Share options charge (including deferred tax) – – – – – 1,767 – 1,767
Transactions with owners 24 658 – – – 1,767 (5,729) (3,280)
Profit for the period – – – – – – 28,910 28,910
Other comprehensive income
Interest rate swaps – cash flow hedge (net of deferred tax) – – – 202 – – – 202
Foreign exchange translation differences – – – – (1,718) – – (1,718)
Total comprehensive income for the period – – – 202 (1,718) – 28,910 27,394
Balance 31 December 2017 4,750 110,252 (329) (117) 390 5,073 83,358 203,377
Alliance Pharma plc Annual Report and Accounts 201760

COMPANY STATEMENT OF CHANGES IN EQUITY
Ordinary share
capital£000s
Share premium
account£000s
Share option
reserve£000s
Retained earnings
£000s
Total equity£000s
Balance 1 January 2016 4,682 108,308 2,610 22,394 137,994
Issue of shares 44 – – – 44
Share premium – 1,286 – – 1,286
Dividend paid – – – (5,152) (5,152)
Share options charge – – 696 – 696
Transactions with owners 44 1,286 696 (5,152) (3,126)
Profit for the period and total comprehensive income – – – 5,140 5,140
Balance 31 December 2016 4,726 109,594 3,306 22,382 140,008
Balance 1 January 2017 4,726 109,594 3,306 22,382 140,008
Issue of shares 24 – – – 24
Share premium – 658 – – 658
Dividend paid – – – (5,729) (5,729)
Share options charge (including deferred tax) – – 1,767 – 1,767
Transactions with owners 24 658 1,767 (5,729) (3,280)
Profit for the period and total comprehensive income – – – 8,399 8,399
Balance 31 December 2017 4,750 110,252 5,073 25,052 145,127
As permitted by section 408 of the Companies Act 2006, no separate Income Statement is presented in respect of the Parent Company.
61
Ove
rview
Fina
ncia
l State
men
tsA
dd
ition
al in
form
atio
nG
ove
rna
nce
Strate
gic R
ep
ort
Financial Statements | Company Statement of Changes in Equity

CONSOLIDATED AND COMPANY CASH FLOW STATEMENTS
Note
Group Company
Year ended31 December
2017£000s
Year ended 31 December
2016£000s
Year ended 31 December
2017£000s
Year ended 31 December
2016£000s
Cash flows from operating activities
Cash generated from operations 25 30,311 19,957 1,086 (333)
Tax paid (3,728) (3,032) (51) –
Cash flows from operating activities 26,583 16,925 1,035 (333)
Investing activities
Interest received 104 111 3,733 3,983
Dividend received – 300 5,721 1,731
Investment in subsidiary 13 – – (5,461) (1,439)
Development costs capitalised 11 (459) (266) – –
Purchase of property, plant and equipment 12 (2,236) (1,130) – –
Loan to Joint Venture 154 (1,018) – –
Exceptional compensation income 5 4,000 – – –
Consideration on acquisitions (15,314) (1,289) – –
Deferred contingent consideration on acquisitions (2,161) (4,737) – –
Net cash from investing activities (15,912) (8,029) 3,993 4,275
Financing activities
Interest paid and similar charges (2,678) (2,822) – –
Loan issue costs – (326) – –
Proceeds from exercise of share options 682 1,330 682 1,330
Dividend paid (5,729) (5,152) (5,729) (5,152)
Receipt from borrowings 16,000 8,000 – –
Repayment of borrowings (14,730) (6,495) – –
Net cash received from financing activities (6,455) (5,465) (5,047) (3,822)
Net movement in cash and cash equivalents 4,216 3,431 (19) 120
Cash and cash equivalents at 1 January 2017 7,221 3,198 90 (30)
Exchange (loss)/gains on cash and cash equivalents (253) 592 – –
Cash and cash equivalents at 31 December 2017 16 11,184 7,221 71 90
The accompanying accounting policies and notes form an integral part of these financial statements.
Alliance Pharma plc Annual Report and Accounts 201762
NOTES TO THE FINANCIAL STATEMENTSfor the year ended 31 December
1. General informationAlliance Pharma plc (‘the Company’) and its subsidiaries (together ‘the Group’) acquire, market and distribute pharmaceutical and other medical products. The Company is a public limited company, limited by shares, incorporated and domiciled in England. The address of its registered office is Avonbridge House, Bath Road, Chippenham, Wiltshire, SN15 2BB. The Company is listed on the AIM stock exchange.
These consolidated financial statements have been approved for issue by the Board of Directors on 27 March 2018.
2. Summary of significant accounting policiesThe principal accounting policies applied in the preparation of these consolidated financial statements are set out below. These policies have been consistently applied to all the periods presented.
2.1 Basis of preparationThese financial statements have been prepared in accordance with International Financial Reporting Standards as adopted by the EU (“Adopted IFRS”). The financial statements have been prepared under the historical cost convention, with the exception of derivatives and contingent consideration which are included at fair value.
2.2 ConsolidationThe consolidated balance sheet includes the assets and liabilities of the Company and its subsidiaries which are made up to 31 December 2017.
SubsidiariesSubsidiaries are entities controlled by the Group. The Group controls an entity when it is exposed to, or has rights to, variable returns from its involvement with the entity and has the ability to affect those returns through its power over the entity. In assessing control, the Group takes into consideration potential voting rights. The acquisition date is the date on which control is transferred to the acquirer. The financial statements of subsidiaries are included in the consolidated financial statements from the date that control commences until the date that control ceases. Losses applicable to the non-controlling interests in a subsidiary are allocated to the non-controlling interests even if doing so causes the non-controlling interests to have a deficit balance.
Joint VenturesAn entity is treated as a Joint Venture where the Group has rights to the net assets of the arrangement, rather than rights to its assets and obligations for its liabilities. Joint Ventures are accounted for using the equity method (equity accounted investees) and are initially recognised at cost. The consolidated financial statements include the Group’s share of the total comprehensive income and equity movements of equity accounted investees, from the date that joint control commences until the date that joint control ceases. See note 31 for details of Joint Ventures.
Transactions eliminated on consolidationIntra-group balances and transactions, and any unrealised income and expenses arising from intra-group transactions, are eliminated.
2.3 Judgements and estimatesThe preparation of the consolidated financial statements requires the Directors to make judgements, estimates and assumptions that affect the application of policies and reported amounts of assets and liabilities, income and expenses. The estimates and associated assumptions are based on historical experience and various other factors that are believed to be reasonable under the circumstances relevant. Actual results may differ from these estimates.
The estimates and underlying assumptions are reviewed by the Directors on an on-going basis. Revisions to accounting estimates are recognised in accordance with IAS 8 ‘Accounting Policies, Changes in Accounting Estimates and Errors’. The following are the critical judgements that the Directors have made in the process of applying the Group’s accounting policies that have the most significant effect on the amounts recognised in the Group’s financial statements. These are as follows:
• determination of useful economic lives for intangible assets (note 11);
• key assumptions used in discounted cash flow projections for impairment testing of goodwill and intangible assets (note 11);
• assessment of joint control for the Group’s Joint Ventures (note 31);
• assumptions underlying the inventory obsolescence provision (note 14); and
• measurement of consideration and assets and liabilities acquired as part of business combinations.
63
Ove
rview
Fina
ncia
l State
men
tsA
dd
ition
al in
form
atio
nG
ove
rna
nce
Strate
gic R
ep
ort
Financial Statements | Notes to the Financial Statements

NOTES TO THE FINANCIAL STATEMENTS CONTINUEDfor the year ended 31 December
2. Summary of significant accounting policies continued2.4 Revenue recognitionRevenue comprises the fair value of the consideration received or receivable for the sale of goods in the ordinary course of the Group’s activities. Revenue is shown net of value-added tax, estimated returns, rebates, including the Pharmaceutical Price Regulation Scheme, and discounts and after eliminating sales within the Group and represents amounts invoiced to third parties in relation to the Group’s sole activity, namely the distribution of pharmaceutical products. Revenue is recognised at the point when substantially all of the risks and rewards of ownership are transferred to the customer; normally this is on dispatch.
2.5 Foreign currencyThe consolidated financial statements are presented in Sterling, which is the presentational currency of the Group and the functional currency of the Company. Foreign currency transactions by Group companies are booked at the exchange rate ruling on the date of the transaction. Foreign currency monetary assets and liabilities are retranslated into Sterling at the rate of exchange ruling at the balance sheet date. Foreign exchange differences arising on translation are recognised in the income statement except for differences arising on the retranslation of a financial liability designated as a hedge of the net investment in a foreign operation that is effective, or qualifying cash flow hedges, which are recognised directly in other comprehensive income.
The assets and liabilities of foreign operations, including goodwill and fair value adjustments arising on consolidation, are translated to the Group’s presentational currency, Sterling, at foreign exchange rates ruling at the balance sheet date. The revenues and expenses of foreign operations are translated at an average rate for the year where this rate approximates to the foreign exchange rates ruling at the dates of the transactions. Exchange differences arising from this translation of foreign operations are reported as an item of other comprehensive income and accumulated in the translation reserve. Foreign currency differences arising on the retranslation of a hedge of a net investment in a foreign operation are recognised directly in equity, in the translation reserve, to the extent that the hedge is effective.
2.6 Property, plant and equipmentComputer equipment, fixtures, fittings and equipment, plant and machinery and motor vehicles are stated at the cost of purchase less any provisions for depreciation and impairment. The rates generally applicable are:
Computer equipment 20% – 33.3% per annum, straight line
Fixtures, fittings and equipment 20% – 25% per annum, straight line
Plant and machinery 20% – 25% per annum, straight line
Motor vehicles 20% per annum, straight line
2.7 LeasesOperating lease paymentsPayments made under operating leases are recognised in the income statement on a straight-line basis over the term of the lease. Lease incentives received are recognised in the income statement as an integral part of the total lease expense.
2.8 Intangible assets and goodwillGoodwillGoodwill is stated at cost less any accumulated impairment losses. Goodwill is allocated to cash-generating units and is not amortised but is tested annually for impairment.
Acquired intangible assets(i) Brands
Separately acquired brands are shown at cost less accumulated amortisation and impairment. Brands acquired as part of a business combination are recognised at fair value at the acquisition date, where they are separately identifiable. Brands are amortised over their useful economic life, except when their life is determined as being indefinite.
Applying indefinite lives to certain acquired brands is appropriate due to the stable long-term nature of the business and the enduring nature of the brands. Indefinite life brands are tested at least annually for impairment.
A review of the useful economic life of brands is performed annually, to ensure that these lives are still appropriate. If a brand is considered to have a finite life, its carrying value is amortised over that period.
(ii) PatentsWhere an acquired intangible includes a definite period of patent protection and the value attributed to the patent is considered material, the Group has accounted for the value of the patent separate to the underlying brand. The patent is amortised over the period to patent expiry.
NOTES TO THE FINANCIAL STATEMENTS CONTINUEDfor the year ended 31 December
Alliance Pharma plc Annual Report and Accounts 201764

(iii) Distribution rightsPayments made in respect of product registration and distribution rights are capitalised where the rights comply with the above requirements for recognition of acquired brands. If the registration or distribution rights are for a defined time period, the intangible asset is amortised over that period. If no time period is defined, the intangible asset is treated in the same way as acquired brands with an indefinite life. If the licence period can be extended the useful life of the intangible asset shall include the renewal period only if there is evidence to support renewal by the entity without disproportionate cost.
Development costsResearch expenditure is charged to the Income Statement in the period in which it is incurred. Development expenditure is capitalised when it can be reliably measured and the project it is attributable to is separately identifiable, is technically feasible, demonstrates future economic benefit, and will be used or sold by the Group once completed.
The capitalised cost is amortised over the period during which the Group is expected to benefit and begins when the asset is ready for use.
Development costs are reviewed at least annually for impairment by assessing the recoverable amount of each cash-generating unit, to which the development costs relate. The recoverable amount is the higher of fair value less costs to sell and value in use.
Development costs not meeting the recognition criteria are expensed as incurred.
ImpairmentThe carrying amounts of the Group’s non-financial assets, other than inventories and deferred tax assets, are reviewed at each reporting date to determine whether there is any indication of impairment. If any such indication exists, then the asset’s recoverable amount is estimated. For goodwill, and intangible assets that have indefinite useful lives or that are not yet available for use, the recoverable amount is estimated each year at the same time.
The recoverable amount of an asset or cash-generating unit is the greater of its value in use and its fair value less costs to sell. In assessing value in use, the estimated future cash flows are discounted to their present value using a pre-tax discount rate that reflects current market assessments of the time value of money and the risks specific to the asset. For the purpose of impairment testing, assets that cannot be tested individually are grouped together into the smallest group of assets that generates cash inflows from continuing use that are largely independent of the cash inflows of other assets or groups of assets (the “cash-generating unit”). Cash-generating units are determined to be at product-group level cash inflows.
The goodwill acquired in a business combination, for the purpose of impairment testing, is allocated to cash-generating units, or (“CGU”). For the purposes of goodwill impairment testing, CGUs to which goodwill has been allocated are aggregated so that the level at which impairment is tested reflects the lowest level at which goodwill is monitored for internal reporting purposes. Goodwill acquired in a business combination is allocated to groups of CGUs that are expected to benefit from the synergies of the combination.
An impairment loss is recognised if the carrying amount of an asset or its CGU exceeds its estimated recoverable amount. Impairment losses are recognised in profit or loss. Impairment losses recognised in respect of CGUs are allocated first to reduce the carrying amount of any goodwill allocated to the units, and then to reduce the carrying amounts of the other assets in the unit (group of units) on a pro rata basis.
An impairment loss in respect of goodwill is not reversed. In respect of other assets, impairment losses recognised in prior periods are assessed at each reporting date for any indications that the loss has decreased or no longer exists. An impairment loss is reversed if there has been a change in the estimates used to determine the recoverable amount. An impairment loss is reversed only to the extent that the asset’s carrying amount does not exceed the carrying amount that would have been determined, net of depreciation or amortisation, if no impairment loss had been recognised.
2.9 InventoriesInventories are included at the lower of cost, less any provision for impairment, or net realisable value. Cost is determined on a first-in-first-out basis. Inventory provisions have been made for slow moving and obsolete stock. These provisions are estimates and the actual costs and timing of future cash flows are dependent on future events. The difference between expectations and the actual future liability will be accounted for in the period when such determination is made.
2.10 TaxationTax on the profit or loss for the year comprises current and deferred tax. Tax is recognised in the income statement except to the extent that it relates to items recognised directly in equity, in which case it is recognised in equity.
Current tax is the expected tax payable or receivable on the taxable income or loss for the year, using tax rates enacted or substantively enacted at the balance sheet date, and any adjustment to tax payable in respect of previous years.
65
Ove
rview
Fina
ncia
l State
men
tsA
dd
ition
al in
form
atio
nG
ove
rna
nce
Strate
gic R
ep
ort
Financial Statements | Notes to the Financial Statements

NOTES TO THE FINANCIAL STATEMENTS CONTINUEDfor the year ended 31 December
2. Summary of significant accounting policies continued2.10 Taxation continuedDeferred tax is provided on temporary differences between the carrying amounts of assets and liabilities for financial reporting purposes and the amounts used for taxation purposes. The following temporary differences are not provided for: the initial recognition of goodwill; the initial recognition of assets or liabilities that affect neither accounting nor taxable profit other than in a business combination, and differences relating to investments in subsidiaries to the extent that they will probably not reverse in the foreseeable future. The amount of deferred tax provided is based on the expected manner of realisation or settlement of the carrying amount of assets and liabilities, using tax rates enacted or substantively enacted at the balance sheet date.
A deferred tax asset is recognised only to the extent that it is probable that future taxable profits will be available against which the temporary difference can be utilised.
2.11 Derivative financial instruments and hedging activitiesInterest rate riskDerivative financial instruments are used to manage exposure to market risk from treasury operations. The financial instrument used by the Group is interest rate swaps. The Group does not hold or issue derivative financial instruments for trading or speculative purposes. Derivative financial instruments are recognised in the balance sheet at fair value and then re-measured at subsequent reporting dates. The fair value is calculated by reference to market interest rates and supported by counterparty confirmation.
The interest rate swaps are designated as cash flow hedges.
The effective portion of changes in the fair value of derivative financial instruments that are designated as cash flow hedges is recognised in other comprehensive income, while the gain or loss relating to the ineffective portion is recognised immediately in the income statement. Changes in the fair value of derivative financial instruments that are not designated as cash flow hedges are recognised in the income statement as they arise.
Translation riskExchange differences arising from the translation of the net investment in foreign operations are recognised directly in equity. Gains and losses on those hedging instruments designated as hedges of the net investment in foreign operations, are recognised in equity to the extent that the hedging relationship is effective; these amounts are included in exchange differences on translation of foreign operations as stated in the statement of comprehensive income. Gains and losses relating to hedge ineffectiveness are recognised immediately in the income statement for the period. Gains and losses accumulated in the translation reserve are reclassified to the income statement when the foreign investment is disposed of.
2.12 Non-derivative financial instrumentsNon-derivative financial instruments comprise investments in equity and debt securities, trade and other receivables, cash and cash equivalents, loans and borrowings, and trade and other payables.
Trade and other receivablesTrade and other receivables are recognised initially at fair value. Subsequent to initial recognition they are measured at amortised cost using the effective interest method, less any impairment losses.
Trade and other payablesTrade and other payables are recognised initially at fair value. Subsequent to initial recognition they are measured at amortised cost using the effective interest method.
Cash and cash equivalentsCash and cash equivalents comprise cash balances and call deposits. Bank overdrafts that are repayable on demand and form an integral part of the Group’s cash management are included as a component of cash and cash equivalents for the purpose only of the cash flow statement.
Investments in debt and equity securitiesThe Company’s Investment in subsidiaries are stated at amortised cost less impairment.
Interest-bearing borrowingsInterest-bearing borrowings are recognised initially at fair value less attributable transaction costs. Subsequent to initial recognition, interest-bearing borrowings are stated at amortised cost using the effective interest method, less any impairment losses.
Alliance Pharma plc Annual Report and Accounts 201766

2.13 Employee benefits – Share-based payment transactionsShare-based payment arrangements in which the Group receives goods or services as consideration for its own equity instruments are accounted for as equity-settled share-based payment transactions, regardless of how the equity instruments are obtained by the Group.
The grant date fair value of share-based payment awards granted to employees is recognised as an employee expense, with a corresponding increase in equity, over the period that the employees become unconditionally entitled to the awards. The fair value of the options granted is measured using an option valuation model, taking into account the terms and conditions upon which the options were granted. The amount recognised as an expense is adjusted to reflect the actual number of awards for which the related service and non-market vesting conditions are expected to be met, such that the amount ultimately recognised as an expense is based on the number of awards that do meet the related service and non-market performance conditions at the vesting date. For share-based payment awards with non-vesting conditions, the grant date fair value of the share-based payment is measured to reflect such conditions and there is no true-up for differences between expected and actual outcomes.
The entirety of the share-based payment charge is recharged to subsidiaries.
2.14 EquityEquity comprises the following for both the Company and Group:
“Share capital” represents the nominal value of equity shares.
“Share premium” represents the excess over nominal value of the fair value of consideration received for equity shares, net of expenses of the share issue.
“Share option reserve” represents equity-settled share-based employee remuneration
“Retained earnings” represents retained profit.
Also included in Group equity is:
“Reverse takeover reserve” represents the difference between the fair value and nominal value of shares issued on a reverse takeover.
“Other reserves” represents the fair value of derivative financial instruments at the balance sheet date that are designated as cash flow hedges net of deferred tax, less amounts reclassified through other comprehensive income.
“Translation reserve” represents gains and losses arising on translation of the net assets of overseas operations into Sterling.
2.15 InvestmentsInvestments in subsidiaries included in the Company’s balance sheet are stated at cost less any provision for impairment.
2.16 ProvisionsProvisions are recognised when there is a present legal or constructive obligation as a result of a past event, for which it is probable that a transfer of economic benefits will be required to settle the obligation and where a reliable estimate can be made of the amount of the obligation.
Where material, the provisions have been discounted to their present value.
2.17 Business combinationsBusiness combinations are accounted for using the acquisition accounting method. Identifiable assets and liabilities acquired are measured at fair value at acquisition date. Costs related to the acquisition, other than those associated with the issue of debt or equity securities, are expensed as incurred.
Any contingent consideration payable is recognised at fair value at the acquisition date. If the contingent consideration is classified as equity, it is not remeasured and settlement is accounted for within equity. Otherwise, subsequent changes to the fair value of the contingent consideration are recognised in profit or loss.
2.18 Going ConcernThe current rate of cash generation by the Group comfortably exceeds the capital and debt servicing needs of the business. The Board remains confident that all the bank covenants will continue to be met and the Group will be able to meet its working capital needs for at least the next 12 months.
After making enquiries, the Directors have formed a judgement that there is reasonable expectation that the Group has adequate resources to continue in operational existence for the foreseeable future. For this reason, the Directors continue to adopt the going concern basis in preparing the financial statements.
67
Ove
rview
Fina
ncia
l State
men
tsA
dd
ition
al in
form
atio
nG
ove
rna
nce
Strate
gic R
ep
ort
Financial Statements | Notes to the Financial Statements

NOTES TO THE FINANCIAL STATEMENTS CONTINUEDfor the year ended 31 December
2. Summary of significant accounting policies continued2.19 New standards not yet appliedA number of new standards, amendments to standards and interpretations are not yet effective for the year ended 31 December 2017 and have not been applied in preparing these financial statements. The following list is not comprehensive but includes the most significant to these financial statements:
• IFRS 9 ‘Financial Instruments’ (2014), representing the completion of the IASB project to replace IAS 39 ‘Financial Instruments: Recognition and Measurement’. The new standard introduces extensive changes to IAS 39’s guidance on the classification and measurement of financial assets and introduces a new ‘expected credit loss’ model for the impairment of financial assets. IFRS 9 also provides new guidance on the application of hedge accounting. The new standard is required to be applied for annual reporting periods beginning on or after 1 January 2018.
• IFRS 15 ‘Revenue from Contracts with Customers’ replaces IAS 18 ‘Revenue’, IAS 11 ‘Construction Contracts’, and several revenue-related interpretations. The new standard establishes a control-based revenue recognition model and provides additional guidance in many areas not covered in detail under existing IFRSs, including how to account for arrangements with multiple performance obligations, variable pricing, customer refund rights, supplier repurchase options, and other common complexities. The new standard is required to be applied for annual reporting periods beginning on or after 1 January 2018.
• IFRS 16 ‘Leases’ replaces IAS 17 ‘Leases’. The new standard requires lessees to recognise a lease liability reflecting future lease payments and a ‘right-of-use’ asset for virtually all lease contracts, excluding certain short-term leases and leases of low-value assets. The new standard is required to be applied for annual reporting periods beginning on or after 1 January 2019.
The Group is currently assessing the impact of the new standards on the financial position or consolidated results of the Group and continually reviews amendments to the standards made under the IASB’s annual improvements project.
3. Segmental reportingOperating segmentsThe Group is engaged in a single business activity of pharmaceuticals. The Group’s pharmaceutical business consists of the marketing and sales of acquired products. The Group’s Board of Directors (“the Board”) is the Group’s Chief Operating Decision Maker (“CODM”), as defined by IFRS 8, and all significant operating decisions are taken by the Board. In assessing performance, the Board reviews financial information on an integrated basis for the Group, substantially in the form of, and on the same basis as, the Group’s IFRS financial statements.
Geographical informationThe following revenue information is based on the geographical location of the customer:
Year ended 31 December
2017£000s
Year ended 31 December
2016£000s
United Kingdom 52,355 49,411
Rest of Europe 29,982 29,006
Rest of the World 20,978 19,075
103,315 97,492
Non-current assets are located within the United Kingdom, France, Italy and the United States of America.
Major customersDuring the year there were 2 customers who separately comprised 10% or more of revenue (year ended 31 December 2016: 1).
Year ended 31 December
2017£000s
Year ended 31 December
2016£000s
Major customer 1 22,542 17,660
Major customer 2 10,597 9,406
33,139 27,066
Alliance Pharma plc Annual Report and Accounts 201768
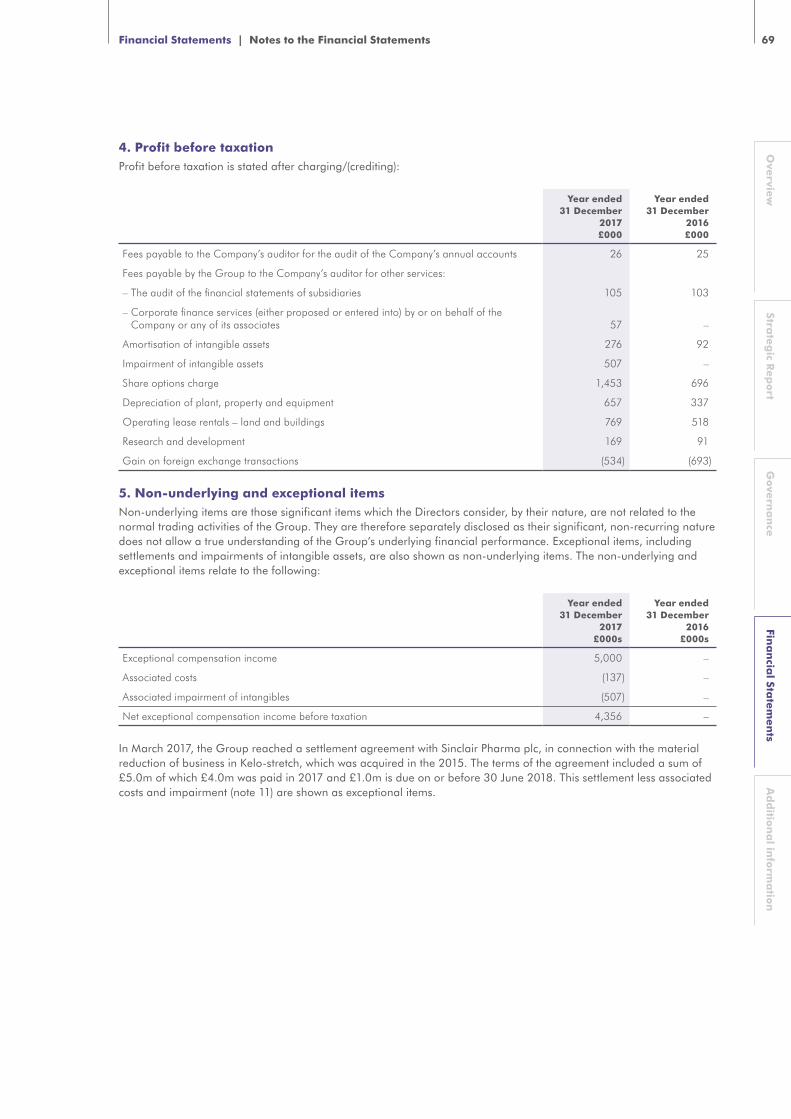
4. Profit before taxationProfit before taxation is stated after charging/(crediting):
Year ended 31 December
2017£000
Year ended 31 December
2016£000
Fees payable to the Company’s auditor for the audit of the Company’s annual accounts 26 25
Fees payable by the Group to the Company’s auditor for other services:
– The audit of the financial statements of subsidiaries 105 103
– Corporate finance services (either proposed or entered into) by or on behalf of the Company or any of its associates 57 –
Amortisation of intangible assets 276 92
Impairment of intangible assets 507 –
Share options charge 1,453 696
Depreciation of plant, property and equipment 657 337
Operating lease rentals – land and buildings 769 518
Research and development 169 91
Gain on foreign exchange transactions (534) (693)
5. Non-underlying and exceptional itemsNon-underlying items are those significant items which the Directors consider, by their nature, are not related to the normal trading activities of the Group. They are therefore separately disclosed as their significant, non-recurring nature does not allow a true understanding of the Group’s underlying financial performance. Exceptional items, including settlements and impairments of intangible assets, are also shown as non-underlying items. The non-underlying and exceptional items relate to the following:
Year ended 31 December
2017 £000s
Year ended 31 December
2016£000s
Exceptional compensation income 5,000 –
Associated costs (137) –
Associated impairment of intangibles (507) –
Net exceptional compensation income before taxation 4,356 –
In March 2017, the Group reached a settlement agreement with Sinclair Pharma plc, in connection with the material reduction of business in Kelo-stretch, which was acquired in the 2015. The terms of the agreement included a sum of £5.0m of which £4.0m was paid in 2017 and £1.0m is due on or before 30 June 2018. This settlement less associated costs and impairment (note 11) are shown as exceptional items.
69
Ove
rview
Fina
ncia
l State
men
tsA
dd
ition
al in
form
atio
nG
ove
rna
nce
Strate
gic R
ep
ort
Financial Statements | Notes to the Financial Statements

NOTES TO THE FINANCIAL STATEMENTS CONTINUEDfor the year ended 31 December
6. Finance costs
Year ended 31 December
2017£000s
Year ended 31 December
2016£000s
Interest payable and similar charges
On loans and overdrafts (2,719) (2,868)
Amortised finance issue costs (303) (358)
Notional interest (42) (129)
(3,064) (3,355)
Change in fair value of deferred consideration 618 (840)
Finance income
Interest income 104 111
Other finance income – foreign exchange movements 534 693
638 804
Finance costs – net (1,808) (3,391)
Notional interest relates to the unwinding of the deferred consideration on the Macuhealth acquisition. The current year decrease in deferred consideration relates to changes in the original estimated amounts payable for the acquisitions of MacuVision and Nutraceutical brands. The previous year increase related to a change in the original estimated amount payable for the Macuvision acquisition. These changes are caused by differences in trading performance compared to acquisition forecasts.
7. Directors and employeesEmployee benefit expenses for the Group during the year were as follows:
Year ended 31 December
2017£000s
Year ended 31 December
2016£000s
Wages and salaries 11,102 9,481
Social security costs 2,100 1,375
Other pension costs (note 28) 766 644
Share-based employee remuneration (note 24) 1,453 696
15,421 12,196
The average number of employees of the Group during the period was:
Year ended 31 December
2017Number
Year ended 31 December
2016Number
Management and administration 182 143
Remuneration in respect of Directors was as follows:
Year ended 31 December
2017£000s
Year ended 31 December
2016£000s
Short-term employee benefits 949 1,059
Post-employment benefits 151 45
1,100 1,104
Gain on share options exercised by Directors during the year was £14,000 (2016: £nil).
Alliance Pharma plc Annual Report and Accounts 201770

The amounts set out above include remuneration in respect of the highest-paid Director as follows:
Year ended 31 December
2017£000s
Year ended 31 December
2016£000s
Emoluments for qualifying services 320 314
Pension contributions 114 10
434 324
During the period contributions were paid to defined contribution schemes for three Directors (2016: three).
Key management of the Group are the Board of Directors (including non-executive directors). Benefit expenses in respect of the key management was as follows:
Year ended 31 December
2017£000s
Year ended 31 December
2016£000s
Short-term employee benefits 949 1,059
Post-employment benefits 151 45
1,100 1,104
Average number of members of the Board of Directors (including non-executive directors) for the year ended 31 December 2017 was seven (2016: seven).
8. TaxationAnalysis of the (credit)/charge for the period is as follows:
Year ended 31 December
2017£000s
Year ended 31 December
2016£000s
Corporation tax
In respect of current period 3,573 3,552
Adjustment in respect of prior periods 44 32
3,617 3,584
Deferred tax (see note 22)
Origination and reversal of temporary differences (5,101) 539
Adjustment in respect of prior periods 943 4
Taxation (541) 4,127
71
Ove
rview
Fina
ncia
l State
men
tsA
dd
ition
al in
form
atio
nG
ove
rna
nce
Strate
gic R
ep
ort
Financial Statements | Notes to the Financial Statements

NOTES TO THE FINANCIAL STATEMENTS CONTINUEDfor the year ended 31 December
8. Taxation continuedThe difference between the total tax (credit)/charge shown above and the amount calculated by applying the standard rate of UK corporation tax to the profit before tax is as follows:
Year ended 31 December
2017£000s
Year ended 31 December
2016£000s
Profit before taxation 28,369 22,219
Profit before taxation multiplied by standard rate of corporation tax in the United Kingdom of 19.25% (2016: 20.00%) 5,461 4,444
Effect of:
Non-deductible expenses 145 376
Non-taxable income (1,216) (60)
Adjustment in respect of prior periods 987 36
Impact of reduction in UK tax rate on deferred tax (101) (755)
Impact of reduction in US and French tax rate on deferred tax (5,958) –
Differing tax rates on overseas earnings 182 205
Share options (15) (133)
Other differences and Foreign exchange (26) 14
Total taxation (541) 4,127
Changes to the UK corporation tax rate were announced in Finance Act (No 2) 2015 and Finance Act 2016, reducing the UK’s main rate to 17% from 1 April 2020. As the change was substantively enacted at the balance sheet date the effect is included in these financial statements.
During 2017 US and French tax reform were both substantively enacted. The deferred tax rates applied to US and French timing differences have hence changed from 35.0% to 24.0% and from 33.3% to 25.0% respectively.
To exclude the impact of tax rate changes and non-underlying tax charges the Group has calculated “adjusted underlying effective tax rate” as an alternative performance measure in note 33.
9. Dividends
Year ended 31 December 2017
Year ended 31 December 2016
Pence/share £000s Pence/share £000s
Amounts recognised as distributions to owners in the year
Interim dividend for the prior financial year 0.403 1,904 0.366 1,714
Final dividend for the prior financial year 0.807 3,825 0.734 3,438
1.210 5,729 1.100 5,152
Interim dividend for the current financial year 0.443 2,104 0.403 1,904
The proposed final dividend of 0.888 pence per share for the current financial year was approved by the Board of Directors on 23 March 2018 and is subject to the approval of shareholders at the Annual General Meeting. The proposed dividend has not been included as a liability as at 31 December 2017 in accordance with IAS 10 Events After the Balance Sheet Date. The interim dividend for the current financial year was paid on 11 January 2018. Subject to shareholder approval, the final dividend will be paid on 11 July 2018 to shareholders on the register of members on 15 June 2018.
Alliance Pharma plc Annual Report and Accounts 201772
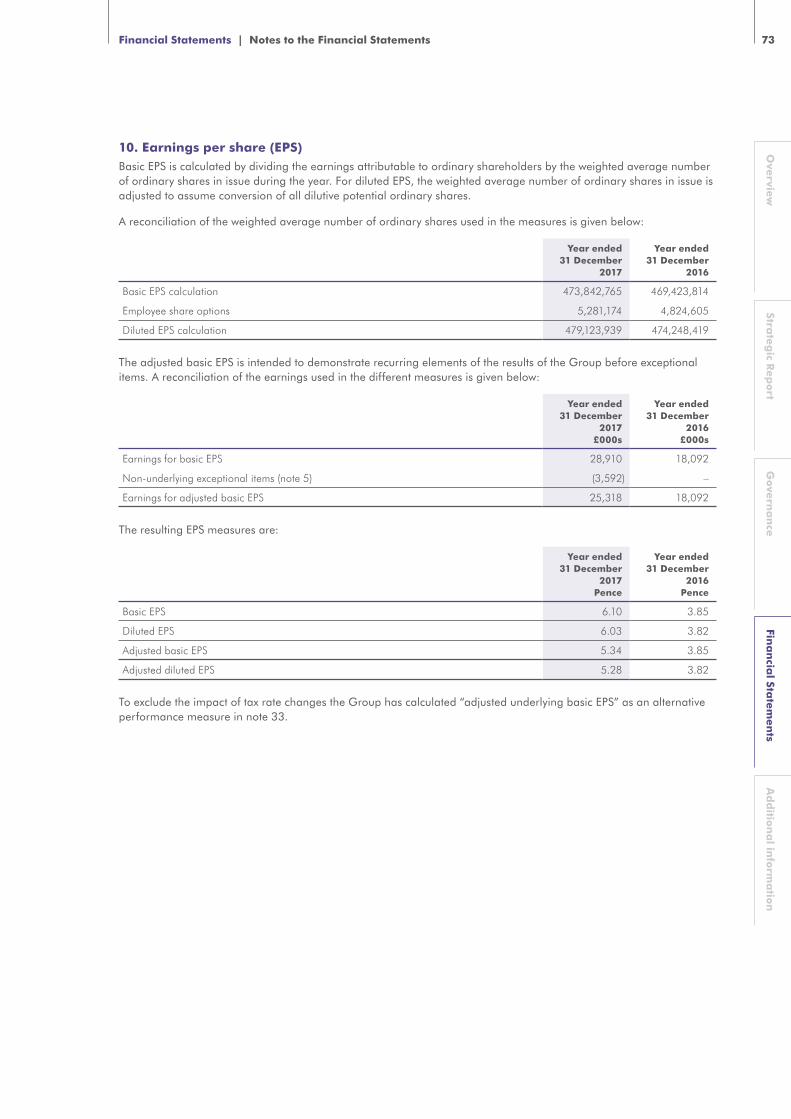
10. Earnings per share (EPS)Basic EPS is calculated by dividing the earnings attributable to ordinary shareholders by the weighted average number of ordinary shares in issue during the year. For diluted EPS, the weighted average number of ordinary shares in issue is adjusted to assume conversion of all dilutive potential ordinary shares.
A reconciliation of the weighted average number of ordinary shares used in the measures is given below:
Year ended 31 December
2017
Year ended 31 December
2016
Basic EPS calculation 473,842,765 469,423,814
Employee share options 5,281,174 4,824,605
Diluted EPS calculation 479,123,939 474,248,419
The adjusted basic EPS is intended to demonstrate recurring elements of the results of the Group before exceptional items. A reconciliation of the earnings used in the different measures is given below:
Year ended 31 December
2017£000s
Year ended 31 December
2016£000s
Earnings for basic EPS 28,910 18,092
Non-underlying exceptional items (note 5) (3,592) –
Earnings for adjusted basic EPS 25,318 18,092
The resulting EPS measures are:
Year ended 31 December
2017Pence
Year ended 31 December
2016Pence
Basic EPS 6.10 3.85
Diluted EPS 6.03 3.82
Adjusted basic EPS 5.34 3.85
Adjusted diluted EPS 5.28 3.82
To exclude the impact of tax rate changes the Group has calculated “adjusted underlying basic EPS” as an alternative performance measure in note 33.
73
Ove
rview
Fina
ncia
l State
men
tsA
dd
ition
al in
form
atio
nG
ove
rna
nce
Strate
gic R
ep
ort
Financial Statements | Notes to the Financial Statements

NOTES TO THE FINANCIAL STATEMENTS CONTINUEDfor the year ended 31 December
11. Goodwill and intangible assets
The GroupGoodwill
£000s
Brands and distribution
rights£000s
Development costs
£000s
Assets under development
£000sTotal
£000s
Cost
At 1 January 2017 16,197 249,376 704 2,500 268,777
Additions 368 17,193 459 – 18,020
Transfer – 438 (438) – –
Exchange adjustments – (3,447) – – (3,447)
At 31 December 2017 16,565 263,560 725 2,500 283,350
Amortisation and impairment
At 1 January 2017 – 3,944 – – 3,944
Impairment for the year – 507 – – 507
Amortisation for the year – 276 – – 276
At 31 December 2017 – 4,727 – – 4,727
Net book amount
At 31 December 2017 16,565 258,833 725 2,500 278,623
At 1 January 2017 16,197 245,432 704 2,500 264,833
The Group Goodwill
£000s
Brands and distribution
rights£000s
Development costs
£000s
Assets under development
£000sTotal
£000s
Cost
At 1 January 2016 15,922 235,824 438 1,500 253,684
Additions – 2,339 266 1,000 3,605
Additions due to acquisition 275 – – – 275
Exchange adjustments – 11,213 – – 11,213
At 31 December 2016 16,197 249,376 704 2,500 268,777
Amortisation and impairment
At 1 January 2016 – 3,852 – – 3,852
Amortisation for the year – 92 – – 92
At 31 December 2016 – 3,944 – – 3,944
Net book amount
At 31 December 2016 16,197 245,432 704 2,500 264,833
At 1 January 2016 15,922 231,972 438 1,500 249,832
Goodwill and the majority of brands and distribution rights are considered to have indefinite useful economic lives and are therefore subject to an impairment review at least annually.
Alliance Pharma plc Annual Report and Accounts 201774

Brands and distribution rightsKey judgement – useful economic livesApplying indefinite lives to certain acquired brands is appropriate due to the stable long-term nature of the business and the enduring nature of the brands. These brands are assessed on acquisition to ensure they meet set criteria including an established and stable sales history.
Where distribution rights are deemed to have a finite life they are amortised accordingly. Amortisation is included in administration and marketing expenses. The remainder of the distribution rights have no defined time period or there is evidence to support the renewal of distribution rights without disproportionate cost. These assets are therefore treated the same as acquired brands.
It is the opinion of the Directors that the indefinite life assets meet the criteria set out in IAS 38. This assessment is made on an asset by asset basis taking into account:
• How long the brand has been established in the market and subsequent resilience to economic and social changes;
• Stability of the industry in which the brand is used;
• Potential obsolescence or erosion of sales;
• Barriers to entry;
• Whether sufficient marketing promotional resourcing is available; and
• Dependency on other assets with defined useful economic lives.
Certain brands were acquired with patent protection, which lasts for a finite period of time. It is the opinion of the Directors that these patents do not provide any incremental value to the value of the brand and therefore no separate value has been placed on these patents. This assessment is based on a view of future profitability after patent expiry and past experience with similar brands.
Development costsCapitalised costs relate to clinical development and regulatory plans expected to be commercialised in future.
Goodwill The net book value of brand and distribution rights and goodwill which are considered to have indefinite useful lives are allocated to CGUs in the following table. Goodwill relating to the acquisition of certain assets and businesses from Sinclair IS Pharma plc is allocated to the group of related product CGUs. Other Goodwill amounts are allocated to the product CGU with which they were originally acquired.
75
Ove
rview
Fina
ncia
l State
men
tsA
dd
ition
al in
form
atio
nG
ove
rna
nce
Strate
gic R
ep
ort
Financial Statements | Notes to the Financial Statements

NOTES TO THE FINANCIAL STATEMENTS CONTINUEDfor the year ended 31 December
11. Goodwill and intangible assets continued
Year ended 31 December 2017 Goodwill
£000s
Brands and distribution rights
£000sTotal
£000s
Menadiol, Vitamin E & Others 598 12,876 13,474
Forceval, Amantadine & Others – 12,931 12,931
Vamousse – 11,596 11,596
MacuShield 1,748 8,740 10,488
Nu-Seals – 9,100 9,100
SkinSafe, Dansac & Others 1,849 8,043 9,892
Timodine & Buccastem – 7,697 7,697
Syntometrine (excluding UK) – 7,527 7,527
Ametop – 5,575 5,575
Others 1,147 31,462 32,609
Products acquired from Sinclair
Kelo-cote (non EU, excluding US) – 40,842 40,842
Oxyplastine, Fazol & Others – 26,158 26,158
Haemopressin, Optiflo & Others – 25,000 25,000
Kelo-cote (EU) – 17,800 17,800
Flamma Franchise – 17,400 17,400
Aloclair – 14,000 14,000
Goodwill 11,223 – 11,223
16,565 256,747 273,312
Year ended 31 December 2016 Goodwill
£000s
Brands and distribution rights
£000sTotal
£000s
Menadiol, Vitamin E & Others 598 12,876 13,474
Forceval, Amantadine & Others – 12,931 12,931
MacuShield 1,748 8,740 10,488
Nu-Seals – 9,100 9,100
SkinSafe, Dansac & Others 1,849 8,043 9,892
Timodine & Buccastem – 7,697 7,697
Syntometrine (excluding UK) – 7,527 7,527
Others 1,147 31,960 33,107
Products acquired from Sinclair
Kelo-cote (non EU, excluding US) – 44,826 44,826
Oxyplastine, Fazol & Others – 25,384 25,384
Haemopressin, Optiflo & Others – 25,000 25,000
Kelo-cote (EU) – 17,800 17,800
Flamma Franchise – 17,400 17,400
Aloclair – 14,000 14,000
Goodwill 10,855 – 10,855
16,197 243,284 259,481
Alliance Pharma plc Annual Report and Accounts 201776

Recent acquisitionsThe following acquisition activities took place in the year:
On 1 December 2017, the Group acquired the worldwide rights to Ametop from global medical technology business Smith & Nephew for a consideration of US$7.5m (£5.6m).
On 28 December 2017, the Group acquired the worldwide rights to Vamousse from TyraTech Inc for an initial cash consideration of US$13.0m (£9.7m) and deferred contingent consideration of between US$nil and US$4.5m. Up to US$2.0m of this the deferred consideration is payable in 2020, and up to US$2.5m is payable in 2021, both dependent on the revenue growth of Vamousse. An estimated amount of US$2.5m (£1.9m) based on forecast sales is included in the Vamousse intangible addition and other non-current liabilities. Separate cash consideration of US$0.5m (£0.4m) was paid for inventories acquired (note 14).
In respect of Vamousse, the amounts included in the consolidated income statement since 28 December 2017 are revenues of £0.1m and gross profit of £0.1m. Had the transaction occurred 1 January 2017 estimated contribution to Group revenues would have been £4.9m and gross profit of £3.4m, based on the prior year financial results.
In the prior year the following acquisition activities took place:
On 27 October 2016, the Group secured the distribution rights on additional territories for MacuShield. The consideration recognised in relation to this was £2.3m and the distribution rights are for a period of ten years which the balance is therefore being amortised over.
On 12 September 2016 the Group in-licensed Diclectin for a further nine European territories, following the UK in-license acquired in 2015. The total amount paid to Duchesnay for all territories was £1.5m with a further £1.0m payable to Duchesnay on successful licence applications; the total £2.5m is included within assets under development and the £1.0m deferred consideration is included within liabilities. The amount included within assets under development will be amortised when the product is ready for launch.
As stated in our announcement in July 2017, the Medicine and Healthcare products Regulatory Agency (“MHRA”) did not approve Diclectin for the UK which was unexpected. Our regulatory team has now had time to work with Duchesnay Inc. of Canada (“Duchesnay”), the licensor and marketing authorisation applicant, to better understand the objections of the MHRA. Whilst the communication between the MHRA and Duchesnay remains confidential, we believe that good progress is being made in resolving some of the issues initially expressed by the regulator. Diclectin is a much needed product as there is no licensed medicine for treating nausea and vomiting of pregnancy in the UK.
Duchesnay, the licence applicant, has since re-opened discussions with the regulator and the Board has concluded that it continues to be appropriate to retain the intangible asset (and the associated deferred consideration) whilst this review is underway. In the event the licence for Diclectin is not approved, the amounts paid to Duchesnay (£1.5m) are fully refundable and the deferred consideration (£1.0m) would be cancelled resulting in no net financial impact in the Income Statement.
ImpairmentAs explained in note 2.8 all intangible assets are stated at the lower of cost less provision for amortisation and impairment or the recoverable amount.
Indefinite life assets are tested for impairment at least annually, or more frequently if there are indicators that amounts might be impaired. These assets are tested at CGU level (or at group of CGUs level in the case of goodwill relating to the acquisition of certain assets and businesses from Sinclair IS Pharma plc) as the Directors believe these CGUs generate largely independent cash inflows.
The impairment test involves determining the recoverable amount of the relevant cash-generating unit, which corresponds to the higher of the fair value less costs to sell or its value in use.
The value in use calculation uses cash flow projections based on financial forecasts for the next two years extrapolated to perpetuity. Financial forecasts for the next two years are based on the approved annual budget for 2018 and strategic projections in 2019 representing the best estimate of future performance. Margins are based on past experience and cost estimates.
77
Ove
rview
Fina
ncia
l State
men
tsA
dd
ition
al in
form
atio
nG
ove
rna
nce
Strate
gic R
ep
ort
Financial Statements | Notes to the Financial Statements

NOTES TO THE FINANCIAL STATEMENTS CONTINUEDfor the year ended 31 December
11. Goodwill and intangible assets continuedImpairment continuedKey judgement – value in use assumptionsThe key assumptions on which cash flow projections are made are:
• There will be between 0.0% and 2.0% inflationary growth for 2020 and beyond, varying based on the Group’s long-term growth projections;
• Cash flows are discounted at an appropriate rate, being equal to the Group’s WACC adjusted where appropriate for country specific risks, of between 8.0% and 11.7%; and
• Approved budgets and forecasts for 2018 and 2019, based on management’s best estimate of cash flows by individual CGU.
Kelo-stretch has been impaired in the current year by £0.5m. An indicator of impairment on this product was identified due to the material reduction in the business and resulting exceptional compensation income received (note 5). The value in use has been compared against the carrying value of the asset to calculate the impairment.
The Group has conducted sensitivity analysis on the impairment test. The valuations indicate sufficient headroom such that a reasonably possible change in a key assumption is unlikely to result in an impairment.
Development projects are reviewed as to the likelihood of their completion and valued using a discounted cash flow, using appropriate risk factors, to assess whether the project is impaired.
12. Property, plant and equipment
The Group
Computerequipment
£000s
Fixtures,fittings andequipment
£000s
Plant &machinery
£000s
Motor vehicles
£000sTotal
£000s
CostAt 1 January 2017 1,405 1,792 127 8 3,332Additions 1,666 570 – – 2,236Transfers (83) (87) 170 – –Disposals (52) – (104) (8) (164)
At 31 December 2017 2,936 2,275 193 – 5,404
DepreciationAt 1 January 2017 424 1,055 40 7 1,526Provided in the year 454 156 46 1 657Transfers (274) 101 173 – –Disposals (44) – (104) (8) (156)
At 31 December 2017 560 1,312 155 – 2,027
Net book amount At 31 December 2017 2,376 963 38 – 3,377At 1 January 2017 981 737 87 1 1,806
The Group
Computerequipment
£000s
Fixtures, fittings andequipment
£000s
Plant & machinery
£000s
Motor vehicles
£000sTotal
£000s
CostAt 1 January 2016 998 1,320 109 8 2,435Additions 615 497 18 – 1,130Disposals (208) (25) – – (233)At 31 December 2016 1,405 1,792 127 8 3,332
DepreciationAt 1 January 2016 438 981 – 3 1,422Provided in the year 194 99 40 4 337Disposals (208) (25) – – (233)At 31 December 2016 424 1,055 40 7 1,526
Net book amount At 31 December 2016 981 737 87 1 1,806At 1 January 2016 560 339 109 5 1,013
Alliance Pharma plc Annual Report and Accounts 201778
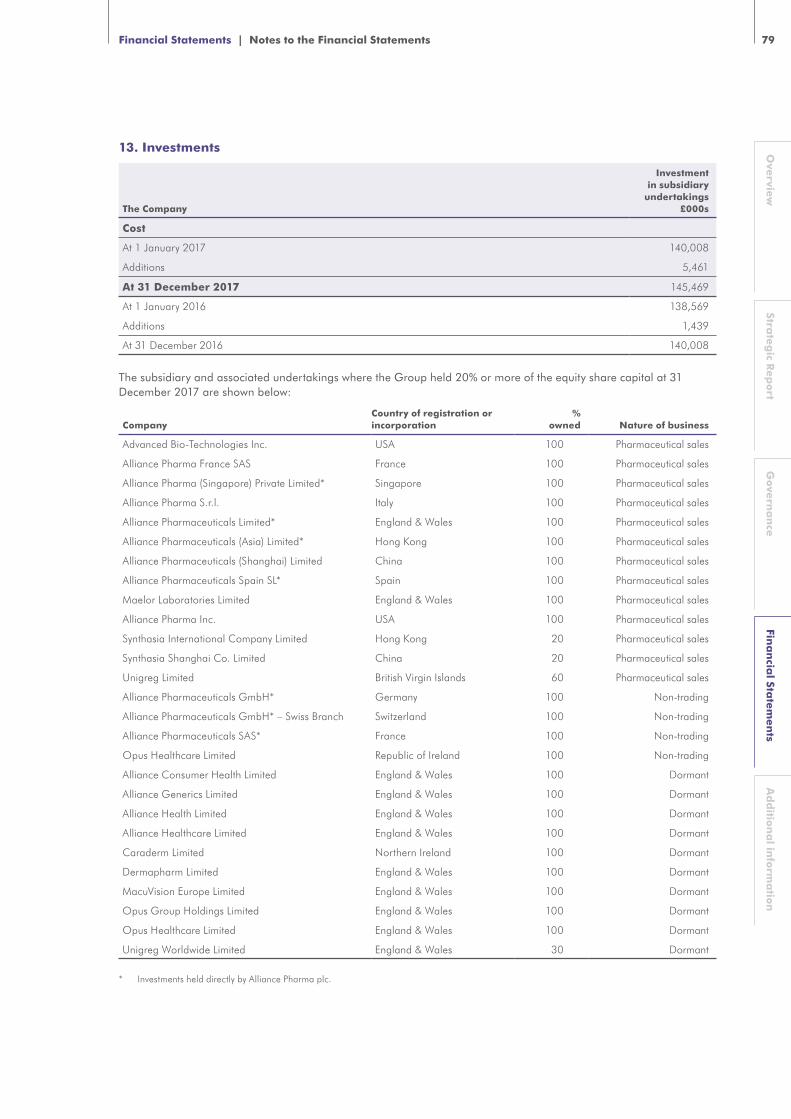
13. Investments
The Company
Investment in subsidiary
undertakings £000s
Cost
At 1 January 2017 140,008
Additions 5,461
At 31 December 2017 145,469
At 1 January 2016 138,569
Additions 1,439
At 31 December 2016 140,008
The subsidiary and associated undertakings where the Group held 20% or more of the equity share capital at 31 December 2017 are shown below:
CompanyCountry of registration or incorporation
%owned Nature of business
Advanced Bio-Technologies Inc. USA 100 Pharmaceutical sales
Alliance Pharma France SAS France 100 Pharmaceutical sales
Alliance Pharma (Singapore) Private Limited* Singapore 100 Pharmaceutical sales
Alliance Pharma S.r.l. Italy 100 Pharmaceutical sales
Alliance Pharmaceuticals Limited* England & Wales 100 Pharmaceutical sales
Alliance Pharmaceuticals (Asia) Limited* Hong Kong 100 Pharmaceutical sales
Alliance Pharmaceuticals (Shanghai) Limited China 100 Pharmaceutical sales
Alliance Pharmaceuticals Spain SL* Spain 100 Pharmaceutical sales
Maelor Laboratories Limited England & Wales 100 Pharmaceutical sales
Alliance Pharma Inc. USA 100 Pharmaceutical sales
Synthasia International Company Limited Hong Kong 20 Pharmaceutical sales
Synthasia Shanghai Co. Limited China 20 Pharmaceutical sales
Unigreg Limited British Virgin Islands 60 Pharmaceutical sales
Alliance Pharmaceuticals GmbH* Germany 100 Non-trading
Alliance Pharmaceuticals GmbH* – Swiss Branch Switzerland 100 Non-trading
Alliance Pharmaceuticals SAS* France 100 Non-trading
Opus Healthcare Limited Republic of Ireland 100 Non-trading
Alliance Consumer Health Limited England & Wales 100 Dormant
Alliance Generics Limited England & Wales 100 Dormant
Alliance Health Limited England & Wales 100 Dormant
Alliance Healthcare Limited England & Wales 100 Dormant
Caraderm Limited Northern Ireland 100 Dormant
Dermapharm Limited England & Wales 100 Dormant
MacuVision Europe Limited England & Wales 100 Dormant
Opus Group Holdings Limited England & Wales 100 Dormant
Opus Healthcare Limited England & Wales 100 Dormant
Unigreg Worldwide Limited England & Wales 30 Dormant
* Investments held directly by Alliance Pharma plc.
79
Ove
rview
Fina
ncia
l State
men
tsA
dd
ition
al in
form
atio
nG
ove
rna
nce
Strate
gic R
ep
ort
Financial Statements | Notes to the Financial Statements

NOTES TO THE FINANCIAL STATEMENTS CONTINUEDfor the year ended 31 December
13. Investments continuedThe registered address in each country is as follows:
Country/Company Address
Advanced Bio-Technologies Inc. 100 N. Tampa Street, Suite 2700, Tampa, FL 33602, United States
Alliance Pharma Inc Corporation Trust Company, 1209 N Orange Street, Wilmington, DE 19801-1120
Alliance Pharma France SAS 69, Avenue Franklin D. Roosevelt, 75008 Paris, France
Alliance Pharmaceuticals SAS 69, Avenue Franklin D. Roosevelt, 75008 Paris, France
Alliance Pharmaceuticals (Shanghai) Limited Room 103, 1st Floor, 56 Meisheng Road, Shanghai Free-Trade-Zone, P.R.C
British Virgin Islands Flemming House, P.O. Box 662, Wickhams Cay, Road Town, Tortola, VG1110
England & Wales Avonbridge House, Bath Road, Chippenham, Wiltshire, SN15 2BB
Germany Hanseatic Trade Center, Am Sandtorkai 41, D-20457 Hamburg, Germany
Hong Kong Room 2105, 21/ F Office Tower, Langham Place, 8 Argyle Street, Mongkok, Kowloon
Italy Via Brera 6, 20121 Milan, Italy
Northern Ireland 6 Trevor Hill, Newry, County Down, BT34 1DN
Republic of Ireland 6th Floor, South Bank House, Barrow Street, Dublin 4
Singapore 9 Raffles Place, #29–01 Republic Plaza Tower 1, Singapore 04861
Spain Paseo de la Castllana 259 C – 18th Floor, Regus Business Center, Torre de Cristal, Madrid, ZIP Code 28046, Spain
Switzerland Bahnhofstrasse 37, Postfach 2818, CH-8021 Zürich
Synthasia Shanghai Company Limited Units 1901-2,19/F, No.69 Jervois Street, Sheung Wan, Hong Kong
Unless otherwise stated, the share capital comprises ordinary shares and the ownership percentage is provided for each undertaking. All subsidiary undertakings prepare accounts to 31 December, except Unigreg Worldwide Limited which prepares accounts to 31 May.
14. Inventories
The Group
31 December 2017
£000s
31 December 2016
£000s
Finished goods and materials 16,077 17,632
Inventory provision (1,829) (2,276)
14,248 15,356
Inventory costs expensed through the income statement during the year were £36,575,000 (2016: £35,897,000). During the year £442,000 (2016: £792,000) was recognised as an expense relating to the write-down of inventories to net realisable value.
On 1 December 2017, the Group acquired the worldwide rights to Ametop from global medical technology business Smith & Nephew (note 11). As part of this acquisition £0.3m inventories were acquired.
On 28 December 2017, the Group acquired the worldwide rights to Vamousse from TyraTech Inc (note 11). As part of this acquisition £0.4m inventories were acquired.
Alliance Pharma plc Annual Report and Accounts 201780
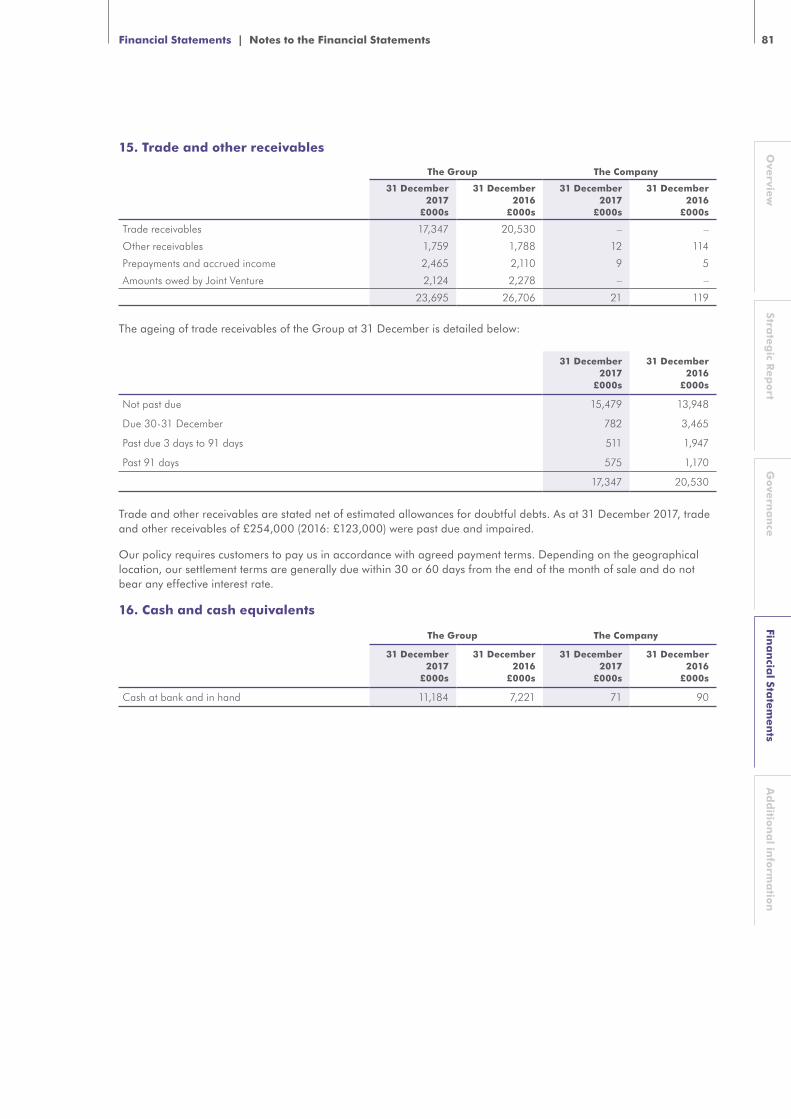
15. Trade and other receivables
The Group The Company
31 December 2017
£000s
31 December 2016
£000s
31 December 2017
£000s
31 December 2016
£000s
Trade receivables 17,347 20,530 – –
Other receivables 1,759 1,788 12 114
Prepayments and accrued income 2,465 2,110 9 5
Amounts owed by Joint Venture 2,124 2,278 – –
23,695 26,706 21 119
The ageing of trade receivables of the Group at 31 December is detailed below:
31 December 2017
£000s
31 December 2016
£000s
Not past due 15,479 13,948
Due 30-31 December 782 3,465
Past due 3 days to 91 days 511 1,947
Past 91 days 575 1,170
17,347 20,530
Trade and other receivables are stated net of estimated allowances for doubtful debts. As at 31 December 2017, trade and other receivables of £254,000 (2016: £123,000) were past due and impaired.
Our policy requires customers to pay us in accordance with agreed payment terms. Depending on the geographical location, our settlement terms are generally due within 30 or 60 days from the end of the month of sale and do not bear any effective interest rate.
16. Cash and cash equivalents
The Group The Company
31 December 2017
£000s
31 December 2016
£000s
31 December 2017
£000s
31 December 2016
£000s
Cash at bank and in hand 11,184 7,221 71 90
81
Ove
rview
Fina
ncia
l State
men
tsA
dd
ition
al in
form
atio
nG
ove
rna
nce
Strate
gic R
ep
ort
Financial Statements | Notes to the Financial Statements
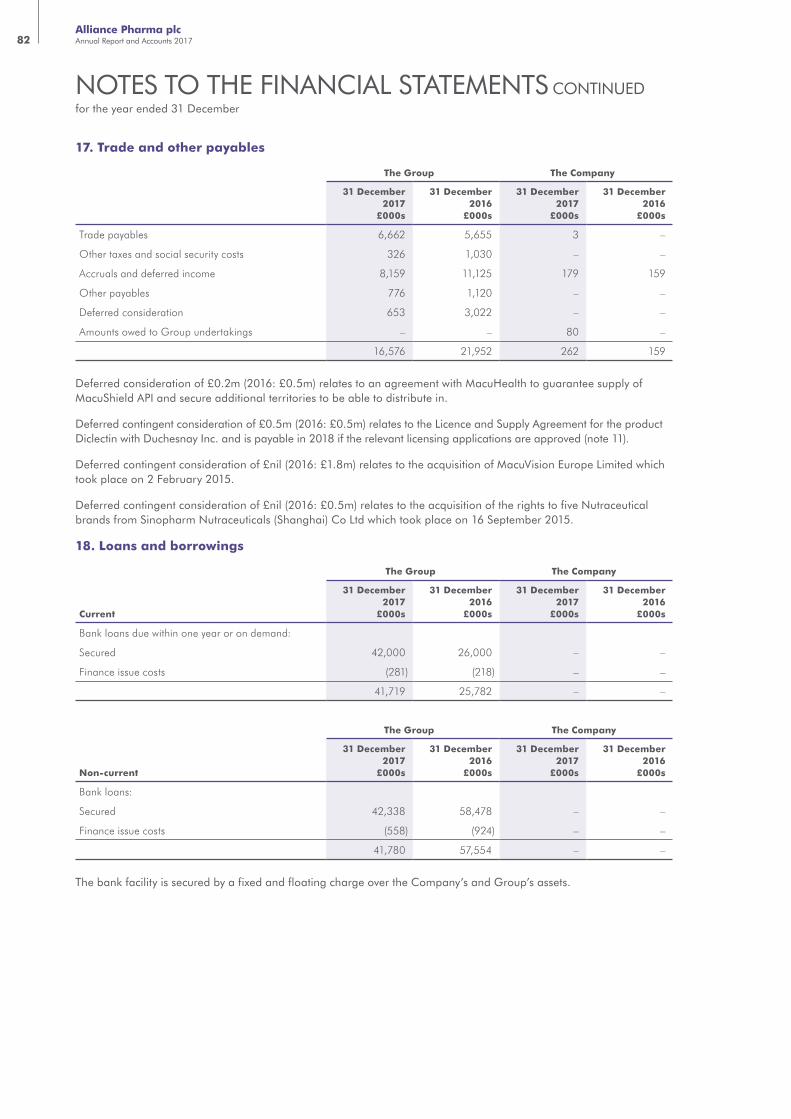
NOTES TO THE FINANCIAL STATEMENTS CONTINUEDfor the year ended 31 December
17. Trade and other payables
The Group The Company
31 December 2017
£000s
31 December 2016
£000s
31 December 2017
£000s
31 December 2016
£000s
Trade payables 6,662 5,655 3 –
Other taxes and social security costs 326 1,030 – –
Accruals and deferred income 8,159 11,125 179 159
Other payables 776 1,120 – –
Deferred consideration 653 3,022 – –
Amounts owed to Group undertakings – – 80 –
16,576 21,952 262 159
Deferred consideration of £0.2m (2016: £0.5m) relates to an agreement with MacuHealth to guarantee supply of MacuShield API and secure additional territories to be able to distribute in.
Deferred contingent consideration of £0.5m (2016: £0.5m) relates to the Licence and Supply Agreement for the product Diclectin with Duchesnay Inc. and is payable in 2018 if the relevant licensing applications are approved (note 11).
Deferred contingent consideration of £nil (2016: £1.8m) relates to the acquisition of MacuVision Europe Limited which took place on 2 February 2015.
Deferred contingent consideration of £nil (2016: £0.5m) relates to the acquisition of the rights to five Nutraceutical brands from Sinopharm Nutraceuticals (Shanghai) Co Ltd which took place on 16 September 2015.
18. Loans and borrowings
Current
The Group The Company
31 December 2017
£000s
31 December 2016
£000s
31 December 2017
£000s
31 December 2016
£000s
Bank loans due within one year or on demand:
Secured 42,000 26,000 – –
Finance issue costs (281) (218) – –
41,719 25,782 – –
Non-current
The Group The Company
31 December 2017
£000s
31 December 2016
£000s
31 December 2017
£000s
31 December 2016
£000s
Bank loans:
Secured 42,338 58,478 – –
Finance issue costs (558) (924) – –
41,780 57,554 – –
The bank facility is secured by a fixed and floating charge over the Company’s and Group’s assets.
Alliance Pharma plc Annual Report and Accounts 201782

19. Other non-current liabilities
The Group The Company
31 December 2017
£000s
31 December 2016
£000s
31 December 2017
£000s
31 December 2016
£000s
Deferred consideration 3,251 1,609 – –
Other non-current liabilities 274 208 – –
3,525 1,817 – –
Deferred contingent consideration of £0.5m (2016: £0.5m) relates to the Licence and Supply Agreement for the product Diclectin with Duchesnay Inc. and is payable during 2019 if the relevant licensing applications are approved (note 11).
Deferred consideration of £0.9m (2016: £1.1m) relates to a MacuHealth agreement to guarantee supply of MacuShield API and extend the territories in which MacuShield can be sold and is payable over 7 years.
Deferred contingent consideration of £1.9m (2016: £nil) relates to the acquisition of the worldwide rights to Vamousse from TyraTech Inc. Up to US$2.0m is payable in 2020, and up to US$2.5m is payable in 2021, both dependent on the revenue growth of Vamousse. An estimated amount based on forecast sales is included in the Vamousse intangible and other non-current liabilities.
20. Financial instrumentsThe Group uses financial instruments comprising borrowings, derivatives, some cash and liquid resources, and various items such as trade receivables and trade payables that arise directly from its operations. The main risks arising from the Group’s financial instruments are liquidity risk, interest rate risk and foreign currency risk. The Board reviews and agrees policies for managing each of these risks and they are summarised below. These policies have remained unchanged from the previous year. In addition to Sterling, the Group also has bank facilities denominated in Euros and US Dollars. The purpose of these facilities is to manage the currency risk arising from the Group’s operations.
Liquidity RiskThe Group seeks to manage financial risk by ensuring at all times there is sufficient liquidity to meet its financial liabilities as they fall due and to invest any surplus cash safely and profitably. The Group finances its operations through a mixture of debt and equity. The Group’s main source of debt is provided by a £100m committed Credit Facility maturing in November 2020 (2016: £100m). This is made up of amortising Term Debt of £65m (2016: £65m) and a Revolving Credit Facility (‘RCF’) of £35m (2016: £35m). In order to manage currency risk the Group has borrowed part of the Term Loans in EUR 18m (£15.9m) (2016: EUR 18m (£15.4m)) and in USD 19.5m (£14.4m) (2016: USD 32.7m (£26.6m)). The remainder is denominated in Sterling.
At year end the Group had drawn down £34m of the RCF (2016: £18m) and has access to an uncommitted overdraft facility of £4.5m.
The Group balance sheet also includes financial assets in the form of cash at bank and in hand totalling £11.2 million (2016: £7.2 million). Of this £7.1 million (2016: £4.2million) was held in Sterling, £2.9 million in Euro (2016: £2.0million) and the balance in other currencies.
83
Ove
rview
Fina
ncia
l State
men
tsA
dd
ition
al in
form
atio
nG
ove
rna
nce
Strate
gic R
ep
ort
Financial Statements | Notes to the Financial Statements

NOTES TO THE FINANCIAL STATEMENTS CONTINUEDfor the year ended 31 December
20. Financial instruments continuedLiquidity Risk continued The maturity profile of the Group’s financial gross liabilities (capital and interest) at the year-end is as follows:
31 December 2017
In one year, or less£000s
In more than one year,
but not more than two
£000s
In more than two years,
but not more than five
£000s
In more than five years
£000sTotal
£000s
Trade and other payables 16,576 914 2,374 237 20,101
Bank loans 44,176 11,862 33,866 – 89,904
Interest rate swaps 79 – 63 – 142
60,831 12,776 36,303 237 110,147
31 December 2016
In one year, or less£000s
In more than one year,
but not more than two
£000s
In more than two years,
but not more than five
£000s
In more than five years
£000sTotal
£000s
Trade and other payables 21,952 1,817 – – 23,769
Bank loans 27,805 9,551 52,673 – 90,029
Interest rate swaps – – 384 – 384
49,757 11,368 53,057 – 114,182
The maturity profile of the Company’s financial gross liabilities (capital and interest) at the year end is as follows:
31 December 2017
Trade and other payables
£000s
31 December 2016
Trade and other payables
£000s
In one year, or less 262 159
The Group had £1.0m (2016: £17.0m) undrawn committed borrowing facilities, £4.5m (2016: £4.5m) undrawn overdraft facilities and £25.0m (2016: £25.0m) undrawn uncommitted facilities all available at 31 December 2017.
Alliance Pharma plc Annual Report and Accounts 201784

Interest rate riskThe Group’s debt is provided on a floating interest rate basis. The Group uses interest rate swaps to fix the rates paid on a portion of its debt in order to mitigate against the risks of increasing interest rates. These swaps are re-measured to fair value at each period end.
The Group has in place interest rate swaps with a nominal value of £20m (year ended 31 December 2016: £20m) to convert the floating interest rate charge to a fixed rate interest charge maturing in April 2018. Replacing this, a forward dated interest rate swap with nominal value £16m commences in April 2018 maturing in November 2020.
The Group also has an EUR 18m (year ended 31 December 2016: EUR 18m) interest rate swap to convert the floating interest rate charge to a fixed rate interest charge maturing in November 2020.
The interest rate exposure of the financial liabilities of the Group at the period end was:
Fixed£000s
Floating£000s
Total£000s
At 31 December 2017
Bank loans – Sterling denominated – 54,000 54,000
Bank loans – Euro denominated – 15,929 15,929
Bank loans – US Dollar denominated – 14,409 14,409
Interest rate hedges – Sterling denominated 20,000 (20,000) –
Interest rate hedges – Euro denominated 15,929 (15,929) –
Total financial liabilities 35,929 48,409 84,338
Unamortised issue costs – (839) (839)
Net book value of financial liabilities 35,929 47,570 83,499
Fixed£000s
Floating£000s
Total£000s
At 31 December 2016
Bank loans – Sterling denominated 42,508 42,508
Bank loans – Euro denominated – 15,385 15,385
Bank loans – US Dollar denominated – 26,585 26,585
Interest rate hedges – Sterling denominated 20,000 (20,000) –
Interest rate hedges – Euro denominated 15,385 (15,385) –
Total financial liabilities 35,385 49,093 84,478
Unamortised issue costs – (1,142) (1,142)
Net book value of financial liabilities 35,385 47,951 83,336
85
Ove
rview
Fina
ncia
l State
men
tsA
dd
ition
al in
form
atio
nG
ove
rna
nce
Strate
gic R
ep
ort
Financial Statements | Notes to the Financial Statements

NOTES TO THE FINANCIAL STATEMENTS CONTINUEDfor the year ended 31 December
20. Financial instruments continuedInterest rate risk
Fixed rate financial liabilities
Weighted average
fixed rate %
Weighted average
period for which rate
is fixed
At 31 December 2017
Sterling 3.74 2.91 years
Euros 2.16 2.91 years
At 31 December 2016
Sterling 3.74 3.91 years
Euros 2.46 3.91 years
The Sterling floating rate borrowings bear interest at a rate based on LIBOR. The Euro floating rate borrowings bear interest at a rate based on EURIBOR. The US Dollar floating rate borrowings bear interest at a benchmark rate (US Dollar LIBOR).
A 0.5% increase in LIBOR would reduce pre-tax profits by approximately £0.2m in 2018. A 0.5% decrease would have the opposite effect.
A 0.5% increase or decrease in EURIBOR would have no impact on pre-tax profits as Euro denominated debt is fully hedged to fixed rates.
A 0.5% increase in US LIBOR would reduce pre-tax profits by approximately £0.1m in 2018. A 0.5% decrease would have the opposite effect.
Currency riskApproximately 33% of the Group’s sales are invoiced in Euros. The Group also has a level of Euro expense that naturally offsets a high portion of the Euro sales. Approximately 11% of the Group’s sales are invoiced in US Dollar, a portion of which will be used to service the US Dollar denominated debt. The majority of other Group sales, and all but a small proportion of other Group expenses, are denominated in Sterling.
A 5% weakening or strengthening of Sterling against the Euro would result in minimal impact in predicted pre-tax profits. A 5% weakening of Sterling against the US Dollar would result in a £0.3m increase in predicted pre-tax profits, while a 5% strengthening of Sterling would have the approximate opposite effect.
Net investment hedgesThe Group uses currency denominated borrowings to hedge the exposure of a portion of its net investment in overseas operations against changes in value due to changes in foreign exchange rates. The net investment hedge was tested for effectiveness during the year and found to be effective. As the Group repays its foreign denominated borrowings the hedged portion of the net investment is reduced.
Fair value measurementEffective from 1 January 2013, the Group adopted the amendments to IFRS13 for financial instruments that are measured in the Group balance sheet at fair value. This requires disclosure of fair value measurements by level of the following fair value measurement hierarchy:
• quoted prices (unadjusted) in active markets for identical assets or liabilities (Level 1);
• inputs other than quoted prices included within Level 1 that are observable for the asset or liability, either directly (that is, as prices) or indirectly (that is, derived from prices) (Level 2); and
• inputs for the asset or liability that are not based on observable market data (that is, unobservable inputs) (Level 3).
Alliance Pharma plc Annual Report and Accounts 201786

The Group’s financial instruments held at fair value (or for which fair value is disclosed) in the scope of IFRS 13 are as follows:
Level
31 December 2017
Carrying value£000s
31 December 2016
Carrying value£000s
Interest rate swaps 2 (142) (384)
Deferred contingent consideration 3 (2,854) (3,330)
(2,996) (3,714)
For the other financial assets and liabilities in the scope of IFRS 7, the carrying amount is a reasonable approximation of fair value and therefore no further disclosure is provided.
The valuation techniques used for instruments categorised in Levels 2 and 3 are described below:
Interest rate swaps (Level 2)The Group’s interest rate swaps are not traded in active markets. These have been fair valued using observable interest rates. The effects of non-observable inputs are not significant for interest rate swaps.
Counterparty banks perform valuations of interest rate swaps for financial reporting purposes, determined by discounting the future cash flows at rates determined by year end yield curves. The valuation processes and fair value changes are discussed by the Audit & Risk Committee and the finance team at least every half year, in line with the Group’s reporting dates.
Contingent consideration (Level 3)The fair value of deferred contingent consideration is estimated using a present value technique. Fair value is calculated using discounted cash flows, taking the most likely cash flows and discounting at an appropriate risk adjusted rate of 3.0%.
During the year £1.7m deferred contingent consideration related to the acquisition of MacuVision Europe Limited was paid. Additions of £1.9m were recognised related to the acquisition of the worldwide rights to Vamousse from TyraTech Inc.
During the year £0.5m deferred contingent consideration related to acquisition of Nutraceutical brands from Sinopharm Nutraceuticals (Shanghai) Co Ltd and £0.1m deferred contingent consideration related to of MacuVision Europe Limited were released. These changes were caused by differences in trading performance compared to acquisition forecasts.
Level 3 fair value measurements:The reconciliation of the carrying amounts of financial instruments classified within Level 3 is as follows:
31 December 2017
Liabilities£000s
31 December 2016
Liabilities£000s
Balance at 1 January 3,330 4,694
Acquired 1,855 500
Cash paid in the year (1,713) (2,833)
Amount recognised in profit or loss under finance costs (618) 969
Balance at 31 December 2,854 3,330
87
Ove
rview
Fina
ncia
l State
men
tsA
dd
ition
al in
form
atio
nG
ove
rna
nce
Strate
gic R
ep
ort
Financial Statements | Notes to the Financial Statements

NOTES TO THE FINANCIAL STATEMENTS CONTINUEDfor the year ended 31 December
20. Financial instruments continuedClassification of financial assets and liabilitiesGroupClassification of the Group’s financial assets and liabilities is set out below:
At 31 December 2017
Loans and receivables
£000s
Non-financial assets£000s
Total£000s
Financial assets
Cash and cash equivalents 11,184 – 11,184
Trade and other receivables 21,230 2,465 23,695
32,414 2,465 34,879
At 31 December 2017
Other financial liabilities
£000s
Liabilities not within the scope
of IAS39£000s
Total£000s
Financial liabilities
Loans and borrowings 83,499 – 83,499
Trade and other payables 16,250 326 16,576
Other liabilities 3,525 – 3,525
Corporation tax – 2,436 2,436
103,274 2,762 106,036
At 31 December 2016
Loans and receivables
£000s
Non-financial assets£000s
Total£000s
Financial assets
Cash and cash equivalents 7,221 – 7,221
Trade and other receivables 24,596 2,110 26,706
31,817 2,110 33,927
At 31 December 2016
Other financial liabilities
£000s
Liabilities not within the scope
of IAS39£000s
Total£000s
Financial liabilities
Loans and borrowings 83,336 – 83,336
Trade and other payables 20,922 1,030 21,952
Other Liabilities 1,817 – 1,817
Corporation tax – 2,543 2,543
106,075 3,573 109,648
The Group has issued the following terms for borrowings made to its Joint Ventures:
31 December 2017
Interest rate
31 December 2016
Interest rate
Joint venture loans 3.25% – 7.00% 3.00% – 7.00%
Alliance Pharma plc Annual Report and Accounts 201788

CompanyClassification of the Company’s financial instruments is set out below:
At 31 December 2017
Loans and receivables
£000s
Non-financial assets£000s
Total£000s
Financial assets
Trade and other receivables 21 – 21
21 – 21
At 31 December 2017
Other financial liabilities
£000s
Liabilities not within the scope
of IAS39£000s
Total£000s
Financial liabilities
Trade and other payables 262 – 262
262 – 262
At 31 December 2016
Loans and receivables
£000s
Non-financial assets£000s
Total£000s
Financial assets
Trade and other receivables 119 – 119
119 – 119
As at 31 December 2016
Other financial liabilities
£000s
Liabilities not within the scope
of IAS39£000s
Total£000s
Financial liabilities
Trade and other payables 159 – 159
159 – 159
21. Derivative financial instruments
31 December 2017
Liabilities£000s
31 December 2016
Liabilities£000s
Current portion 79 –
Non-current portion 63 384
Interest rate swap – cash flow hedge 142 384
The cash flow hedges were tested for effectiveness both retrospectively and prospectively as at 31 December 2017. They were found to be highly effective, with the ineffective element being immaterial. The hedge and interest on the bank debt are settled on a quarterly basis on the same date and measured against the same benchmark, namely 3 month Sterling LIBOR. The amount recognised through the income statement in respect of interest rate swaps during the year was a charge of £177,000 (year ended 31 December 2016: £175,000).
89
Ove
rview
Fina
ncia
l State
men
tsA
dd
ition
al in
form
atio
nG
ove
rna
nce
Strate
gic R
ep
ort
Financial Statements | Notes to the Financial Statements

NOTES TO THE FINANCIAL STATEMENTS CONTINUEDfor the year ended 31 December
22. Deferred tax
The Group 31 December 2017
£000s 31 December 2016
£000s
Accelerated capital allowances on tangible assets (78) (57)
Temporary differences: trading 202 8
Temporary differences: non-trading 602 894
Accelerated allowances on intangible assets (7,684) (5,428)
Initial recognition of intangible assets from business combination (19,158) (25,957)
Share based payments 864 376
Interest rate hedge 23 65
Losses 483 366
(24,746) (29,733)
Recognised as:
Deferred tax asset 2,174 1,709
Deferred tax liability (26,920) (31,442)
Reconciliation of deferred tax movements:
The Group
31 December 2016
£000s
Recognised in other
comprehensiveincome£000s
Recognisedin the income
statement£000s
31 December 2017
£000s
Non-current assets
Intangible assets (31,385) 834 3,709 (26,842)
Property, plant and equipment (57) – (21) (78)
Non-current liabilities
Derivative financial Instruments 65 (41) – 24
Other non-current liabilities 894 (292) – 602
Equity
Share option reserve 376 314 174 864
Temporary differences
Trading 8 194 202
Losses 366 116 482
(29,733) 815 4,172 (24,746)
Recognised as:
Deferred tax asset 1,709 2,174
Deferred tax liability (31,442) (26,920)
Alliance Pharma plc Annual Report and Accounts 201790

The Group
31 December 2015
£000s
Recognised in other
comprehensiveincome£000s
Recognisedin the income
statement£000s
31 December 2016
£000s
Non-current assets
Intangible assets (27,787) (3,246) (352) (31,385)
Property, plant and equipment (51) – (6) (57)
Non-current liabilities
Derivative financial Instruments 21 44 – 65
Other non-current liabilities – 894 – 894
Equity
Share option reserve 390 – (14) 376
Temporary differences
Trading 7 – 1 8
Losses 538 – (172) 366
(26,882) (2,308) (543) (29,733)
Recognised as:
Deferred tax asset 956 1,709
Deferred tax liability (27,838) (31,442)
23. Share capital
Allotted, called and fully paid
No. of shares £000s
At 1 January 2016 – ordinary shares of 1p each 468,179,157 4,682
Issued during the year 4,389,305 44
At 31 December 2016 – ordinary shares of 1p each 472,568,462 4,726
Issued during the year 2,421,536 24
At 31 December 2017 – ordinary shares of 1p each 474,989,998 4,750
Between 1 January 2017 and 31 December 2017 2,421,536 shares were issued on the exercise of employee share options (2016: 4,389,305).
The holders of ordinary shares are entitled to receive dividends as declared from time to time and are entitled to one vote per share at meetings of the Company.
91
Ove
rview
Fina
ncia
l State
men
tsA
dd
ition
al in
form
atio
nG
ove
rna
nce
Strate
gic R
ep
ort
Financial Statements | Notes to the Financial Statements

NOTES TO THE FINANCIAL STATEMENTS CONTINUEDfor the year ended 31 December
23. Share capital continuedPotential share options commitmentUnder the Group’s share option scheme for employees and Directors, options have been granted to subscribe for shares in the Company at prices ranging from 7.75p to 53.00p. Options are exercisable three years after date of grant, but in certain instances this can be extended to five years. Options outstanding are as follows:
Year of grantExercise
price penceExercise
from
31 December 2017Number
(000’s)
31 December 2016 Number
(000’s)
2007 9.25 2010 – 19
2008 8.50 2011 39 610
2009 7.75 2012 130 153
2010 33.25 and 34.25 2013 1,670 1,871
2011 31.00 and 34.12 2014 2,201 2,422
2012 29.25 2015 2,156 2,333
2013 35.75 and 37.25 2016 2,979 3,613
2013 35.75 2018 2,501 2,600
2014 33.75 2017 1,750 2,014
2015 43.75 and 46.75 2018 5,260 5,415
2016 44.00 and 47.5 2019 9,222 10,078
2016 47.5 2021 4,400 4,400
2017 53.0 2020 7,590 –
39,898 35,528
Managing CapitalOur objective in managing the business’ capital structure is to ensure that the Group has the financial capacity, liquidity and flexibility to support the existing business and to fund acquisition opportunities as they arise.
The capital structure of the Group consists of net bank debt and Shareholders’ equity. At 31 December 2017, net debt was £72.3m (note 33), whilst Shareholders’ equity was £203.4m.
The business is profitable and cash generative. The main financial covenants applying to bank debt are that leverage (the ratio of net bank debt to EBITDA) should not exceed 3.0 times, interest cover (the ratio of EBITDA to finance charges) should be no less than 4.0 times, and operating cash flows must exceed debt service cash flows. The Group complied with these covenants in 2017 and 2016.
Smaller acquisitions are typically financed using bank debt, while larger acquisitions typically involve a combination of bank debt and additional equity. The mixture of debt and equity is varied, taking into account the desire to maximise the shareholder returns while keeping leverage at comfortable levels.
Alliance Pharma plc Annual Report and Accounts 201792

24. Share based paymentsUnder the Group’s share option scheme for employees and Directors, options to subscribe for shares in the Company are granted normally once each year. Options are granted with a fixed exercise price equal to the market price of the shares under option at the date of grant. The contractual life of an option is 10 years from date of grant. Generally, options granted become exercisable on the third anniversary of the date of grant, but in certain instances this can be extended to five years. Exercise of an option is normally subject to continued employment. All share-based employee remuneration is settled in equity. Options are valued by a third-party provider using the Black-Scholes option-pricing model. There are generally no performance conditions attached to the options, but 4 million of the options granted on 23 October 2013, 4.4 million options granted on 27 October 2016 and 1.8 million options granted on 15 September 2017 are subject to EPS accretion performance criteria and have the extension to five years before they can be exercised.
It is assumed the majority of options will be exercised at the earliest opportunity and that on average they are exercised after four years. The expected volatility is based on historical volatility (calculated based on the weighted average remaining life of the share options), adjusted for any expected changes to future volatility due to publicly available information. The risk free rate of return is based on UK government bonds of a term consistent with the assumed option life.
The estimated fair value of the share options granted on 15 September 2017 was £1,678,000. The model inputs were a share price of 53.00p, an exercise price of 53.00p, expected volatility of 24.8% and a risk free rate of 1.38%.
Share options and weighted average exercise price are as follows for the reporting periods presented:
2017 2016
Number(000)
Weighted average
exercise pricePence
Number (000)
Weighted average
exercise price Pence
Outstanding at start of year 35,528 40.56 26,443 35.18
Granted 7,629 53.00 14,503 47.25
Exercised (2,422) 27.00 (4,389) 30.83
Forfeited (837) 45.15 (1,029) 38.17
Outstanding at end of year 39,898 43.50 35,528 40.56
Exercisable at end of year 9,695 33.24 12,406 32.44
Share options were exercised throughout the financial year. Share options were exercised between 7.75 and 37.25 pence per share.
93
Ove
rview
Fina
ncia
l State
men
tsA
dd
ition
al in
form
atio
nG
ove
rna
nce
Strate
gic R
ep
ort
Financial Statements | Notes to the Financial Statements

NOTES TO THE FINANCIAL STATEMENTS CONTINUEDfor the year ended 31 December
25. Cash generated from operations
Group Company
Year ended 31 December
2017£000s
Year ended 31 December
2016£000s
Year ended 31 December
2017£000s
Year ended 31 December
2016£000s
Profit for the year 28,910 18,092 8,399 5,140
Taxation (541) 4,127 487 50
Interest payable and similar charges 3,064 3,355 – –
Change in deferred consideration (618) 840 – –
Interest income (104) (111) (3,732) (3,983)
Other finance costs (534) (693) – –
Net exceptional compensation income (4,356) – – –
Depreciation of property, plant and equipment 657 337 – –
Amortisation of intangibles 276 92 – –
Change in inventories 1,108 (2,446) – –
Share of post-tax Joint Venture profits (19) (299) – –
Change in trade and other receivables 4,011 (14,116) 97 (93)
Change in trade and other payables (2,996) 10,083 102 (412)
Share based employee remuneration 1,453 696 1,453 696
Dividends received – – (5,720) (1,731)
Cash generated from operations 30,311 19,957 1,086 (333)
26. Capital commitmentsThe Group had capital commitments at 31 December 2017 totalling £1,940,000 (2016: £569,000).
During the year the Group selected a provider for implementation of the new ERP system. This has resulted in additional capital commitments relating to the project.
27. Contingent liabilitiesContingent liabilities are possible obligations that are not probable. The Group operates in a highly regulated sector and in markets and geographies around the world each with differing requirements. As a result, and in the normal course of business, the Group can be subject to a number of regulatory inspections/investigations on an ongoing basis. It is therefore possible that the Group may incur penalties for non-compliance. In addition, a number of the Group’s brands and products are subject to pricing and other forms of legal or regulatory restrictions from both governmental/regulatory bodies and also from third parties. Assessments as to whether or not to recognise a provision in respect of these matters are judgemental as the matters are often complex and rely on estimates and assumptions as to future events.
The Group’s assessment at 31 December 2017 based on currently available information is that there are no matters for which a provision is required (2016: £nil). However, given the inherent uncertainties involved in assessing the outcomes of such matters there can be no assurance regarding the outcome of any ongoing inspections/investigations and the position could change over time as a result of the factors referred to above.
Alliance Pharma plc Annual Report and Accounts 201794
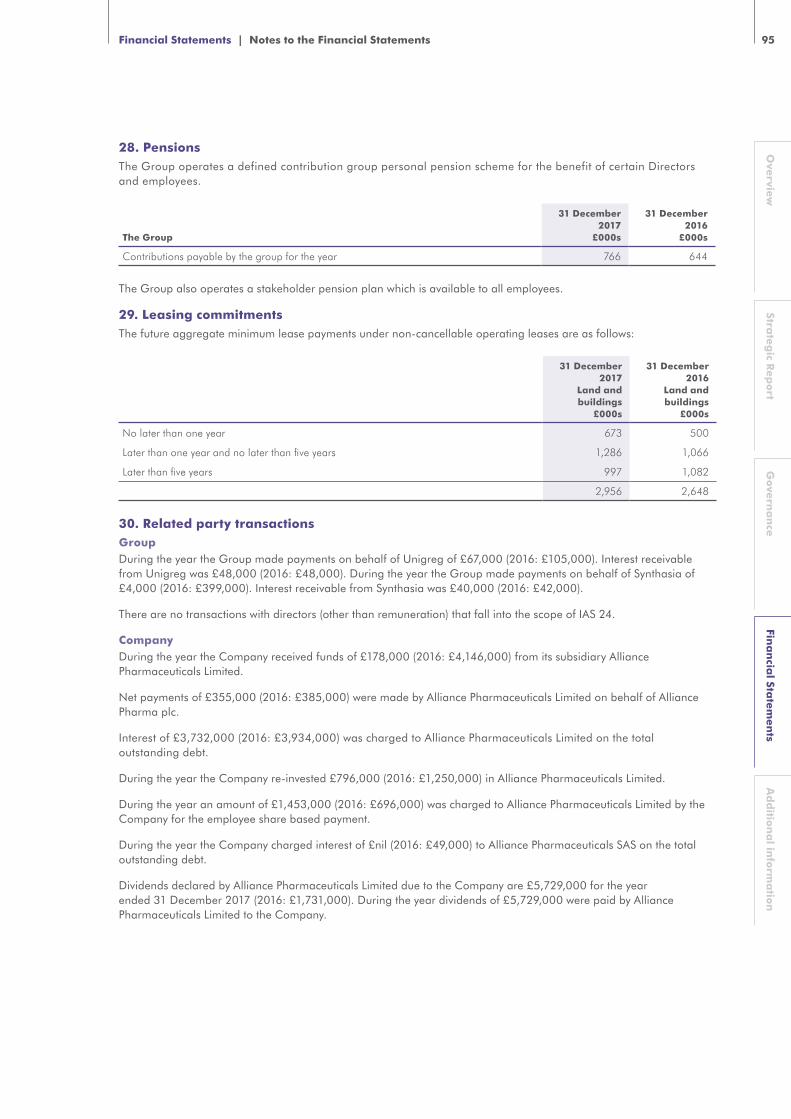
28. PensionsThe Group operates a defined contribution group personal pension scheme for the benefit of certain Directors and employees.
The Group
31 December 2017
£000s
31 December 2016
£000s
Contributions payable by the group for the year 766 644
The Group also operates a stakeholder pension plan which is available to all employees.
29. Leasing commitmentsThe future aggregate minimum lease payments under non-cancellable operating leases are as follows:
31 December 2017
Land andbuildings
£000s
31 December 2016
Land andbuildings
£000s
No later than one year 673 500
Later than one year and no later than five years 1,286 1,066
Later than five years 997 1,082
2,956 2,648
30. Related party transactions GroupDuring the year the Group made payments on behalf of Unigreg of £67,000 (2016: £105,000). Interest receivable from Unigreg was £48,000 (2016: £48,000). During the year the Group made payments on behalf of Synthasia of £4,000 (2016: £399,000). Interest receivable from Synthasia was £40,000 (2016: £42,000).
There are no transactions with directors (other than remuneration) that fall into the scope of IAS 24.
CompanyDuring the year the Company received funds of £178,000 (2016: £4,146,000) from its subsidiary Alliance Pharmaceuticals Limited.
Net payments of £355,000 (2016: £385,000) were made by Alliance Pharmaceuticals Limited on behalf of Alliance Pharma plc.
Interest of £3,732,000 (2016: £3,934,000) was charged to Alliance Pharmaceuticals Limited on the total outstanding debt.
During the year the Company re-invested £796,000 (2016: £1,250,000) in Alliance Pharmaceuticals Limited.
During the year an amount of £1,453,000 (2016: £696,000) was charged to Alliance Pharmaceuticals Limited by the Company for the employee share based payment.
During the year the Company charged interest of £nil (2016: £49,000) to Alliance Pharmaceuticals SAS on the total outstanding debt.
Dividends declared by Alliance Pharmaceuticals Limited due to the Company are £5,729,000 for the year ended 31 December 2017 (2016: £1,731,000). During the year dividends of £5,729,000 were paid by Alliance Pharmaceuticals Limited to the Company.
95
Ove
rview
Fina
ncia
l State
men
tsA
dd
ition
al in
form
atio
nG
ove
rna
nce
Strate
gic R
ep
ort
Financial Statements | Notes to the Financial Statements

NOTES TO THE FINANCIAL STATEMENTS CONTINUEDfor the year ended 31 December
31. Joint Ventures
Name Principal Activity Country of Incorporation % Owned
Unigreg Limited Distribution of pharmaceutical British Virgin Islands 60
products to China
Synthasia International Distribution of infant milk Hong Kong 20
Company Ltd formula products in China
In accordance with IFRS 11 Joint Arrangements, the Group has determined that Unigreg Limited and Synthasia International Company Limited are Joint Ventures. A Joint Venturer shall recognise its interest in a Joint Venture as an investment and shall account for that investment using the equity method in accordance with IAS 28 Investments in Associates and Joint Ventures.
The Group owns 60% of the issued share capital of Unigreg Limited. The Group considered the existence of substantive participating rights held by the minority shareholder which provide that shareholder with a veto right over the significant financial and operating policies of Unigreg Ltd and determined that, as a result of these rights, the Group does not have control over the financial and operating policies of Unigreg Ltd, despite the Group’s 60% ownership interests. Consequently the Company is accounted for as a Joint Venture.
The Group owns 20% of the issued share capital of Synthasia International Company Limited (‘Synthasia’). The Group considered the existence of substantive participating rights held by both the Group and another shareholder which provide both parties with a veto right over the significant financial and operating policies of Synthasia and determined that, as a result of these rights, Synthasia is accounted for as a Joint Venture.
In accordance with IFRS 11, the Group’s investments made to date in joint arrangements are characterised as Joint Ventures in which the Group has rights to a share of the arrangement’s net assets rather than direct rights to underlying assets and obligation for underlying liabilities.
Movement in investments in Joint Ventures in the year:
£000s
At 1 January 2017 1,464
Share of post-tax profits of Joint Ventures 19
At 31 December 2017 1,483
The carrying value of Joint Ventures is split as follows:
31 December 2017
£000s
31 December 2016
£000s
Unigreg Limited 1,183 1,027
Synthasia International Company Limited 300 437
1,483 1,464
Amounts owing from Joint Ventures are as follows:
Joint Venture receivable
31 December 2017
£000s
31 December 2016
£000s
Unigreg Limited 1,462 1,462
Alliance Pharma plc Annual Report and Accounts 201796

The Joint Venture receivable is a shareholder loan.
Trade and other receivables
31 December 2017
£000s
31 December 2016
£000s
Unigreg Limited 56 –
Synthasia International Company Limited 2,068 2,278
2,124 2,278
The Group’s principal Joint Venture is Unigreg Limited.
The total assets, liabilities, revenue and profits of the Group’s principal Joint Venture, Unigreg Limited, are as follows:
31 December 2017
£000s
31 December 2016
£000s
Intangible fixed assets 3,250 3,250
Current assets 1,292 800
Current liabilities (20) (99)
Non-current liabilities (2,550) (2,437)
Net assets 1,972 1,514
Year ended 31 December
2017£000s
Year ended 31 December
2016£000s
Income 939 2,068
Cost of sales (483) (1,061)
Administration and marketing expenses (117) (352)
Finance charges (79) (115)
Profit before taxation 260 540
The share of losses of the Group’s individually immaterial Joint Venture, Synthasia International Company Limited, is as follows:
Year ended 31 December
2017£000s
Year ended 31 December
2016£000s
Loss from continuing operations (137) (26)
32. Ultimate controlling partyThe Company’s shares are listed on the Alternative Investment Market (‘AIM’) and are held widely. There is no single ultimate controlling party.
97
Ove
rview
Fina
ncia
l State
men
tsA
dd
ition
al in
form
atio
nG
ove
rna
nce
Strate
gic R
ep
ort
Financial Statements | Notes to the Financial Statements

33. Alternative performance measuresThe performance of the Group is assessed using Alternative Performance Measures (“APMs”). The Group’s results are presented both before and after exceptional and non-underlying items. Adjusted profitability measures are presented excluding exceptional and non-underlying items as we believe this provides both management and investors with useful additional information about the Group’s performance and aids a more effective comparison of the Group’s trading performance from one period to the next and with similar businesses.
In addition, the Group’s results are described using certain other measures that are not defined under IFRS and are therefore considered to be APMs. These measures are used by management to monitor ongoing business performance against both shorter term budgets and forecasts but also against the Group’s longer term strategic plans.
APMs used to explain and monitor Group performance:
Measure DefinitionReconciliation to GAAP measure
EBITDA Earnings before interest, tax, depreciation, amortisation and non-underlying items. Calculated by taking profit before tax and financing costs, excluding non-underlying items and adding back depreciation and amortisation.
Note A below
Free cash flow Free cash flow is defined as EBITDA less working capital and non-cash movements (excluding exceptional items), tax payments, interest payments, core capex and other non-cash movements.
Note B below
Net debt Net debt is defined as the Group’s bank debt position net of its cash position. Note C below
Adjusted underlying basic EPS
Adjusted underlying basic EPS is calculated by dividing underlying earnings attributable to ordinary shareholders less impact of tax rate changes, by the weighted average number of shares in issue during the year.
Note D below
Adjusted underlying effective tax rate
Adjusted underlying effective tax rate is calculated by dividing total taxation for the year less impact of tax rate changes and non-underlying charges, by the underlying profit before tax for the year.
Note E below
A. EBITDA
Reconciliation of EBITDA
Year ended 31 December
2017£000s
Year ended 31 December
2016£000s
Profit before tax 28,369 22,219
Non-underlying items (note 5) (4,356) –
Finance costs (note 6) 1,808 3,391
Depreciation 657 337
Amortisation 276 92
EBITDA 26,754 26,039
NOTES TO THE FINANCIAL STATEMENTS CONTINUEDfor the year ended 31 December
Alliance Pharma plc Annual Report and Accounts 201798

B. Free cash flow
Reconciliation of free cash flow
Year ended 31 December
2017£000s
Year ended 31 December
2016£000s
Cash generated from operations (note 25) 30,311 19,957
Financing costs (2,678) (2,822)
Capital expenditure (2,236) (1,130)
Tax paid (3,728) (3,032)
Free cash flow 21,669 12,973
C. Net debt
Reconciliation of net debt Note
31 December 2017
£000s
31 December 2016
£000s
Loans and borrowings – current 18 (41,719) (25,782)
Loans and borrowings – non-current 18 (41,780) (57,554)
Cash and cash equivalents 16 11,184 7,221
Net debt (72,315) (76,115)
D. Adjusted underlying basic EPS
Reconciliation of adjusted underlying basic EPS
Year ended 31 December
2017£000s
Year ended 31 December
2016£000s
Underlying profit for the year 25,318 18,092
Impact of reduction in UK tax rate on deferred tax (101) (755)
Impact of reduction in US and French tax rate on deferred tax (5,958) –
Adjusted underlying profit for the year 19,259 17,337
Weighted average number of shares (note 10) 473,842,765 469,423,814
Adjusted underlying basic EPS 4.06 3.69
During 2017 US and French tax reform were both substantively enacted. The deferred tax rates applied to US and French timing differences have hence changed from 35.0% to 24.0% and from 33.3% to 25.0% respectively. This has given rise to £6.0m of deferred tax credits during 2017. In 2016 the UK tax rate changed from 18% to 17% giving rise to a £0.8m deferred tax credit.
E. Adjusted underlying effective tax rate
Reconciliation of adjusted underlying effective tax rate
Year ended 31 December
2017£000s
Year ended 31 December
2016£000s
Total taxation for the year 541 (4,127)
Impact of reduction in UK tax rate on deferred tax (101) (755)
Impact of reduction in US and French tax rate on deferred tax (5,958) –
Non-underlying tax charge 764 –
Adjusted underlying taxation for the year (4,754) (4,882)
Underlying profit before tax for the year 24,013 22,219
Adjusted underlying basic EPS 19.8% 22.0%
99
Ove
rview
Fina
ncia
l State
men
tsA
dd
ition
al in
form
atio
nG
ove
rna
nce
Strate
gic R
ep
ort
Financial Statements | Notes to the Financial Statements

Shareholder enquiriesThe Company’s share register is maintained on our behalf by Link Asset Services, who are responsible for updating the register, including details of changes to shareholders’ addresses and purchases and sales of the Company’s shares. If you have any questions about your shareholding in the Company or need to notify any changes to your personal details you should write to Link Asset Services, PXS1, 34 Beckenham Road, Beckenham, Kent BR3 4ZF or telephone 0871 664 0300 (calls cost 10p per minute plus network extras, lines are open 9:00am to 5:30pm Monday to Friday).
Financial CalendarAnnual General Meeting 24 May 2018Shares trade ‘ex’ final dividend 14 June 2018Final dividend record date 15 June 2018Payment of final dividend 11 July 2018Interim results announcement 19 September 2018Year End 31 December 2018Preliminary results announcement March 2019
SHAREHOLDER INFORMATIONUnaudited Information
100Alliance Pharma plc Annual Report and Accounts 2017

FIVE YEAR SUMMARY
Year ended 31 December
2013*£m
Year ended 31 December
2014*£m
Year ended 31 December
2015£m
Year ended 31 December
2016£m
Year ended 31 December
2017£m
Revenue 45.3 43.5 48.3 97.5 103.3
Operating profit before non-underlying items 13.3 11.8 10.6 25.6 25.8
Exceptional operating items – 0.6 (6.3) – 4.4
Operating profit after exceptional items 13.3 11.2 17.0 25.6 30.2
Profit before tax before non-underlying items 12.0 10.8 11.0 22.2 24.0
Profit before tax after non-underlying items 12.0 10.2 15.2 22.2 28.4
Intangible assets 87.1 88.9 259.9 264.8 278.6
Tangible assets 0.6 0.4 1.0 1.8 3.4
Current assets 16.8 15.7 27.8 49.3 49.1
Current liabilities 14.9 11.4 31.8 50.3 60.8
Equity 64.7 70.8 162.4 179.3 203.4
Average shares in issue (millions) 250.8 264.1 272.7 469.4 473.8
Shares in issue at period end (millions) 264.1 264.1 468.2 472.6 475.0
Earnings per share – basic (p) 3.82 3.17 4.65 3.85 6.10
Earnings per share – adjusted basic (p) 3.82 3.36 3.69 3.85 5.34
* Restated for impact of IFRS 11
101Additional information | Five Year Summary
Ove
rview
Fina
ncia
l State
men
tsA
dd
ition
al in
form
atio
nG
ove
rna
nce
Strate
gic R
ep
ort
Fina
ncia
l State
men
tsA
dd
ition
al in
form
atio
n

ADVISORS AND KEY SERVICE PROVIDERS
AuditorKPMG LLP66 Queen Square Bristol BS1 4BE
RegistrarsLink Asset ServicesPXS 1 34 Beckenham Road Beckenham Kent BR3 4ZF
Financial PRBuchanan Communications107 Cheapside London EC2V 6DN
Nomad and BrokerNumis Securities Limited10 Paternoster Square London EC4M 7LT
Joint BrokerInvestec Bank plc2 Gresham Street London EC2V7QP
BankersLloyds Bank Corporate MarketsThe Atrium Davidson House Forbury Square Reading Berkshire RG1 3EU
Royal Bank of Scotland3rd Floor 3 Temple Back East Bristol BS1 6DZ
Silicon Valley BankAlphabeta 14–18 Finsbury Square London EC2A 1BR
Registered OfficeAvonbridge HouseBath Road Chippenham Wiltshire SN15 2BB
Company number04241478
102Alliance Pharma plc Annual Report and Accounts 2017

CAUTIONARY STATEMENT
Cautionary statement regarding forward-looking statementsThis Annual Report has been prepared for the members of the Company and no one else. The Company, its Directors, employees or agents do not accept or assume responsibility to any other person in connection with this document and any such responsibility or liability is expressly disclaimed.
This Annual Report contains certain forward-looking statements with respect to the principal risks and uncertainties facing Alliance. By their nature, these statements and forecasts involve risk and uncertainty because they relate to events and depend on circumstances that may or may not occur in the future. There are a number of factors that could cause actual results or developments to differ materially from those expressed or implied by these forward-looking statements and forecasts. The forward-looking statements reflect the knowledge and information available at the date of preparation of this Annual Report, and will not be updated during the year. Nothing in this Annual Report should be construed as a profit forecast.
The Report of the Directors in this Annual Report has been drawn up and presented in accordance with English company law and the liabilities of the Directors in connection with that report shall be subject to the limitations and restrictions provided by such law.
In particular, Directors would be liable to the Company (but not to any third party) if the Report of the Directors contains errors as a result of recklessness or knowing misstatement or dishonest concealment of a material fact, but would not otherwise be liable.
103Additional information | Cautionary Statement
Ove
rview
Fina
ncia
l State
men
tsA
dd
ition
al in
form
atio
nG
ove
rna
nce
Strate
gic R
ep
ort
Fina
ncia
l State
men
tsA
dd
ition
al in
form
atio
n

TRADE MARKS
The following are registered trade marks of subsidiaries of Alliance Pharma PLC and are protected in a number of countries:
Absorbagel™, Acnisal™, Actidose Aqua™, Alliance™, Alliance and Logo, Alliance Generics, Aloclair™, Alostop™, Alphaderm™, Ametop™, Anbesol™, Aquadrate™, Ashton & Parsons™, Ashton & Parsons Infant Powder™, Atarax™, Atopiclair™, Avloclor™, Biocorneum™, Bio-taches™, Biotanoid™, Buccastem™, Buccastem M™, Canker-X™, Ceanel™, Clearway™, Clearway Stoma Bridge™, Contisol™, Decapinol™, Deltacortril™, Deogel™, Dermachronic™, Dermacide™, Dermamist™, Dermoxyl™, Distamine™, Edenfarm™, Effadiane™, Emezine™, Energeyes™, Fadiamone™, Farmil™, Fazol™, Flammacerium™, Flammaclair™, Flammasun™, Flammazine™, Forceval™, Forceval Junior™, Fractar Fractar 5™, Gen-ongles™, Gregovite C™, Hemopressin™, Herpclair™, Hydrobath™, Hydromol™, Irenat™, ISIB™, Isprelor™, Jonctum™, Kelo-cote™, Kelo-stretch™, Leniline™, Lift™, Lift Medical Adhesive Remover™, Lift Plus/ Lift +™, LMZ3™, Lypsyl™, Lypsyl- It’s on everyone’s lips™, Lypsyl Kissables™, Lypsyl Shimmer™, Lysovir™, MacuShield™, MacuShield Gold™, Men’s Life™, Milkerra ru jia li (Chinese characters)™, MolluDab™, Moomich™, Moomie™, Nabari™, Naseptin™, Natau™, Natulan™, NaturCare™, NaturCare Breeze™, NaturCare Fragrant™, NaturCare IPD™, NaturCare Zest™, Neumil™, NuSeals™, Occlusal™, Ondemet™, Opus™, Oxyplastine™, Paludrine™, Papclair™, Papuduo™, Papulex™, Papustil™, Pavacol™, Pavacol-D™, Pentrax™, Peptavlon™, Periocycline™, Periostan™, Periostand™, Periostat™, Periostatus™, Permitabs™, Posidorm™, PS20™, Purganol-Daguin™, Q Device™, Quinocort™, Quinoderm™, Reloxyl™, Reticus™, Rincinol™, Rizotret™, Rizuderm™, Roman in Chariot Device™, ru jia li (Chinese characters)™, Rympa™, Savarine™, Sebclair™, Skinsafe/Skinsafe™, Skinsafe Non Sting Protective Film™, Stemflova™, Sindrogin Vamousse™, Supremenil™, Stylised O Device (in orange)™, Syntomet™, Syntometrin™, Syntometrine™, Terra-Cortril™, T-Go™, Thwart™, Thyrogard™, Timocort™, Timocreme™, Timodine™, Tridesonit™, Triffadiane™, Trust the science™, Uniflu™, Unigreg™, Unisomnia™, Vamousse™, Variquel™, Verucide™, Vibramycine™, Vita-Dermacide™, Vitamin D3 ai wei di (Chinese characters)™.
The following marks are all used under licence by Alliance Pharmaceuticals Limited:
Xenazine™ is a registered trade mark of Biovail Laboratories International (Barbados)
Gelclair™ is a registered trade mark of Helsinn Healthcare S.A.
ImmuCyst™ is a registered trade mark of Sanofi Pasteur Limited
104Alliance Pharma plc Annual Report and Accounts 2017


Alliance Pharma plcAvonbridge House, Bath Road, Chippenham, Wiltshire, SN15 2BB, United KingdomT: +44 (0)1249 466966 F: +44 (0)1249 466977 E: [email protected]