Embed Size (px)
Citation preview

Together we take responsibility
from field to fork
Lantmännen’s Interim ReportJanuary–April 2017

Lantmännen is an agricultural cooperative and Northern Europe’s leader in agriculture, machinery, bioenergy and food products. Owned by 25,000 Swedish farmers, we have 10,000 employees, operations in over 20 countries and an annual turnover of SEK 37 billion. With grain
as our basis, we create value from farmland resources to make farming thrive. Some of our best-known food brands are AXA, Bonjour, Kungsörnen, GoGreen, Gooh!, FINN CRISP and Schulstad.
Our company is founded on knowledge and values built up through generations of owners. Having research, development and operations throughout the value chain means that we can take responsibility together – from field to fork.
Financial reporting and publication orders
Interim 2nd four months • October 5, 2017. Year-end report 2017 • February 6, 2018.
The Annual Report with Sustainability Report, Appendix – Sustainability-Related Indicators, interim reports and other reports are available in English and Swedish. All reports can be downloaded from www.lantmannen.com/en/financialinformation For more information: lantmannen.com/en Follow us on: facebook.com/jordtillbord and twitter.com/lantmannen
Lantmännen’s organization
Supply Chain & IT
Human Resources
Branding, Communications, R&D, Sustainable Development
Finance & treasury
Board of Directors
President & CEO
Internal Audit
AgricultureSector
MachinerySector
EnergySector
Food Sector
Lantmännen Real Estate
Legal Affairs& Compliance Strategy & Business
Development
Owner Relations

1Lantmännen’s Interim Report January-April 2017
Lantmännen continues to develop positively. We have strong momentum in our businesses, and last year’s good earnings level has been maintained.
The Agriculture Sector has made a stable start to the year, with an operating income that is in line with the previous year. The Sector’s operations have performed well in all areas compared with the first period of the previous year. The Sec-tor’s international interest holdings have also shown an operat-ing income in line with the previous year’s level.
The Machinery Sector continues to perform well, helped by good market developments, particularly for Swecon’s operations. The Sector’s operating income is higher than in the previous year. In the first four-month period, Lantmännen Maskin took over imports of Massey Ferguson’s range to the Swedish market. The Danish agricultural machinery business has been discontin-ued and parts of the Norwegian operations have been divested.
The Energy Sector has significantly improved its operating income compared with the previous year – mainly driven by higher earnings for Lantmännen Agroetanol, which continues its successful development of exports of ethanol with high climate performance and sales of sustainable value-added products.
The Food Sector’s operating income is a little lower than in the previous year. Earnings have been adversely affected by planned start-up costs for Lantmännen Unibake’s new bakery in Londerzeel in Belgium and an unusually cold spring with lower sales of fast food products. Lantmännen Cerealia is encountering tougher competition in all main markets. There have been several product launches in the first period, including organic baby food under the “Little Farmer” brand and pasta made from durum wheat from Gotland. In February, Lantmännen Unibake acquired Anderson Bakery (PS Bageri AB outside Stockholm), which strengthens the Swedish production base with baguettes baked using Lantmännen’s quality Swedish flour.
Lantmännen Real Estate continues to develop positively. Joachim Haas has replaced Mikael Nicander as Head of Lant-männen Real Estate during the first four-month period.
Continued development in 2017Lantmännen is continuing the implementation of Strategy 2020. The Board has decided to implement two large structural projects in the grain business – one north of Mälaren and one in Österlen in Skåne. The main purpose is to replace older facilities in Uppsala and Ystad. The investments are part of Lantmännen’s strategy to further strengthen the position within Swedish grain trading and maintain a high level of service to the grain growers in the local area.
In mid-May, the new LM2 digital tool was launched to all Lantmännen’s agribusiness customers. Several new services will be launched during the year.
The acquisition of K-maatalous in Finland provides us with opportunities to establish ourselves in the Finnish agricultural market and strengthen our position in the grain value chain in the Baltic Sea region. K-maatalous is one of the largest players in the Finnish agricultural market, with a strong product port-folio and many well-established brands.
I would like to thank everyone who attended our annual gen-eral meeting in May, where, as usual, we had positive discussions about Lantmännen, our way forward and efforts to make Swedish farming thrive. At the meeting, Henrik Wahlberg and Ove Gus-tafsson were elected as new Board members. At the subsequent Board meeting, Per Lindahl was elected as the new Chairman and Hans Wallemyr as Deputy Chairman. I would like to welcome them to their new roles, and at the same time to extend warm thanks to Bengt-Olov Gunnarson, who leaves Lantmännen after 12 years on the Lantmännen Board, 5 of them as Chairman.
In spring, a comprehensive ownership dialogue was launched before the forthcoming update of our long-term strat-egy. We have already received lots of valuable input, and I look forward to working with owners and employees as we continue to develop Lantmännen into an even more competitive and profitable company.
Per Olof NymanPresident & CEO, Lantmännen
President’s overviewLantmännen’s income after net financial items for the first four months of 2017 is MSEK 354, compared with MSEK 304 for the same period the previous year.

2 Lantmännen’s Interim Report January-April 2017
Net sales amounted to MSEK 12,198 (11,680), an increase of 4 percent.
Operating income amounted to MSEK 401 (365), an improvement of MSEK 36 or 10 percent from the previous year. Operating income increased in the Energy, Machinery and Agriculture Sectors.
Income after financial items was MSEK 354 (304).
Cash flow before financing activities was MSEK 235 (641).
Investments totaled MSEK 862 (641).
Lantmännen’s annual general meeting in May adopted a contribution dividend and contribution issue which with the final price adjustment and refund represents a dividend of MSEK 509 to members.
Lantmännen’s key figures2017
Jan-Apr2016
Jan-Apr2016
Jan-Dec
Net sales, MSEK 12,198 11,680 37,244Operating income, MSEK 401 365 1,606Operating margin, % 3.3 3.1 4.3Income after financial items, MSEK 354 304 1,457Net income for the period, MSEK 314 278 1,274Cash flow before financing activities, MSEK 235 641 826Return on equity, % 6.7 6.5 9.6Return on operating capital, % 5.9 5.6 8.0Total assets, MSEK 33,051 30,955 32,490Equity ratio, % 43.0 41.9 42.7Investments in non-current assets, MSEK 862 641 2,333Net debt, MSEK 6,199 5,913 6,289Interest coverage ratio, times 5.1 4.0 5.6Average number of employees 9,811 9,874 9,880
Adjusted for items affecting comparability2017
Jan-Apr2016
Jan-Apr2016
Jan-Dec
Operating income, MSEK 401 365 1,697Operating margin, % 3.3 3.1 4.6Income after financial items, MSEK 354 304 1,548Net income for the period, MSEK 314 278 1,457Return on equity, % 6.7 6.5 11.0Return on operating capital, % 5.9 5.6 8.4
The period in brief January-April 2017

3Lantmännen’s Interim Report January-April 2017
Business environment and market
0
50
100
150
200
LantmännenReal Estate
FoodSector
EnergySector
MachinerySector
AgricultureSector
Jan-Apr 2016Jan-Apr 2017
Operating income per Sector, accumulated January-AprilAdjusted for items affecting comparability, MSEK
Distribution of Group’s salesIncluding intra-Group sales
Lantmännen Real Estate 1 % (1 %)
Machinery Sector 26 % (25 %)
Food Sector 35 % (36 %)
Energy Sector 8 % (7 %)
Agriculture Sector 30 % (31%)
After the spring elections in the Netherlands and France, political unrest on world markets has eased a little – although politics will probably remain under the spotlight for the rest of the year. During June, there will be a general election in the United Kingdom and parliamentary elections in France, while the United States is still affected by major political uncertainty on basic issues such as taxation and healthcare.
At the end of March, the United Kingdom triggered article 50 of the EU Treaty, which means that the two-year countdown to the country’s exit from the Union has begun. There are still major areas of dispute between British and European represent-atives, and the negotiations are expected to be tough. At the same time, the result of the French presidential election provides a basis for stronger European cooperation, and the eurozone’s economic conditions have been strengthened. The European economy as a whole is stronger than the US economy.
The Swedish economy is good and is expected to strengthen further in the next few years. Inflation has also shown an upward trend over a number of years. Nevertheless, at its April 27 meet-ing, the Riksbank Executive Board decided to keep the repo rate at –0.5 percent and increase government bond purchases by SEK 15 billion in the second half of 2017. The expected future interest rate hikes have also been postponed. The Riksbank made a slight downward adjustment of the inflation forecast for 2018 and 2019, one reason being that the recently concluded central wage agreements were lower than expected.
According to the US Department of Agriculture, the year’s global harvest is estimated to be lower than the previous year’s record harvests for wheat, corn and soy. It is expected that 2017/2018 consumption for corn and soy will increase, while wheat will remain unchanged. Closing stocks of wheat are there-fore expected to rise slightly, with corn and soya stocks declining. The International Grain Council forecasts an increase in global trade in wheat, corn, rice and soybeans over the next five years, mainly driven by increased demand in Asia and Africa. Food and feed are expected to remain the main drivers of demand.
According to LRF Dairy Sweden’s most recent report, dairy
prices are falling on world markets, despite reduced global pro-duction and stable demand. Global dairy exports rose by just over four percent in 2016, with the largest volume increases from the EU, New Zealand and the United States. China’s milk imports increased by just over 20 percent last year. In Sweden, milk prices have continued to rise during the first four-month period, and Swedish milk production has shown a slight improvement in profitability. However, Arla lowered the settle-ment price by just over SEK 0.09 in May.
To reduce climate impacts and contribute to a fossil-free vehicle fleet, the Swedish government has proposed a compulsory reduction, which would involve mixing biofuels into the petrol and diesel that is sold. The proposal is for the compulsory reduc-tion to enter into force on July 1, 2018. In November 2016, the European Commission proposed a measure which, if passed, would have a negative impact on all crop-based fuels in the EU.
According to Statistics Sweden and HUI Research, the sales volume for Swedish fast-moving consumer goods in the first three months of the year fell by 2.9 percent compared with the previous year, when Easter was in March. According to Eurostat, sales in Sweden, measured at current prices, declined by 1.1 percent over the same period. Year-to-date sales in Nor-way have increased by 1.5 percent and in Finland by 1.2 per-cent, while in Denmark they have fallen by 1.3 percent.
Strong consumer trends within the Nordic food industry include health, responsibility and sustainability, and origin. In Sweden, demand for locally produced products is rising. There is keen interest in quality and premium products, although discount brands and Private Label continue to gain market shares. Urbanization and an increasing proportion of single- person households are driving demand for food-to-go and bake-off products. Demand for organic products remains strong, and in certain food categories demand appears to be outstripping supply. Consumers are increas-ingly demanding alternative proteins, which are non-meat proteins.

4 Lantmännen’s Interim Report January-April 2017
Distribution of Group’s employees
Lantmännen Real Estate1 % (1 %)
Agriculture Sector 8 % (7 %)
Energy Sector 2 % (2 %)
Machinery Sector 21 % (20 %)
Food Sector 68 % (70 %)
Lorem ipsum
The Group’s net sales and earnings January-April 2017
Net salesLantmännen’s net sales for the first four months amounted to MSEK 12,198 (11,680), an increase of 4 percent. Net sales increased in all Sectors, with the largest increase in the Energy Sector. Adjusted for acquired and divested opera-tions, the increase in net sales was 7 percent. Currency effects had a positive impact of 2 percent on net sales.
Operating incomeOperating income for the period amounted to MSEK 401 (365), an increase of MSEK 36 or 10 percent. Adjusted for acquired and divested operations, the increase was 12 per-cent. Operating income compared with the previous year has improved in the Energy, Machinery and Agriculture Sectors, but is lower in the Food Sector, largely due to planned start-up costs for the new bakery in Londerzeel, Belgium. Lantmännen Real Estate reported a lower operating income as a result of lower gains on the sale of properties, which were MSEK 5, compared with MSEK 41 the previous year. Currency effects had a positive impact of MSEK 4 on operating income.
Net financial income and income after financial itemsNet financial income amounted to MSEK –47 (–61). The improved net financial income compared with the previous year is due to dividends, capital gains and positive currency transla-tion effects. Income after financial items was MSEK 354 (304).
Tax and income after taxTax expense for the period was MSEK 40 (26). Tax is calcu-lated using the estimated tax rate for the full year. Income after tax amounted to MSEK 314 (278), of which MSEK 308 (277) was attributable to members of the economic associa-tion and MSEK 6 (1) to non-controlling interests (minority ownership) in the Group’s subsidiaries.
Cash flowCash flow from operating activities was MSEK 902 (1,015). The operating surplus contributed MSEK 616 (522) to the figure, while cash flow from working capital contributed MSEK 286 (493). The decline in cash flow from working cap-ital is partly attributable to an inventory increase in the Agri-culture Sector. Investments in non-current assets were MSEK –862 (–641), while sales of non-current assets amounted to MSEK 123 (287), which meant that net investments for the period were MSEK –739 (–354). Investments were made in the Group’s own production properties in Finland, in a num-ber of bakeries, notably in Poland and Belgium, and in the mill in Strängnäs. Cash flow before financing activities was MSEK 235 (641), while total cash flow including financing activities was MSEK 53 (737).
Financial position Equity at April 30 amounted to MSEK 14,216 (13,883, year-end). This includes MSEK 98 (88, year-end) attributable to owners other than members of the economic association, i.e. the minority interest in Group companies. Net debt has fallen by MSEK 90 since the beginning of the year and ended the period at MSEK 6,199 (6,289, year-end). Cash and cash equivalents at April 30 were MSEK 1,830 (1,773, year-end) and total assets were MSEK 33,051 (32,490, year-end). The equity ratio was 43.0 percent (42.7, year-end).
Risks and uncertaintiesThe risks in Lantmännen’s operations are strategic risks associ-ated with trademarks, external regulations, the economy, oper-ational risks (e.g., fluctuating energy, ethanol and commodity prices) and financial risks. The risks are described in detail in Lantmännen’s Annual Report.
Changes in the GroupIn January, Lantmännen’s operation with importing responsi-bility for Claas in Denmark (LMB Danmark A/S) was divested to Danish Agro. The sale generated a capital gain of MSEK 5 and a positive cash flow of MSEK 50. The divested operation’s annual turnover was approximately MSEK 520, with total assets of MSEK 200. The average annual number of employees was 15. At the time of the divestment, cash and cash equivalents were approximately MSEK 140.
Lantmännen Unibake acquired Anderson Bakery (PS Bageri AB outside Stockholm) in March. The company, which mainly produces baguettes, has a turnover of approximately MSEK 75 and 30 employees. The acquisition balance sheet is still preliminary.
Human resourcesThe average number of employees was 9,811 (9,874) and the number of full-time employees at April 30, 2017 was 9,821 (9,789). The number of employees has increased through the acquisition of operations in 2017 and the latter part of 2016, but has also decreased through divested operations and as a result of efficiency measures, mainly in the Food Sector.
Comments on the interim period

5Lantmännen’s Interim Report January-April 2017
Other important eventsLantmännen’s ownership dialogue on strategic future issues has been initiated with the district boards. The topics under discussion are among other things Lantmännen’s strategy, divi-dends and financing of the Group.
Lantmännen Real Estate acquired two properties in Finland in which Lantmännen Cerealia and Lantmännen Unibake (Vaasan) carry out production.
Lantmännen Maskin took over the import function for Massey Ferguson in Sweden on April 1, 2017.
In Sweden’s Sustainable Brand Index survey, the Lantmän-nen brand improved four positions to achieve sixth place and maintained its second place in the food category.
Sustainability Manager Claes Johansson appeared in the top ten as Aktuell Hållbarhet named Sweden’s 101 most influ-ential individuals in sustainability.
Events after the end of the periodVersion 1.0 of the LM2 digital tool was launched for Lantmännen’s agribusiness customers in May. The tool includes five areas: Cultivation, Grain, Feed, Machinery and Finance. Development of LM2 continues and several services will be launched in 2017.
In May, 50 percent of the shares in the subsidiary Akershus
Traktor AS, which is a Valtra dealer in Norway, were sold. The company has an annual turnover of approximately MSEK 660, total assets of about MSEK 340 and an annual average number of employees of about 100. After the sale, Lantmän-nen owns the remaining 50 percent.
On June 1, Lantmännen acquired the Finnish company K-maatalous from Kesko Group. K-maatalous is one of the largest players in the Finnish agricultural market with a turno-ver of approximately SEK 3 billion and 45 employees. The company operates in four areas: crop production, feed, grain and accessories and spare parts for agricultural machinery.
Lantmännen’s Annual General MeetingAt Lantmännen’s AGM in May, Henrik Wahlberg and Ove Gustafsson were elected as new Board members after Bengt-Olov Gunnarson and Björn Wallin declared themselves una-vailable for re-election. At the meeting, Per Lindahl, Gunilla Aschan, Johan Mattsson and Hans Wallemyr were re-elected to the Board. The meeting adopted a contribution dividend and contribution issue which with the final price adjustment and refund represents a dividend of MSEK 509 to members.
At the statutory Board meeting, Per Lindahl was elected Chairman, to succeed Bengt-Olov Gunnarson, and Hans Wallemyr was elected Vice Chairman.

6 Lantmännen’s Interim Report January-April 2017
The Agriculture Sector’s net sales are in line with the previ-ous year, and operating income is MSEK 96, compared with MSEK 94 the previous year.
Lantbruk Sweden has made a good start to the year and performed well in all areas compared with the first period of the previous year. The good volume development for feed has continued during the first period, even though competi-tion in the market has become tougher, resulting in squeezed margins.
The Sector’s international interest holdings show an operating income in line with the same period the previous year. Scandagra Group in the Baltic region continues to per-form positively, while Scandagra Polska shows an operating income that is slightly lower than the previous year.
HaGe Kiel’s operating income is in line with the previous year, with efficiency improvement work continuing as planned.
Lantmännen’s acquisition of the Finnish company K-maatalous from Kesko Group was completed on June 1. K-maatalous is one of the largest players in the Finnish agri-cultural market with a turnover of approximately SEK 3 bil-lion, a nationwide network of almost 80 dealers and a market share of 27 percent. The acquisition provides Lantmännen with opportunities to grow and further develop its position in the Finnish grain value chain.
Lantmännen’s Group Board has decided to initiate two large structural projects in the grain business in Sweden. The projects concern the area north of Mälaren and Österlen in Skåne. The main purpose is to replace the older facilities in Uppsala and Ystad, which are in urban locations that are grad-ually being converted into residential units – and to increase accessibility for customers and suppliers.
In mid-May, the new LM2 digital tool was launched to all Lantmännen’s agribusiness customers after successful pilot tests. The tool includes five areas: Cultivation, Grain, Feed, Machinery and Finance. Brand new features such as financial grain trading and a machinery overview have been added – and further services will be launched during 2017.
Development of Lantmännen’s organic strategy continues: the ambition is to double trade in organic grain by 2020.
Agriculture Sector, adjusted for items affecting comparabilityMSEK %
0
50
100
150
200
Jan-AprSep-DecMay-AugJan-AprSep-DecMay-AugJan-Apr
Operating income Return on operating capitalOperating margin
2015 2016
0
5
10
15
20
2017
Agriculture Sector
Key figures Agriculture Sector2017
Jan-Apr2016
Jan-Apr Change
Net sales, MSEK 3,871 3,785 2 %Operating income, MSEK 96 94 2Operating margin, % 2.5 2.5Return on operating capital, % 7.1 7.0Average number of employees 765 702 9 %
Key figures Lantmännen Lantbruk Sweden
Net sales, MSEK 3,822 3,741 2 %Operating income, MSEK 97 86 11Operating margin, % 2.5 2.3Return on operating capital, % 11.6 9.5Average number of employees 732 671 9 %

7Lantmännen’s Interim Report January-April 2017
The Machinery Sector’s net sales are higher than in the previ-ous year. Operating income amounts to MSEK 28, an increase from MSEK 11 for the same period the previous year.
Sales in both Lantmännen Maskin Sweden and Swecon have shown a marked increase in the last 12 months, and the trend during the first four-month period has continued to be positive. Swecon is maintaining its market shares in growing markets. The Sector’s sales have been adversely affected by the divestments of the Norwegian and Danish import operations, which have been completed as planned.
Lantmännen Maskin ceased its sales of Claas machines in Sweden on March 31. On April 1, Lantmännen Maskin took over imports of Massey Ferguson’s tractors to the Swedish mar-ket; Massey Ferguson’s dealer network will continue to be the
0
60
120
180
Jan-AprSep-DecMay-AugJan-AprSep-DecMay-AugJan-Apr20172015
0
10
20
30
2016
Operating income Return on operating capitalOperating margin
Machinery Sector, adjusted for items affecting comparabilityMSEK %
Machinery Sector
Key figures Machinery Sector2017
Jan-Apr2016
Jan-Apr Change
Net sales, MSEK 3,332 3,150 6 %Operating income, MSEK 28 11 17Operating margin, % 0.8 0.3Return on operating capital, % 5.4 1.8Average number of employees 1,965 1,912 3 %
Key figures Lantmännen Maskin Sweden
Net sales, MSEK 1,025 944 9 %Operating income, MSEK –32 –33 1Operating margin, % –3.1 –3.5Return on operating capital, % –10.3 –10.0Average number of employees 812 771 5 %
distribution channel. Fendt’s combines have been well received among farmers, and sales continue to develop positively.
All spare parts are currently delivered from Lantmännen’s expanded central warehouse in Malmö to AGCO’s dealers in Scandinavia after AGCO’s warehouse in Copenhagen was closed in November 2016.
Integration of the machinery business in Kalmar has now been completed, and the work to build a new facility in Kalmar is progressing as planned. All Lantmännen’s agricultural-related oper-ations will be gathered together in the new facility, which is sched-uled to be ready for occupation in the fourth quarter of 2017.
Swecon continues to perform very well. There has been strong demand for construction machinery in Sweden early in the year, notably in urban areas, driven by large infrastruc-ture projects. However, the mining sector in northern Sweden remains under pressure, with investments being postponed. The German market shows a steady upward trend and Swecon has maintained its market share in the large machinery segment. The Baltic market is relatively stable for the wood industry, but a little weaker for construction and infrastructure.
Agro Oil is developing according to plan and the new business model with sales via Lantmännen Maskin and Swecon in Sweden is functioning as planned. However, sales have been adversely affected now that the channel via internal dealers within Lantmännen Maskin in Norway has ceased as planned.

8 Lantmännen’s Interim Report January-April 2017
The Energy Sector’s net sales for the first four-month period are significantly higher than the previous year. Operating income is MSEK 141 – a marked improvement from MSEK 84 the previous year.
The strong improvement is mainly attributable to Lant-männen Agroetanol, which has shown a significant increase in operating income. This is partly due to a continuation of the successful work on exports of climate-friendly ethanol to Germany and increased sales of more value-added products, but is also an effect of the higher price of ethanol in the first four-month period.
In early April, Deputy Prime Minister and Climate Min-ister Isabella Lövin, and a group from the Green Party and the Government Offices visited Lantmännen Agroetanol in Nor-rköping. Dialogue with Swedish politicians is generally good, which contributes to a more stable market picture. At the same time, there is an EU proposal that would have a negative impact on crop-based fuels in the EU, and this is contributing to continuing market uncertainty and price volatility.
Within Lantmännen Aspen, competition in the Nordic markets has shown a marked increase at the beginning of the year, while several markets in the rest of Europe have developed well. The total sales volume continues its positive trend, but higher commodity prices are having a negative impact on earnings. Several market activities are in progress for the newly launched Aspen D diesel product, which has been positively received on the market.
For Lantmännen Reppe, demand remains strong, while higher commodity prices are having a negative impact on earnings. A long-term initiative to increase production capacity is in progress.
The jointly owned pellet company Scandbio has imple-mented a number of capacity reductions as a result of lower demand and tougher competition.
0
25
50
75
100
125
150
Jan-AprSep-DecMay-AugJan-AprSep-DecMay-AugJan-Apr20172015 2016
0
10
20
30
40
50
60
Operating income Return on operating capitalOperating margin
Energy Sector, adjusted for items affecting comparabilityMSEK %
Energy Sector
Lantmännen Agretanol, Norrlöping
Key figures Energy Sector 2017
Jan-Apr2016
Jan-Apr Change
Net sales, MSEK 1,034 809 28 %Operating income, MSEK 141 84 57Operating margin, % 13.6 10.4Return on operating capital, % 57.4 22.7Average number of employees 232 228 2 %

9Lantmännen’s Interim Report January-April 2017
The Food Sector’s net sales are in line with the previous year. Operating income amounts to MSEK 154, an improvement from MSEK 185 the previous year.
Lantmännen Cerealia continues to face challenges in several of its product categories, mainly as a result of more intense price pressure and competition from Private Label. B2B operations are developing according to plan.In Strängnäs, the large-scale project to expand Lantmännen Cerealia’s mill plant continues.
There have been several product launches during the first four months of the year. Organic and locally produced baby food has been launched under the new “Little Farmer” brand, and Kungsörnen’s new pasta made from durum wheat from Gotland is now being sold both to consumers and food service customers, which means Lantmännen is first on the market with pasta made from Swedish durum wheat. The launch is the result of several years of test cultivation, and is a good example of how Lantmännen can utilize its unique position throughout the value chain.
Lantmännen Unibake continues its stable development and has increased its sales. The main growth is in Poland and Russia, and in the fresh bread business in Denmark. In par-ticular, demand from fast food producers for Lantmännen Unibake’s premium bread has increased. Earnings have been adversely affected by planned start-up costs for the new bak-ery in Londerzeel in Belgium and an unusually cold spring with lower sales of fast food products.
A number of investments are being made within Lant-männen Unibake, including the construction of a new bak-ery in Nowa Sol in Poland, where production is expected to start during the year. In Londerzeel, Belgium, production has started in the new bakery, built to replace the bakery that was destroyed by fire in 2015.
The acquisition of the Anderson Bakery (PS Bageri AB outside Stockholm), which mainly produces baguettes, was completed on March 1. The company has an annual turn-over of approximately MSEK 75 and 30 employees. The acquisition creates a stronger base and opens up new oppor-tunities in the Nordic home market.
0
100
200
300
400
Jan-AprSep-DecMay-AugJan-AprSep-DecMay-AugJan-Apr20172015
0
3
6
9
12
2016
Operating income Return on operating capitalOperating margin
Food Sector, adjusted for items affecting comparabilityMSEK %
Food Sector
Good food from Lantmännen
Gotland pasta with Swedish-grown durum wheat
Key figures Food Sector 2017
Jan-Apr2016
Jan-Apr Change
Net sales, MSEK 4,529 4,424 2 %Operating income, MSEK 154 185 –31Operating margin, % 3.4 4.2Return on operating capital, % 3.5 4.6Average number of employees 6,545 6,722 –3 %

10 Lantmännen’s Interim Report January-April 2017
Lantmännen Real Estate’s net sales are higher than the pre-vious year, and operating income excluding property sales is MSEK 70, compared with MSEK 61 the previous year. Income from property sales was MSEK 5 (41).
During the first period, Lantmännen Real Estate made two strategic acquisitions of properties in Finland where Lant-männen Cerealia and Lantmännen Unibake (Vaasan) carry out production.
Lantmännen Real Estate and the system provider Unit4 have won the 2017 Business System Project of the Year award for the implementation of the Unit4 Business World system. The new system handles reporting, lease administration, accounts payable ledgers and accounts receivable ledgers for Lantmännen’s property companies.
The district heating operations in Lantmännen Agrovärme show a stable performance, delivering an operating income in line with the previous year.
In Örebro, plans have been made for the demolition of a small silo, which will begin in June. It is also the intention to demolish the larger adjacent silo during fall.
In Kalmar, construction of “Lantmännens hus” is in pro-gress. All Lantmännen’s agricultural-related operations will be gathered together in the facility, which is scheduled to be ready for occupation in the fourth quarter of 2017.
Joachim Haas succeeded Mikael Nicander as Head of Lantmännen Real Estate during the period.
Lantmännen Real Estate, excluding property salesMSEK %
0
20
40
60
80
Jan-AprSep-DecMay-AugJan-AprSep-DecMay-AugJan-Apr
Primär grön
PMS 36960/0/100/7RGB 136/171/50HEX 88AB32NCS S 1080-G30Y
PMS Process Cyan100/0/0/0
PMS 38229/0/100/0RGB 204/210/33HEX CCD221
0/20/100/00/0/45/0
35/0/0/0
0/6/6/12
65/0/0/0
0/18/30/28
0/60/100/0
100/0/0/0
0/50/60/56
Cool greyCMYK 10% - 90% svart
PMS 37650/0/100/0RGB 162/189/48HEX A2BD30
Grå stödfärgskala
Kickfärg
Komplementfärger
25/45/0/012/22/0/0 45/75/0/0
PMS 37056/0/100/27RGB 119/147/44HEX 77932C
Sekundär grön palett
20172015
0
5
10
15
20
2016
Operating income Return on operating capital
Lantmännen Real Estate
Key figures Lantmännen Real Estate2017
Jan-Apr2016
Jan-Apr Change
Net sales, MSEK 176 165 7 %Operating income, excluding property sales, MSEK 70 61 9Operating income, MSEK 75 102 –27Return on operating capital, adjusted for property sales, % 10.0 11.1Average number of employees 43 39 10 %

11Lantmännen’s Interim Report January-April 2017
Viking Malt
Lantmännen’s international ownership
Lantmännen has interest holdings in a number of international companies. These companies’ operations are primarily located in the Nordic region, Germany, Poland and the Baltic countries. With these holdings, Lantmännen is well positioned to offer customers in Sweden and in export markets long-term business relationships with stable delivery performance.
In order to strengthen and expand existing international agri-cultural cooperation, Lantmännen and the Danish agricultural company DLG (Dansk Landbrugs Grovvareselskab) have estab-lished the company Lantmännen DLG International (LDI). The purpose of the company is to expand the position in markets and businesses where Lantmännen and DLG already have a strong partnership and to expand into new, mainly European, markets.
HaGe Kiel holding 41 %Hauptgenossenschaft Nord AG (HaGe Kiel) has an annual turnover of SEK 21 billion and 1,600 employees. Lantmännen owns 41 percent of HaGe Kiel, while DLG owns 54 percent. Operations include grain trading and the sale of inputs in the agricultural market. HaGe Kiel has well developed logistics chains and port terminals located in Hamburg, Kiel and Ros-tock which supply the market with grain and oilseeds, both locally and internationally. HaGe Kiel has feed factories and also trades in agricultural goods, machinery and sales of leisure and garden products. Lantmännen’s share of income is includ-ed in the Agriculture Sector.
Scandagra Group holding 50 %Scandagra Group AB operates in the Baltic region. The Group has an annual turnover of SEK 2.4 billion and 300 employ-ees. The company is jointly owned (50-50) by Lantmännen and DLG. The operations are conducted through three sales companies – Scandagra Eesti, Scandagra Latvia and Scandagra Lietuva. The sales companies engage in the sale of crop pro-duction inputs and the purchase and sale of grain. Scandagra Eesti also has a feed plant with a production capacity of just over 100,000 tonnes. Lantmännen’s share of income is includ-ed in the Agriculture Sector.
Scandagra Polska holding 50 %Scandagra Polska, which is a merchant of grain and other inputs in the Polish agricultural market, has an annual turn-over of SEK 1.3 billion and 160 employees. The company is jointly owned (50-50) by Lantmännen and DLG. Scandagra Polska is one of many traders in the large and diversified Polish market. Lantmännen’s share of income is included in the Agriculture Sector.
Scandbio holding 50 %(Formerly Agroenergi Neova Pellets)
Scandbio is the largest wood fuel company in Sweden and sells 100 percent renewable energy in the form of pellets, bri-quettes, biomass logs and powder. The products are manufac-tured by using residues from the forestry and sawmill industry. The company has an annual turnover of SEK 900 million and 130 employees. Scandbio has a strong position in the Swedish market and in the Baltic Sea region. Lantmännen and Neova each own 50 percent of the company. Lantmännen’s share of income is included in the Energy Sector.
Viking Malt holding 38 %Viking Malt is refiner of grain, and supplies about 600,000 tonnes of malt annually to breweries and distilleries in north-ern Europe, and to selected customers around the world. Viking Malt produces malt in Finland, Sweden, Denmark, Poland and Lithuania. The company has an annual turnover of SEK 1.8 billion and 240 employees. Lantmännen owns 38 percent of the company, with the remainder being owned by the Finnish company Polttimo. Lantmännen’s share of income is included in the Energy Sector.

12 Lantmännen’s Interim Report January-April 2017
MSEK2017
Jan-Apr2016
Jan-AprMay 2016-
Apr 20172016
Jan-Dec
Net sales 12,198 11,680 37,762 37,244
Other operating income 87 146 741 800Changes in inventories of finished goods and work in progress –510 –858 48 –300Raw materials and consumables –3,472 –2,871 –11,705 –11,104Merchandise –3,680 –3,639 –11,915 –11,874Employee benefits expense –1,890 –1,802 –5,666 –5,578Depreciation, amortization and impairment –398 –365 –1,198 –1,165Other operating expenses –1,972 –1,955 –6,532 –6,515Share of income of equity accounted companies 38 29 107 98
Operating income 401 365 1,642 1,606
Finance income 39 42 162 165Finance costs –86 –103 –297 –314
Income after financial items 354 304 1,507 1,457
Tax –40 –26 –197 –183
Net income for the period 314 278 1,310 1,274
Net income for the period attributable to:Members of the economic association 308 277 1,304 1,273Non-controlling interests 6 1 6 1
Condensed consolidated income statement

13Lantmännen’s Interim Report January-April 2017
Condensed consolidated statement of comprehensive income
MSEK2017
Jan-Apr2016
Jan-AprMay 2016-
Apr 20172016
Jan-Dec
Net income for the period 314 278 1,310 1,274
Other comprehensive income Items that will not be reclassified to the income statementActuarial gains and losses on defined benefit pension plans, net of tax 26 –41 –95 –162Tax on actuarial gains and losses –6 9 21 36
Total 20 –32 –74 –126
Items that will be reclassified to the income statementAvailable-for-sale financial assets, net of tax –10 19 52 81Cash flow hedges, net of tax –33 20 –31 22Exchange differences on translation of foreign operations 26 7 212 193Net gain on hedge of net investment in foreign operations, net of tax –4 –26 –46 –68Tax attributable to items that will be reclassified 14 –2 18 2
Total –7 18 205 230
Share of OCI in equity accounted companiesItems that will be reclassified to the income statement 19 2 68 51
Total 19 2 68 51
Other comprehensive income, net of tax 32 –12 199 155
Total comprehensive income for the period 346 266 1,509 1,429
Net income for the period attributable to:Members of the economic association 340 265 1,503 1,428Non-controlling interests 6 1 6 1

14 Lantmännen’s Interim Report January-April 2017
MSEK2017
Jan-Apr2016
Sep-Dec2016
May-Aug2016
Jan-Apr
Net sales 12,198 12,727 12,837 11,680
Other operating income 87 189 465 146Changes in inventories of finished goods and work in progress –510 –280 838 –858Raw materials and consumables –3,472 –3,805 –4,428 –2,871Merchandise –3,680 –3,834 –4,401 –3,639Employee benefits expense –1,890 –1,939 –1,837 –1,802Depreciation, amortization and impairment –398 –417 –383 –365Other operating expenses –1,972 –2,166 –2,394 –1,955Share of income of equity accounted companies 38 58 11 29
Operating income 401 533 708 365
Finance income 39 42 81 42Finance costs –86 –85 –126 –103
Income after financial items 354 490 663 304
Tax –40 77 –234 –26
Net income for the period 314 567 429 278
Net income for the period attributable to:Members of the economic association 308 567 429 277Non-controlling interests 6 0 0 1
Condensed consolidated four-monthly income statements
The Group’s items affecting comparability
MSEK2017
Jan-Apr2016
Jan-Apr2016
Jan-Dec
Recognized operating income 401 365 1,606Items affecting comparability in operating income:Insurance compensation, Food Sector - - 357Restructuring costs, Food Sector - - –148Provisions, Energy Sector - - –300
Total items affecting comparability in operating income - - –91
Operating income, adjusted for items affecting comparability 401 365 1,697
Recognized income after financial items 354 304 1,457Items affecting comparability in operating income according to above - - –91
Income after financial items adjusted for items affecting comparability 354 304 1,548
Return on equity, adjusted for items affecting comparability, % 6.7 6.5 11.0Return on operating capital, adjusted for items affecting comparability, % 5.9 5.6 8.4

15Lantmännen’s Interim Report January-April 2017
MSEK2017
Apr 302016
Apr 302016
Dec 31
ASSETSProperty, plant and equipment 8,670 7,136 8,240Investment properties 832 777 858Goodwill 4,697 4,400 4,611Other intangible assets 2,982 2,768 2,980Equity accounted holdings 1,918 1,745 1,896Non-current financial assets 775 707 770Deferred tax assets 161 212 136Other non-current assets 17 37 23
Total non-current assets 20,052 17,782 19,514
Inventories 5,142 5,252 5,270Trade and other receivables 5,930 5,688 5,727Current interest-bearing assets 48 186 176Current tax assets 49 38 30Cash and cash equivalents 1,830 2,009 1,773
Total current assets 12,999 13,173 12,976
TOTAL ASSETS 33,051 30,955 32,490
EQUITY AND LIABILITIESEquity attributable to members of the economic association 14,118 12,954 13,795Non-controlling interests 98 22 88
Total equity 14,216 12,976 13,883
Non-current interest-bearing liabilities 1) 4,984 3,952 4,991Provisions for pensions 474 388 519Deferred tax liabilities 396 389 437Other non-current provisions 260 329 247Other non-current liabilities 27 39 25
Total non-current liabilities 6,141 5,097 6,219
Current interest-bearing liabilities 3,271 4,350 3,373Trade and other payables 8,626 8,042 8,199Current tax liabilities 113 118 89Current provisions 684 372 727
Total current liabilities 12,694 12,882 12,388
TOTAL EQUITY AND LIABILITIES 33,051 30,955 32,490
Equity ratio 43.0 41.9 42.7
1) Including subordinated debentures, MSEK 250 250 250
Condensed consolidated statement of financial position

16 Lantmännen’s Interim Report January-April 2017
Condensed consolidated statement of cash flows
MSEK2017
Jan-Apr2016
Jan-Apr2016
Jan-Dec
Operating income 401 365 1,606Adjustment for non-cash items 1) 363 284 1,302Financial items paid, net –64 –63 –205Taxes paid –84 –64 –132
Cash flow from operating activities before changes in working capital 616 522 2,571
Change in working capital 286 493 565
Cash flow from operating activities 902 1,015 3,136
Acquisitions and divestments of operations 4 –25 –357Investments in property, plant & equipment and intangible assets –862 –641 –2,333Sale of property, plant & equipment and intangible assets 123 287 449Change in financial investments 68 5 –69
Cash flow from investing activities –667 –374 –2,310
Cash flow before financing activities 235 641 826
Change in loans –165 96 –57Change in contributed capital –17 0 103Dividend paid 0 0 –383
Cash flow from financing activities –182 96 –337
Cash flow for the period 53 737 489
Cash and cash equivalents at beginning of period 1,773 1,252 1,252Exchange differences in cash and cash equivalents 4 20 32
Cash and cash equivalents at the end of the period 1,830 2,009 1,773
1) Depreciation, amortization and impairment of non-current assets 398 365 1,165 Share of income of equity accounted companies –14 –29 –63 Capital gains/losses on sale of non-current assets and operations –9 –42 –23 Other non-cash items –12 –10 223
Adjustment for non-cash items 363 284 1,302

17Lantmännen’s Interim Report January-April 2017
Condensed consolidated statement of changes in equity
2017Jan-Apr
2016Jan-Apr
2016Jan-Dec
MSEKAssociation
members
Non- controlling
interestTotal
equityAssociation
members
Non- controlling
interestTotal
equityAssociation
members
Non- controlling
interestTotal
equity
Closing balance 13,795 88 13,883 12,660 21 12,681 12,660 21 12,681Changes due to amended accounting policies in associates - - - 66 - 66 66 - 66
Opening balance, January 1 13,795 88 13,883 12,726 21 12,747 12,726 21 12,747
Total comprehensive income for the period 340 6 346 265 1 266 1,428 1 1,429
Distribution to owners - - - - - - –425 –2 –427Contributed capital paid in by members 1 - 1 - - - 153 - 153Contributed capital paid out to members –18 - –18 - - - –50 - –50Other change1) - 4 4 –37 - –37 –37 68 31
Closing balance 14,118 98 14,216 12,954 22 12,976 13,795 88 13,883
Equity attributable to members of the economic association
Contributed capital, paid in 1,083 986 1,101Contributed capital, issued 1,198 1,160 1,198Other equity 11,837 10,808 11,496
Total equity attributable to members of the economic association 14,118 12,954 13,795
1) Of which acquisition of subsidiaries with NCI 4 4 68 68 Of which associates’ acquisition of NCI in
subsidiaries –37 –37 –37 –37

18 Lantmännen’s Interim Report January-April 2017
Segment information, adjusted for items affecting comparability
Net sales per segment
MSEK2017
Jan-Apr2016
Jan-AprChange
%May 2016-
Apr 20172016
Jan-Dec
Agriculture Sector 3,871 3,785 2 % 10,853 10,767Machinery Sector 3,332 3,150 6 % 11,525 11,343Energy Sector 1,034 809 28 % 2,923 2,698Food Sector 4,529 4,424 2 % 14,153 14,048Lantmännen Real Estate 176 165 7 % 466 455Other operations 126 137 –8 % 409 420Eliminations –870 –790 –10 % –2,567 –2,487
Lantmännen total 12,198 11,680 4 % 37,762 37,244
Operating margin per segment, adjusted for items affecting comparability
%2017
Jan-Apr2016
Jan-AprMay 2016-
Apr 20172016
Jan-Dec
Agriculture Sector 2.5 2.5 2.9 3.0Machinery Sector 0.8 0.3 2.9 2.8Energy Sector 13.6 10.4 12.4 11.3Food Sector 3.4 4.2 5.8 6.0
Lantmännen total 3.3 3.1 4.6 4.6
Return on operating capital, adjusted for items affecting comparability
%2017
Jan-Apr2016
Jan-AprMay 2016-
Apr 20172016
Jan-Dec
Agriculture Sector 7.1 7.0 7.8 7.8Machinery Sector 5.4 1.8 19.5 17.8Energy Sector 57.4 22.7 42.8 31.4Food Sector 3.5 4.6 6.3 6.7Lantmännen Real Estate 1) 10.0 11.1 10.5 10.9
Lantmännen total 5.9 5.6 8.5 8.4
1) Adjusted for gain on sale of property.
Operating income per segment, adjusted for items affecting comparability
MSEK2017
Jan-Apr2016
Jan-AprMay 2016-
Apr 20172016
Jan-Dec
Agriculture Sector 96 94 320 318Machinery Sector 28 11 333 316Energy Sector 141 84 361 304Food Sector 154 185 818 849Lantmännen Real Estate 1) 75 102 254 281Other operations –83 –78 –187 –182Group items –10 –33 –166 –189
Lantmännen total 401 365 1,733 1,697
1) Including capital gain on sale of property 5 41 57 93

19Lantmännen’s Interim Report January-April 2017
Segment information
Net sales per segment
MSEK2017
Jan-Apr2016
Jan-AprChange
%May 2016-
Apr 20172016
Jan-Dec
Agriculture Sector 3,871 3,785 2 % 10,853 10,767Machinery Sector 3,332 3,150 6 % 11,525 11,343Energy Sector 1,034 809 28 % 2,923 2,698Food Sector 4,529 4,424 2 % 14,153 14,048Lantmännen Real Estate 176 165 7 % 466 455Other operations 126 137 –8 % 409 420Eliminations –870 –790 –10 % –2,567 –2,487
Lantmännen total 12,198 11,680 4 % 37,762 37,244
Operating margin per segment
%2017
Jan-Apr2016
Jan-AprMay 2016-
Apr 20172016
Jan-Dec
Agriculture Sector 2.5 2.5 2.9 3.0Machinery Sector 0.8 0.3 2.9 2.8Energy Sector 13.6 10.4 2.1 0.1Food Sector 3.4 4.2 7.3 7.5
Lantmännen total 3.3 3.1 4.3 4.3
Return on operating capital
%2017
Jan-Apr2016
Jan-AprMay 2016-
Apr 20172016
Jan-Dec
Agriculture Sector 7.1 7.0 7.8 7.8Machinery Sector 5.4 1.8 19.5 17.8Energy Sector 57.4 22.7 7.1 0.4Food Sector 3.5 4.6 7.9 8.4Lantmännen Real Estate 1) 10.0 11.1 10.5 10.9
Lantmännen total 5.9 5.6 8.0 8.0
1) Adjusted for gain on sale of property.
Operating income per segment
MSEK2017
Jan-Apr2016
Jan-AprMay 2016-
Apr 20172016
Jan-Dec
Agriculture Sector 96 94 320 318Machinery Sector 28 11 333 316Energy Sector 141 84 61 4Food Sector 154 185 1,027 1,058Lantmännen Real Estate 1) 75 102 254 281Other operations –83 –78 –187 –182Group items –10 –33 –166 –189
Lantmännen total 401 365 1,642 1,606
1) Including capital gain on sale of property 5 41 57 93

20 Lantmännen’s Interim Report January-April 2017
MSEK2017
Jan-Apr2016
Jan-Apr
Net sales, external 3,177 3,208Net sales, intra-Group 763 683
Net sales, total 3,940 3,891
Change in products in progress, finished goods and work in progress for third parties –455 –479Other operating income 77 123
3,562 3,535
Operating expensesRaw materials and consumables –2,044 –1,871Merchandise –704 –806Other external costs –479 –478Employee benefits expense –274 –264Depreciation, amortization and impairment –52 –54
Total operating expenses –3,553 –3,473
Operating income 9 62
Income from financial items 392 42
Income after financial items 401 104
Tax –16 –10
Net income for the period 385 94
Parent Company condensed income statement
Parent Company
The activities of the Parent Company Lantmännen ek för consist of Lantmännen’s core operations in the Agriculture Sector, Agro Oil and the corporate functions.
The Parent Company’s net sales amounted to MSEK 3,940 (3,891), while operating income was MSEK 9 (62). The figure for the previous year includes a capital gain of MSEK 68 on property sales.
Income from financial items was MSEK 392 (42). Net financial income includes internal dividends of MSEK 158 (0)
and a capital gain of MSEK 192 (0) on the sale of shares in sub-sidiaries. Net financial income was also affected by net interest income of MSEK 27 (14) and exchange losses of MSEK –18 (28). Income after financial items was MSEK 401 (104).
Net investments in non-current assets amounted to MSEK 50 (27).
The equity ratio was 44.8 percent (43.9, year-end).The average number of employees in the Parent Company
was 955 (929).

21Lantmännen’s Interim Report January-April 2017
Parent Company condensed statement of financial position
MSEK2017
Apr 302016
Apr 30
ASSETSIntangible assets 499 462Property, plant and equipment 756 830Investments in Group companies 8,933 7,561Investments in joint ventures/associates 1,235 1,184Non-current receivables from Group companies 2,801 639Other securities held as non-current assets 187 112Other non-current receivables 180 169
Total non-current assets 14,591 10,957
Inventories 1,557 1,496Current receivables from Group companies 10,857 12,355Other current receivables 2,239 2,484Short-term investments, incl. cash and bank balances 1,171 733
Total current assets 15,824 17,068
TOTAL ASSETS 30,415 28,025
EQUITY AND LIABILITIESEquity 13,253 12,178Untaxed reserves 466 311Provisions 137 130Non-current liabilities 4,503 3,449
Current liabilities to Group companies 6,744 5,963Other current liabilities 5,312 5,994
TOTAL EQUITY AND LIABILITIES 30,415 28,025
Equity ratio 44.8 44.3
22 Lantmännen’s Interim Report January-April 2017
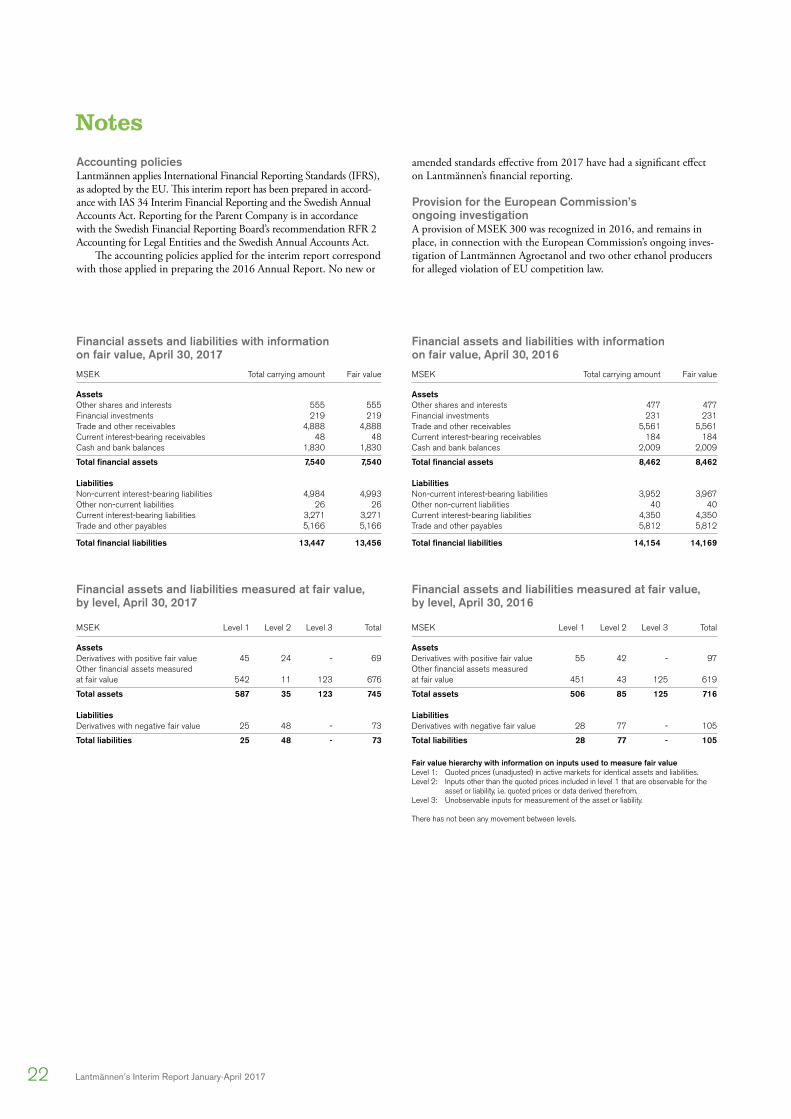
Notes
Financial assets and liabilities with information on fair value, April 30, 2017
MSEK Total carrying amount Fair value
Assets Other shares and interests 555 555Financial investments 219 219Trade and other receivables 4,888 4,888Current interest-bearing receivables 48 48Cash and bank balances 1,830 1,830
Total financial assets 7,540 7,540 Liabilities Non-current interest-bearing liabilities 4,984 4,993Other non-current liabilities 26 26Current interest-bearing liabilities 3,271 3,271Trade and other payables 5,166 5,166
Total financial liabilities 13,447 13,456
Financial assets and liabilities measured at fair value, by level, April 30, 2017
MSEK Level 1 Level 2 Level 3 Total
AssetsDerivatives with positive fair value 45 24 - 69Other financial assets measured at fair value 542 11 123 676
Total assets 587 35 123 745
LiabilitiesDerivatives with negative fair value 25 48 - 73
Total liabilities 25 48 - 73
Financial assets and liabilities with information on fair value, April 30, 2016
MSEK Total carrying amount Fair value
Assets Other shares and interests 477 477Financial investments 231 231Trade and other receivables 5,561 5,561Current interest-bearing receivables 184 184Cash and bank balances 2,009 2,009
Total financial assets 8,462 8,462 Liabilities Non-current interest-bearing liabilities 3,952 3,967Other non-current liabilities 40 40Current interest-bearing liabilities 4,350 4,350Trade and other payables 5,812 5,812
Total financial liabilities 14,154 14,169
Financial assets and liabilities measured at fair value, by level, April 30, 2016
MSEK Level 1 Level 2 Level 3 Total
AssetsDerivatives with positive fair value 55 42 - 97Other financial assets measured at fair value 451 43 125 619
Total assets 506 85 125 716
LiabilitiesDerivatives with negative fair value 28 77 - 105
Total liabilities 28 77 - 105
Fair value hierarchy with information on inputs used to measure fair valueLevel 1: Quoted prices (unadjusted) in active markets for identical assets and liabilities.Level 2: Inputs other than the quoted prices included in level 1 that are observable for the
asset or liability, i.e. quoted prices or data derived therefrom.Level 3: Unobservable inputs for measurement of the asset or liability.
There has not been any movement between levels.
Accounting policiesLantmännen applies International Financial Reporting Standards (IFRS), as adopted by the EU. This interim report has been prepared in accord-ance with IAS 34 Interim Financial Reporting and the Swedish Annual Accounts Act. Reporting for the Parent Company is in accordance with the Swedish Financial Reporting Board’s recommendation RFR 2 Accounting for Legal Entities and the Swedish Annual Accounts Act.
The accounting policies applied for the interim report correspond with those applied in preparing the 2016 Annual Report. No new or
amended standards effective from 2017 have had a significant effect on Lantmännen’s financial reporting.
Provision for the European Commission’s ongoing investigationA provision of MSEK 300 was recognized in 2016, and remains in place, in connection with the European Commission’s ongoing inves-tigation of Lantmännen Agroetanol and two other ethanol producers for alleged violation of EU competition law.

23Lantmännen’s Interim Report January-April 2017
Alternative performance measuresIn addition to the application of IFRS, Lantmännen has also chosen to follow new guidelines on definitions of alternative performance measures issued by the European Securities and Markets Authority (ESMA). An APM is a measure that is used to evaluate an entity’s
financial position but is not defined in any of the IASB’s issued inter-national reporting standards. The Guidelines require entities to provide an explanation of the basis of calculation of the alternative performance measures used. These principles are aimed at giving external parties better understanding of an entity’s financial statements.
Key figures Description Reason for use
Adjusted income Adjusted income is income net of items affecting comparability. An adjustment to exclude items affecting comparability.
Average equity/operating capital Average capital is computed on the closing balance of each month in the accounting period, i.e. twelve periods for the full year. All average capital ratios are calculated in this way.
Ensures accurate calculation of return on equity and operating capital.
Capital turnover rate Net sales divided by average operating capital. Shows the efficiency of the use of operating capital.
Cash flow from operating activities Net income for the period adjusted for items that are not cash inflows or outflows but accounting costs, such as depreciation and capital gains/losses. Adjustments are also made for financial items and income taxes paid, and changes in inventories, operating receivables and operating liabilities.
Shows cash flow from operations that can be used for investments and acquisitions.
EBITDA according to bank definition. Income before financial income and costs, tax, depreciation and impair-ment and profit share from associated companies, on a rolling 12 month basis, adjusted for acquired and divested companies.
To calculate the key ratio Net debt according to bank definition/EBITDA according to banking definition.
Equity ratio Equity divided by total assets. Shows what proportion of the assets that are financed by the owners.
Interest coverage ratio Interest coverage ratio is calculated as income after financial items plus finance costs divided by finance costs.
Shows the ability to cover interest expenses.
Investments in non-current assets Total of the period’s investments in property, plant & equipment and intangible assets.
The size of the investments made to maintain existing capacity and to achieve expansion and growth.
Items affecting comparability The Group’s income can be increased or reduced by certain items that affect comparability. These are one-time items not directly related to the planned future operations and outside the range of MSEK +/–30.
Accounting for items that have been adjusted due to specific events that otherwise affect comparability be-tween different periods. Provides a better understand-ing of the operating activities.
Liquidity reserve Cash and cash equivalents and loans granted under the provisions in the existing loan agreements.
Shows the available borrowing capacity based on the current loan agreements.
Net debt Net debt comprises of interest-bearing liabilities, including pension liabili-ties and accrued net interest, less financial assets.
To show the net of interest-bearing assets and inter-est-bearing liabilities.
Net debt according to bank definition Net debt comprises of interest-bearing liabilities minus subordinated debentures less cash and cash equivalents.
To calculate the key ratio Net debt according to bank definition/EBITDA according to bank definition.
Net debt according to bank definition/EBITDA according to bank definition.
Net debt according to bank definition divided by EBITDA according to bank definition.
Indicates how fast a company can repay its debt (expressed in years).
Net debt/equity ratio Net debt divided by equity. Shows financial risk and is therefore used to view the level of debt funding.
Net financial income Net financial income is finance income less finance costs. Shows the net result of the company’s financial operations.
Operating capital Operating capital is non-interest-bearing assets minus non-interest- bearing liabilities. Tax assets and tax liabilities are not included in operating capital’s assets and liabilities.
Shows how much capital that is used in the operations.
Operating income Operating income consists of net sales and other operating income less operating expenses.
Shows the result of operating activities.
Operating margin The operating margin is calculated as operating income as a percentage of net sales for the period.
Shows the profitability in the operations.
Return on equity Return on equity is annualized net income for the period divided by average equity.
Shows owners the return on their invested capital.
Return on operating capital Return on operating capital is annualized operating income for the period divided by average operating capital.
Measures the return on the capital tied up in the business.
Description of financial key figures (including alternative performance measures)

24 Lantmännen’s Interim Report January-April 2017
On assignment for the Board of DirectorsStockholm, June 1, 2017
Per Olof NymanPresident & CEO Lantmännen
For more information, please contactPer Olof NymanPresident & CEO
Ulf ZenkCFO
This information is information that Lantmännen ek is required to disclose under the EU Market Abuse Regulation. The information was submitted by the above contact person for publication at 08.00 CET on June 2, 2017.
Auditors’ Review ReportThis Interim Report has not been audited by the company’s auditors.

25Lantmännen’s Interim Report January-April 2017

Lantmännen ek för | S:t Göransgatan 160A | Box 30192 | SE-104 25 Stockholm | Tel +46 10 556 00 00 | Corp. ident. no. 769605-2856
Pro
dukt
ion:
Wild
eco
We make farming thrive