Embed Size (px)
Citation preview

Together We Will: Evidence from a Field Experiment on Female Voter
Turnout in Pakistan
Xavier Gine & Ghazala MansuriDECRG, World Bank

Motivation• Over the 20th century, women have acquired de jure rights to participate in
democratic institutions– Universal Declaration of Human Rights (1948)– Convention on the Political Rights of Women (1952)– International Covenant on Civil and Political Rights (1966)– Convention on the Elimination of All Forms of Discrimination
against Women (1979)
• However, barriers to effective participation by women both as voters and as legislators remain significant
• Number of efforts to introduce quotas for women legislators. Results suggest some impact on policy choices as well as perceptions (Chattopadhyay & Duflo (2004); Bardhan et al (2005, 2008); Ban and Rao (2008))
• But women also have: » Lower participation rates as voters» They are also more likely to vote in accordance with the
preference of male clan and household heads (family voting)– unlike men of all ages

Why should we care?
• Good governance and development viewed as intrinsically linked (Sen 1999); World Bank (2005)
• Voting is essential for electoral accountability: Basic premise of representative democracy is that those who are subject to policy
should have a voice in its making. • Preference Heterogeneity: Women have different preferences so
their participation could lead to different policy choices
• Human Rights/Equity

Potential barriers to female participation in the electoral process
• Costs of Participation:
– Social constraints may restrict choices and/or restrict women’s freedom of movement
– Traditions, social and cultural stereotypes may lead to a sense of disempowerment and discourage women from participation in electoral processes or exercising their own preferences
– Concerns about security in conflict environments may have a greater impact on female participation
• Information:
– Women have fewer and poorer sources of information about the significance of political participation and/or the balloting process, in part due to illiteracy and mobility constraints
– Lack of information may reinforce disempowerment and stereotypes

What we assess1. How important is information for turnout and candidate choice?
– Why?• Attitudes change slowly but information can be provided quickly and
may serve to – enhance equity– induce a change in attitudes (Beaman et al (2007)) – be habit forming (Gerber, Green, Shachar (2003)) – change policy (Edlund & Pande (2002); Lott & Kenny (1999))
2. Are there significant peer effects?– Why? – Is this a cost effective way to boost participation?
– Evidence of spillovers (Duflo & Saez (2003); Kremer & Miguel (2004 & 2007))
– Evidence of contagion within family (Nickerson(2008))
3. Does information matter more/less when an election takes place in a politically volatile environment and is highly contested?

Context
• Rural Pakistan
• According to the 1998 Human Development Report, Pakistan ranked– 138 out of 174 on the Human Development Index (HDI)– 131 out of 163 on the Gender Development Index (GDI) – 100 out of 102 on the Gender Empowerment Measure(GEM)
• “Political parties, by and large, tend to view women as a passive vote bank, following the dictates of men within their families or clans. Even within their own parties, they treat them largely as followers to be strategically used for election canvassing and public campaigns. Thus, most parties do not even have lists of female members.”
“ Aurat Foundation, 2004
6

What we do
• Conduct a door to door voter information campaign directed at rural women just before the February 2008 national elections in Pakistan
• Two “treatments”
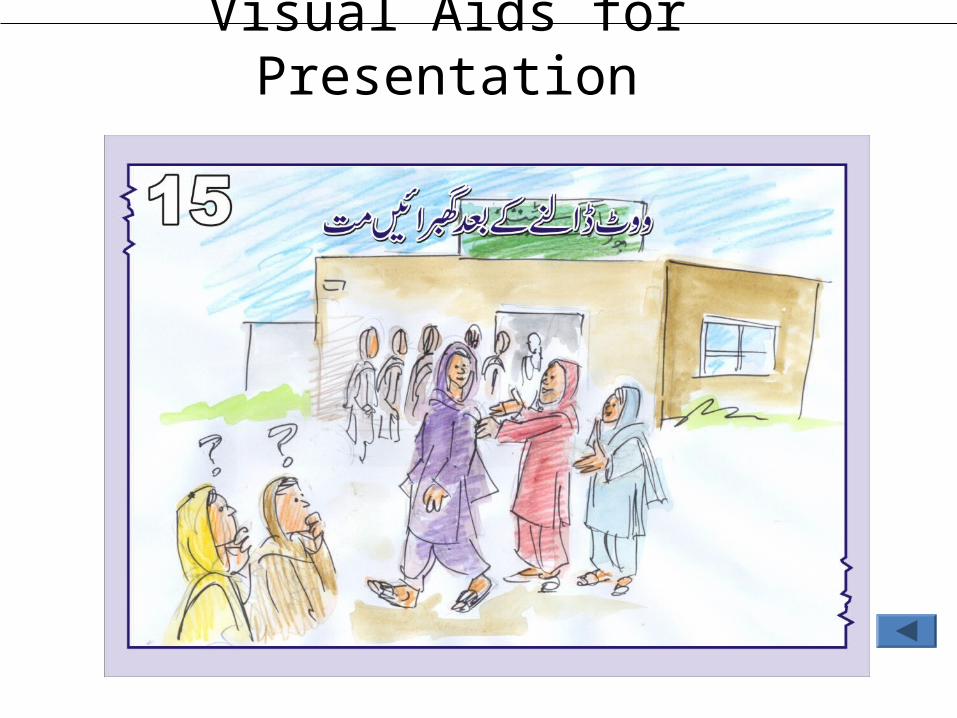
– The importance of voting (T1)– T1 plus the significance of secret balloting: Ability to vote
in accordance with one’s own preferences without external pressure (T2)
– The information campaign was developed as a set of simple visual messages

Study Design-1• Two districts in Sindh, Sukkur and Khairpur, selected because sharp electoral
competition between two major political parties– Pakistan People’s Party (PPP) (secular-left leaning)
and– Pakistan Muslim League (F) (allied with the military, led mainly by large landlords who are also religious leaders “pirs”).
• 6 villages selected from each district, where an NGO, MRDO, which mobilizes
women using a CBD approach was either working (or about to start work)
• 3 villages in Khairpur dropped just before the elections due to security
concerns. These had more contested polling stations relative to our sample
villages
• Final sample has 9 villages and 21 polling stations
• Average village population: approx 300 households

Study Design-2• Variation in treatment type (T1 or T2) as well as treatment
intensity to look at peer effects – Village divided into geographical clusters
– Clusters randomly assigned to get T1, T2 or nothing as follows: – start in a random cluster, deliver T1– leave a gap cluster– in the next cluster, deliver either T2 or nothing using a coin flip– leave a gap cluster– deliver either T2 or nothing depending on prior coin toss result– process repeated till all clusters in village covered
– Households within clusters selected as follows:– starting from any one end, every fourth household selected until up
to 18 households covered– In T1 and T2 clusters every 5th selected household left as a control.
So 2 to 4 control households in treated clusters. – In controls clusters, all selected household left as controls.

Timeline
HH visits and Pre-Election Survey
Voting Verification
Post-Election Survey
National Elections
Feb 18 Feb 18-19Feb 5 -15 March 5-25

Data I
• Pre-Election Visit (information intervention): – Household location (GIS); basic roster of all adult women, plus
past voting record and the name and address of closest friend/confidant in the village
– No refusals, so we have 100% compliance
• Post-election verification: – Self report and verification by checking ink stain– One friend per household, randomly selected from among
women “eligible” to vote (had NIC or claimed to be on the voter list)
11

Data II• Post election survey
– Household demographics, including caste (zaat/biradari) – Intervention checks– Mobility constraints– Access to media– Knowledge of location of polling station and the protocol for casting
a vote– Election day environment– Knowledge of: candidates, party platforms, recent political events,
election outcomes– Knowledge of whether other household members voted and for
whom
• Polling Station data– Electoral results by gender and by candidate/party
12
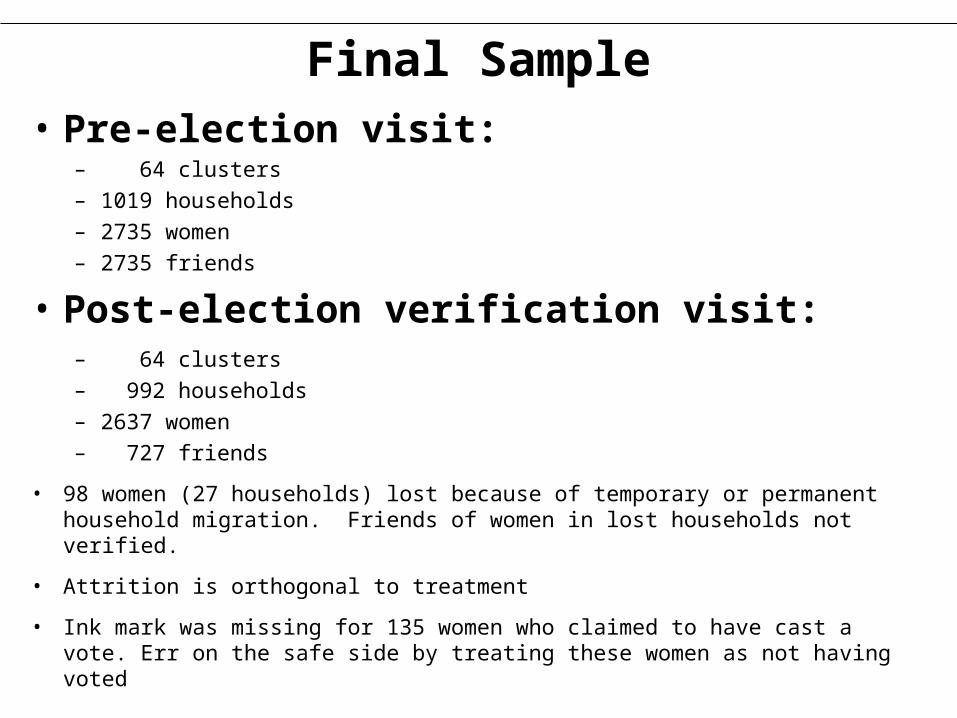
Final Sample• Pre-election visit:
– 64 clusters– 1019 households– 2735 women– 2735 friends
• Post-election verification visit:– 64 clusters– 992 households– 2637 women– 727 friends
• 98 women (27 households) lost because of temporary or permanent household migration. Friends of women in lost households not verified.
• Attrition is orthogonal to treatment
• Ink mark was missing for 135 women who claimed to have cast a vote. Err on the safe side by treating these women as not having voted

14
Household Characteristics by Treatment Status
Treatment vs control
households
Treatment 1 vs control
households
Treatment 2 vs control
householdsTreated clusters
vs control clusters
Treated households only
vs control clusters
Control households in
treated clusters vs households in control clusters
Comparison: T-C T1-C T2-C TN-CN T-CN CTN-CN
(1) (2) (3) (4) (5) (6)Panel A: Household Characteristics
Household size 0.271 0.247 -0.002 0.533 0.519 0.598[0.337] [0.338] [0.365] [0.421] [0.397] [0.597]
Number of women in the household (*) 0.099 0.072 0.019 0.01 0.11 0.03[0.103] [0.108] [0.112] [0.150] [0.138] [0.173]
Asset index 0.014 0.08 -0.077 -0.042 -0.031 -0.099[0.131] [0.158] [0.187] [0.199] [0.193] [0.207]
Total owned land (in acres) 0.954** 0.973* -0.137 0.783 0.939* -0.004[0.403] [0.513] [0.515] [0.515] [0.536] [0.391]
Average monthly expenditure 475.107 235.091 220.944 325.878 414.563 -140.57[400.192] [377.321] [366.025] [569.725] [591.562] [486.687]
House quality index -0.031 -0.058 0.034 -0.171 -0.152 -0.286**[0.099] [0.119] [0.120] [0.124] [0.123] [0.136]
Distance to polling station (Km) -0.033 -0.056 0.03 0.137 0.102 0.318*[0.080] [0.089] [0.109] [0.135] [0.126] [0.165]
Low Zaat status 0.027 -0.002 0.03 0.063 0.061 0.087[0.059] [0.067] [0.733] [0.099] [0.097] [0.069]
N. Obs 952 952 952 952 826 295Notes: T refers to the sample of treated households, C control households, CTN control households in treated clusters, TN households in treated clusters (including both treated and
control households) and CN households in control clusters (all are control households). The symbol * indicates that the variable is created using only the sample from the pre-election visit. Variables are defined in Table A1 in the Appendix.

Woman Characteristics by Treatment StatusTreatment vs
control households
Treatment 1 vs control
households
Treatment 2 vs control
householdsTreated clusters
vs control clusters
Treated households only
vs control clusters
Control households in
treated clusters vs households in control clusters
Comparison: T-C T1-C T2-C TN-CN T-CN CTN-CN
(1) (2) (3) (4) (5) (6)Panel B: Woman Characteristics
Age -0.763 -0.506 -0.17 -1.410** -1.392** -1.478**[0.516] [0.539] [0.565] [0.627] [0.638] [0.700]
Woman has some schooling (1=yes) 0.008 -0.016 0.026 0.015 0.016 0.018[0.019] [0.022] [0.021] [0.031] [0.029] [0.037]
Woman is married (1=yes) -0.009 -0.023 0.018 -0.017 -0.017 -0.017[0.015] [0.017] [0.019] [0.015] [0.015] [0.022]
Number of children under 5 years old 0.087* 0.099* -0.028 0.147*** 0.150*** 0.139*[0.046] [0.054] [0.061] [0.050] [0.048] [0.083]
Woman has a NIC or CNIC (1=yes) 0.028 0.002 0.025 0.049 0.048 0.048[0.026] [0.030] [0.024] [0.035] [0.035] [0.032]
Voted last year (1=yes) (*) 0.021 -0.022 0.045* 0.036 0.036 0.036[0.023] [0.028] [0.026] [0.030] [0.030] [0.033]
Access to radio (1=yes) 0.012 0.037 -0.03 -0.014 -0.008 -0.046[0.033] [0.031] [0.034] [0.045] [0.046] [0.045]
Access to TV (1=yes) 0.022 0.044 -0.028 0.026 0.028 0.028[0.034] [0.033] [0.042] [0.053] [0.053] [0.053]
Access to cable (1=yes) -0.059 -0.036 -0.016 -0.118* -0.116* -0.116**[0.043] [0.049] [0.051] [0.066] [0.065] [0.051]
Allowed to move outside settlement (0 to 3) 0.033 0.051 -0.025 0.028 0.033 0.009[0.043] [0.035] [0.041] [0.043] [0.041] [0.046]
Woman allowed to join a NGO (1=yes) -0.004 0.016 -0.022 -0.022 -0.019 -0.031[0.026] [0.025] [0.027] [0.032] [0.033] [0.037]
MRDO membership (*) -0.004 0.035 -0.044 0.03 0.023 0.073[0.025] [0.029] [0.034] [0.036] [0.035] [0.044]
Get advice from the Pir -0.052 0.012 -0.063 -0.057 -0.062 -0.042[0.033] [0.041] [0.044] [0.048] [0.049] [0.053]
N. Obs 2637 2637 2637 2637 2304 767Notes: T refers to the sample of treated households, C control households, CTN control households in treated clusters, TN households in treated clusters (including both treated and
control households) and CN households in control clusters (all are control households). The symbol * indicates that the variable is created using only the sample from the pre-election visit. Variables are defined in Table A1 in the Appendix.

Randomization worked
– Little difference in household characteristics. Treatment households have a little more land than control households in some comparisons, but no difference in assets or housing quality
– Women in treated households are a little younger in some comparisons and have more young kids as a result and also appear to have less access to cable TV, perhaps due to their lower mobility
– In the analysis, we control for the household and woman characteristics that we lack balance on as well as the total number of women registered to vote in a polling station
– We also control for whether the woman had a national id card (NIC), which is needed to cast a ballot, since young women are also less likely to have an NIC or to have voted in the past

N. Obs Mean St. Dev Percentile 10 Percentile 50 Percentile 90
Panel A: Household Characteristics
Household size 963 10.2 5.17 5 9 16
Number of women in the household (*) 991 2.69 1.48 1 2 5
Asset Index 963 0.00 1.85 -2.03 -0.49 2.66
Total owned land (in acres) 963 2.58 7.55 0.01 0.04 7.02
Average monthly expenditure (in thousands) 963 8.80 4.71 3.00 9.00 12.50
House quality index 963 0.00 1.38 -1.62 -0.32 1.97
Distance to polling station (Km.) 991 0.42 0.94 0 0 2
Low Zaat Status 963 0.26 0.44 0 0 1
Panel B: Woman Characteristics
Age 2,637 37.76 16.09 20 35 60
Woman has formal schooling (1=Yes) 2,637 0.18 0.39 0 0 1
Woman is married (1=Yes) 2,622 0.80 0.40 0 1 1
Number of children under 5 years old 2,637 0.86 1.19 0 0 3
Woman has a National Identity Card (1=Yes) 2,637 0.70 0.46 0 1 1
Woman voted in last local level elections (1=Yes) (*) 2,735 0.70 0.46 0 1 1
Access to radio (1=Yes) 2,637 0.48 0.50 0 0 1
Access to TV (1=Yes) 2,637 0.70 0.46 0 1 1
Access to cable (1=Yes) 2,637 0.30 0.46 0 0 1
Mobility (0 to 3) 2,637 2.17 0.42 2 2 3
Woman allowed to join a vil lage organization (1=Yes) 2,637 0.73 0.44 0 1 1
Woman is a member of MRDO, an NGO in the vil lage (1=Yes) (*) 2,735 0.11 0.31 0 0 1
Woman gets advice from a religious leader or "Pir" (1=Yes) 2,479 0.64 0.48 0 1 1
Panel C: Poll ing Station Characteristics
Number of women registered in each polling station 21 433.95 196.71 195 464 656
Percentage of women with access to cable in the polling station 21 0.34 0.26 0.06 0.23 0.75
Percentage of women voting for PMLF party in the polling station 21 0.15 0.18 0 0.05 0.48
St. Dev of asset index 21 1.76 0.30 1.46 1.72 2.09
St. Dev of distance index 21 0.79 0.52 0.16 0.69 1.31
Index of Contestation (for each polling station) 21 0.37 0.18 0.18 0.43 0.43High Contestation (dummy=1 if contestation index above median) 21 0.48 0.51 0 0 1
Notes: The symbol * indicates that the variable is created using only the sample from the pre-election visit. Variables are defined in Table A1 in the Appendix.
Table 1: Summary Statistics

Regression specification-Woman Level
Average Effect• For woman i in household h in village v:
Yihv = bThv + fXihv + uv + εihv
– Yihv = Women voted (1=Yes) based on verification
– Thv = treatment indicator
– Xihv = vector of control variables
– uv = village fixed effect
• Standard errors clustered at geographic cluster level

Treatment vs control
households
Treated clusters vs
control clusters
Treated households
only vs control clusters
Control households in
treated clusters vs
households in control
clustersComparison: T-C TN-CN T-CN CTN-CN
(1) (2) (3) (4)Panel A: Treatment
Treatment (T) 0.06 0.118 0.120* 0.121*[0.045] [0.073] [0.071] [0.062]
R-squared 0.18 0.19 0.19 0.21Panel B: T1 vs T2
Importance of voting (T1) 0.034 0.095 0.094 0.109[0.052] [0.077] [0.075] [0.070]
Importance of voting & secret balloting (T2) 0.093* 0.145* 0.152** 0.135*[0.048] [0.077] [0.074] [0.079]
R-squared 0.18 0.19 0.2 0.21Observations 2637 2637 2304 767Mean dependent variable 0.59 0.59 0.58 0.56
P-value (T1 = T2) 0.22 0.31 0.23 0.75P-value (F-test for joint significance of T1 & T2) 0.15 0.16 0.11 0.15
Allowing for spillovers within clusters
Note: The dependent variable takes the value 1 if a woman reports having voted in the February 2008 elections and had a verifiable ink mark on her thumb. All specifications include vil lage fixed effects and woman, household and poll ing station level controls. Standard errors (reported in brackets below the coeffi cient) are corrected for clustering within geographic clusters. Significantly different from zero at 99 (***), 95 (**), and 90 (*) percent confidence.
Table 3: Average Effect of the Information Campaign on Turnout

20
75m 100m 200m(1) (2) (3)
Panel A: TreatmentTreatment (T) 0.127* 0.158** 0.131*
[0.065] [0.074] [0.078]Number of households within radius 0.005 0.005* 0.003*
[0.004] [0.003] [0.002]R-squared 0.2 0.21 0.21Panel B: T1 vs T2
Importance of voting (T1) 0.103 0.137* 0.112
[0.070] [0.079] [0.082]Importance of voting & secret balloting (T2) 0.156** 0.183** 0.155*
[0.067] [0.075] [0.079]Number of households within radius 0.005 0.005 0.003*
[0.004] [0.003] [0.002]R-squared 0.2 0.21 0.21
Observations 2207 2128 2049Mean dependent variable 0.58 0.58 0.58
P-value (T1 = T2) 0.25 0.31 0.33P-value (F-test for joint significance of T1 & T2) 0.06 0.05 0.14Note: The dependent variable takes the value 1 if a woman reports having voted in the February 2008 elections and had a verifiable ink mark on her thumb. In each specification, women in control households located within the indicated radius of a treated household are dropped from the sample. All specifications include vil lage fixed effects and woman, household and polling station level controls. Standard errors (reported in brackets below the coeffi cient) are corrected for clustering within geographic clusters. Significantly different from zero at 99 (***), 95 (**), and 90 (*) percent
Table 4: Spillover Effects via Distance I

Regression Specification-Peer effects-II• Similar to Kremer and Miguel (2004). For woman i in
household h in village v:
Yihv = bThv + ∑dD (gdD NTdD + kdD NdD ) + fXihv + uv + εihv
– Yihv = Women voted (1=Yes) based on verification– Thv = treatment indicator– NTdD = number of treated households between distance d and D
from household– NdD = number of households between distance d and D from
household– Xihv = vector of control variables– uv = village fixed effect
• Standard errors clustered at geographic cluster level

22
Treatment (T) 0.027[0.031]
Number of treated households within 0-200 radius 0.017***[0.004]
Number of treated households within 200-400 radius 0.022***[0.004]
Number of treated households within 400-600 radius 0.017***[0.005]
Number of treated households within 600-800 radius 0.008[0.006]
Number of treated households within 800-1000 radius 0.008[0.008]
Number of treated households within 1000-1,200 radius 0.004[0.007]
Number of households within 0-200 radius -0.008***[0.003]
Number of households within 200-400 radius -0.012***[0.003]
Number of households within 400-600 radius -0.013***[0.004]
Number of households within 600-800 radius -0.004[0.004]
Number of households within 800-1000 radius -0.008[0.005]
Number of households within 1000-1,200 radius 0.001
R-squared 0.23Mean dependent variable 0.59Observations 2637
Table 5: Spillover Effects via Distance II

Table 6: Spillover Effects via Friendship
23
Friends of Women in Treated Clusters
vs. Friends of Women in Control
Clusters
Friends of Treated Women in Treated
Clusters vs. Friends of Women in
Control Clusters
Friends of Control Women in Treated
Clusters vs. Friends of Women in Control
ClustersT-C T-CN CTN-CN
Treatment 0.107 0.104 0.124*[0.078] [0.075] [0.070]
Treatment controlling for the characteristics of sample women 0.12 0.117 0.124*
[0.075] [0.071] [0.068]N. obs 797 692 245Mean dependent variable 0.6 0.6 0.58

Regression SpecificationPolling Station Level
• For polling station p in village v:
Ypv = bNTpv + fXpv + εpv
– Ypv = Number of valid votes cast by women
– NTpv = Number of women treated in polling station
– Xpv = Vector of polling station control variables, including the number of registered women


Controls in treatment
clusters assumed not
treated
Controls in treatment clusters
assumed to be treated
Controls in treatment clusters
dropped from sample
Control in treated clusters
compared to control clusters
75 Meter Radius
100 Meter Radius
200 Meter Radius
Treatment -0.026 -0.022 -0.022 -0.011 -0.011 0.012 0.019[0.024] [0.030] [0.030] [0.026] [0.032] [0.036] [0.047]
Man reporting about woman -0.066*** -0.031 -0.024 -0.048* -0.027 -0.04 -0.025[0.024] [0.024] [0.024] [0.025] [0.027] [0.034] [0.024]
Interaction between treatment & man reporting -0.043 -0.074** -0.084** -0.043 -0.082** -0.069 -0.083**
[0.030] [0.033] [0.034] [0.042] [0.038] [0.044] [0.040]Number of households within radius 0.002 0.002 0
[0.003] [0.002] [0.001]Mean dependent variable 0.91 0.91 0.91 0.94 0.07 0.08 0.07N.obs 2825 2825 2454 672 2408 2349 2289R-Sq 0.068 0.067 0.072 0.12 0.905 0.903 0.901
Geographic Spillovers Spillovers within Clusters
Table 8: Effect on Candidate Choice Using Cross Reports from Family Members

Treated clusters vs control clusters
Treated households only vs control
clusters
Control households in
treated clusters vs households in
control clustersTN-CN T-CN CTN-CN
Treatment -0.117 -0.114 -0.151[0.121] [0.116] [0.125]
Contestation I -0.615* -0.654** -0.477[0.337] [0.327] [0.313]
Treated Woman X Contestation I 0.657* 0.654* 0.732**[0.357] [0.346] [0.340]
R-Sq 0.19 0.2 0.23
Treatment -0.065 -0.058 -0.109[0.084] [0.082] [0.075]
Contestation II -1.449 -1.438 -1.445[1.146] [1.110] [1.135]
Treated Woman X Contestation II 2.102* 2.058* 2.285**[1.125] [1.090] [0.995]
R-Sq 0.22 0.23 0.25Mean Dependent Variable 0.59 0.58 0.56N.obs 2637 2304 767Note: Significantly different from zero at 99 (***), 95 (**), and 90 (*) percent confidence. Robust standard errors in parentheses are clustered at the geographic cluster level.
Spillovers within Clusters
Panel A: Herfindahl for the Share of Votes Obtained by the Major Political Parties (Contestation I)
Panel B: Share of Votes Obtained by PML-F (Contestation II)
Table 9: Contestation and Information

Summing up• Substantial peer effects
– Accounting for spillovers, the information campaign increased turnout among sample women by about 12 % (little more than an additional female vote for every 10 women (or about 4 households treated)
– The polling station level effects are much larger. For every 10 women treated, there are almost 7 additional votes
• Information campaigns appear to be an effective way of reaching poor rural women– I additional vote cost about 103 Rs. (or 1.51 US$)
– Some evidence that voting is habit forming, so sustained impacts from a single intervention are plausible
• Information campaigns can affect not just turnout but also independence in candidate choice
– Men in treated households have significantly less knowledge about women’s candidate choice
• Information on electoral rights may be more valuable where differences in preferences over candidates are larger – The information campaign increased turnout in more contested areas, and in areas
where PML-F had a significant vote share, although both tended to depress turnout among sample women

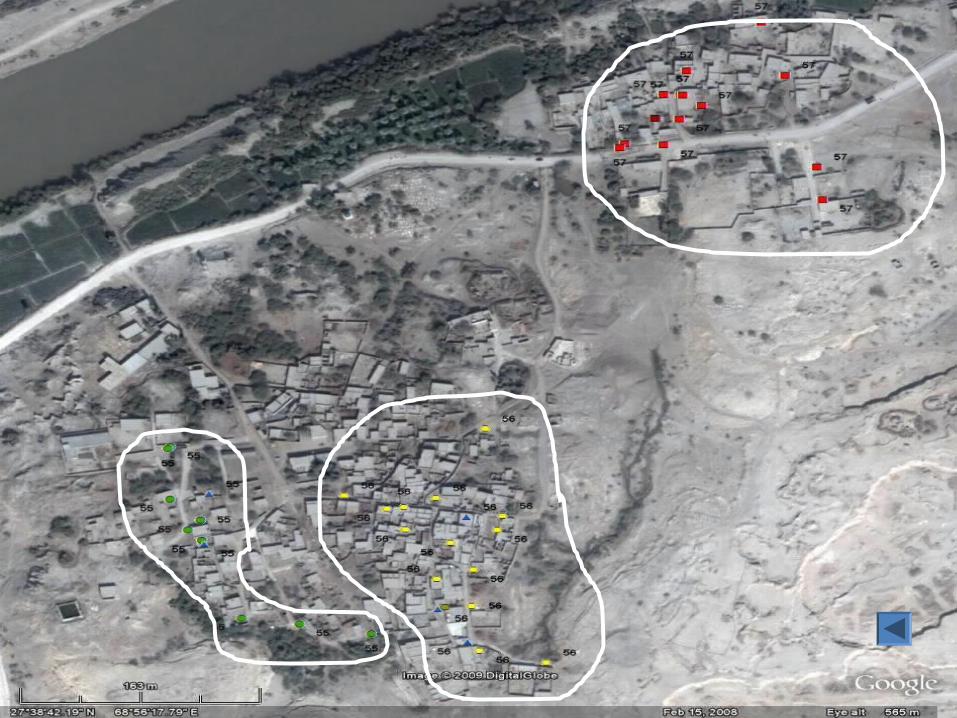
Typical village

Typical street

Communication is easy …

Communication is easy …


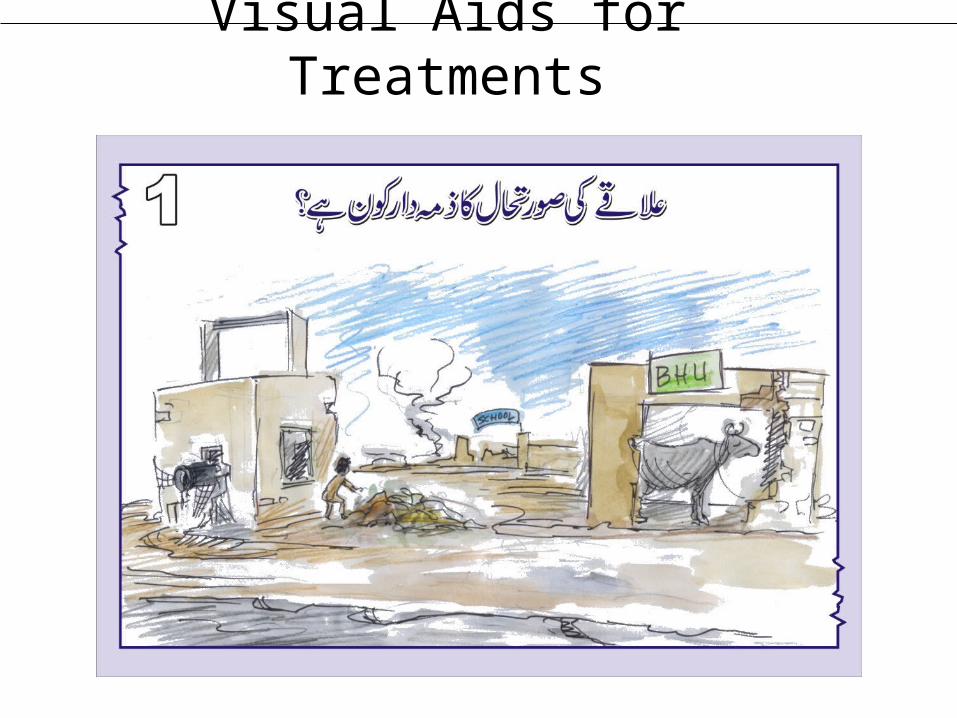
Visual Aids for Treatments

Visual Aids for Presentation

Visual Aids for Presentation

Visual Aids for Presentation

Visual Aids for Presentation
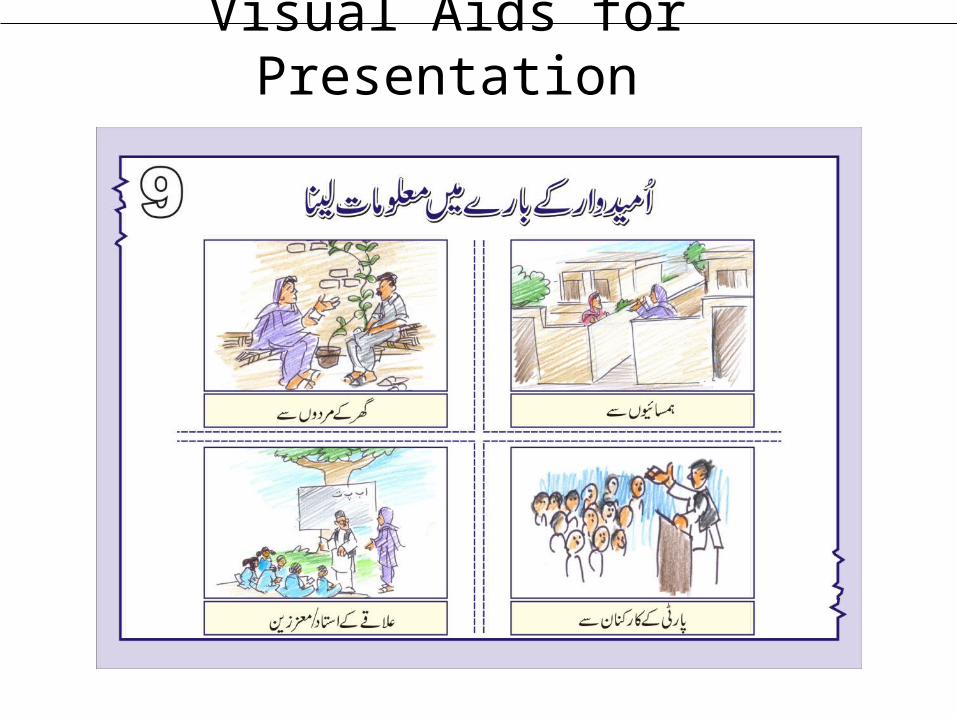
Visual Aids for Presentation

Visual Aids for Presentation – Secrecy of Ballot

Visual Aids for Presentation

Visual Aids for Presentation
Visual Aids for Presentation

Appendix Tables
46

Table A2: Intervention check
47
N. Obs All T T1 # of obsT2
C with at least 1 T within
75m # of obs
C with at least 1 T within 100m
C with no T within
75m # of obs
C with no T within
100m1 2 3 4 5 6 7 8 9
Visit before elections (1=Yes) 2505 0.71 1.00 1.00 1.00 0.00 0.00 0.00 0.00Neighbors joined during visit (1=Yes) 1862 0.11 0.11 0.08 0.15 0.10 0.10 0.00 0.00Talked about visit (1=Yes) 1792 0.41 0.41 0.35 0.50 0.00 0.00 0.00 0.00Neighbor talked to woman (1=Yes) 2505 0.44 0.55 0.50 0.62 0.29 0.25 0.04 0.03Presentation increased willingness to vote (1=Yes)1927 0.69 0.69 0.69 0.67 0.00 0.00 0.00 0.00Presentation changed opinion about whom to vote (1=Yes)1930 0.36 0.36 0.33 0.41 0.00 0.00 0.00 0.00Issues raised
Importance of voting 1867 0.64 0.64 0.98 0.19 0.58 0.58 0.20 0.00Importance of secret voting 1867 0.06 0.06 0.02 0.12 0.04 0.04 0.00 0.00Both 1867 0.30 0.30 0.01 0.69 0.38 0.38 0.80 1.00

48
N. Obs Mean Dependant Variable P-valueFemale Male
Access to Radio 1923 0.469 0.417 0.061Number of hours of radio listened to in an average 852 9.739 9.633 0.867Access to TV 1923 0.668 0.629 0.103Number of hours of TV watched in an average week 1222 15.294 11.033 0.000Access to cable TV 1951 0.289 0.224 0.004Listen to BBC for world news 847 0.095 0.483 0.000Watch cable TV channels for national news 492 0.19 0.272 0.095Note: P-values are from regressions with standard errors clustered at the geographic cluster level.
Table A3: Gender Differences in Radio and TV Access and Exposure to News

49
Table A4: Gender Differences in Knowledge about Current Political Issues and the Results of the Election
N. Obs P-value
Respondent… Female Male
Does not know the meaning of democracy 1923 0.972 0.694 01951 0.058 0.822 0
Able to identify political party signs correctly (proportion identifed-national assembly) 1951 0.283 0.406 0Able to identify political party names correctly (proportion identifed-national assembly) 1951 0.858 0.934 0Able to identify political party signs correctly (proportion identifed-provincial assembly) 1951 0.28 0.412 0Able to identify political party names correctly (proportion identifed-provincial assembly) 1951 0.849 0.929 0
Knows the gender of main candidates (national assembly) 1951 0.948 0.957 0.483Recalled the names of the candidates correctly (proportion identified-national assembly) 1951 0.823 0.84 0.488Knows the gender of main candidates (provincial assembly) 1951 0.952 0.951 0.967Recalled the names of the candidates correctly (proportion identified-provincial assembly) 1951 0.818 0.836 0.519
Able to recall the winning party (national assembly) 1951 0.964 0.944 0.093Able to recall the winning candidate (national assembly) 1951 0.902 0.924 0.219Able to recall the winning party (provincial assembly) 1951 0.96 0.949 0.318Able to recall the winning candidate (provincial assembly) 1951 0.909 0.934 0.119Note: P-va lues are from regress ions with s tandard errors clustered at the geographic cluster level .
Mean Dependant Variable
Was aware of the imposition of emergency and the position of parties position on the removal of judges

50
Table A5: Gender Differences in Participation in Village Political and Social Events
N. Obs P-valueFemale Male
Attend community meetings 1921 0.179 0.52 0.000Get together to raise issues 1921 0.243 0.506 0.000Attend demonstrations 1921 0.121 0.233 0.000Take action
to rectify election offi cial missing name in voter list 1921 0.762 0.924 0.000if police arrest family member wrongly 1921 0.929 0.98 0.000
if someone seized family land 1921 0.924 0.982 0.000
Index of community action taken 1921 -0.292 0.686 0.000
Contact local councilor 1921 0.252 0.372 0.000Contact a local political party offi cial 1921 0.224 0.378 0.000
Index of contacting formal authority 1921 -0.102 0.336 0.000
Contact religious leader 1921 0.66 0.49 0.000Contact traditional ruler 1921 0.445 0.32 0.000
Index of contacting informal authority 1921 0.124 -0.303 0.000
Mean Dependant Variable
Note: p va lues were ca lculated from regress ions that were clustered at the neighborhood level .

(1) (2) (3) (4)Number of Treated Women 0 0 0 0
[0.001] [0.001] [0.001] [0.001]Percentage of Women with Access to Cable TV 0.211 -0.114
[0.146] [0.177]SD of Asset Index 0.268* 0.176
[0.127] [0.155]SD of Distance to the Polling Station 0.141* 0.009
[0.073] [0.089]Number of Women Registered to Vote 0 0 0 0
[0.000] [0.000] [0.000] [0.000]Constant 0.327*** -0.329 0.051 -0.217
[0.111] [0.255] [0.109] [0.310]Observations 21 21 21 21R-squared 0.01 0.38 0.04 0.18
Contestation-I Contestation-II
Note: The dependent variable is the Herfindahl on the share of votes obtained by the two major political parties, in the first two specifications; and is the share of votes obtained by PML-F in the last two specifications. Significantly different from zero at 99 (***), 95 (**), and 90 (*) percent confidence. Robust standard errors in parentheses.
Table A6: Treatment Check for Measures of Political Contestation at the Polling Station Level

52
All Low contestationHigh contestation
Panel A: Polling Station TurnoutTotal votes cast 4501 2051 2450As percentage of registered voters 76.6 88.2 68.7
For PPP 66.4 81.8 53.6For PML 32.1 17.1 44.7Others 1.4 1.1 1.7
Panel B: Sample TurnoutTotal votes cast 1543 831 712As percentage of women with NIC 92.0 98.8 85.1As a percentage of women with NIC 84.0 89.0 78.8
For PPP 73.68 91.53 57.34For PML 26.23 8.47 42.5Note: Sample turnout rates (in Panel B) are calculated over women who could be verified as having voted.
Table A7: Contestation and Voter Turnout

53
Percentage of women who… T C p-value T C p-value T C p-value
Voted for the same party as head 44.7 44.3 0.92 46.9 44.3 0.73 42.7 44.3 0.91Voted for different party from head 10.1 5.1 0.01*** 14.8 8.0 0.01*** 6.0 2.9 0.13Voted but head did not 6.1 5.0 0.62 8.2 6.5 0.65 4.3 3.9 0.81Did not vote 38.6 45.1 0.07* 29.6 41.2 0.03** 46.4 47.9 0.56
TN CN p-value TN CN p-value TN CN p-value
Voted for the same party as head 45.1 41.7 0.37 47.6 38.1 0.04** 42.9 44.2 0.86Voted for different party from head 9.8 2.8 0.01*** 14.3 5.1 0.02** 5.9 1.2 0.02**Voted but head did not 6.2 3.7 0.19 8.4 4.0 0.25 4.3 3.5 0.81Did not vote 38.4 50.9 0.01*** 29.3 52.8 0.00*** 46.3 49.6 0.33
T CN p-value T CN p-value T CN p-value
Voted for the same party as head 44.6 41.7 0.5 46.9 38.1 0.07* 42.7 44.2 0.87Voted for different party from head 10.1 2.8 0.01*** 14.8 5.1 0.01*** 6 1.2 0.03**Voted but head did not 6.1 3.7 0.22 8.2 4 0.09* 4.3 3.5 0.98Did not vote 38.6 50.9 0.01*** 29.6 52.9 0.00*** 46.4 49.6 0.32
CTN CN p-value CTN CN p-value CTN CN p-value
Voted for the same party as head 47.8 41.7 0.08* 51.7 45.4 0.23 44.6 43 0.63Voted for different party from head 8.1 2.8 0.14 11.4 13.2 0.45 5.4 5 0.98Voted but head did not 6.6 3.7 0.16 9.4 7.5 0.66 4.4 4.1 0.55Did not vote 37.5 50.9 0.00*** 27.5 33.5 0.09* 45.7 47 0.62Note: P-values are from regressions with vil lage fixed effects, woman characteristics as controls and robust standard errors clustered at the geographic cluster level. Significantly different from zero at 99 (***), 95 (**), and 90 (*) percent confidence.
All High Contestation Low Contestation
Table A8: Impact of Contestation on Women's Participation and Candidate Choice
54
Election was Fair
Village Environment
was Safe
Woman Witnessed/Heard Acts of Violence
In/Near the VillageElection was
Fair
Village Environment
was Safe
Woman Witnessed/Heard Acts of Violence
In/Near the Village(1) (2) (3) (4) (5) (6)
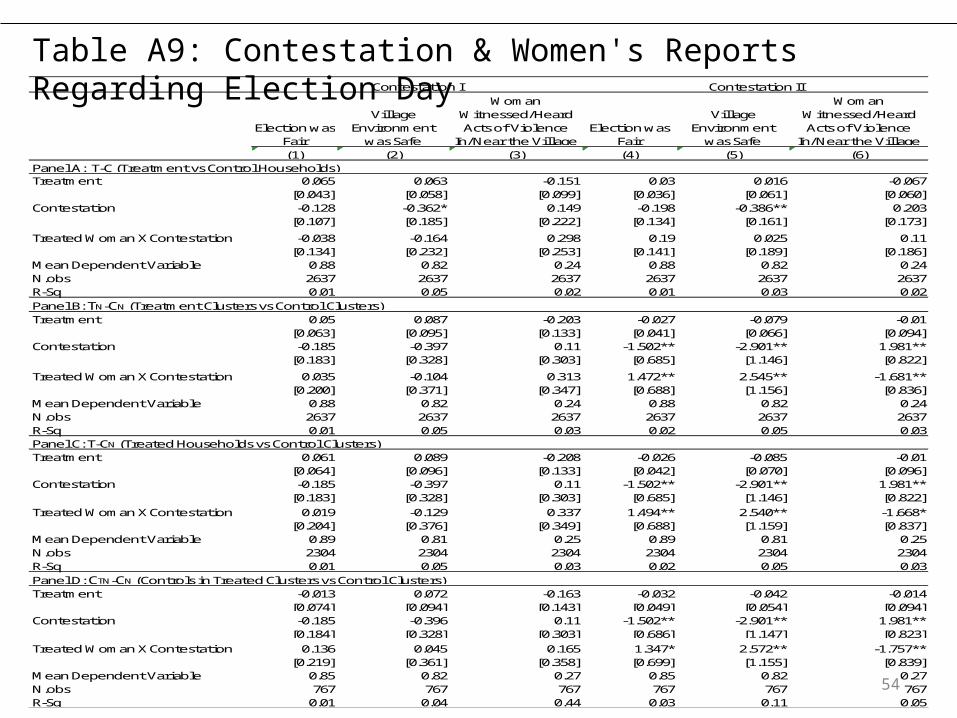
Treatment 0.065 0.063 -0.151 0.03 0.016 -0.067[0.043] [0.058] [0.099] [0.036] [0.061] [0.060]
Contestation -0.128 -0.362* 0.149 -0.198 -0.386** 0.203[0.107] [0.185] [0.222] [0.134] [0.161] [0.173]
Treated Woman X Contestation -0.038 -0.164 0.298 0.19 0.025 0.11[0.134] [0.232] [0.253] [0.141] [0.189] [0.186]
Mean Dependent Variable 0.88 0.82 0.24 0.88 0.82 0.24N.obs 2637 2637 2637 2637 2637 2637R-Sq 0.01 0.05 0.02 0.01 0.03 0.02Panel B: TN-CN (Treatment Clusters vs Control Clusters)Treatment 0.05 0.087 -0.203 -0.027 -0.079 -0.01
[0.063] [0.095] [0.133] [0.041] [0.066] [0.094]Contestation -0.185 -0.397 0.11 -1.502** -2.901** 1.981**
[0.183] [0.328] [0.303] [0.685] [1.146] [0.822]
Treated Woman X Contestation 0.035 -0.104 0.313 1.472** 2.545** -1.681**[0.200] [0.371] [0.347] [0.688] [1.156] [0.836]
Mean Dependent Variable 0.88 0.82 0.24 0.88 0.82 0.24N.obs 2637 2637 2637 2637 2637 2637R-Sq 0.01 0.05 0.03 0.02 0.05 0.03
Treatment 0.061 0.089 -0.208 -0.026 -0.085 -0.01[0.064] [0.096] [0.133] [0.042] [0.070] [0.096]
Contestation -0.185 -0.397 0.11 -1.502** -2.901** 1.981**[0.183] [0.328] [0.303] [0.685] [1.146] [0.822]
Treated Woman X Contestation 0.019 -0.129 0.337 1.494** 2.540** -1.668*[0.204] [0.376] [0.349] [0.688] [1.159] [0.837]
Mean Dependent Variable 0.89 0.81 0.25 0.89 0.81 0.25N.obs 2304 2304 2304 2304 2304 2304R-Sq 0.01 0.05 0.03 0.02 0.05 0.03
Treatment -0.013 0.072 -0.163 -0.032 -0.042 -0.014[0.074] [0.094] [0.143] [0.049] [0.054] [0.094]
Contestation -0.185 -0.396 0.11 -1.502** -2.901** 1.981**[0.184] [0.328] [0.303] [0.686] [1.147] [0.823]
Treated Woman X Contestation 0.136 0.045 0.165 1.347* 2.572** -1.757**[0.219] [0.361] [0.358] [0.699] [1.155] [0.839]
Mean Dependent Variable 0.85 0.82 0.27 0.85 0.82 0.27N.obs 767 767 767 767 767 767R-Sq 0.01 0.04 0.44 0.03 0.11 0.05
Contestation I Contestation II
Panel A: T-C (Treatment vs Control Households)
Panel C: T-CN (Treated Households vs Control Clusters)
Panel D: CTN-CN (Controls in Treated Clusters vs Control Clusters)
Table A9: Contestation & Women's Reports Regarding Election Day

55
Panel A: Treatment vs Control Households T C p-value T C p-value T C p-value
Self reports voting but verified as not voted 27.16 28.81 0.48 24.22 31.58 0.24 30.48 26.52 0.77Self reports not voting but verified as voted 38.62 37.46 0.29 32.05 28.89 0.04** 42.27 42.92 0.84
Panel B: Treatment Clusters vs Control Clusters TN CN p-value TN CN p-value TN CN p-valueSelf reports voting but verified as not voted 26.61 33.96 0.21 23.64 46.34 0.04** 29.94 26.15 0.84Self reports not voting but verified as voted 38 39.19 0.30 32 27.66 0.003*** 41.27 47.66 0.72
Panel C: Treated Households vs Control Clusters T CN p-value T CN p-value T CN p-valueSelf reports voting but verified as not voted 27.16 33.96 0.18 24.22 46.34 0.03** 30.48 26.15 0.90Self reports not voting but verified as voted 38.62 39.19 0.32 32.05 27.66 0.006*** 42.27 47.66 0.69
All High Contestation Low Contestation
Note: P-va lues are from regress ions with vi l lage fi xed effects , woman characteri stics as controls and robust s tandard errors clustered at the geographic cluster level . Signifi cantly different from zero at 99 (***), 95 (**), and 90 (*) percent confi dence.
Table A10: Impact of treatment on women's voting report

56
Woman Characteristic (WC)Mobility
Voting History
Literacy Access to TV
(1) (2) (3) (4)Panel A: TN-CN (Treatment Clusters vs Control Clusters)
TN 0.426*** 0.017 0.085 0.056[0.123] [0.111] [0.091] [0.113]
WC 0.189*** 0.16 0.028 0.064[0.056] [0.106] [0.081] [0.075]
Interaction between TN x WC -0.161** 0.091 0.034 0.042[0.064] [0.117] [0.089] [0.086]
Mean dependent variable 0.59 0.59 0.59 0.59Observations 2637 2637 2637 2637R-squared 0.12 0.15 0.11 0.12
Panel B: T-CN (Treated Households vs Control Clusters)
Treatment excluding controls in treated neighborhoods 0.399*** 0.021 0.086 0.054
[0.122] [0.110] [0.089] [0.111]Variable 0.187*** 0.162 0.019 0.062
[0.055] [0.105] [0.079] [0.071]Interaction (Treatment excluding contaminated controls x Variable) -0.148** 0.086 0.034 0.045
[0.064] [0.117] [0.088] [0.084]Mean dependent variable 0.58 0.58 0.58 0.58Observations 2304 2304 2304 2304R-squared 0.13 0.15 0.12 0.12
Controls in treatment neighborhood 0.153*** -0.016 0.093 0.063[0.053] [0.098] [0.066] [0.087]
Variable 0.470*** 0.186* 0.034 0.065[0.150] [0.099] [0.057] [0.052]
Interaction (Controls in treated neighborhood x Variable) -0.173** 0.164 0.1 0.062
[0.077] [0.123] [0.102] [0.092]Mean dependent variable 0.56 0.56 0.56 0.56Observations 767 767 767 767R-squared 0.17 0.19 0.15 0.15
Panel c: CTN-CN (Controls in Treated Clusters vs Control Clusters)
Table A11: Effect of the Information Campaign by Woman Characteristics

57
N. Obs
Female knowledge
index
Female opinion
index
Woman checked voter list after intervention
Woman expresses
political opinion
Woman thinks election was
fair
Treatment vs control households (T-C) 2637 0.024 0.174** 0.033 0.027 0.057**[0.059] [0.085] [0.024] [0.020] [0.025]
Treated clusters vs control clusters (TN-CN) 2637 0.005 0.203** 0.051* 0.005 0.070**[0.072] [0.092] [0.030] [0.025] [0.034]
Treated households only vs control clusters (T-CN) 2304 0.012 0.212** 0.053* 0.011 0.075**
[0.070] [0.097] [0.031] [0.024] [0.033]Control households in treated clusters vs
households in control clusters 767 -0.025 0.167 0.048 -0.036 0.06[0.094] [0.116] [0.035] [0.036] [0.037]
Mean dependent variable (CTN-CN) 0 0 0.61 0.23 0.88
Table A12: Effect of the Information Campaign on Behavior