Embed Size (px)
Citation preview
Proceedings World Geothermal Congress 2015
Melbourne, Australia, 19-25 April 2015
1
TOMO4D: Temporal Changes in Reservoir Structure at Geothermal Areas
Bruce R. Julian1, Gillian R. Foulger
1, Andrew Sabin
2, Najwa Mhana
1
1Dept. Earth Sciences, Durham University, Durham, U.K.
2Geothermal Program Office, China Lake, CA 93555
[email protected], [email protected], [email protected], [email protected]
Keywords: MEQs, seismology, tomography, structure, evolution
ABSTRACT
Temporal changes in seismic wave speeds in the Earth’s crust have been observed at The Geysers and the Coso geothermal areas,
California, using three-dimensional local-earthquake tomography repeated on a year-to-year basis. These results are based on
comparing models derived by inverting data for different epochs independently, and assuming that any differences found represent
true temporal variations in structure. Such an assumption can be unsafe, however, because variations in the seismic ray distribution
from experiment to experiment could cause tomographic models to vary even in the absence of structural changes. This problem
can be particularly serious where changes in the distribution of earthquakes are systematic, e.g., if earthquake locations are radically
different from one epoch to another.
The strong, persistent, and systematic changes in structure derived for the geothermal reservoir at The Geysers using conventional
repeat tomography are probably real (Gunasekera, R. C., Foulger, G. R. and Julian, B. R., Four dimensional tomography shows
progressive pore-fluid depletion at The Geysers geothermal area, California. J. Geophys. Res. 108, 2003). In contrast, changes at
the Coso geothermal area are subtle, and require confirmation. To that end, we developed a new tomography program, tomo4d, that
inverts multiple data sets simultaneously (Julian, B. R. and Foulger, G. R. Time-dependent tomography. Geophys. J. Int. 182,
1327–1338, 2010), imposing constraints to minimize the structural differences calculated for different epochs. This approach is
similar to that of seeking models similar to some a priori initial assumption, and it can be solved using a method similar to damped
least squares.
In the first applications of this method to real data, we applied tomo4d to data from Long Valley caldera and the Coso geothermal
area, both in California. Long Valley caldera has a recent history of volcanic and seismic unrest, and independent tomographic
inversions for 1997 and 2009/10 show considerable differences, especially in Vp/Vs. For the Coso geothermal area, independent
inversions are now available for most years from 1996 to 2012. These inversions show more subtle changes from year to year. We
will present the results from tomo4d, compare them with those from the conventional tomography, and interpret the structural
changes in terms of evolving reservoir properties.
1. INTRODUCTION
A variety of natural and anthropogenic processes can cause seismic wave speeds in the crust to vary with time. The processes of
most relevance to geothermal areas include variations in groundwater hydrology (Sens-Schönfelder and Wegler, 2006), stress
changes caused by deformation resulting from volcanic unrest (Nishimura et al., 2000), the migration of magmatic fluids (Foulger
et al., 2003), drying of clay minerals caused by geothermal exploitation (Boitnott and Boyd, 1996), CO2 flooding of hydrocarbon
reservoirs (Wang et al., 1998; Daley et al., 2007), and pore-pressure decreases in exploited geothermal reservoirs (Julian et al.,
1998; Gunasekera et al., 2003). Such observations of temporal variations of wave speeds are important to geothermal-reservoir
exploitation, oil- and gas-reservoir assessment, and CO2 sequestration, since they can be used to monitor changes in fluid content
on a reservoir-wide scale.
Technical advances, particularly the increasing spatial density of seismometer networks and the transition from analogue to digital
recording, have made possible a broader range of analysis techniques and have increased by more than an order of magnitude the
sensitivity with which wave-speed changes can be detected. In this experimental environment, the best technique to achieve high
spatial resolution of structure, and structural change, is local-source seismic tomography.
Tomographic investigations of temporal changes in Earth structure have until now been conducted using conventional tomography
programs such as those of the SIMUL family (Thurber, 1983; Evans et al., 1994) to invert seismic-wave arrival-time data sets for
different time-periods (epochs) separately. The results are then compared, and it is assumed that differences in the resulting models
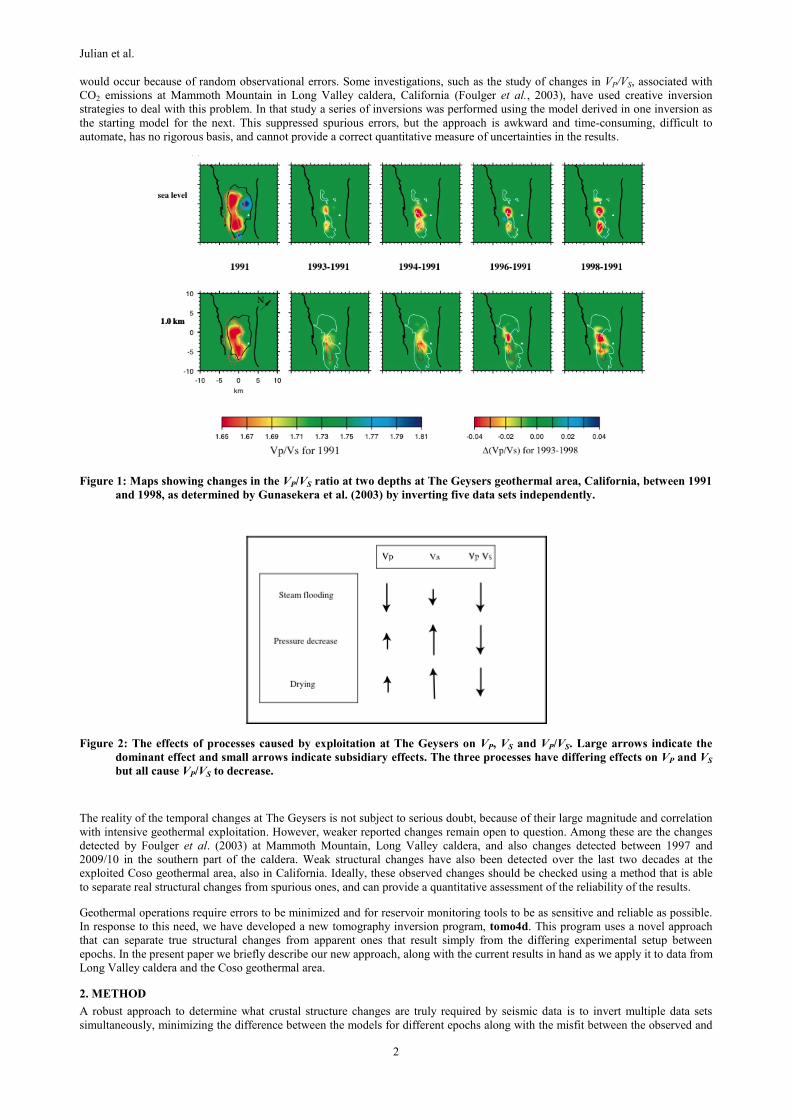
arise from real temporal variations. Foulger et al. (1997) and Gunasekera et al. (2003) applied this method to data from The Geysers
geothermal area, California, and found decreases of up to ~4% in the ratio VP/VS between 1991 and 1998 (Figure 1). They showed
that the change was caused primarily by a decrease in VP. This is an expected consequence of increase in pore-fluid compressibility
caused by decreasing pressure in the reservoir. Such a decrease in pressure was known to be occurring as a result of the extraction
of large volumes of geothermal fluids for electricity generation (Figure 2). This study was remarkable in that it comprised a clear
demonstration that four-dimensional local-source seismic tomography can monitor changes in the fluid content of an exploited
geothermal reservoir as exploitation proceeds.
The assumption that differences in the results of independent tomographic inversions, from year to year, represent true temporal
variations needs to be examined. The results of tomography experiments for the same area but for different times would differ even
if the structure did not change, because of variations in the earthquake locations. Even if the source locations did not change (if
repeat explosions were used, for example) and the seismometer distribution were held fixed, differences in the derived models
Julian et al.
2
would occur because of random observational errors. Some investigations, such as the study of changes in VP/VS, associated with
CO2 emissions at Mammoth Mountain in Long Valley caldera, California (Foulger et al., 2003), have used creative inversion
strategies to deal with this problem. In that study a series of inversions was performed using the model derived in one inversion as
the starting model for the next. This suppressed spurious errors, but the approach is awkward and time-consuming, difficult to
automate, has no rigorous basis, and cannot provide a correct quantitative measure of uncertainties in the results.
Figure 1: Maps showing changes in the VP/VS ratio at two depths at The Geysers geothermal area, California, between 1991
and 1998, as determined by Gunasekera et al. (2003) by inverting five data sets independently.
Figure 2: The effects of processes caused by exploitation at The Geysers on VP, VS and VP/VS. Large arrows indicate the
dominant effect and small arrows indicate subsidiary effects. The three processes have differing effects on VP and VS
but all cause VP/VS to decrease.
The reality of the temporal changes at The Geysers is not subject to serious doubt, because of their large magnitude and correlation
with intensive geothermal exploitation. However, weaker reported changes remain open to question. Among these are the changes
detected by Foulger et al. (2003) at Mammoth Mountain, Long Valley caldera, and also changes detected between 1997 and
2009/10 in the southern part of the caldera. Weak structural changes have also been detected over the last two decades at the
exploited Coso geothermal area, also in California. Ideally, these observed changes should be checked using a method that is able
to separate real structural changes from spurious ones, and can provide a quantitative assessment of the reliability of the results.
Geothermal operations require errors to be minimized and for reservoir monitoring tools to be as sensitive and reliable as possible.
In response to this need, we have developed a new tomography inversion program, tomo4d. This program uses a novel approach
that can separate true structural changes from apparent ones that result simply from the differing experimental setup between
epochs. In the present paper we briefly describe our new approach, along with the current results in hand as we apply it to data from
Long Valley caldera and the Coso geothermal area.
2. METHOD
A robust approach to determine what crustal structure changes are truly required by seismic data is to invert multiple data sets
simultaneously, minimizing the difference between the models for different epochs along with the misfit between the observed and
Julian et al.
3
predicted arrival times. This approach is similar to seeking models consistent with an a priori assumed model, and it can be solved
using a technique similar to damped least squares (Marquardt, 1963). Solving for two models simultaneously requires determining
twice as many parameter values as when solving for a single model, however, and the simplest method may quadruple the labour
compared to solving for two epochs independently. In most cases, however, the system of normal equations for the two-epoch
problem is sparse. tomo4d takes advantage of this fact to solve the equations with little more labour than is needed to solve for
each epoch independently. Details of the programming approach are given by Julian and Foulger (2010).
tomo4d uses the azimuthal-equidistant Earth-flattening approximation of Julian et al. (2000) to map a small region of a spherical
Earth into a local Cartesian coordinate system. This contrasts with many programs which simply treat longitude and latitude as
local Cartesian coordinates x and y, an approach that is inaccurate at high latitudes or for large regions. tomo4d parameterizes
models by the values of seismic-wave slowness (the inverse of wave speed) at the nodes of a rectilinear grid, with three-
dimensional tricubic interpolation (Press et al., 2007, Section 3.6) and these are used to compute slowness values and their spatial
derivatives elsewhere. The interpolated wave slownesses (and the wave speeds) are smooth, i.e. they are continuous and have
continuous first spatial derivatives. Ray paths are computed using the bending method of Julian and Gubbins (1977). The problems
of simultaneously determining hypocenter locations and Earth structure are separated using the method of Spencer and Gubbins
(1980), which requires the solution of only P x P and 4 x 4 linear systems, where P is the number of adjustable parameters in the
model. This is much more efficient than solving the much larger unseparated system of equations.
3. TESTS WITH SYNTHETIC DATA
We tested tomo4d using synthetic data. These data simulate arrival-time measurements from earthquakes occurring during two
epochs, measured at the same seismic network. We used the seismometer distribution currently deployed at the Coso geothermal
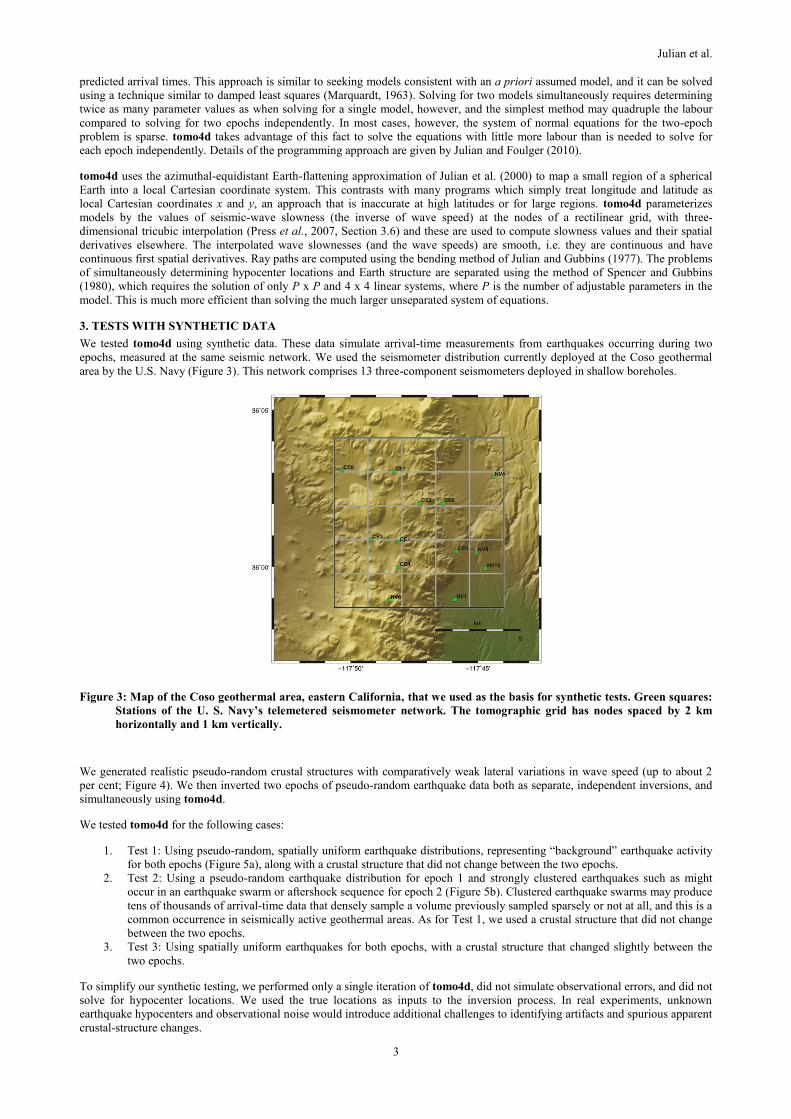
area by the U.S. Navy (Figure 3). This network comprises 13 three-component seismometers deployed in shallow boreholes.
Figure 3: Map of the Coso geothermal area, eastern California, that we used as the basis for synthetic tests. Green squares:
Stations of the U. S. Navy’s telemetered seismometer network. The tomographic grid has nodes spaced by 2 km
horizontally and 1 km vertically.
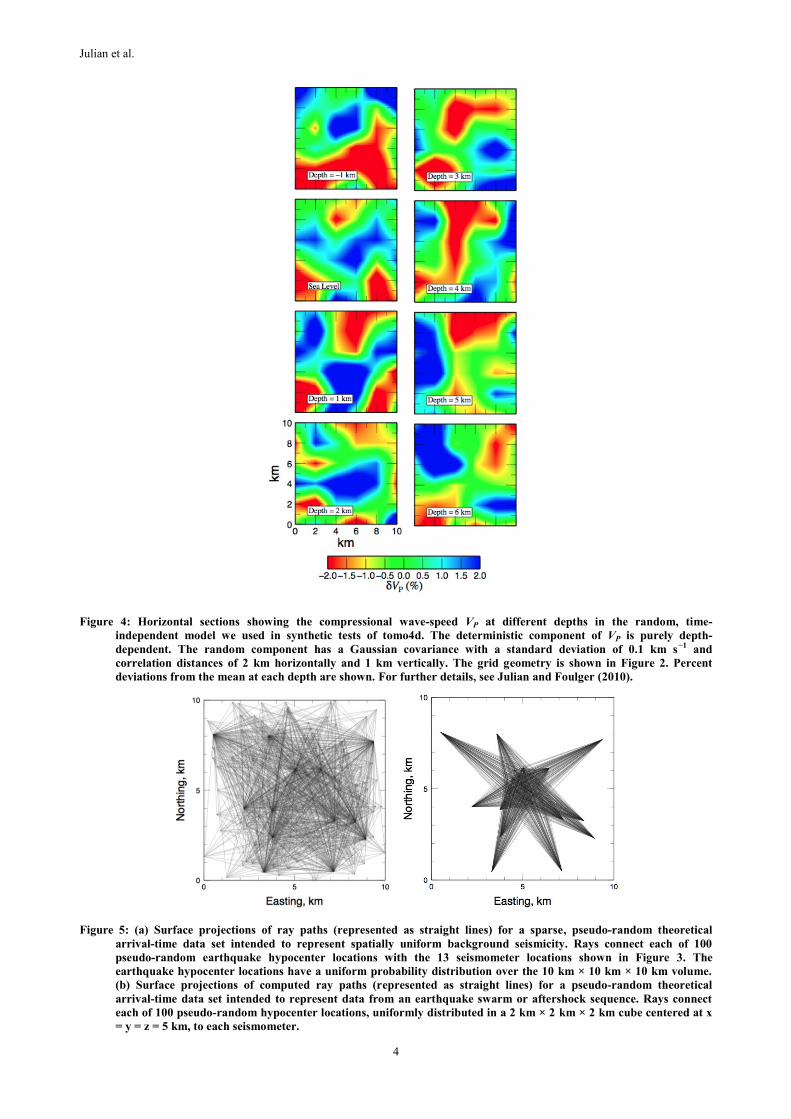
We generated realistic pseudo-random crustal structures with comparatively weak lateral variations in wave speed (up to about 2
per cent; Figure 4). We then inverted two epochs of pseudo-random earthquake data both as separate, independent inversions, and
simultaneously using tomo4d.
We tested tomo4d for the following cases:
1. Test 1: Using pseudo-random, spatially uniform earthquake distributions, representing “background” earthquake activity
for both epochs (Figure 5a), along with a crustal structure that did not change between the two epochs.
2. Test 2: Using a pseudo-random earthquake distribution for epoch 1 and strongly clustered earthquakes such as might
occur in an earthquake swarm or aftershock sequence for epoch 2 (Figure 5b). Clustered earthquake swarms may produce
tens of thousands of arrival-time data that densely sample a volume previously sampled sparsely or not at all, and this is a
common occurrence in seismically active geothermal areas. As for Test 1, we used a crustal structure that did not change
between the two epochs.
3. Test 3: Using spatially uniform earthquakes for both epochs, with a crustal structure that changed slightly between the
two epochs.
To simplify our synthetic testing, we performed only a single iteration of tomo4d, did not simulate observational errors, and did not
solve for hypocenter locations. We used the true locations as inputs to the inversion process. In real experiments, unknown
earthquake hypocenters and observational noise would introduce additional challenges to identifying artifacts and spurious apparent
crustal-structure changes.
Julian et al.
4
Figure 4: Horizontal sections showing the compressional wave-speed VP at different depths in the random, time-
independent model we used in synthetic tests of tomo4d. The deterministic component of VP is purely depth-
dependent. The random component has a Gaussian covariance with a standard deviation of 0.1 km s−1 and
correlation distances of 2 km horizontally and 1 km vertically. The grid geometry is shown in Figure 2. Percent
deviations from the mean at each depth are shown. For further details, see Julian and Foulger (2010).
Figure 5: (a) Surface projections of ray paths (represented as straight lines) for a sparse, pseudo-random theoretical
arrival-time data set intended to represent spatially uniform background seismicity. Rays connect each of 100
pseudo-random earthquake hypocenter locations with the 13 seismometer locations shown in Figure 3. The
earthquake hypocenter locations have a uniform probability distribution over the 10 km × 10 km × 10 km volume.
(b) Surface projections of computed ray paths (represented as straight lines) for a pseudo-random theoretical
arrival-time data set intended to represent data from an earthquake swarm or aftershock sequence. Rays connect
each of 100 pseudo-random hypocenter locations, uniformly distributed in a 2 km × 2 km × 2 km cube centered at x
= y = z = 5 km, to each seismometer.

Julian et al.
5
Test 1: Our inversions show large-scale anomalies, most of which correspond well to features in the original pseudo-random model
used to generate the theoretical data (Figure 4). The inevitable undersampling of the structure by rays cause some features to be
imaged poorly, as expected. The results obtained inverting the different epochs independently show many features that differ
significantly between epochs. However, when both epochs are inverted together using tomo4d to suppress differences not required
by the data, the spurious temporal changes almost entirely disappear.
Test 2: Inverting data from clustered earthquakes (Figure 5b) yielded models with significant anomalies imaged mainly near the
earthquake cluster. The models differ greatly from ones obtained from inverting uniform data. In a real situation, such differences
would risk being mistaken for strong temporal variations. Although an extreme test of tomo4d, jointly inverting this data set and
one with uniformly distributed rays successfully eliminated the spurious apparent temporal changes. The strong concentration of
rays in the neighbourhood of the earthquake cluster bias the derived model, but tomo4d successfully suppresses spurious structural
changes.
Test 3: To demonstrate that tomo4d does permit temporal variations in seismic-wave speed where required by the data, we
inverted two sets of random earthquakes using slightly different crustal models for the two epochs. The change we introduced was
subtle, amounting to no more than a 0.1 km s−1 negative VP anomaly in a 2 x 2 x 1 km region just below sea level in the northwestern
part of the model (Figure 4). As for Test 1, the difference in the sampling of the structure by the two epochs of earthquakes
produced, in the case of independent inversions, structural differences that completely obscure the real temporal change. However,
when tomo4d is used to suppress changes not required by the data, the results for the two epochs are very similar except for the
region where we had introduced changes. This provides a robust test of the efficacy of the program and shows that tomo4d is
capable of identifying very weak real signals whilst suppressing the very strong spurious signals that are produced by more
primitive inversion techniques.
4. TESTING TOMO4D USING REAL DATA
4.1 Long Valley caldera, California
Long Valley caldera is a large silicic volcano in eastern California that comprises a caldera ~ 32 x 17 km in size formed by the
catastrophic eruption of ~ 600 km3 of solid rock equivalent ~ 760,000 years ago (Bailey et al., 1976). Subsequent to the eruption, a
resurgent dome ~ 10 km in diameter and ~ 500 m high formed. This dome is surrounded by a “moat” that is filled with post-caldera
volcanics, sediments, and landslide debris.
Long Valley continues to be active, and eruptions have occurred in recent centuries. Lately, it has become very active seismically,
producing thousands of earthquakes per year, some as large as M 6 (e.g., Hill et al., 1985). This activity is thought to be linked to
volcanic unrest since considerable uplift of the surface of the resurgent dome has occurred. This is presumed to result from the
influx of material, possibly magma or gas, into the crust beneath.
The region is intensively monitored by the U.S. Geological Survey for scientific research purposes and volcanic hazard reduction.
A permanent seismometer network is operated, which is densified from time to time by temporary deployments installed by other
groups (e.g., Foulger et al., 2003). In 1989 the U.S. Geological Survey installed additional instruments to monitor seismicity
thought to be associated with the outpouring of hazardous amounts of CO2 from the perimeter of Mammoth Mountain. That feature
is a 3380-m-high, 200,000 - 500,000-year-old dacite volcano on the southwestern caldera rim (Figure 6). Those data were used to
obtain a tomographic crustal structure which was interpreted as showing a large CO2 reservoir beneath the mountain (Julian et al.,
1998).
Figure 6: Map showing the Long Valley caldera area, California. Black line is the outline of the caldera and gray circle
outlines the resurgent dome. Gray lines indicate major faults. Gray shaded regions are recently active volcanic
edifices, namely Mammoth Mountain (southmost) and the Inyo Craters to the north. Blue shaded region is Crowley
Lake. Dots are epicenters of earthquakes from 2009 - 2010, used for the tomography, colour-coded according to focal
depth. The tomography grid is outlined in black, and gridlines are shown in gray.

Julian et al.
6
In 1997 an additional 69 instruments were deployed by the U.S. Geological Survey, Durham University (U.K.) and Duke
University (U.S.A.) for a period of about four months. This huge deployment recorded thousands of earthquakes that occurred in a
period of intense seismic activity throughout the southern part of the resurgent-dome moat and Mammoth Mountain. A high-quality
tomographic model of the top ~ 4 km of the crust beneath the entire southern part of the region was calculated (Foulger et al.,
2003). In addition, the results were of sufficiently high quality that comparison could be made of the structure obtained for
Mammoth Mountain from 1989.
The data from both 1997 and 1989 were processed using the program simulps12 (Thurber, 1983; Evans et al., 1994) to derive
comparable tomographic models. A careful strategy was used to image only the most robust changes in structure. An average
starting model was obtained by performing a tomographic inversion of all the data simultaneously, using a low damping value. This
produced a model with a high level of detail, that fit the combined data set as well as possible. This was used as a starting model to
derive separate structures for each of 1989 and 1997. Individual inversions were conducted for each epoch separately using a high
damping value that ensured the starting model was only changed in ways that were strongly required by the data.
Differences in the results indicated structural changes in the period between 1989 and 1997. Weak changes in both VP and VS were
detected which were consistent with the migration of CO2 in the upper 2 km or so beneath Mammoth Mountain. Apparent regions
of CO2 depletion in neighbouring regions correlated with areas where surface CO2 venting was known from tree-kill areas and gas-
rich springs. Although the changes were weak, they suggested that measurable changes in structure had occurred as a result of
processes associated with the volcanic unrest. They also provided evidence that four-dimensional tomography can detect changes in
gas reservoirs beneath volcanic regions, as well as beneath exploited geothermal areas.
At the time this experiment was performed, tomo4d was not available. When tomo4d became available we renewed the Long
Valley project, acquiring more data from the area and testing the robustness of the earlier structural-change finding. We also
explored for other changes that may have accompanied the tectonic unrest that is still ongoing, in particular in the seismically active
south moat.
Using data gathered on seismometer stations of the permanent network deployed in and around Long Valley by the U.S. Geological
Survey, we selected ~ 275 well-distributed earthquakes that occurred 2009-2010 (Figure 6). We performed tomographic inversions
using simul2000, and a average starting model obtained by inverting all the available data simultaneously. Differencing the results
with those from 1997 reveals several regions of substantial structural change in the south-moat region (Figure 7). At the time of
writing, processing of the data using tomo4d is ongoing to test the robustness of these findings. We will report the final results,
along with an interpretation, at the World Geothermal Congress.
Figure 7: VP/VS structure at four depths in the interval -2 to 1 km bsl for the Long Valley caldera tomography grid shown in
Figure 6. Map features are as shown in Figure 6. (left) VP/VS structure obtained from inverting the 1997 data;
(middle) VP/VS structure obtained from inverting the 2009/10 data; (right) difference between the middle and the left
panels. Several red anomalies represent regions where differencing the independent tomographic inversions
indicates that VP/VS decreased between 1997 and 2009/10. Work underway using tomo4d will test the robustness of
this finding.

Julian et al.
7
4.2 The Coso geothermal area, California
The Coso geothermal area, southern California, lies at a right (releasing) step-over in the southern Owens Valley fault zone, and
experiences 6.5 ± 0.7 mm/year of dextral shear (Monastero et al., 2005). It is the site of a major geothermal area that has been
exploited since the 1980s to produce electric power.
The area is highly seismically active. It has been monitored by a high-quality seismometer network operated by the Geothermal
Program Office of the Naval Warfare Center at China Lake since the 1990s. The instruments are three-component, short-period
sensors deployed in shallow boreholes, and they deliver high-quality data ideal for tomographic inversions for crustal structure.
We inverted P- and S-wave arrival times from earthquakes within the geothermal area, measured on this network, for each of the
years 1996 - 2008, plus 2010 and 2012. As a preliminary step, we obtained a good-quality one-dimensional crustal model by
inverting a selection of local-earthquake arrival times using the program velest (Kissling et al., 1994). This crustal structure was
used as a starting model. The best data from all the years were then combined and inverted together for the average three-
dimensional structure using the program simul2000A (Thurber, 1983; Evans et al., 1994). In this way, an average model for the
entire time period was obtained. This was used as the starting model for separate tomographic inversions for each of the 15
individual years.
Notable differences in structure were observed from year to year. These are clearest in the top two kilometers of the area, which is
the volume from which geothermal fluids are mainly being withdrawn. The results are particularly noticeable in VP/VS (Figure 8).
Nevertheless, the changes are not entirely unidirectional with time and it cannot be ruled out that some of the differences result
from variations in experimental conditions from year to year.
Figure 8: A selection of results from independent tomographic inversions of the Coso geothermal area, California. Top two
rows of panels: VP/VS for horizontal slices at 1 km above sea level and at sea level, for the years 1996 - 2000. Bottom
two rows of panels: same as top two rows except for the years 2001 - 2005.
In order to explore further whether the observed changes are required by the data, we are applying tomo4d to select pairs of epochs.
At the time of writing, this work is ongoing. The results will be reported at the World Geothermal Congress.
4. CONCLUSIONS
Repeat seismic tomography (four-dimensional tomography) can detect and spatially resolve temporal changes in seismic-wave
speeds in the Earth’s crust. In doing so, it is capable of monitoring the geothermal reservoir evolution that accompanies ongoing
utilization. It is perhaps the only technique that can monitor the effects of geothermal fluid extraction and reinjection on a uniform,
reservoir-wide basis. The technique is thus potentially of great value as geothermal development moves forward and maximally
efficient utilization of reservoirs in varying stages of their lifetimes is needed.
The method is subject to bias caused by temporal variations in ray paths caused by changes in earthquake locations or seismometer-
network geometry. It is also affected by random observational errors in measured arrival times. These effects can produce spurious
and misleading apparent temporal changes in derived tomographic models. In practice, this limits the reliability of the results. If an
approach is used that compares independent tomographic inversions for different epochs, these problems limit the efficacy of the
method to the strongest structural changes only.
These problems can be dealt with by inverting data sets from multiple epochs simultaneously, and imposing constraints to minimize
inter-epoch differences between models. Direct application of this method requires solution of a large system of linear equations,
which is expensive in terms of both storage requirements and numerical labor. The particular structure of the equations, however,
and their sparseness, make it possible to simultaneously invert data from two epochs with about the same storage and numerical
effort as inverting the data sets independently. The algorithm for doing this is equally applicable to any linear or linearized inverse
problem, such as gravity, electrical, or magnetotelluric interpretation, in addition to seismic tomography.
Julian et al.
8
We have developed a program, tomo4d, that utilizes this approach. It has been tested extensively and successfully on synthetic
data. We are currently applying it to two real cases. The first of these cases is from Long Valley caldera, California, where four
decades of seismic and volcanic unrest have yielded excellent data for time-dependent tomography. The second case is the
intensely exploited Coso geothermal area, California, where more than two decades of high-quality seismic monitoring has
produced large data sets on a stable network and with uniform operating parameters. There, crustal-structure change is expected
from changes in the fluid content of the geothermal reservoir.
Initial tomographic studies at both Long Valley and the Coso geothermal area, comparing independent inversion results from
separate epochs, suggest that changes in crustal-structure have occurred on the timescale of a few years. tomo4d is currently being
applied to both cases to test the veracity of these changes and to assess their true strengths. The results will enable robust
interpretations to be made, and will be reported at the World Geothermal Congress.
5. REFERENCES
Bailey, R.A., Dalrymple, G.D., and Lanphere, M.A.: Volcanism, structure, and geochronology of Long Valley Caldera, Mono
County, California, J. Geophys. Res., 81, (1976), 725-744.
Boitnott, G.N., and Boyd, P.J.: Permeability, electrical impedance, and acoustic velocities on reservoir rocks from The Geysers
geothermal field, Proceedings, Twenty-first Workshop on Geothermal Reservoir Engineering, Stanford University, Stanford,
CA, 22-24 January 1996 (Year).
Daley, T.M., Solbau, R.D., Ajo-Franklin, J.B., and Benson, S.M.: Continuous active-source seismic monitoring of CO2 injection in
a brine aquifer, Geophysics, 72, (2007), A57-A61.
Evans, J.R., Eberhart-Phillips, D., and Thurber, C.H.: User's manual for SIMULPS12 for imaging VP and VP/VS, a derivative of the
Thurber tomographic inversion SIMUL3 for local earthquakes and explosions, USGS Open-File Report 94-431, pp. 142,
(1994).
Foulger, G.R., Grant, C.C., Ross, A., and Julian, B.R.: Industrially induced changes in Earth structure at The Geysers geothermal
area, California, Geophys. Res. Lett., 24, (1997), 135-137.
Foulger, G.R., Julian, B.R., Pitt, A.M., Hill, D.P., Malin, P., and Shalev, E.: Tomographic crustal structure of Long Valley caldera,
California, and evidence for the migration of CO2 between 1989 and 1997, J. Geophys. Res., 108, (2003),
10.1029/2000JB000041.
Gunasekera, R.C., Foulger, G.R., and Julian, B.R.: Four dimensional tomography shows progressive pore-fluid depletion at The
Geysers geothermal area, California, J. Geophys. Res., 108, (2003), DOI: 10.1029/2001JB000638.
Hill, D.P., Bailey, R.A., and Ryall, A.S.: Active tectonic and magmatic processes beneath Long Valley caldera, eastern California:
An overview, J. Geophys. Res., 90, (1985), 11111-11120.
Julian, B.R., and Gubbins, D.: Three-dimensional seismic ray tracing, J. Geophys., 43, (1977), 95-113.
Julian, B.R., and Foulger, G.R.: Time-dependent tomography, Geophys. J. Int., 182, (2010), 1327–1338.
Julian, B.R., Pitt, A.M., and Foulger, G.R.: Seismic image of a CO2 reservoir beneath a seismically active volcano, Geophys. J. Int.,
133, (1998), 7-10.
Julian, B.R., Evans, J.R., Pritchard, M.J., and Foulger, G.R.: A geometrical error in some versions of the ACH method of
teleseismic tomography, Bull. seismol. Soc. Am., 90, (2000), 1554-1558.
Kissling, E., Ellsworth, W.L., Eberhart-Phillips, D., and Kradolfer, U.: Initial reference models in local earthquake tomography, J.
Geophys. Res., 99, (1994), 19,635-619,646.
Marquardt, D.W.: An algorithm for least-squares estimation of nonlinear parameters, J. Soc. Ind. App. Math., 11, (1963), 431-441.
Monastero, F.C., Katzenstein, A.M., Miller, J.S., Unruh, J.R., Adams, M.C., and Richards-Dinger, K.: The Coso geothermal field:
A nascent metamorphic core complex, Bull. Geol. Soc. Am., 117, (2005), 1534-1553.
Nishimura, T., Uchida, N., Sato, H., Ohtake, M., Tanaka, S., and Hamaguchi, H.: Temporal changes of the crustal structure
associated with the M6.1 earthquake on September 3, 1998, and the volcanic activity of Mount Iwate, Japan, Geophys. Res.
Lett., 27, (2000), 269-272.
Press, W.H., Teukolsky, S.A., Vetterling, W.T., and Flannery, B.P.: Numerical Recipes - The Art of Scientific Computing, 3rd ed.,
pp. 1235, Cambridge University Press, Cambridge, (2007).
Sens-Schönfelder, C., and Wegler, U.: Passive image interferometry and seasonal variations of seismic velocities at Merapi
Volcano, Indonesia, Geophys. Res. Lett., 33, (2006), 229-236.
Spencer, C., and Gubbins, D.: Travel-time inversion for simultaneous earthquake location and velocity structure determination in
laterally varying media, Geophys. J. R. astron. Soc., 63, (1980), 95-116.
Thurber, C.H.: Earthquake locations and three-dimensional crustal structure in the Coyote Lake area, central California, J.
Geophys. Res., 88, (1983), 8226-8236.
Wang, Z., Cates, M.E., and Langen, R.T.: Seismic monitoring of CO2 flooding of a carbonate reservoir: a rock physics study,
Geophysics, 63, (1998), 1604-1617.