Embed Size (px)
Citation preview
Too Late But Profitable:
Railroads in Colombia, 1920-1950
Adolfo Meisel
María Teresa Ramírez
Juliana Jaramillo
Infrastructure, Society, Economics and Culture:
Lessons from the History of Large Technological Systems
Universidad de los AndesDecember 5, 2017
Outline
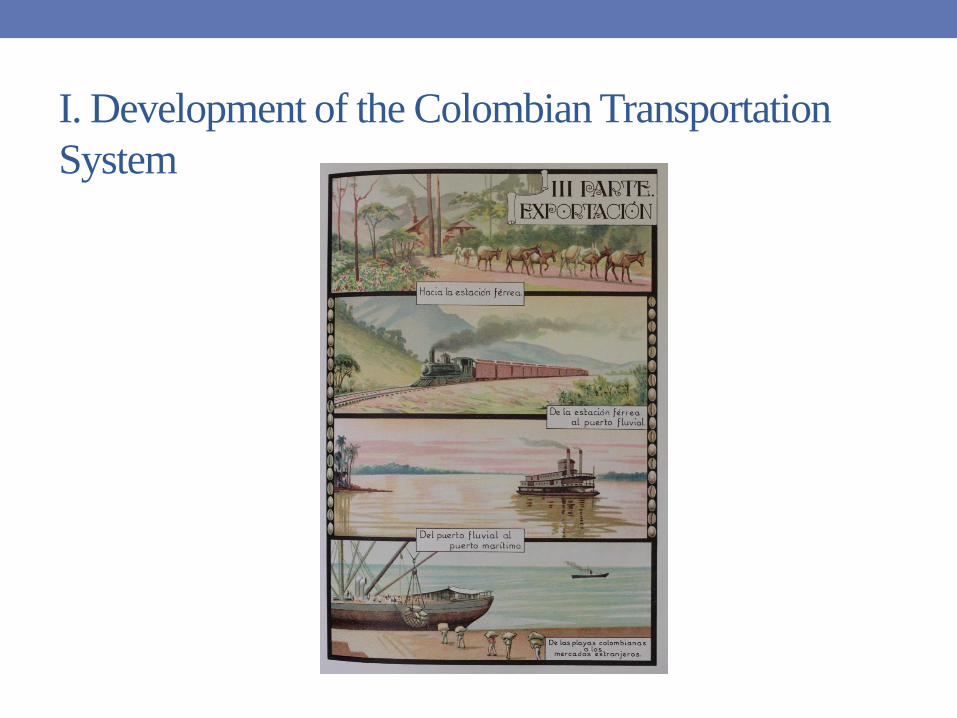
I. Development of the Colombian Transportation System
II. Dance of the Millions
III. Rates of Return, 1920-1950
IV. Conclusions
"The problem of transportation may be the most fundamental one
in the economic history of the country"
Frank Safford (2010).
I. Development of the Colombian Transportation
System
• In Colombia railroads were built rather late.
• Advances in the construction of railways was very slow:
• Topographical and geographical conditions,
• Lack of economic resources,
• Bad institutions,
• Inability of the government in establishing priorities in the
development of transport infrastructure,
• Lack of incentives for foreign capital to invest in the construction of
railways,
• Dispersion of the population (made it difficult and expensive to
improve land transportation).
• Railroads developments in Colombia started in the 1870’s, while other
Latin American countries had started much early.
• Due to financial constraints and underdeveloped capital market faced
by the country, these railroads were built under a concession system,
financed by subsidies, and with guarantees over interest on capital
investment and tax exemptions.
• This system was not successful in Colombia because of the lack of
well-defined contract terms, property right problems and unclear
regulation, which generated extra costs for the government, not only
because of higher construction costs and incomplete works, but also in
account of legal costs associated with litigations against the
contractors.
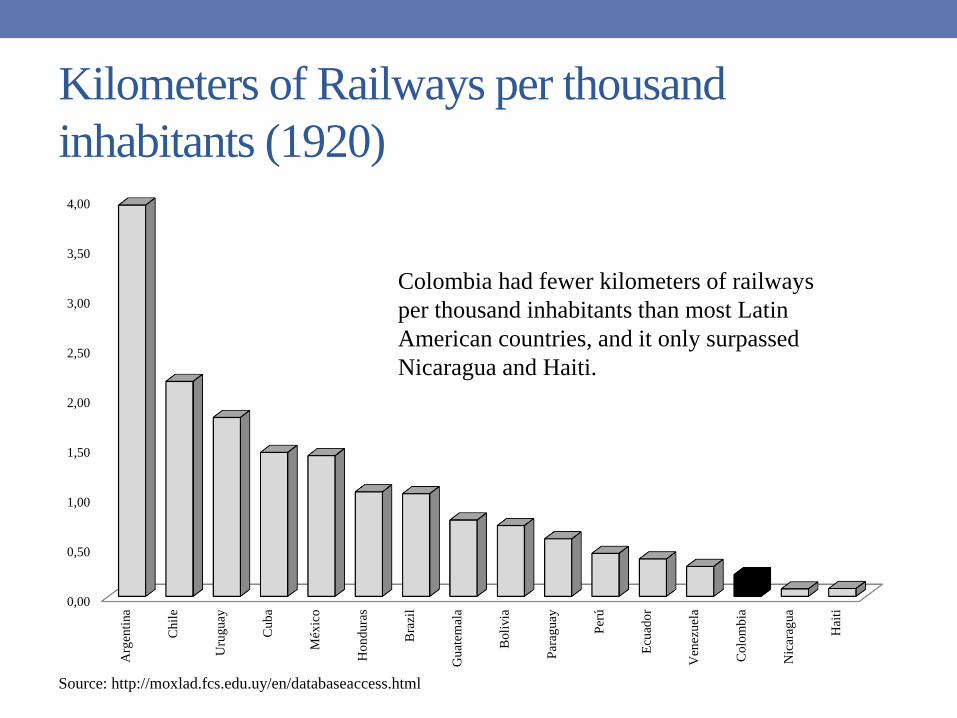
Kilometers of Railways per thousand
inhabitants (1920)
0,00
0,50
1,00
1,50
2,00
2,50
3,00
3,50
4,00
Arg
enti
na
Chil
e
Uru
gu
ay
Cub
a
Méx
ico
Ho
ndu
ras
Bra
zil
Gu
atem
ala
Boli
via
Par
aguay
Per
ú
Ecu
ado
r
Ven
ezu
ela
Colo
mb
ia
Nic
arag
ua
Hai
ti
Source: http://moxlad.fcs.edu.uy/en/databaseaccess.html
Colombia had fewer kilometers of railways
per thousand inhabitants than most Latin
American countries, and it only surpassed
Nicaragua and Haiti.
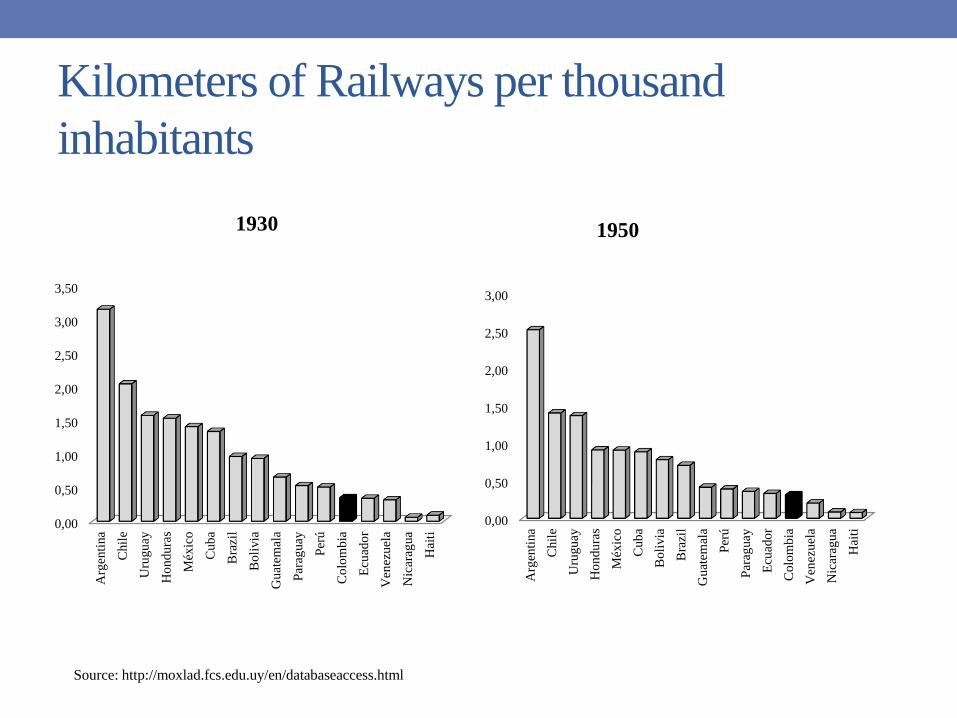
Kilometers of Railways per thousand
inhabitants
0,00
0,50
1,00
1,50
2,00
2,50
3,00
3,50
Arg
enti
na
Chil
e
Uru
gu
ay
Ho
ndu
ras
Méx
ico
Cub
a
Bra
zil
Boli
via
Gu
atem
ala
Par
aguay
Per
ú
Colo
mb
ia
Ecu
ado
r
Ven
ezu
ela
Nic
arag
ua
Hai
ti
1930
0,00
0,50
1,00
1,50
2,00
2,50
3,00
Arg
enti
na
Chil
e
Uru
gu
ay
Ho
ndu
ras
Méx
ico
Cub
a
Boli
via
Bra
zil
Gu
atem
ala
Per
ú
Par
aguay
Ecu
ado
r
Colo
mb
ia
Ven
ezu
ela
Nic
arag
ua
Hai
ti
1950
Source: http://moxlad.fcs.edu.uy/en/databaseaccess.html
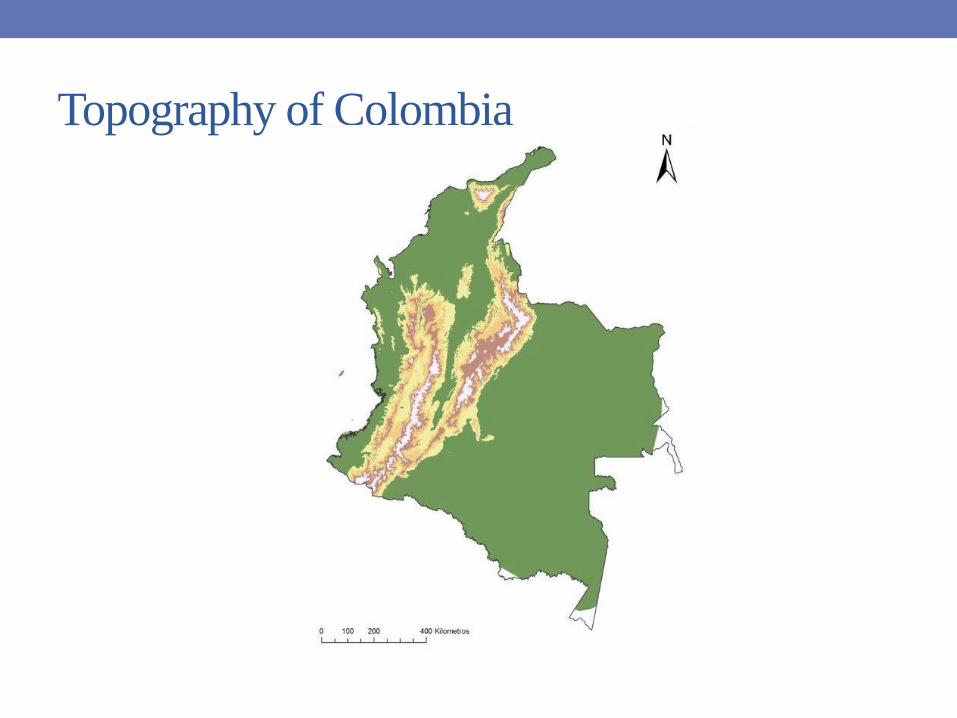
Topography of Colombia
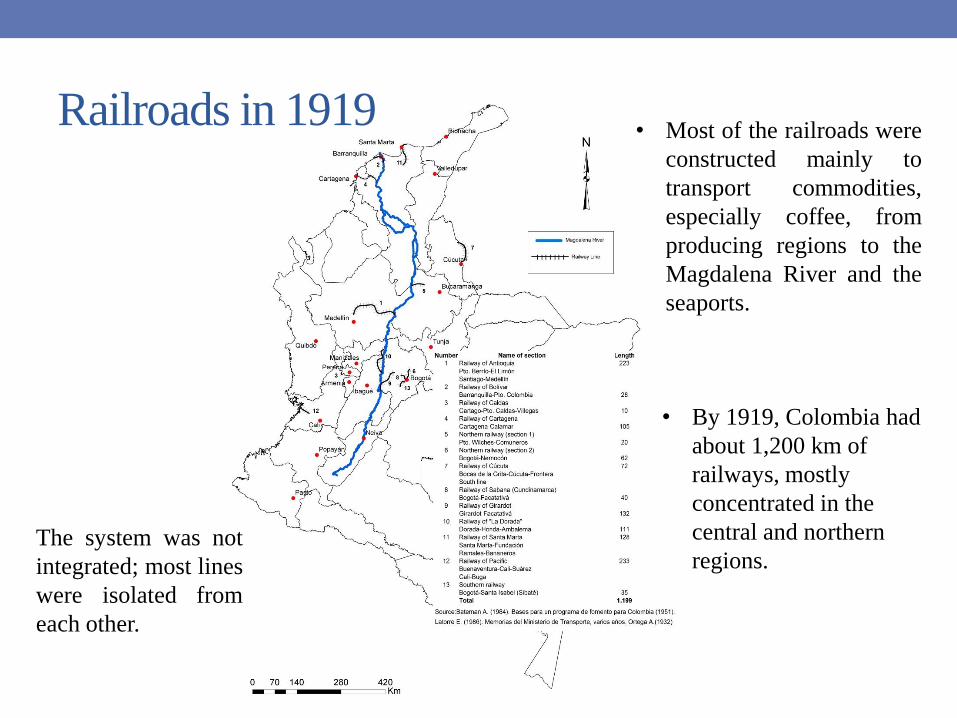
Railroads in 1919• Most of the railroads were
constructed mainly to
transport commodities,
especially coffee, from
producing regions to the
Magdalena River and the
seaports.
• By 1919, Colombia had
about 1,200 km of
railways, mostly
concentrated in the
central and northern
regions.The system was not
integrated; most lines
were isolated from
each other.
II. Dance of the Millions
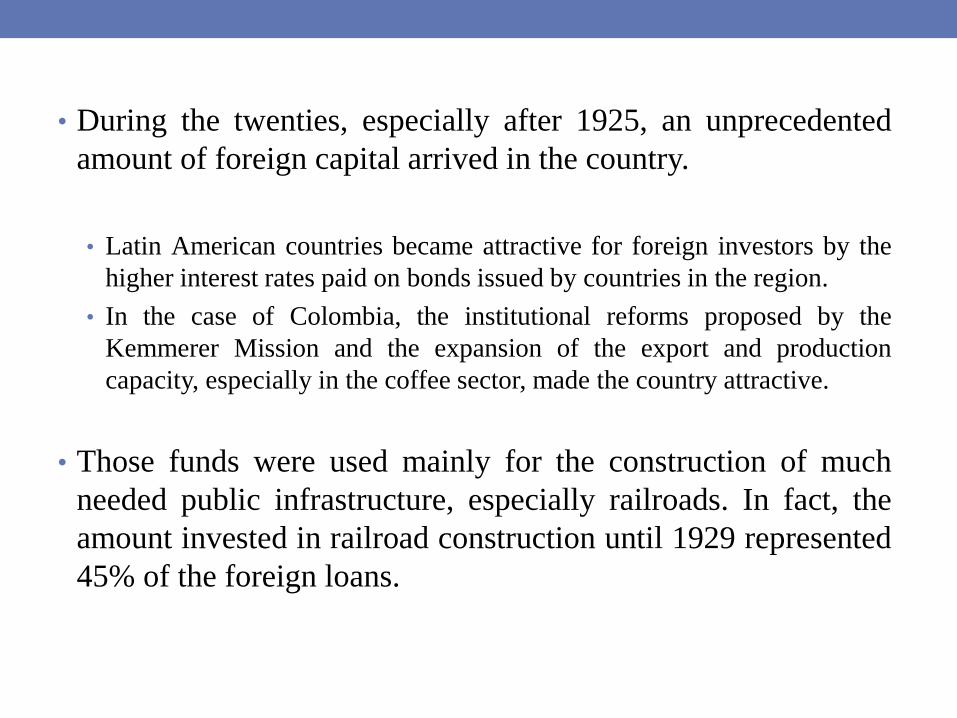
• During the twenties, especially after 1925, an unprecedented
amount of foreign capital arrived in the country.
• Latin American countries became attractive for foreign investors by the
higher interest rates paid on bonds issued by countries in the region.
• In the case of Colombia, the institutional reforms proposed by the
Kemmerer Mission and the expansion of the export and production
capacity, especially in the coffee sector, made the country attractive.
• Those funds were used mainly for the construction of much
needed public infrastructure, especially railroads. In fact, the
amount invested in railroad construction until 1929 represented
45% of the foreign loans.
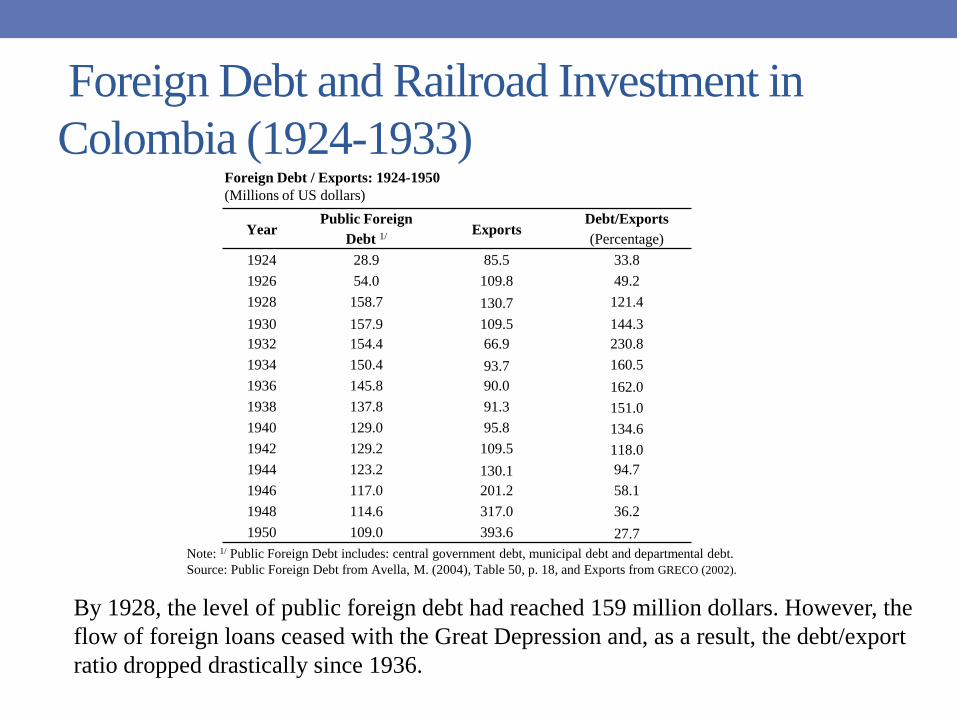
Foreign Debt and Railroad Investment in
Colombia (1924-1933)
By 1928, the level of public foreign debt had reached 159 million dollars. However, the
flow of foreign loans ceased with the Great Depression and, as a result, the debt/export
ratio dropped drastically since 1936.
YearPublic Foreign
Debt 1/Exports
Debt/Exports
(Percentage)
1924 28.9 85.5 33.8
1926 54.0 109.8 49.2
1928 158.7 130.7 121.4
1930 157.9 109.5 144.3
1932 154.4 66.9 230.8
1934 150.4 93.7 160.5
1936 145.8 90.0 162.0
1938 137.8 91.3 151.0
1940 129.0 95.8 134.6
1942 129.2 109.5 118.0
1944 123.2 130.1 94.7
1946 117.0 201.2 58.1
1948 114.6 317.0 36.2
1950 109.0 393.6 27.7
Foreign Debt / Exports: 1924-1950
(Millions of US dollars)
Note: 1/ Public Foreign Debt includes: central government debt, municipal debt and departmental debt.
Source: Public Foreign Debt from Avella, M. (2004), Table 50, p. 18, and Exports from GRECO (2002).
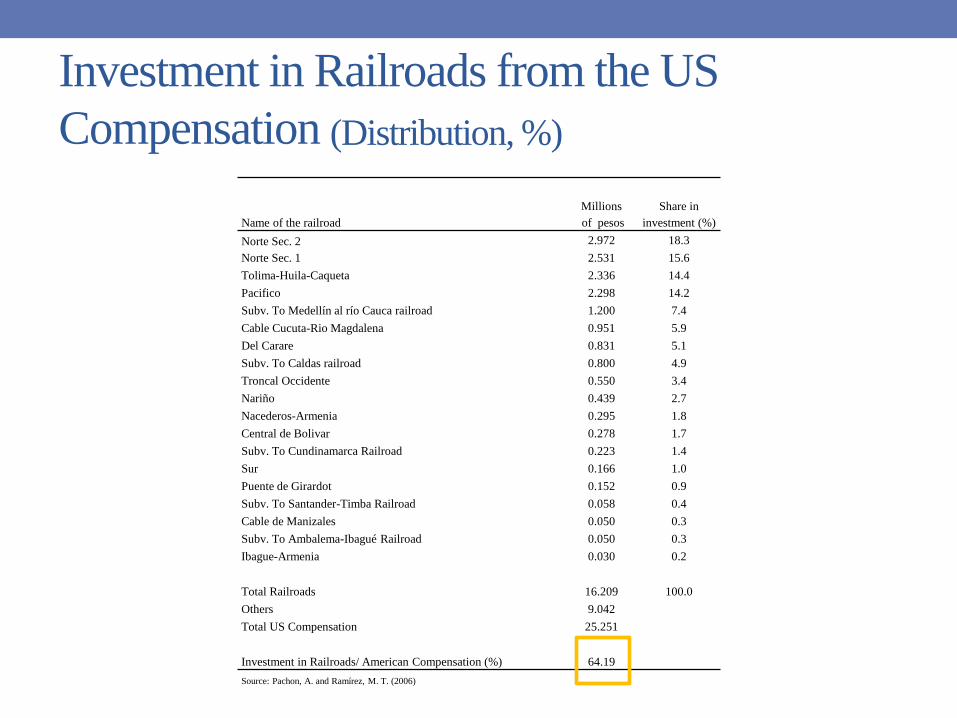
Investment in Railroads from the US
Compensation (Distribution, %)
Name of the railroad
Millions
of pesos
Share in
investment (%)
Norte Sec. 2 2.972 18.3
Norte Sec. 1 2.531 15.6
Tolima-Huila-Caqueta 2.336 14.4
Pacifico 2.298 14.2
Subv. To Medellín al río Cauca railroad 1.200 7.4
Cable Cucuta-Rio Magdalena 0.951 5.9
Del Carare 0.831 5.1
Subv. To Caldas railroad 0.800 4.9
Troncal Occidente 0.550 3.4
Nariño 0.439 2.7
Nacederos-Armenia 0.295 1.8
Central de Bolivar 0.278 1.7
Subv. To Cundinamarca Railroad 0.223 1.4
Sur 0.166 1.0
Puente de Girardot 0.152 0.9
Subv. To Santander-Timba Railroad 0.058 0.4
Cable de Manizales 0.050 0.3
Subv. To Ambalema-Ibagué Railroad 0.050 0.3
Ibague-Armenia 0.030 0.2
Total Railroads 16.209 100.0
Others 9.042
Total US Compensation 25.251
Investment in Railroads/ American Compensation (%) 64.19
Source: Pachon, A. and Ramírez, M. T. (2006)
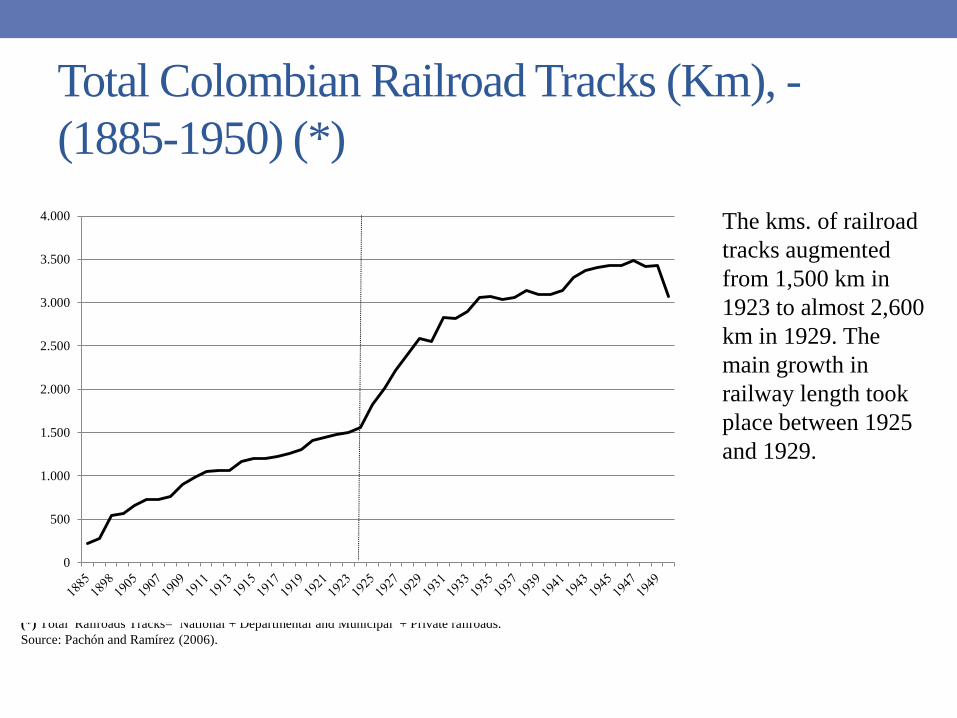
Total Colombian Railroad Tracks (Km), -
(1885-1950) (*)
(*) Total Railroads Tracks= National + Departmental and Municipal + Private railroads.
Source: Pachón and Ramírez (2006).
0
500
1.000
1.500
2.000
2.500
3.000
3.500
4.000 The kms. of railroad
tracks augmented
from 1,500 km in
1923 to almost 2,600
km in 1929. The
main growth in
railway length took
place between 1925
and 1929.
III. Rates of Return, 1924-1950
• There were several authors and engineers that in the 1920s and
early 1930s believed that part of the investments made in
railroads in the twenties wasted.
• Authors such Ortega (1932) and Barnhart (1956) argued that
after spending these large amounts of resources the country still
was isolated and disconnected.
• They blamed this result mainly to the lack of planning and
inability to manage those resources, in most cases because of
political pressures, and to the limited technical capacity to carry
out the constructions.
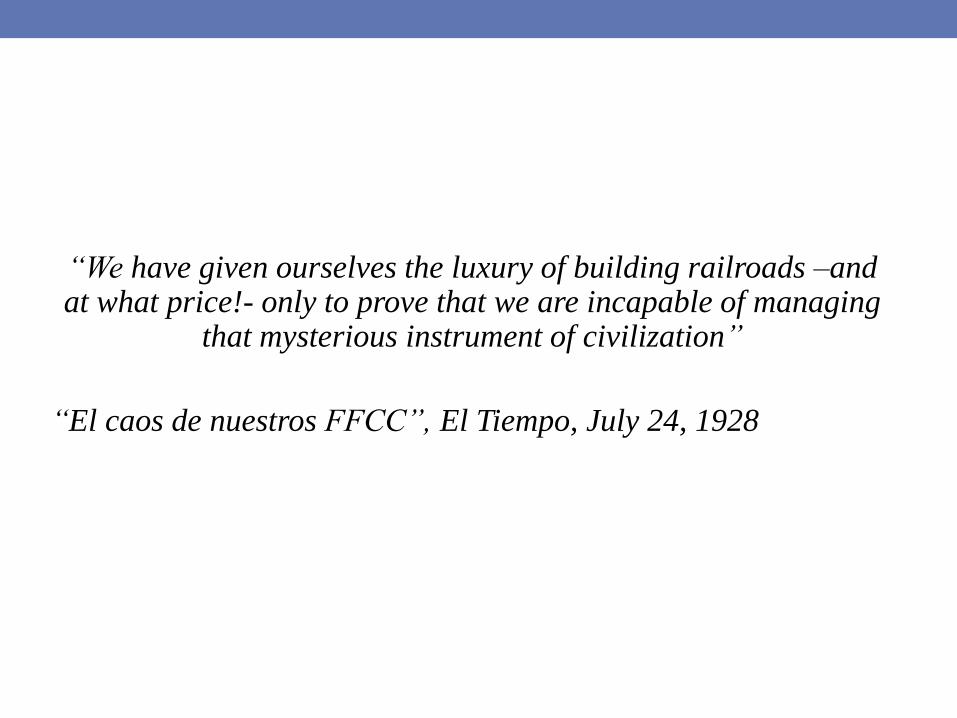
“We have given ourselves the luxury of building railroads –and at what price!- only to prove that we are incapable of managing
that mysterious instrument of civilization”
“El caos de nuestros FFCC”, El Tiempo, July 24, 1928
• We estimate yearly rates of returns (RR) for railroads built
or extended in the 1920´s, for the period 1924-1950.
• The main objective is to determine if investments in
railways during the 1920s, mainly financed by external
debt, were profitable.
• Our contribution is the calculation of the annual rates of
returns by railroad lines, both for freight and passengers.
• In addition, our estimations take into consideration that as a
result of the Great Depression and the suspension of payments on
foreign debt, Colombia ended up paying only a portion of the
loans obtained in the 1920´s.
• By 1933 the majority of Latin American countries had incurred
in debt moratorium, which started at beginning of 1931. The
moratorium on foreign debt in Colombia was a lengthy process
which lasted from 1931 to 1935.
• The payments for the national debt (installments and interest)
were suspended since January 1935, and resumed in 1940, first
under an interim agreement, and then permanently. An important
benefit of the renegotiations was the reduction in the interest rate.
• Rates of returns (RR) were measured as the ratio between net earnings(income minus expenditures) to cumulative investment for each year. Thismeasure has the advantage that it offers profit figures on an annual basis.
We propose two scenarios:
• In the first one (RR1), we assume no major investments in railroads weremade after 1933, and the investment depreciates at an annual rate of 5%after 1933.
• In the second scenario (RR2), since railroad investments were financed withforeign loans and because of the debt moratorium, we subtract thepercentage of foreign loans that were never paid.
• Additionally, we reduce the investment in railroads by 15% annually during1924-1930, and also assume that investment depreciated at an annual rate of5% after 1933
• Colombia stopped servicing its foreign debt through several
decisions taken in the period extending from 1931 to 1935.
• In the 1940s that was renegotiated and as a result the country
received a substantial reduction in the outstanding debt and the
rates of interest it finally paid when repayment was resumed.
Erika Jorgensen and Jeffrey Sachs (1988) have estimated that at
net present values Colombia ended up paying 15% less of the
foreign debt it had acquired in the 1920s.
• This is why to calculate the rates of return on railroad
investment it is necessary to subtract the percent of foreign
loans which were never paid.
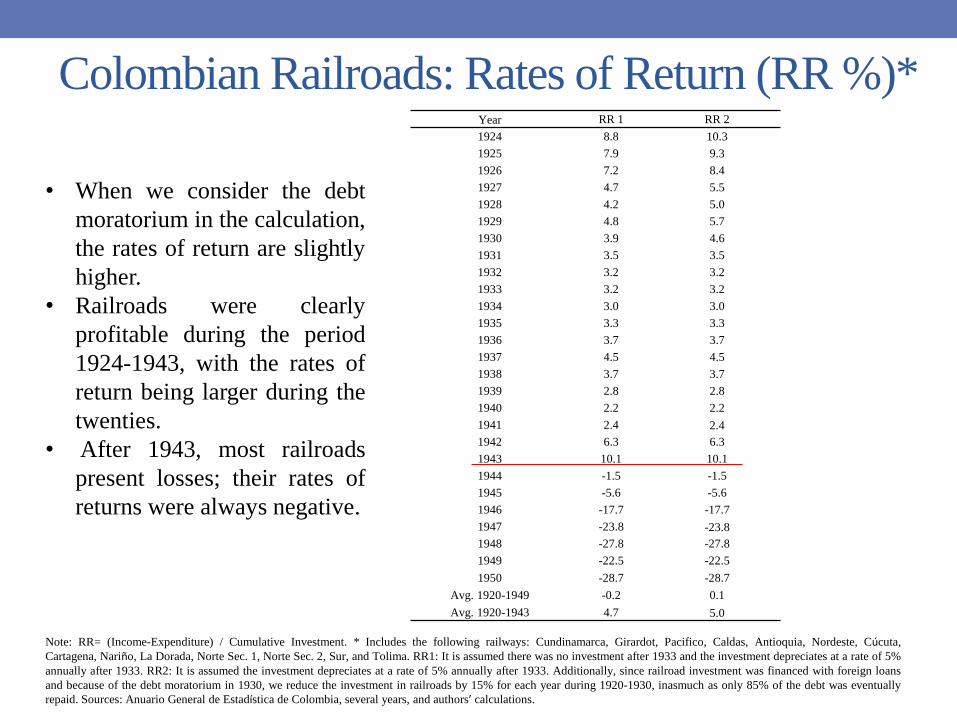
Colombian Railroads: Rates of Return (RR %)*
• When we consider the debt
moratorium in the calculation,
the rates of return are slightly
higher.
• Railroads were clearly
profitable during the period
1924-1943, with the rates of
return being larger during the
twenties.
• After 1943, most railroads
present losses; their rates of
returns were always negative.
Year RR 1 RR 2
1924 8.8 10.3
1925 7.9 9.3
1926 7.2 8.4
1927 4.7 5.5
1928 4.2 5.0
1929 4.8 5.7
1930 3.9 4.6
1931 3.5 3.5
1932 3.2 3.2
1933 3.2 3.2
1934 3.0 3.0
1935 3.3 3.3
1936 3.7 3.7
1937 4.5 4.5
1938 3.7 3.7
1939 2.8 2.8
1940 2.2 2.2
1941 2.4 2.4
1942 6.3 6.3
1943 10.1 10.1
1944 -1.5 -1.5
1945 -5.6 -5.6
1946 -17.7 -17.7
1947 -23.8 -23.8
1948 -27.8 -27.8
1949 -22.5 -22.5
1950 -28.7 -28.7
Avg. 1920-1949 -0.2 0.1
Avg. 1920-1943 4.7 5.0
Note: RR= (Income-Expenditure) / Cumulative Investment. * Includes the following railways: Cundinamarca, Girardot, Pacifico, Caldas, Antioquia, Nordeste, Cúcuta,
Cartagena, Nariño, La Dorada, Norte Sec. 1, Norte Sec. 2, Sur, and Tolima. RR1: It is assumed there was no investment after 1933 and the investment depreciates at a rate of 5%
annually after 1933. RR2: It is assumed the investment depreciates at a rate of 5% annually after 1933. Additionally, since railroad investment was financed with foreign loans
and because of the debt moratorium in 1930, we reduce the investment in railroads by 15% for each year during 1920-1930, inasmuch as only 85% of the debt was eventually
repaid. Sources: Anuario General de Estadística de Colombia, several years, and authors’ calculations.
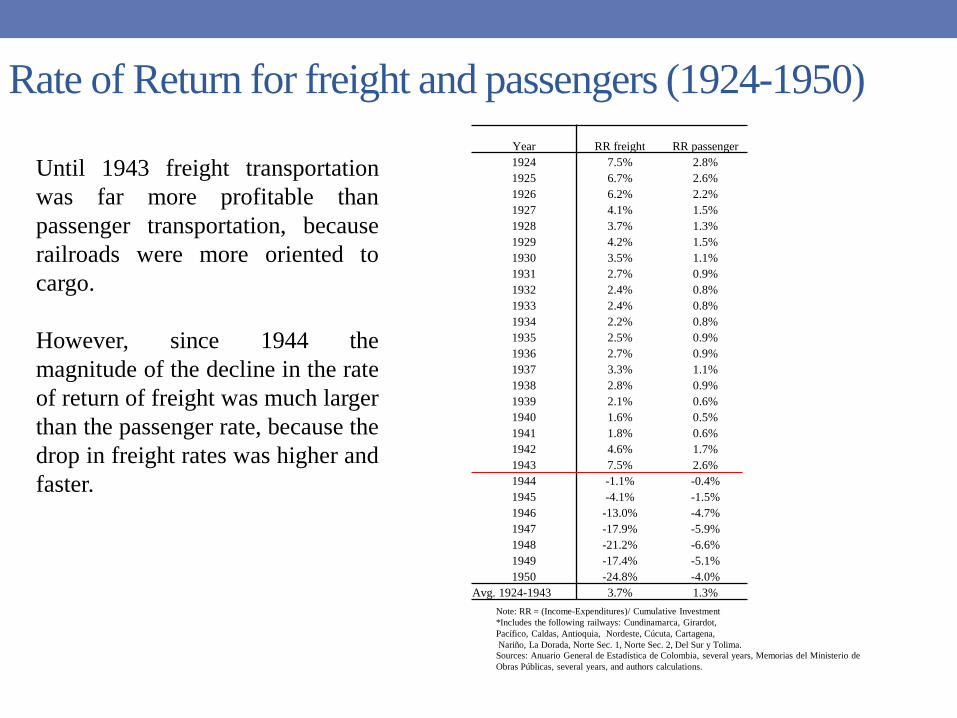
Rate of Return for freight and passengers (1924-1950)
Year RR freight RR passenger
1924 7.5% 2.8%
1925 6.7% 2.6%
1926 6.2% 2.2%
1927 4.1% 1.5%
1928 3.7% 1.3%
1929 4.2% 1.5%
1930 3.5% 1.1%
1931 2.7% 0.9%
1932 2.4% 0.8%
1933 2.4% 0.8%
1934 2.2% 0.8%
1935 2.5% 0.9%
1936 2.7% 0.9%
1937 3.3% 1.1%
1938 2.8% 0.9%
1939 2.1% 0.6%
1940 1.6% 0.5%
1941 1.8% 0.6%
1942 4.6% 1.7%
1943 7.5% 2.6%
1944 -1.1% -0.4%
1945 -4.1% -1.5%
1946 -13.0% -4.7%
1947 -17.9% -5.9%
1948 -21.2% -6.6%
1949 -17.4% -5.1%
1950 -24.8% -4.0%
Avg. 1924-1943 3.7% 1.3%
Note: RR = (Income-Expenditures)/ Cumulative Investment
*Includes the following railways: Cundinamarca, Girardot,
Pacífico, Caldas, Antioquia, Nordeste, Cúcuta, Cartagena,
Nariño, La Dorada, Norte Sec. 1, Norte Sec. 2, Del Sur y Tolima.
Sources: Anuario General de Estadística de Colombia, several years, Memorias del Ministerio de
Obras Públicas, several years, and authors calculations.
Until 1943 freight transportation
was far more profitable than
passenger transportation, because
railroads were more oriented to
cargo.
However, since 1944 the
magnitude of the decline in the rate
of return of freight was much larger
than the passenger rate, because the
drop in freight rates was higher and
faster.
• After 1943, most railroads present losses; their rates of returns were
always negative, mainly because railroads had to face the competition
from parallel roads and because of the negative effects of World War
II on the Colombian economy.
• Since the early 1930s the infrastructure policy shifts towards the
construction of highways, where the major investments were made.
• Many new roads were built parallel to the railways and so they
competed with railways, since highway transportation was faster and
more flexible. In addition, highways were more profitable because of
the private nature of the operation.
• Thus many railroads subsidized went bankrupt.
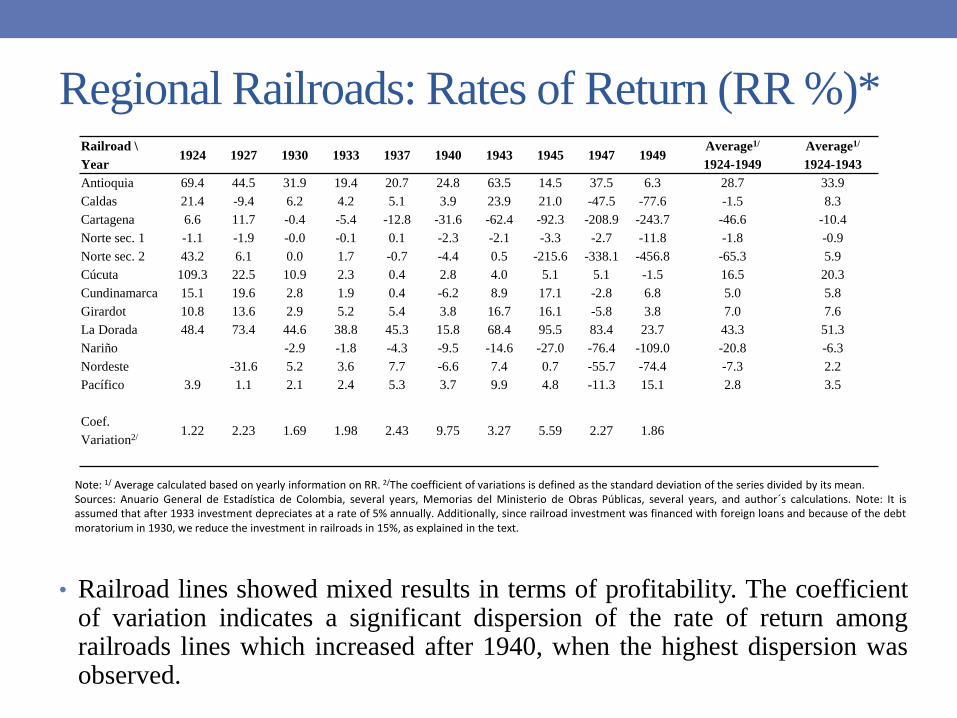
Regional Railroads: Rates of Return (RR %)*Railroad \
Year1924 1927 1930 1933 1937 1940 1943 1945 1947 1949
Average1/
1924-1949
Average1/
1924-1943
Antioquia 69.4 44.5 31.9 19.4 20.7 24.8 63.5 14.5 37.5 6.3 28.7 33.9
Caldas 21.4 -9.4 6.2 4.2 5.1 3.9 23.9 21.0 -47.5 -77.6 -1.5 8.3
Cartagena 6.6 11.7 -0.4 -5.4 -12.8 -31.6 -62.4 -92.3 -208.9 -243.7 -46.6 -10.4
Norte sec. 1 -1.1 -1.9 -0.0 -0.1 0.1 -2.3 -2.1 -3.3 -2.7 -11.8 -1.8 -0.9
Norte sec. 2 43.2 6.1 0.0 1.7 -0.7 -4.4 0.5 -215.6 -338.1 -456.8 -65.3 5.9
Cúcuta 109.3 22.5 10.9 2.3 0.4 2.8 4.0 5.1 5.1 -1.5 16.5 20.3
Cundinamarca 15.1 19.6 2.8 1.9 0.4 -6.2 8.9 17.1 -2.8 6.8 5.0 5.8
Girardot 10.8 13.6 2.9 5.2 5.4 3.8 16.7 16.1 -5.8 3.8 7.0 7.6
La Dorada 48.4 73.4 44.6 38.8 45.3 15.8 68.4 95.5 83.4 23.7 43.3 51.3
Nariño -2.9 -1.8 -4.3 -9.5 -14.6 -27.0 -76.4 -109.0 -20.8 -6.3
Nordeste -31.6 5.2 3.6 7.7 -6.6 7.4 0.7 -55.7 -74.4 -7.3 2.2
Pacífico 3.9 1.1 2.1 2.4 5.3 3.7 9.9 4.8 -11.3 15.1 2.8 3.5
Coef.
Variation2/1.22 2.23 1.69 1.98 2.43 9.75 3.27 5.59 2.27 1.86
Note: 1/ Average calculated based on yearly information on RR. 2/The coefficient of variations is defined as the standard deviation of the series divided by its mean.Sources: Anuario General de Estadística de Colombia, several years, Memorias del Ministerio de Obras Públicas, several years, and author´s calculations. Note: It isassumed that after 1933 investment depreciates at a rate of 5% annually. Additionally, since railroad investment was financed with foreign loans and because of the debtmoratorium in 1930, we reduce the investment in railroads in 15%, as explained in the text.
• Railroad lines showed mixed results in terms of profitability. The coefficientof variation indicates a significant dispersion of the rate of return amongrailroads lines which increased after 1940, when the highest dispersion wasobserved.
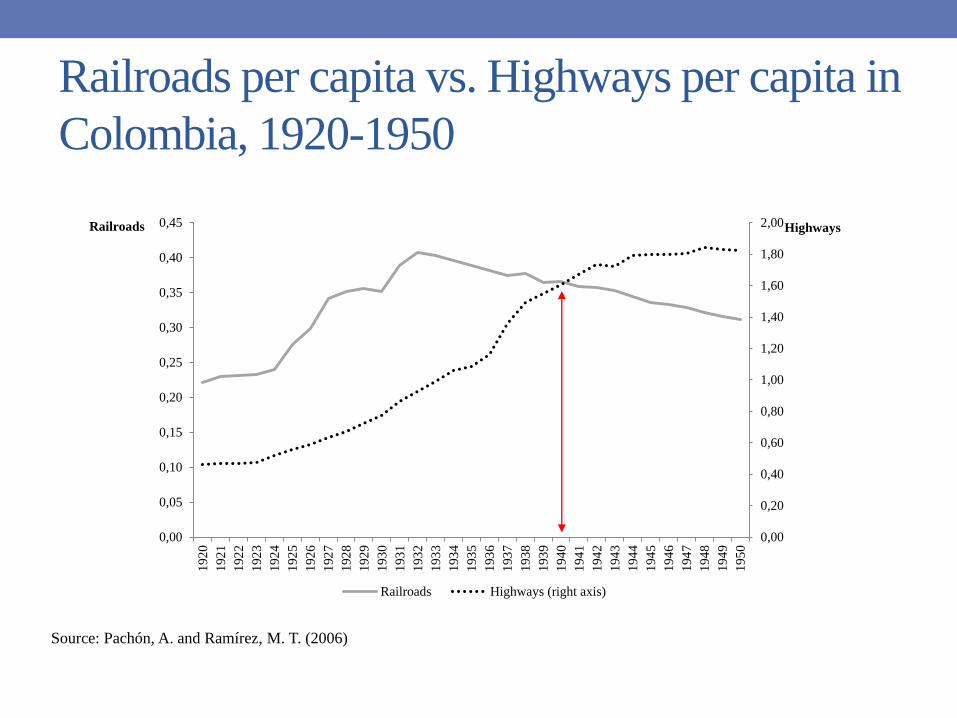
Railroads per capita vs. Highways per capita in
Colombia, 1920-1950
0,00
0,20
0,40
0,60
0,80
1,00
1,20
1,40
1,60
1,80
2,00
0,00
0,05
0,10
0,15
0,20
0,25
0,30
0,35
0,40
0,45
192
0
192
1
192
2
192
3
192
4
192
5
192
6
192
7
192
8
192
9
193
0
193
1
193
2
193
3
193
4
193
5
193
6
193
7
193
8
193
9
194
0
194
1
194
2
194
3
194
4
194
5
194
6
194
7
194
8
194
9
195
0
HighwaysRailroads
Railroads Highways (right axis)
Source: Pachón, A. and Ramírez, M. T. (2006)
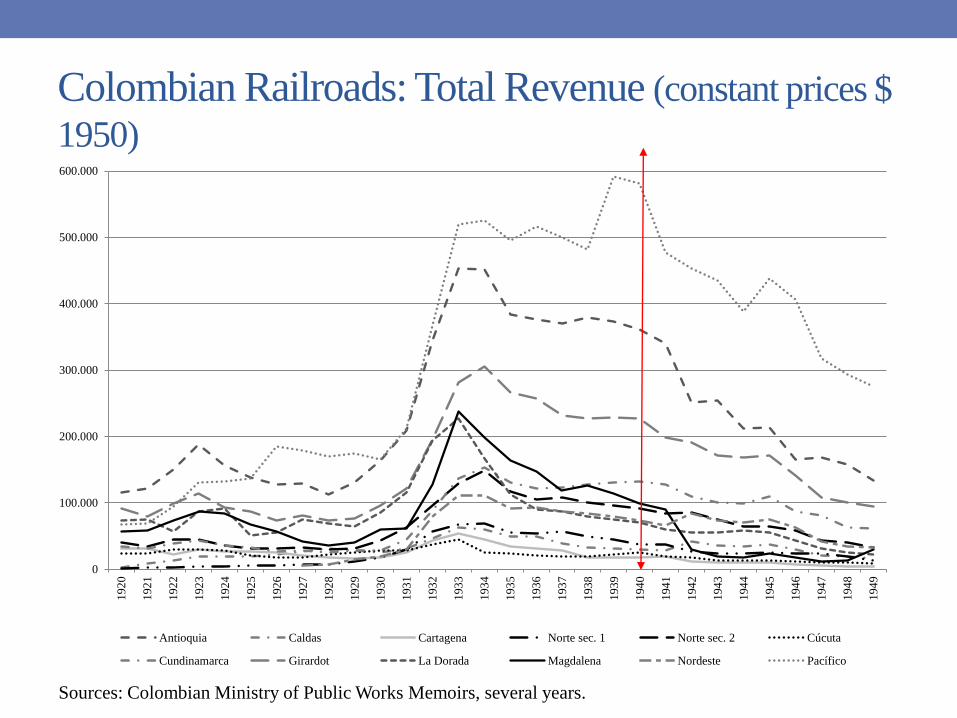
Colombian Railroads: Total Revenue (constant prices $
1950)
0
100.000
200.000
300.000
400.000
500.000
600.000
192
0
192
1
192
2
192
3
192
4
192
5
192
6
192
7
192
8
192
9
193
0
193
1
193
2
193
3
193
4
193
5
193
6
193
7
193
8
193
9
194
0
194
1
194
2
194
3
194
4
194
5
194
6
194
7
194
8
194
9
Antioquia Caldas Cartagena Norte sec. 1 Norte sec. 2 Cúcuta
Cundinamarca Girardot La Dorada Magdalena Nordeste Pacífico
Sources: Colombian Ministry of Public Works Memoirs, several years.
• All railroads had a significant drop in their output since the late
thirties, as a result of a significant reduction in freight and
passenger rates established by the government’s regulation of
railway fares.
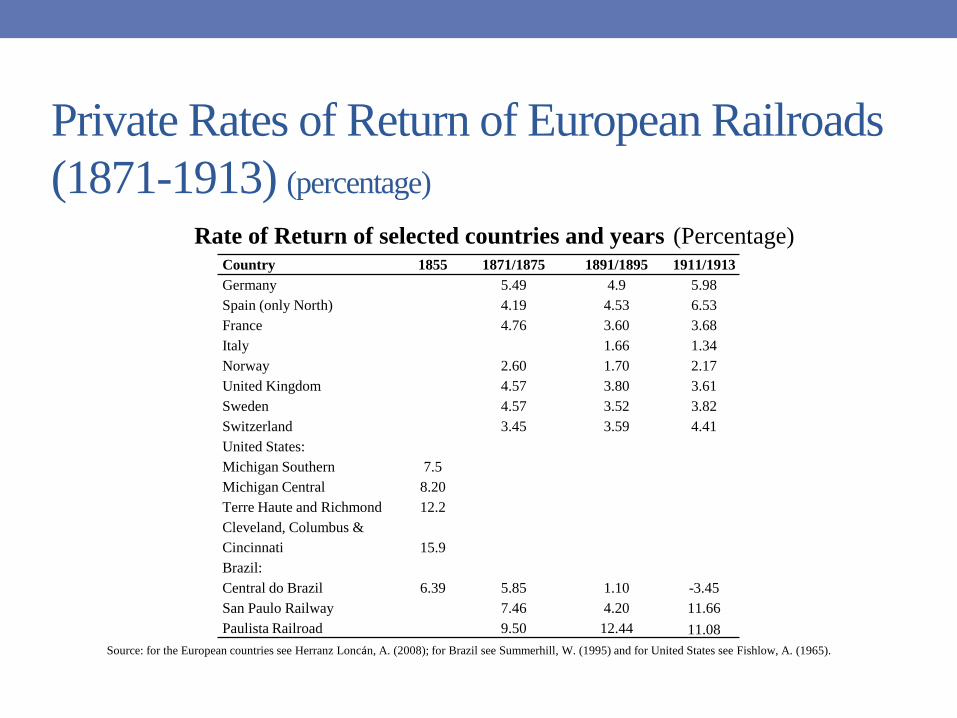
Private Rates of Return of European Railroads
(1871-1913) (percentage)
Country 1855 1871/1875 1891/1895 1911/1913
Germany 5.49 4.9 5.98
Spain (only North) 4.19 4.53 6.53
France 4.76 3.60 3.68
Italy 1.66 1.34
Norway 2.60 1.70 2.17
United Kingdom 4.57 3.80 3.61
Sweden 4.57 3.52 3.82
Switzerland 3.45 3.59 4.41
United States:
Michigan Southern 7.5
Michigan Central 8.20
Terre Haute and Richmond 12.2
Cleveland, Columbus &
Cincinnati 15.9
Brazil:
Central do Brazil 6.39 5.85 1.10 -3.45
San Paulo Railway 7.46 4.20 11.66
Paulista Railroad 9.50 12.44 11.08
Source: for the European countries see Herranz Loncán, A. (2008); for Brazil see Summerhill, W. (1995) and for United States see Fishlow, A. (1965).
Rate of Return of selected countries and years (Percentage)
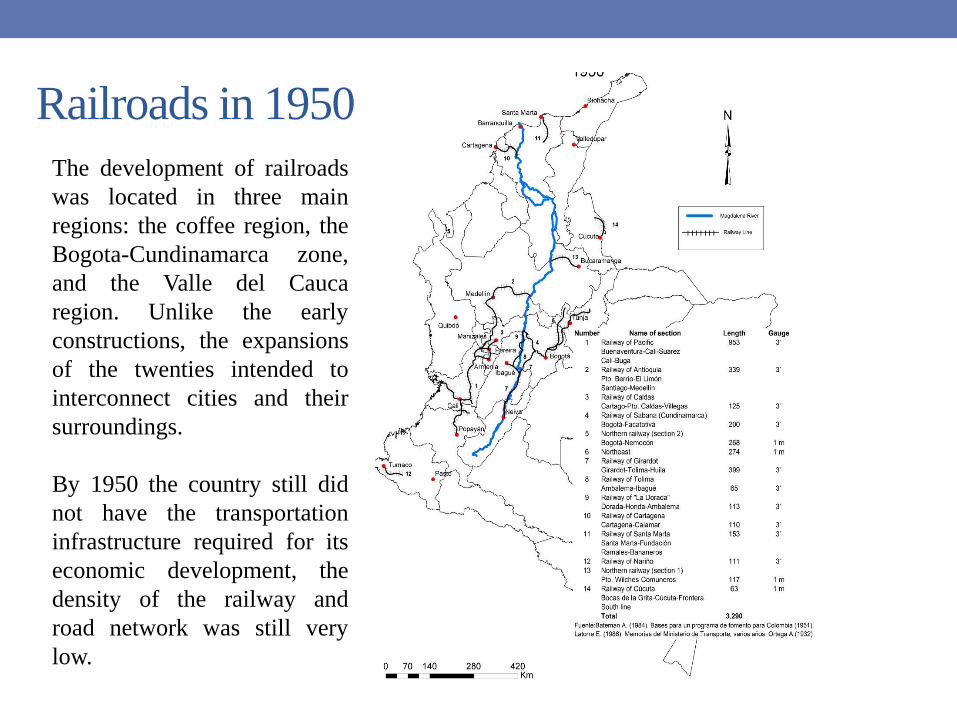
Railroads in 1950
The development of railroads
was located in three main
regions: the coffee region, the
Bogota-Cundinamarca zone,
and the Valle del Cauca
region. Unlike the early
constructions, the expansions
of the twenties intended to
interconnect cities and their
surroundings.
By 1950 the country still did
not have the transportation
infrastructure required for its
economic development, the
density of the railway and
road network was still very
low.
“The Colombian topography is so unique because of its abruptness that
superficial transports constitute a maximum economic problem”
Lauchlin Currie (1950), World Bank Mission.
IV. Conclusions
Conclusions
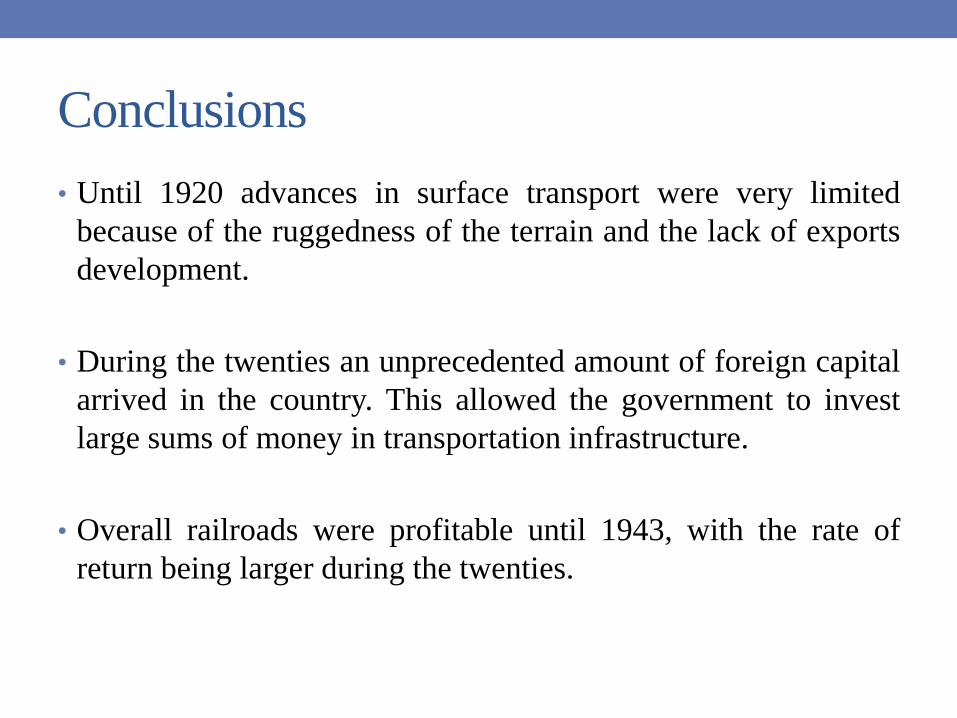
• Until 1920 advances in surface transport were very limited
because of the ruggedness of the terrain and the lack of exports
development.
• During the twenties an unprecedented amount of foreign capital
arrived in the country. This allowed the government to invest
large sums of money in transportation infrastructure.
• Overall railroads were profitable until 1943, with the rate of
return being larger during the twenties.
Conclusions
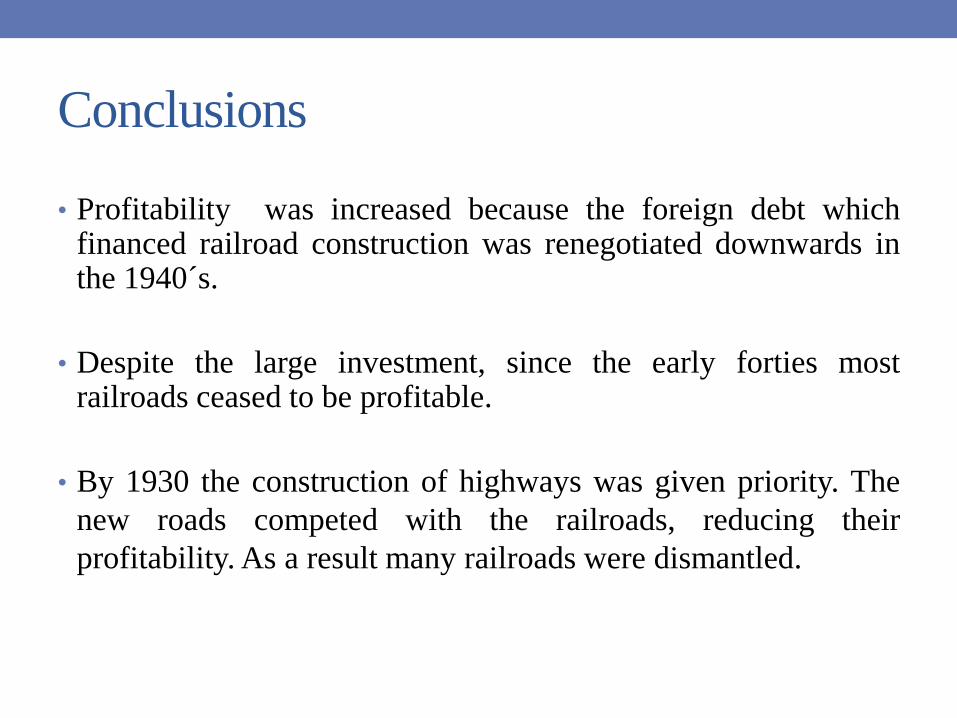
• Profitability was increased because the foreign debt whichfinanced railroad construction was renegotiated downwards inthe 1940´s.
• Despite the large investment, since the early forties mostrailroads ceased to be profitable.
• By 1930 the construction of highways was given priority. The
new roads competed with the railroads, reducing their
profitability. As a result many railroads were dismantled.
Thanks
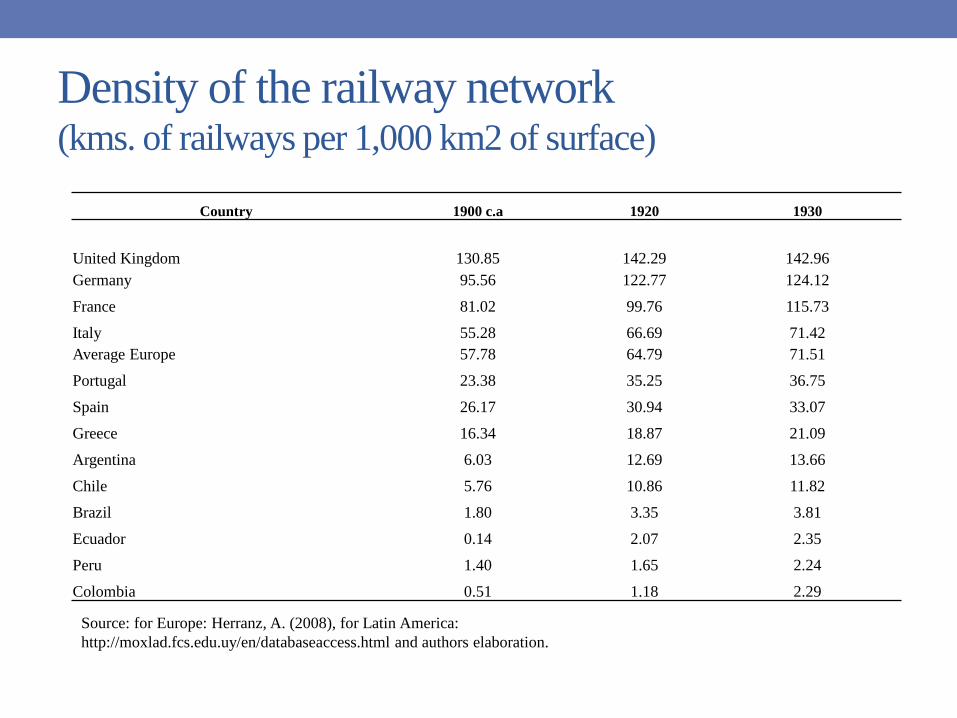
Density of the railway network(kms. of railways per 1,000 km2 of surface)
Country 1900 c.a 1920 1930
United Kingdom 130.85 142.29 142.96
Germany 95.56 122.77 124.12
France 81.02 99.76 115.73
Italy 55.28 66.69 71.42
Average Europe 57.78 64.79 71.51
Portugal 23.38 35.25 36.75
Spain 26.17 30.94 33.07
Greece 16.34 18.87 21.09
Argentina 6.03 12.69 13.66
Chile 5.76 10.86 11.82
Brazil 1.80 3.35 3.81
Ecuador 0.14 2.07 2.35
Peru 1.40 1.65 2.24
Colombia 0.51 1.18 2.29
Source: for Europe: Herranz, A. (2008), for Latin America:
http://moxlad.fcs.edu.uy/en/databaseaccess.html and authors elaboration.
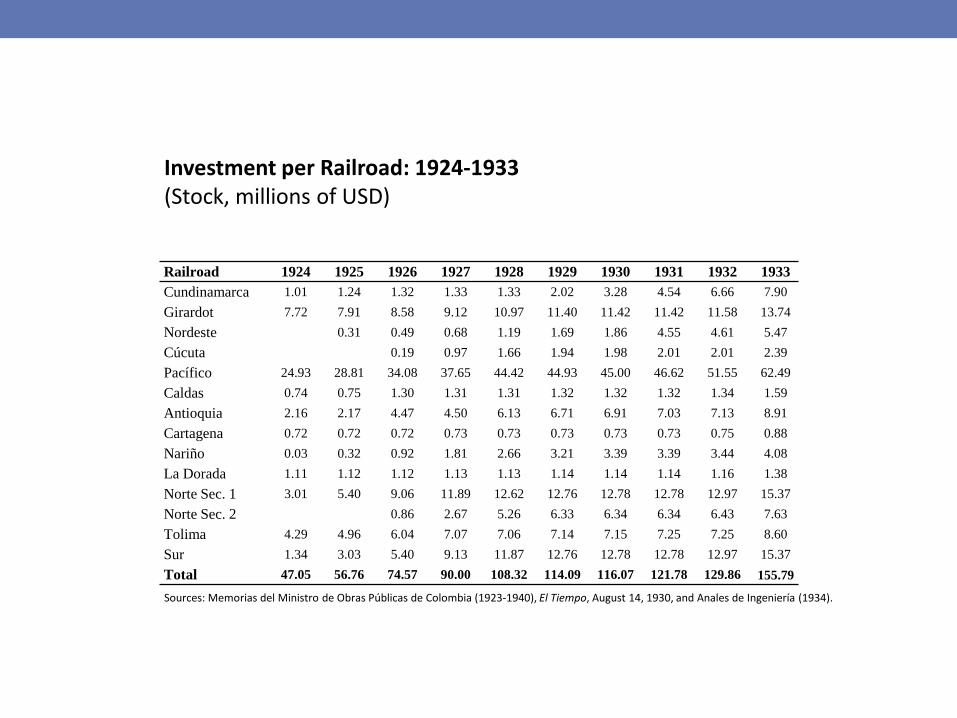
Railroad 1924 1925 1926 1927 1928 1929 1930 1931 1932 1933
Cundinamarca 1.01 1.24 1.32 1.33 1.33 2.02 3.28 4.54 6.66 7.90
Girardot 7.72 7.91 8.58 9.12 10.97 11.40 11.42 11.42 11.58 13.74
Nordeste 0.31 0.49 0.68 1.19 1.69 1.86 4.55 4.61 5.47
Cúcuta 0.19 0.97 1.66 1.94 1.98 2.01 2.01 2.39
Pacífico 24.93 28.81 34.08 37.65 44.42 44.93 45.00 46.62 51.55 62.49
Caldas 0.74 0.75 1.30 1.31 1.31 1.32 1.32 1.32 1.34 1.59
Antioquia 2.16 2.17 4.47 4.50 6.13 6.71 6.91 7.03 7.13 8.91
Cartagena 0.72 0.72 0.72 0.73 0.73 0.73 0.73 0.73 0.75 0.88
Nariño 0.03 0.32 0.92 1.81 2.66 3.21 3.39 3.39 3.44 4.08
La Dorada 1.11 1.12 1.12 1.13 1.13 1.14 1.14 1.14 1.16 1.38
Norte Sec. 1 3.01 5.40 9.06 11.89 12.62 12.76 12.78 12.78 12.97 15.37
Norte Sec. 2 0.86 2.67 5.26 6.33 6.34 6.34 6.43 7.63
Tolima 4.29 4.96 6.04 7.07 7.06 7.14 7.15 7.25 7.25 8.60
Sur 1.34 3.03 5.40 9.13 11.87 12.76 12.78 12.78 12.97 15.37
Total 47.05 56.76 74.57 90.00 108.32 114.09 116.07 121.78 129.86 155.79
Sources: Memorias del Ministro de Obras Públicas de Colombia (1923-1940), El Tiempo, August 14, 1930, and Anales de Ingeniería (1934).
Investment per Railroad: 1924-1933(Stock, millions of USD)
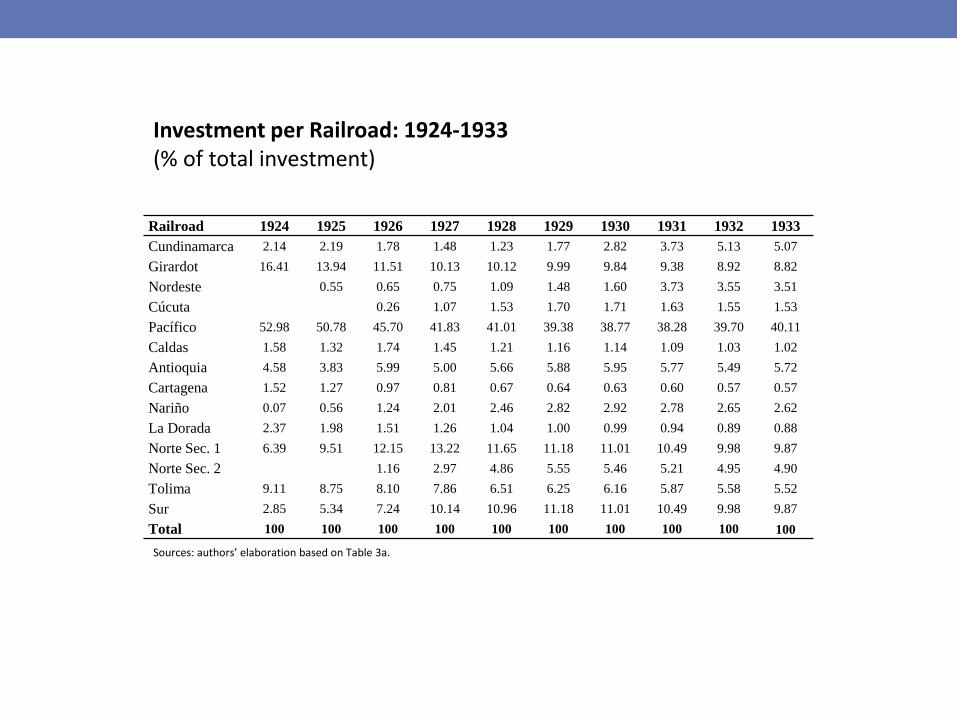
Railroad 1924 1925 1926 1927 1928 1929 1930 1931 1932 1933
Cundinamarca 2.14 2.19 1.78 1.48 1.23 1.77 2.82 3.73 5.13 5.07
Girardot 16.41 13.94 11.51 10.13 10.12 9.99 9.84 9.38 8.92 8.82
Nordeste 0.55 0.65 0.75 1.09 1.48 1.60 3.73 3.55 3.51
Cúcuta 0.26 1.07 1.53 1.70 1.71 1.63 1.55 1.53
Pacífico 52.98 50.78 45.70 41.83 41.01 39.38 38.77 38.28 39.70 40.11
Caldas 1.58 1.32 1.74 1.45 1.21 1.16 1.14 1.09 1.03 1.02
Antioquia 4.58 3.83 5.99 5.00 5.66 5.88 5.95 5.77 5.49 5.72
Cartagena 1.52 1.27 0.97 0.81 0.67 0.64 0.63 0.60 0.57 0.57
Nariño 0.07 0.56 1.24 2.01 2.46 2.82 2.92 2.78 2.65 2.62
La Dorada 2.37 1.98 1.51 1.26 1.04 1.00 0.99 0.94 0.89 0.88
Norte Sec. 1 6.39 9.51 12.15 13.22 11.65 11.18 11.01 10.49 9.98 9.87
Norte Sec. 2 1.16 2.97 4.86 5.55 5.46 5.21 4.95 4.90
Tolima 9.11 8.75 8.10 7.86 6.51 6.25 6.16 5.87 5.58 5.52
Sur 2.85 5.34 7.24 10.14 10.96 11.18 11.01 10.49 9.98 9.87
Total 100 100 100 100 100 100 100 100 100 100
Sources: authors’ elaboration based on Table 3a.
Investment per Railroad: 1924-1933(% of total investment)