Embed Size (px)
Citation preview
TOOL DESIGN PROCESS FINISHING WORK PART BOTTOM COVER WITH
POKA YOKE AND MODEL KANO Erry Rimawan1, Agus Suroso2, Jenri Sunggul Parningotan Sirait3
ABSTRACT- PT.Ostec Indonesia is a company engaged in the manufacture of plastics injection molding is producing products made of plastic resin material such as electronic spare parts and automotive accessories. Unuk win the competition with other competitors, companies must be able to qualify and fulfillment of customer demand that is terhadapa timeliness and quality of the goods. because of that PTostec Indonesia should be able to run a more efficient production.
Results of preliminary observations on the bottom cover part of production process that is part of the product politron, indicated some of the problems associated with waste (waste) that is not achieving the target time of production by workers during the finishing process. Based on the issues involved, the approach to the analysis of poka yoke method to determine the cause of the error to the movement in doing the job, then look for a solution to prevent such errors. Next to design a stone tool work as a solution to prevent errors canoe model was used to get the attributes and demand workers and workers in line with expectations. To enhance workplace design tools used anthropometric data calculation that gets high and the diameter of the working tools.
The final result obtained design work tool bottom cover part finishing process that can reduce the waste of time prior to the conclusion of tools designed able to reduce the time standard finishing process by the worker by 36.4% ie 48.6 seconds per one process of finishing the bottom cover part.
Keywords : Finishing Processes, Standard Time, Map of Hope, Right Hand Left Hand, poka-yoke, anthropometry, Kano.
INTRODUCTION
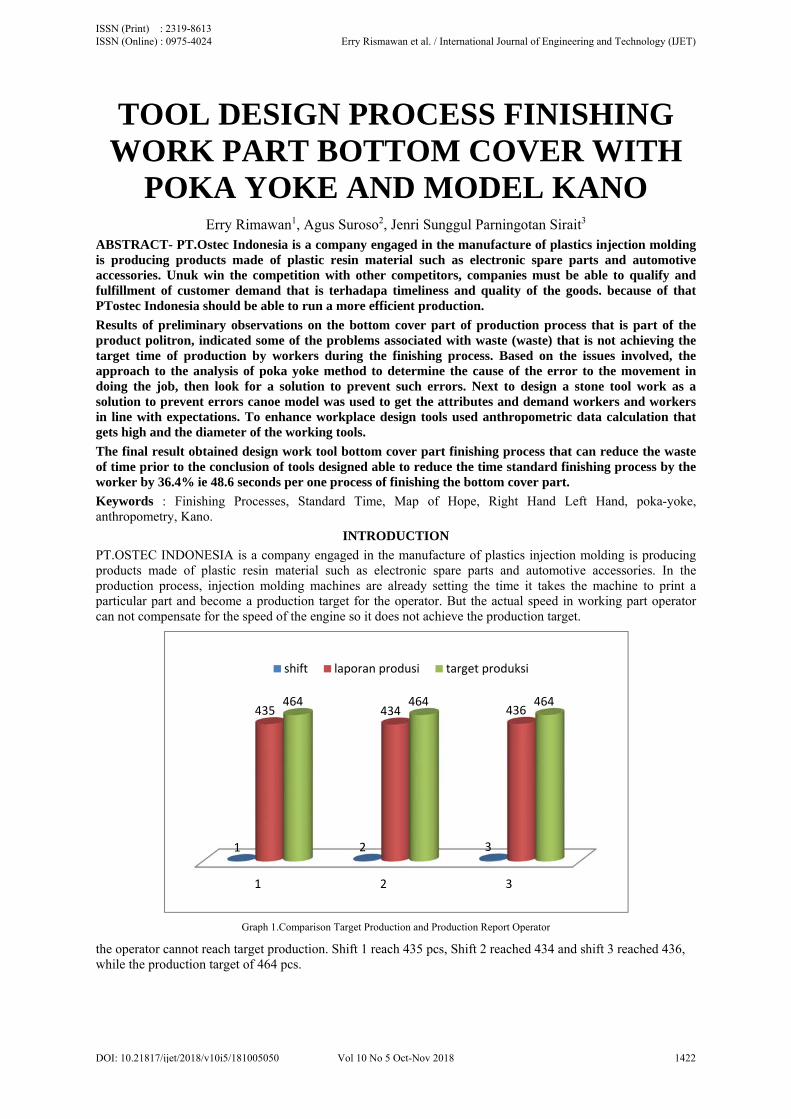
PT.OSTEC INDONESIA is a company engaged in the manufacture of plastics injection molding is producing products made of plastic resin material such as electronic spare parts and automotive accessories. In the production process, injection molding machines are already setting the time it takes the machine to print a particular part and become a production target for the operator. But the actual speed in working part operator can not compensate for the speed of the engine so it does not achieve the production target.
Graph 1.Comparison Target Production and Production Report Operator
the operator cannot reach target production. Shift 1 reach 435 pcs, Shift 2 reached 434 and shift 3 reached 436, while the production target of 464 pcs.
1 2 3
1 2 3
435 434 436464 464 464
shift laporan produsi target produksi
ISSN (Print) : 2319-8613 ISSN (Online) : 0975-4024 Erry Rismawan et al. / International Journal of Engineering and Technology (IJET)
DOI: 10.21817/ijet/2018/v10i5/181005050 Vol 10 No 5 Oct-Nov 2018 1422
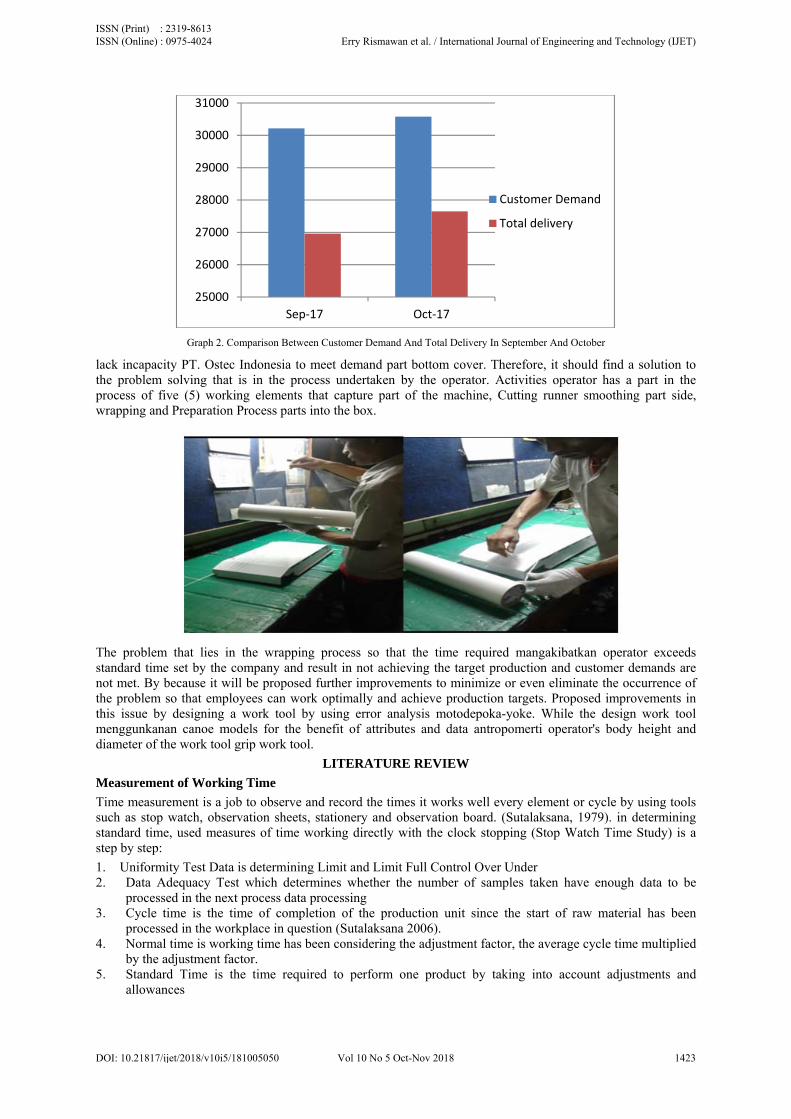
Graph 2. Comparison Between Customer Demand And Total Delivery In September And October
lack incapacity PT. Ostec Indonesia to meet demand part bottom cover. Therefore, it should find a solution to the problem solving that is in the process undertaken by the operator. Activities operator has a part in the process of five (5) working elements that capture part of the machine, Cutting runner smoothing part side, wrapping and Preparation Process parts into the box.
The problem that lies in the wrapping process so that the time required mangakibatkan operator exceeds standard time set by the company and result in not achieving the target production and customer demands are not met. By because it will be proposed further improvements to minimize or even eliminate the occurrence of the problem so that employees can work optimally and achieve production targets. Proposed improvements in this issue by designing a work tool by using error analysis motodepoka-yoke. While the design work tool menggunkanan canoe models for the benefit of attributes and data antropomerti operator's body height and diameter of the work tool grip work tool.
LITERATURE REVIEW
Measurement of Working Time
Time measurement is a job to observe and record the times it works well every element or cycle by using tools such as stop watch, observation sheets, stationery and observation board. (Sutalaksana, 1979). in determining standard time, used measures of time working directly with the clock stopping (Stop Watch Time Study) is a step by step:
1. Uniformity Test Data is determining Limit and Limit Full Control Over Under 2. Data Adequacy Test which determines whether the number of samples taken have enough data to be
processed in the next process data processing 3. Cycle time is the time of completion of the production unit since the start of raw material has been
processed in the workplace in question (Sutalaksana 2006). 4. Normal time is working time has been considering the adjustment factor, the average cycle time multiplied
by the adjustment factor. 5. Standard Time is the time required to perform one product by taking into account adjustments and
allowances
25000
26000
27000
28000
29000
30000
31000
Sep‐17 Oct‐17
Customer Demand
Total delivery
ISSN (Print) : 2319-8613 ISSN (Online) : 0975-4024 Erry Rismawan et al. / International Journal of Engineering and Technology (IJET)
DOI: 10.21817/ijet/2018/v10i5/181005050 Vol 10 No 5 Oct-Nov 2018 1423
Operation Process Map map shows a sequential operation process sequence of processes, inspection, time and materials used in manufacturing or business processes, from the arrival of raw material to the packaging process of production so (Sutalaksana: 2006).
Map Right Hand - Left Hand
Map of the left hand and right hand are picturing a map of the entire elements of movement while working and idle time performed by the left hand and right hand (Sutalaksana: 2006),
anthropometry
Static anthropometry is about physical traits beyond the human is at rest or in a standardized position. While the dynamic anthropometric about keadan and physical characteristics of man on the move or pay attention to the movements that may occur when the worker carries out its activities (Sutalaksana: 2006).
Foka-Yoke Methods
Poka Yoke is a technique to overcome and avoid simple mistakes that caused by human or worker (human error) in the workplace in a wayprevent it directly from the root cause (root cause) errors and drew particular attention in a job or a task that did not have the possibility to make a mistake (Shigeo Shingo, 1960).
Kano Model
Kano Kano Model or Diagram is a diagram that divides the specifications of the products supplied to customers (Berger, et al, 1993) .. Mapping preferences of consumers is a way of understanding the attributes and selected service expected by customers in obtaining satisfaction. namely customer service attributes permiantaan Attractive, Must-Be, One-dimensional, Indifferent, Reverse, questionalble
Design And Product Development
According to Ulrich (2003) concept of the product is a description or estimate of the technology, working principles, and the shape of the product. The product concept is a brief overview of how the products satisfy customer needs. The process of drafting begins with a series of customer needs and specifications of the target, and ends with the creation of some of the concepts of product as a final option. Identifiaksi customer needs is an important part of the concept development phase, which is one phase of the product development process.
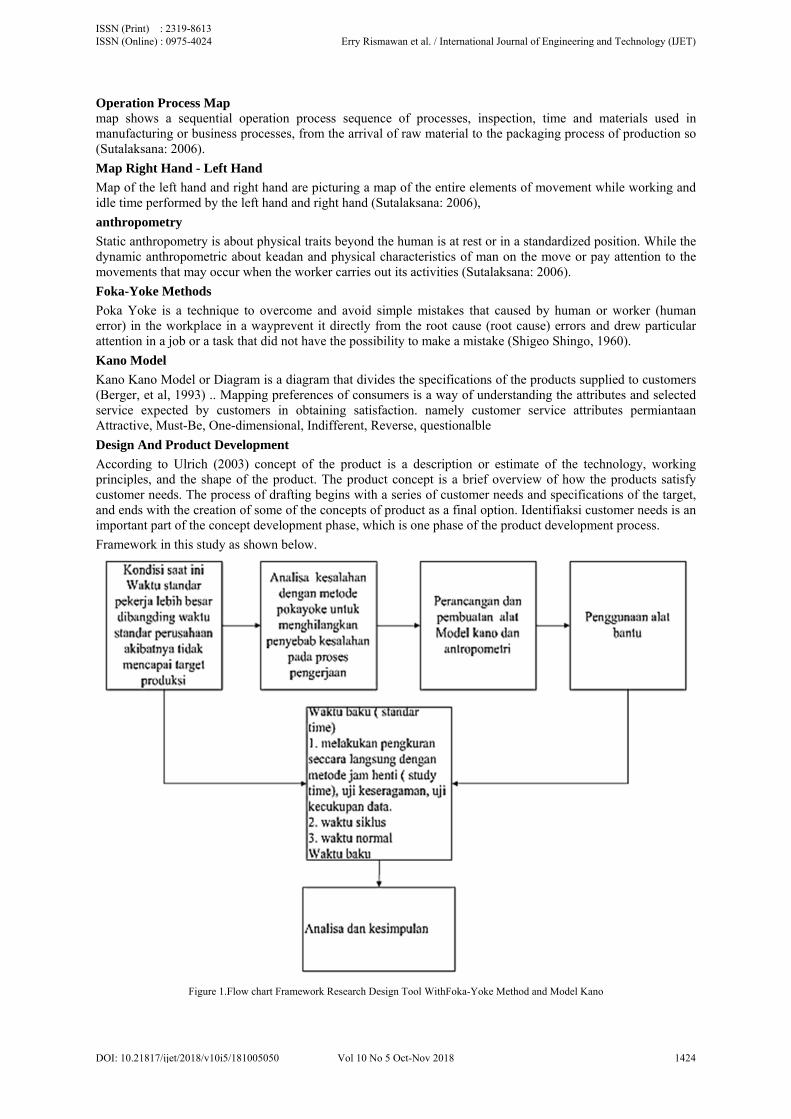
Framework in this study as shown below.
Figure 1.Flow chart Framework Research Design Tool WithFoka-Yoke Method and Model Kano
ISSN (Print) : 2319-8613 ISSN (Online) : 0975-4024 Erry Rismawan et al. / International Journal of Engineering and Technology (IJET)
DOI: 10.21817/ijet/2018/v10i5/181005050 Vol 10 No 5 Oct-Nov 2018 1424
METHOD
Data processing
Data processing is performed to make the raw data obtained from the company can be useful in research. The data in this study is to recapitulate the results of interviews and questionnaires, anthropometric measurement, calculation processing time and canoeing.
Design
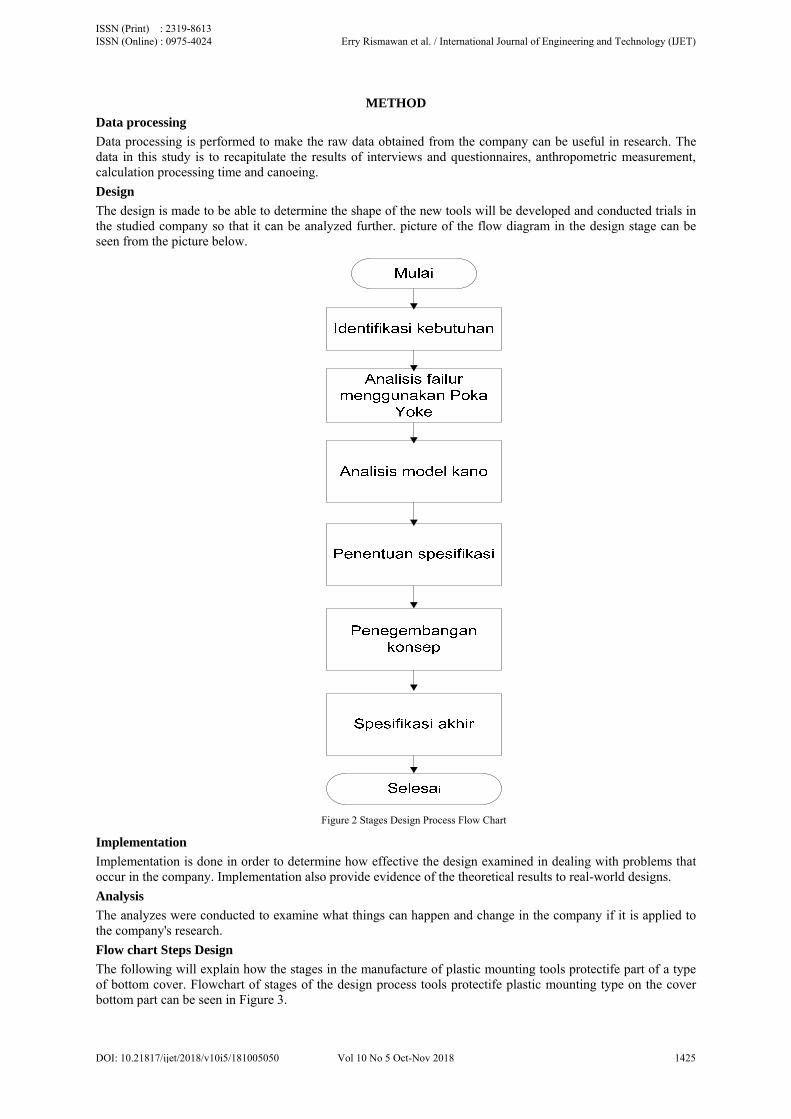
The design is made to be able to determine the shape of the new tools will be developed and conducted trials in the studied company so that it can be analyzed further. picture of the flow diagram in the design stage can be seen from the picture below.
Figure 2 Stages Design Process Flow Chart
Implementation
Implementation is done in order to determine how effective the design examined in dealing with problems that occur in the company. Implementation also provide evidence of the theoretical results to real-world designs.
Analysis
The analyzes were conducted to examine what things can happen and change in the company if it is applied to the company's research.
Flow chart Steps Design
The following will explain how the stages in the manufacture of plastic mounting tools protectife part of a type of bottom cover. Flowchart of stages of the design process tools protectife plastic mounting type on the cover bottom part can be seen in Figure 3.
ISSN (Print) : 2319-8613 ISSN (Online) : 0975-4024 Erry Rismawan et al. / International Journal of Engineering and Technology (IJET)
DOI: 10.21817/ijet/2018/v10i5/181005050 Vol 10 No 5 Oct-Nov 2018 1425

Figure 3. Flow Chart Steps Planning
Identification and Analysis of Needs
The tools will be made should meet the following criteria:
1. Easy to use 2. Simple, it takes a big place 3. easily moved 4. In accordance with the functions and needs
Study of literature
The study of literature is used to understand the basics of the theory related to the design of the tool, which is expected to provide an overview of design-making tool.
Map Of Hope
The conduct interviews orally to all workers of the complaints and needs of workers as well as the desired expectations of workers to achieve comfort while working.
Canoe
A diagram that divides the specifications of the customer into three types must be, one-dimensional and attractive and compared to the level where a specification through the attributes of consumer desires.
ISSN (Print) : 2319-8613 ISSN (Online) : 0975-4024 Erry Rismawan et al. / International Journal of Engineering and Technology (IJET)
DOI: 10.21817/ijet/2018/v10i5/181005050 Vol 10 No 5 Oct-Nov 2018 1426

Table 1Formulas In Kano Category Determination Of Data Questionnaire Fungtional And Disfungtional
Dysfungtional
consumer needs 1 2 3 4 5
like hope Neutral Tolerance Do not like
Fungtional
1. Likes Q A A A O
2. hope R I I I M
1. Neutral R I I I M
2. Tolerance R I I I M
3. Do not like R R R R Q
Thought Concept Design
Any thoughts or ideas that there is put into an initial design which is also called the sketch
Creating a Design Tool
After thinking about the design of the tool is then determined what kind of model to be created, then made a final design that is used as a reference in making tools.
Component Procurement
Components that there is no need to be provided as possible because it concerns the readiness tool. If there is one component that is not available then it will disturb terselesainya timely tool.
Toolmaking
Once everything is available, including tooling to be used, then the next step is pembutan or assembly tools. Normally this process will take a long time. If obstacles usually use a common workshop for accomplishing the manufacture of the tool with direct supervision in the field.
Trial Tools and Implementation on the Ground
This effort was conducted to determine the ability of the packaging tool dim sum into Styrofoam boxes that have been made, whether it meets the wishes or not. Trial conducted several times to get good results.
DATA COLLECTION AND PROCESSING
Finishing Process Standard Time Part
1. Determining the cycle time
The formula for calculating the cycle time (WS)
WS = N
Xi
WS = 15
39.12
17
662.85
17
542.71
16
203.75
18
120.78
WS = 92.91 sec / Process
2. Normal time (wn) Normal time obtained by providing cycle time adjustment factor. Normal time can be calculated using the formula:
Wn = wsxp
P = adjustment factor bootm cover part finishing process
+0.11 p = 1 or p = 1:11
Wn = 92.91 sec / finishing x 1:11 = 103.13 sec / finishing
3. standard time WB = Wn (1 +% leeway) L = allowances or allowance provided to workers Finishing Process Part Bottom Cover is 30%
WB = 103. 13 (1 + 30%)
WB = 134.06 sec / finishing
ISSN (Print) : 2319-8613 ISSN (Online) : 0975-4024 Erry Rismawan et al. / International Journal of Engineering and Technology (IJET)
DOI: 10.21817/ijet/2018/v10i5/181005050 Vol 10 No 5 Oct-Nov 2018 1427

Body anthropometry 1. Precentil value (P 5) hand grips dimensions:
P 5 = X - (1,645 x σ) = 4:46 - (1,645 x 0.2)
2. Precentil Value Dimensions Height Elbow Stand: P 5 = X -μ (1,645 x σ)
= 102.2 - (1,645 x 1:48) = 98.62 cm
In Wrapping Process Design Tool Using this lower Precentil (P5) dikrenakan in the design tools standing posture and require suppression while working. To calculate tingggi table and diameter hand grip with a normal distribution of data may be used by the formula: Z = (X-μ) / σ X = Z x σ + μ
Where : Z is the z value in a normal distribution z table μ is an average measurement σ is the standard deviation X is the value precentil
1. Hand grip diameter: σ = 0.2 cm μ = 4:46 cm 4:13 Precentil%, then the value of z in the table z = -1.73 X = (-1.73 x 0.2 cm) + 4:46 cm X = 4.1 cm Then roll the handle diameter is 4.1 cm foam
Elbow High Standing
σ = 1:48 cm μ = 102.2 cm Precentil 98.62%, then the value of z in the table z = 2.2 X = (2.2 x 1:48 cm) + 102.2 cm X = 105.45 cm Then the draft table height of 105.45 cm
Map of Left Hand Right Hand
Table 2.Map of the Left-Hand Right Hand
PETA AND LEFT HAND RIGHT HAND
Left hand Distance (Cm) Time (Seconds) Time (Seconds) Distance (Cm) Right hand
Total 130 cm 66 seconds 89 seconds 275 cm Total
Analysis Foka Yoke
Table 3.Analysis Foka-Yoke
No. Cause of the problem Securities Issues Solutions
1 Platik rolls decision and refund of the edge of the table
Operator fatigue, resulting slow motion
Creating a work tool as the ergonomic plastic rolls according to function
2 Plastic rolls are not in a fixed position
Movement of the right hand and left hand while unrolling the plastic is not optimal so it takes a lot of
Make a roll of plastic retainer that is designed according to the needs and size of the plastic rolls oprator
3 Part are not in a fixed position or a touch will move
Movement of the right hand not optimal so
Designing tools to facilitate workers perform wrapping packing part is that part in a fixed position.
4 Part is not in a fixed position
Pengalusan surfaces must be repeated because there are waves thereby increasing working time
Designing tools in order to work as a part daam fixed position
5 Position parts and plastic rolls are not fixed
The cutting process is not neat Designing a work tool in accordance with the size of the roll of plastic parts and also making it easier for operators to cut plastic daam in accordance with a predetermined size
ISSN (Print) : 2319-8613 ISSN (Online) : 0975-4024 Erry Rismawan et al. / International Journal of Engineering and Technology (IJET)
DOI: 10.21817/ijet/2018/v10i5/181005050 Vol 10 No 5 Oct-Nov 2018 1428

Analysis Methods Kano Determination of customer requirements through a survey conducted by using a questionnaire. CR is then divided by category attractive, one-dimentional and must be based on the sharing of satisfaction canoe models. Customer requirement against tools Bottom Cover Part Finishing process can be seen in Table 4.23.
Table 4. Customer Requirement (Cr) Against Aids Finishing Process Part Bottom Cover
No. Category Attribute
1 must be
The size is designed according to the specifications table part
Sebadan hook designed with a foam plastic wrap
Designed 95 cm high table of 10 -20 cm below the standing elbow height of the average worker
2 One dimensional
Points can be designed part in ride and lowered by using additional tools with the system up and down buttons
Place plastic wrap with a table designed sebadan
Place plastic wrap made of iron pipe
Order table is made of iron pipes
3 Atraktive Tablecloths made of rubber
Process Flow Map Process flow map using the type of process flow map is a map that describes the worker process flow work flow group of people.
Figure 4. Map Process Flow
ISSN (Print) : 2319-8613 ISSN (Online) : 0975-4024 Erry Rismawan et al. / International Journal of Engineering and Technology (IJET)
DOI: 10.21817/ijet/2018/v10i5/181005050 Vol 10 No 5 Oct-Nov 2018 1429

DESIGN AND ANALYSIS Finishing Tools Cover The Bottom Part
The needs of workers who are critical to the process of finishing the bottom part by using plastic cover protectife types are as follows:
1. Reducing the time workers during the wrapping process 2. Facilitate the process of wrapping. 3. Reducing the burden of power that comes out during the wrapping process.
Map Of Hope
Map of hope is made to find the design of tools finishing bottom cover part that is in the process of wrapping with plastic protectife type.
Table 5.Map of Hope Aid Finishing Process Part Bottom Cover
No. Complaint Needs Hope design 1 Parts hand pain
because it raised repeatedly protectife plastic gulugan
Wrapping tool bottom cover has a table laying and retaining the roll of plastic protectife
The tools have a strong table and lever retaining rolls
The tools have a strong table and plastic rolls Protectif retaining lever can rotate 360
3 Right hand and left arm stiff and sore
Retaining part bootm tools cover for wrapping process
Large is a table that can hold the part so as not to slide
Make a retaining table that will be subject hidrolic scaled with the help of water.
4 Parts of the left and right shoulder soreness due to the high table does not fit the needs of workers
Tools which have high ergonomic packaging
According to the item table used so that workers need not lowered position.
High in the design table after measuring the data antopometri standing elbow height.
5 Pain in the hands Part surface Pengalusan tools already in wrapping
Smoothing tool is made in the form of roll
Tools made of roll that can rotate 360
From the map expectation wrapping tools cover the bottom part can be known design tools to be expected by the workers in order to help overcome physical complaints suffered by workers and reduce work time obtained from the calculation has been done before
There are four very important part in the design of this tool are:
1. Vertical lever on the end of the table, its function is to hold rolls of plastic and designed to rotate 360 degrees.
2. Triplex board at the top of the table as the bottom part retaining cover to be wrapping. 3. hidroulic water to remove the part that was already in triplex board, it is easy for the operator to take
part are already attached to the triplex board equipped with up and down buttons. 4. Perforated pipe at the end of the table as a foam roll
Concept testing proposal Concept testing in this study conducted by creating a tool based on the design that has been determined and can be immediately used and tested that in the eternal as a working prototype. The purpose of making a working prototype is to do the implementation while the mill and can do the analysis of the prototype. The purpose is to obtain the temporary implementation of standard time of prototypes and can be directly compared to the time before the finishing process.
ISSN (Print) : 2319-8613 ISSN (Online) : 0975-4024 Erry Rismawan et al. / International Journal of Engineering and Technology (IJET)
DOI: 10.21817/ijet/2018/v10i5/181005050 Vol 10 No 5 Oct-Nov 2018 1430

Figure 5. Implementation of the Concept Proposal
Determination Standard Time Using Result Finishing Process Design Tool Part Bottom Cover.
1. Calculating the Cycle Time After pass the test the adequacy of the data that has been getting from the measurement results of each element of the process of bottom cover part. Next calculate the cycle time.
WS = N
Xi
WS = 18
37.49
19
325.02
16
386.82
17
172.40
16
69.42
WS = 57 832 sec / Process
2. Calculating Time Normal Normal time obtained by providing cycle time adjustment factor. Normal time can be calculated using the formula: Wn = wsxp P = adjustment factor finishing process bootm cover part of +0.11 p = 1 or p = 1:11 Then the normal time is as follows: Wn = 57 832 sec / finishing x 1:11 = 64.19 sec / finishing 3. Calculating Standard Time Standard time is the normal time given leeway. Calculating the standard time using the following formula. Wb = Wn (1 + L) L = allowances or allowance provided to workers Finishing Process Part Bottom Cover is 30%
ISSN (Print) : 2319-8613 ISSN (Online) : 0975-4024 Erry Rismawan et al. / International Journal of Engineering and Technology (IJET)
DOI: 10.21817/ijet/2018/v10i5/181005050 Vol 10 No 5 Oct-Nov 2018 1431
WB = Wn (1 +% leeway) WB = 64.19 (1 + 30%) WB = 83 452 sec / finishing Changes in raw time before the usage of tools or manual labor and the use of tools after work. 1. The standard time manually = 132.06 seconds 2. The use of standard time working tools = 83 452 seconds 3. Decrease time = 48. 6 seconds
Analysis Map Right Hand and Left Hand Design Results
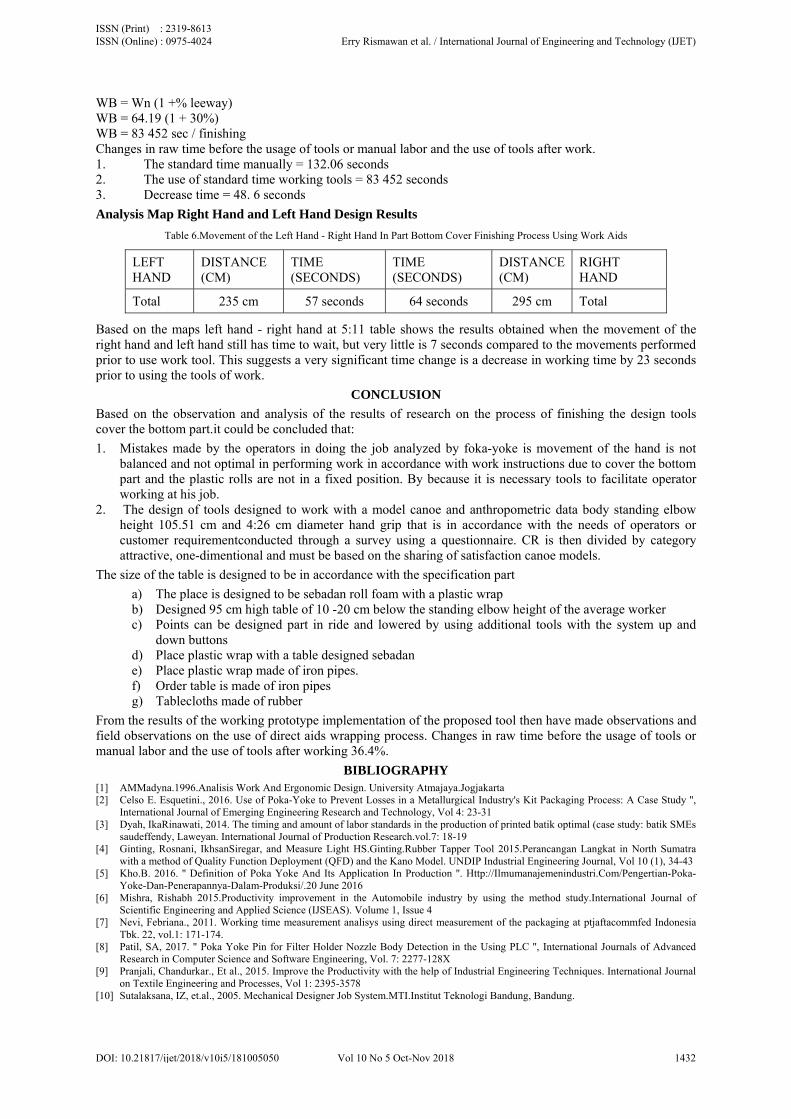
Table 6.Movement of the Left Hand - Right Hand In Part Bottom Cover Finishing Process Using Work Aids
LEFT HAND
DISTANCE (CM)
TIME (SECONDS)
TIME (SECONDS)
DISTANCE (CM)
RIGHT HAND
Total 235 cm 57 seconds 64 seconds 295 cm Total
Based on the maps left hand - right hand at 5:11 table shows the results obtained when the movement of the right hand and left hand still has time to wait, but very little is 7 seconds compared to the movements performed prior to use work tool. This suggests a very significant time change is a decrease in working time by 23 seconds prior to using the tools of work.
CONCLUSION
Based on the observation and analysis of the results of research on the process of finishing the design tools cover the bottom part.it could be concluded that:
1. Mistakes made by the operators in doing the job analyzed by foka-yoke is movement of the hand is not balanced and not optimal in performing work in accordance with work instructions due to cover the bottom part and the plastic rolls are not in a fixed position. By because it is necessary tools to facilitate operator working at his job.
2. The design of tools designed to work with a model canoe and anthropometric data body standing elbow height 105.51 cm and 4:26 cm diameter hand grip that is in accordance with the needs of operators or customer requirementconducted through a survey using a questionnaire. CR is then divided by category attractive, one-dimentional and must be based on the sharing of satisfaction canoe models.
The size of the table is designed to be in accordance with the specification part
a) The place is designed to be sebadan roll foam with a plastic wrap b) Designed 95 cm high table of 10 -20 cm below the standing elbow height of the average worker c) Points can be designed part in ride and lowered by using additional tools with the system up and
down buttons d) Place plastic wrap with a table designed sebadan e) Place plastic wrap made of iron pipes. f) Order table is made of iron pipes g) Tablecloths made of rubber
From the results of the working prototype implementation of the proposed tool then have made observations and field observations on the use of direct aids wrapping process. Changes in raw time before the usage of tools or manual labor and the use of tools after working 36.4%.
BIBLIOGRAPHY [1] AMMadyna.1996.Analisis Work And Ergonomic Design. University Atmajaya.Jogjakarta [2] Celso E. Esquetini., 2016. Use of Poka-Yoke to Prevent Losses in a Metallurgical Industry's Kit Packaging Process: A Case Study '',
International Journal of Emerging Engineering Research and Technology, Vol 4: 23-31 [3] Dyah, IkaRinawati, 2014. The timing and amount of labor standards in the production of printed batik optimal (case study: batik SMEs
saudeffendy, Laweyan. International Journal of Production Research.vol.7: 18-19 [4] Ginting, Rosnani, IkhsanSiregar, and Measure Light HS.Ginting.Rubber Tapper Tool 2015.Perancangan Langkat in North Sumatra
with a method of Quality Function Deployment (QFD) and the Kano Model. UNDIP Industrial Engineering Journal, Vol 10 (1), 34-43 [5] Kho.B. 2016. '' Definition of Poka Yoke And Its Application In Production ''. Http://Ilmumanajemenindustri.Com/Pengertian-Poka-
Yoke-Dan-Penerapannya-Dalam-Produksi/.20 June 2016 [6] Mishra, Rishabh 2015.Productivity improvement in the Automobile industry by using the method study.International Journal of
Scientific Engineering and Applied Science (IJSEAS). Volume 1, Issue 4 [7] Nevi, Febriana., 2011. Working time measurement analisys using direct measurement of the packaging at ptjaftacommfed Indonesia
Tbk. 22, vol.1: 171-174. [8] Patil, SA, 2017. '' Poka Yoke Pin for Filter Holder Nozzle Body Detection in the Using PLC '', International Journals of Advanced
Research in Computer Science and Software Engineering, Vol. 7: 2277-128X [9] Pranjali, Chandurkar., Et al., 2015. Improve the Productivity with the help of Industrial Engineering Techniques. International Journal
on Textile Engineering and Processes, Vol 1: 2395-3578 [10] Sutalaksana, IZ, et.al., 2005. Mechanical Designer Job System.MTI.Institut Teknologi Bandung, Bandung.
ISSN (Print) : 2319-8613 ISSN (Online) : 0975-4024 Erry Rismawan et al. / International Journal of Engineering and Technology (IJET)
DOI: 10.21817/ijet/2018/v10i5/181005050 Vol 10 No 5 Oct-Nov 2018 1432

[11] Singh, MP, 2016. Improvement in process industries by using work study methods: a case study. International Journal of Mechanical Engineering and Technology (IJMET).Vol 7 No. 426-236 3.Hal
[12] VekariyaAnkit P., Ashutosh Kumar. 2015. Productivity Improvement of Manufacturing Process of Diesel Engine by Time and Motion Study Method (MOST Technique). International Journal of Advanced Engineering and Research Development .Vol 2 3 things 426-436.
[13] Wignjosoebroto Sritomo.2000. Ergonomics and Time Motion Study. Publisher WidyaGuna, Surabaya [14] Yohanes.A. Pressing Jenang 2015. Equipment Design And Ergonomics With Anthropometri method. Dynamics of Mechanical .Vol
IX, No. 2 things 1-7
ISSN (Print) : 2319-8613 ISSN (Online) : 0975-4024 Erry Rismawan et al. / International Journal of Engineering and Technology (IJET)
DOI: 10.21817/ijet/2018/v10i5/181005050 Vol 10 No 5 Oct-Nov 2018 1433