Embed Size (px)
Citation preview
Toolbox for Improving Program Processes and Health and Housing
Outcomes:
Experiences of the NYSDOH Lead Primary Prevention Program
Panelists
Moderator:
Amy Murphy, MPH,
Consultant & TA Provider to the NCHH & NYSDOH
Panelists:• Cathe Bullwinkle, Oneida County Health Department• Debra Lewis, Onondaga County Health Department
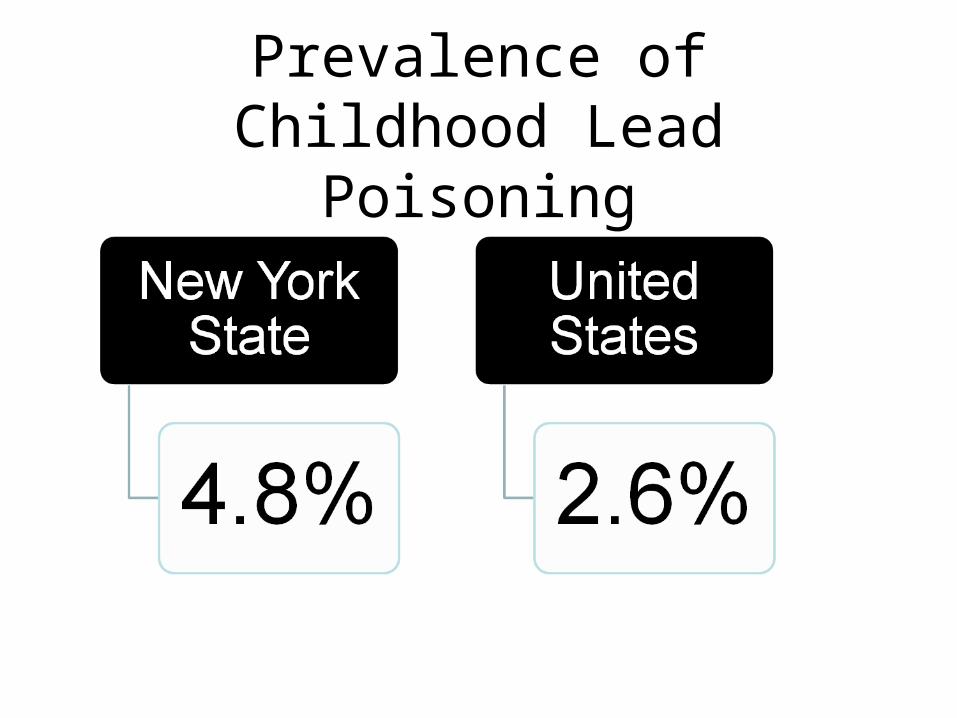
Prevalence of Childhood Lead Poisoning

NY State CLPPP
8 original pilot locations funded in 2007
Year Funding Amount
2007-2008 $3 million
2008-2009 $5 million
2009-2010 $7.7 million
2010-20112012-2013
$10 million15 grantees operating through 2013
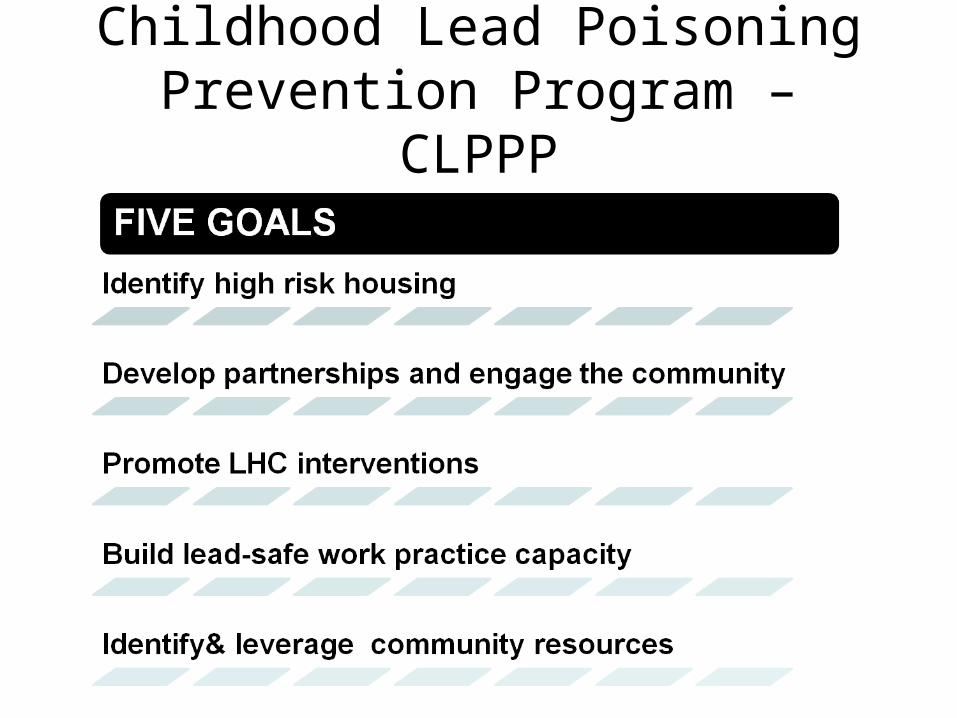
Childhood Lead Poisoning Prevention Program – CLPPP
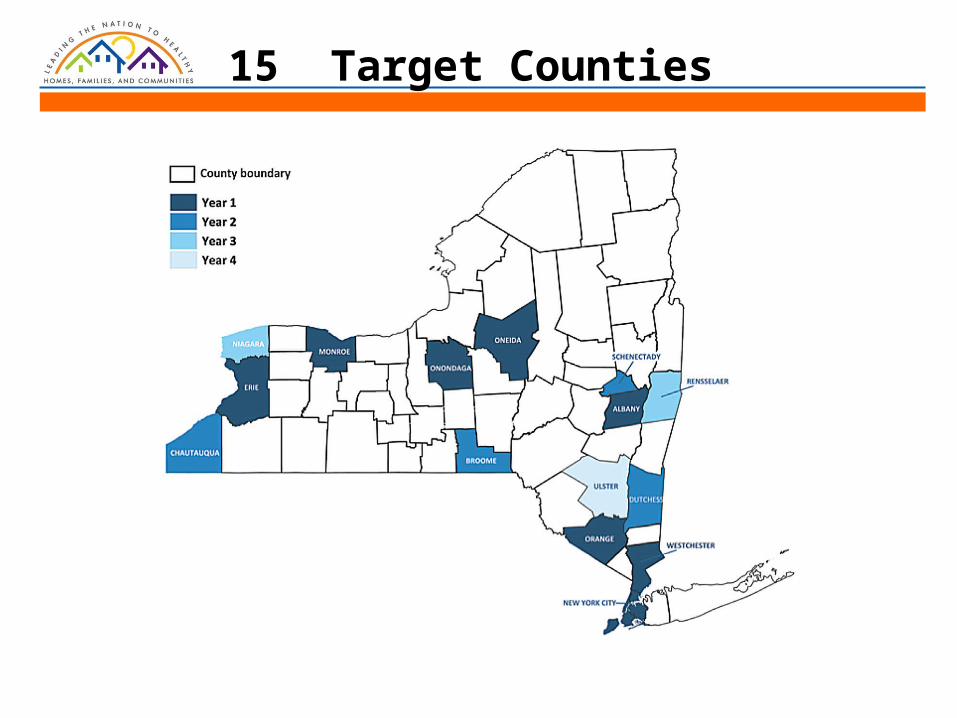
15 Target Counties

NCHH
• Provides technical & evaluation assistance
• Grantees required to conduct cost analysis and/or outcomes evaluation
Technical Assistance Briefs
• Cost Analysis Templates & Guidelines
• Effectiveness of targeting high risk blocks
• Post-remediation follow-up
• Projecting the burden of exposure in areas with low screening rates
Approaches to Cost Analysis
•Cost of Illness: Economic burden of a disease
•Cost Analysis: Value of the resources required to implement an intervention
•Cost-Effectiveness Analysis: Costs saved because an adverse health condition was prevented
•Cost-Benefit Analysis: Net benefit determined by subtracting the monetary benefit (averted adverse health or environmental outcomes) from the cost of the intervention
Cost Analysis• Health Care Expenditures
• Special Education
• Juvenile Delinquency
• Early Intervention Program
• Cost of Program Services
• Benefit of Window Replacement
• IQ & Lifetime Earnings Loss
• Return on investment

Cost of Illness
Magnitude of a public health problem in monetary terms
Medical, nonmedical, social and educational costs
Potential savings associated with an implementing an intervention
Health Care & Public Costs
• Direct health care costs of lead poisoning:– Screening
– Medical Management
– Nursing Case Management
– Environmental Services
• 2006 Consumer Price Index• Conservative estimates• Includes only direct medical
costs for children
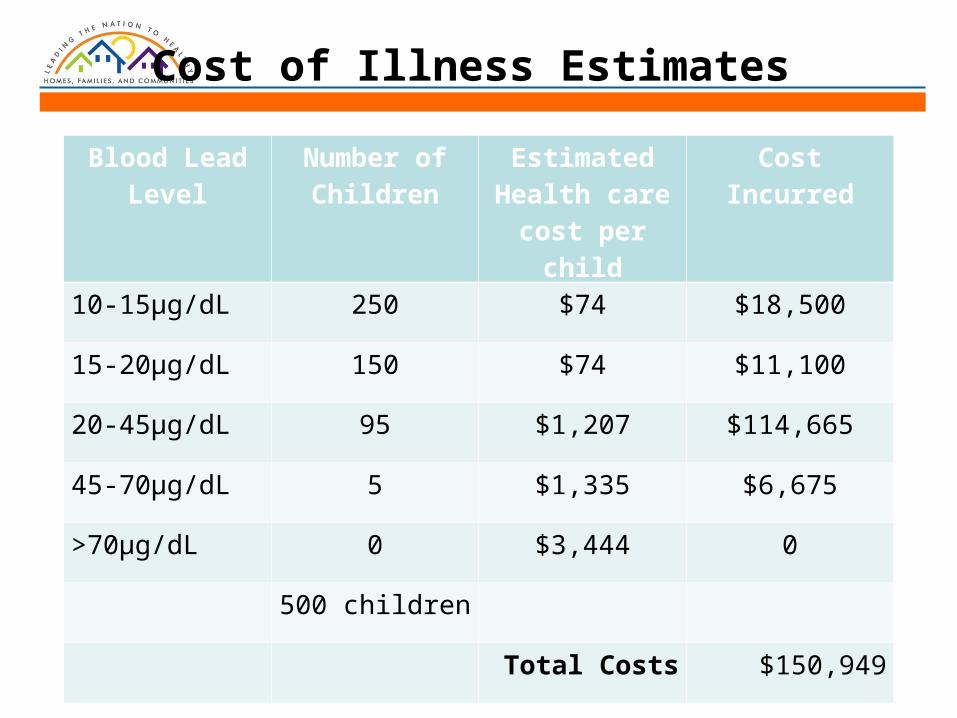
Cost of Illness Estimates
Blood Lead Level Number of Children
Estimated Health care cost per
child
Cost Incurred
10-15µg/dL 250 $74 $18,500
15-20µg/dL 150 $74 $11,100
20-45µg/dL 95 $1,207 $114,665
45-70µg/dL 5 $1,335 $6,675
>70µg/dL 0 $3,444 0
500 children
Total Costs $150,949
Special Education Expenditures
• Impaired neurobehavioral function
• 20% of children with blood lead levels >25 µg/dL will need special education.
• School districts have average annual cost of special education
• Standard Education: $8,322 Special Education: $14,317
• Differential: $5,995
• Three years of special education needed on average
Juvenile Delinquency
• Estimated that 10% of juvenile delinquency may be attributed to lead poisoning.
• $34,000 per year to incarcerating youth.
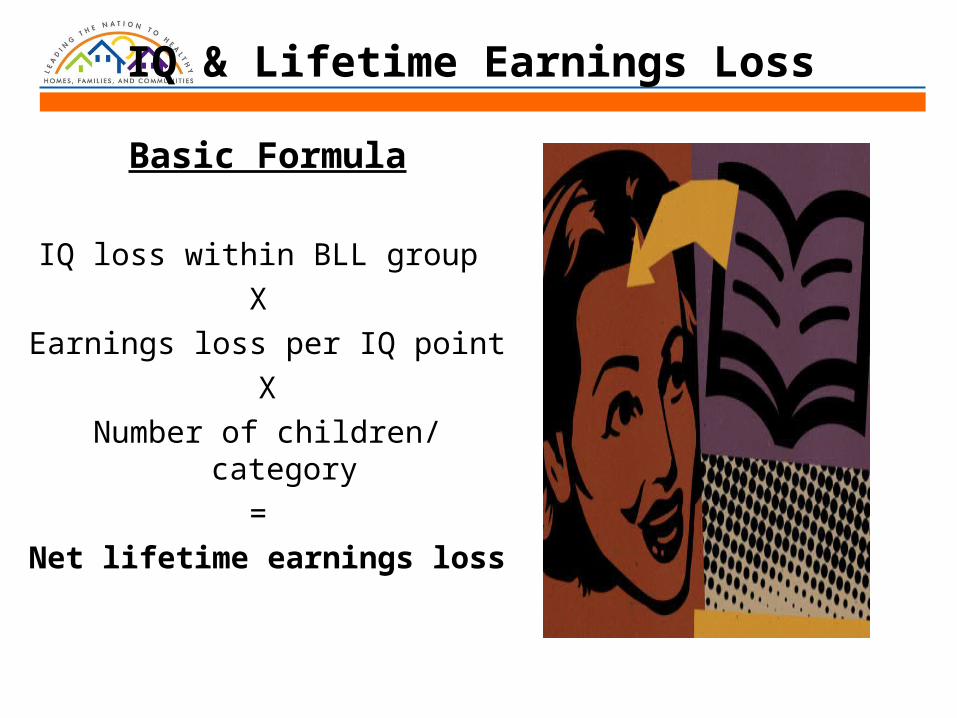
IQ & Lifetime Earnings Loss
Basic Formula
IQ loss within BLL group
X
Earnings loss per IQ point
X
Number of children/ category
=
Net lifetime earnings loss
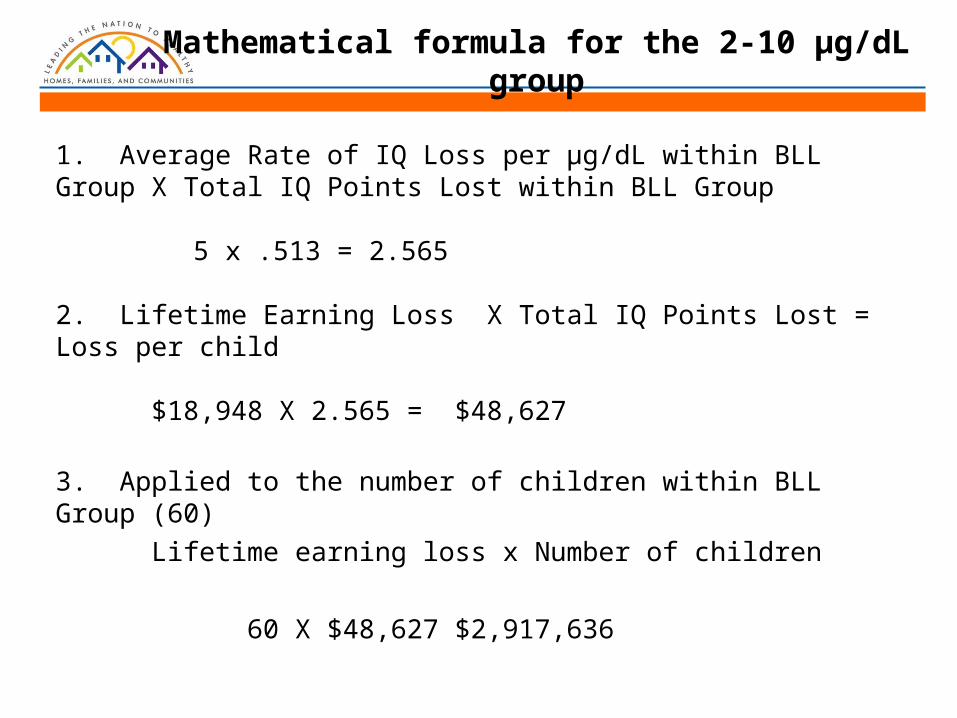
Mathematical formula for the 2-10 µg/dL group
1. Average Rate of IQ Loss per µg/dL within BLL Group X Total IQ Points Lost within BLL Group
5 x .513 = 2.565
2. Lifetime Earning Loss X Total IQ Points Lost = Loss per child
$18,948 X 2.565 = $48,627
3. Applied to the number of children within BLL Group (60)
Lifetime earning loss x Number of children
60 X $48,627 $2,917,636

IQ and Lifetime Earnings Loss
Blood lead level
Number of Children
(Prevalence)
Average Blood Lead
Level
Average Rate of IQ Loss per
µg/dL within BLL Group
Total IQ Points Lost within BLL
Group
Lifetime Earning Loss within BLL
Group($18,958, x
Total IQ Points Lost)
Applied to the number of children within BLL Group
(Lifetime earning loss x number of children)
2-10 µg/dL 60 5 .513 2.565 $48,627 $2,917,636
10-20 µg/dL 40 15 .19 6.08 $115,265 $4,610,586
>20 µg/dL 10 20 .11 7.03 $133,275 $1,332,747
110 Net lifetime earnings loss $8,860,969
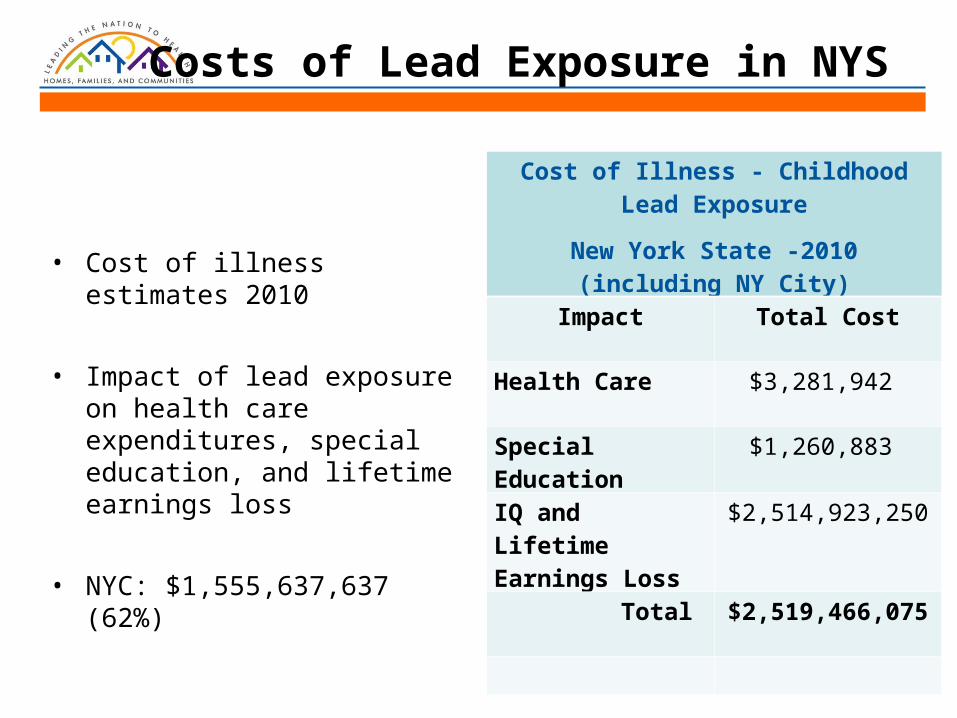
Costs of Lead Exposure in NYS
• Cost of illness estimates 2010
• Impact of lead exposure on health care expenditures, special education, and lifetime earnings loss
• NYC: $1,555,637,637 (62%)
Cost of Illness - Childhood Lead Exposure
New York State -2010 (including NY City)
Impact Total Cost
Health Care $3,281,942
Special Education $1,260,883
IQ and Lifetime Earnings Loss
$2,514,923,250
Total $2,519,466,075

Early Intervention
• Identify children served by EIP
• Eliminate those served due to other issues
• De-identify eligible children
• Extract & organize EIP service data
• Link EIP services to costs
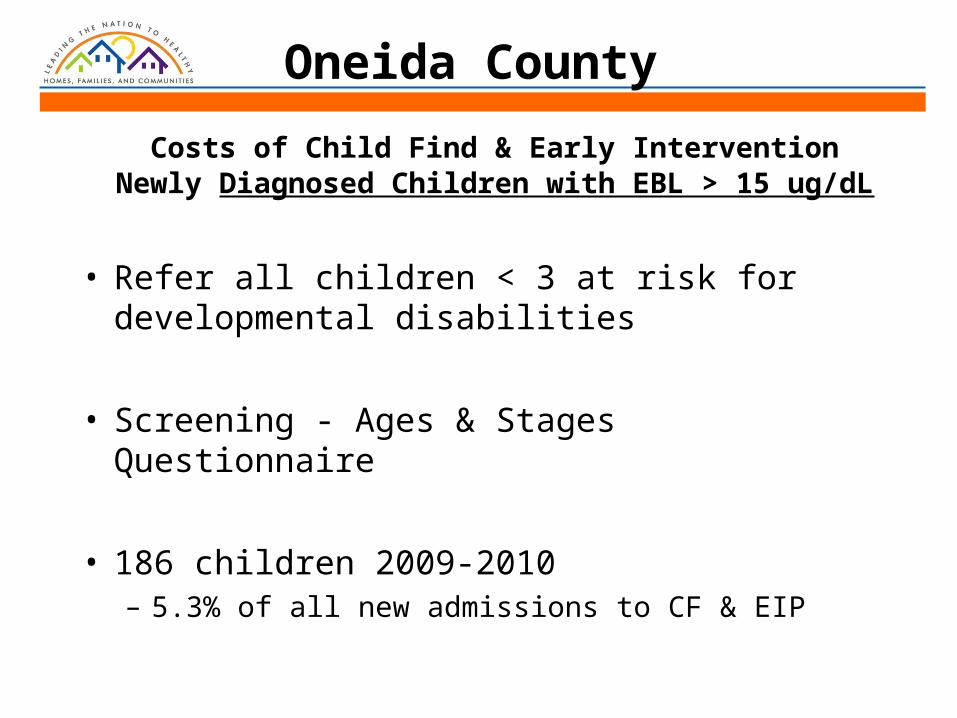
Oneida County
Costs of Child Find & Early Intervention Newly Diagnosed Children with EBL > 15 ug/dL
• Refer all children < 3 at risk for developmental disabilities
• Screening - Ages & Stages Questionnaire
• 186 children 2009-2010– 5.3% of all new admissions to CF & EIP
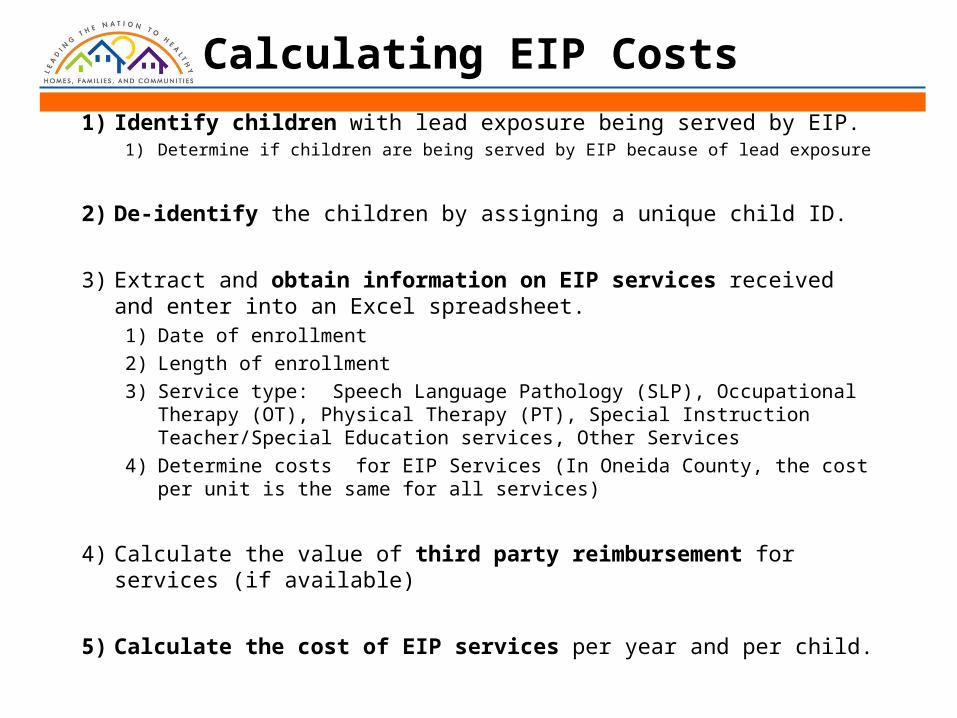
Calculating EIP Costs
1) Identify children with lead exposure being served by EIP. 1) Determine if children are being served by EIP because of lead exposure
2) De-identify the children by assigning a unique child ID.
3) Extract and obtain information on EIP services received and enter into an Excel spreadsheet.
1) Date of enrollment
2) Length of enrollment
3) Service type: Speech Language Pathology (SLP), Occupational Therapy (OT), Physical Therapy (PT), Special Instruction Teacher/Special Education services, Other Services
4) Determine costs for EIP Services (In Oneida County, the cost per unit is the same for all services)
4) Calculate the value of third party reimbursement for services (if available)
5) Calculate the cost of EIP services per year and per child.
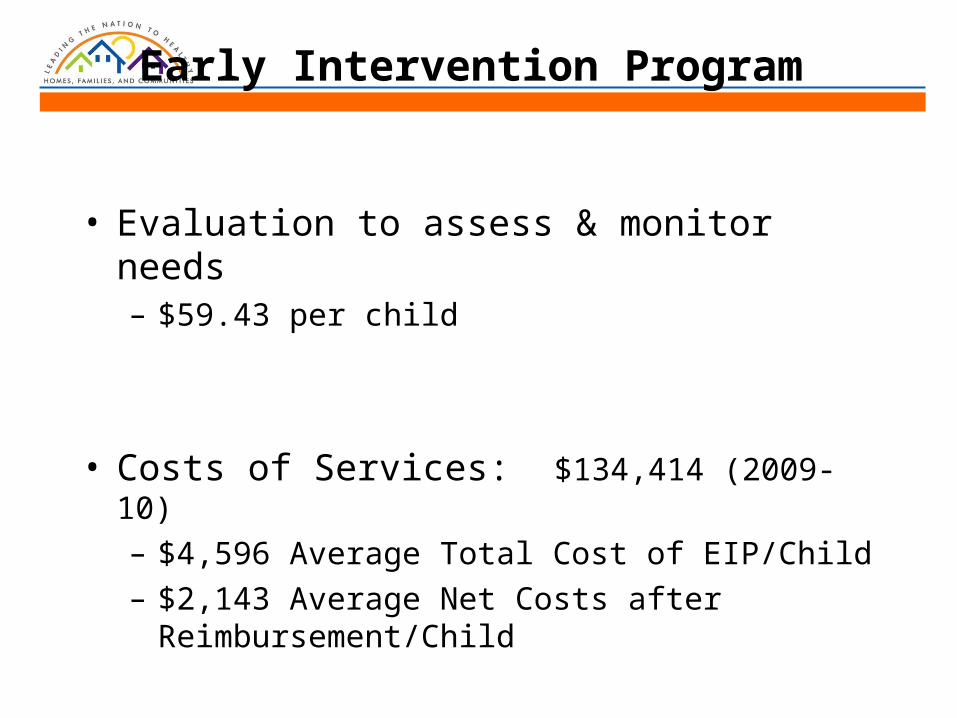
Early Intervention Program
• Evaluation to assess & monitor needs– $59.43 per child
• Costs of Services: $134,414 (2009-10)
– $4,596 Average Total Cost of EIP/Child– $2,143 Average Net Costs after
Reimbursement/Child

Services Provide/Cost Analysis
Services Cost Breakdown
Physical Therapy 77%
Occupational Therapy 16%
Speech Therapy 7%
Additional Efforts
• Cost of Illness Estimates 2009-11
• Prevalence Decreases in Target Areas– Quantify the impact of program efforts over
time

Onondaga
Compare EIP Costs:• Children identified with EBL > 5 ug/dL before
EIP enrollment
• Children identified with EBL > 5 ug/dL after EIP enrollment
• Children receiving EIP services who did not have an EBL
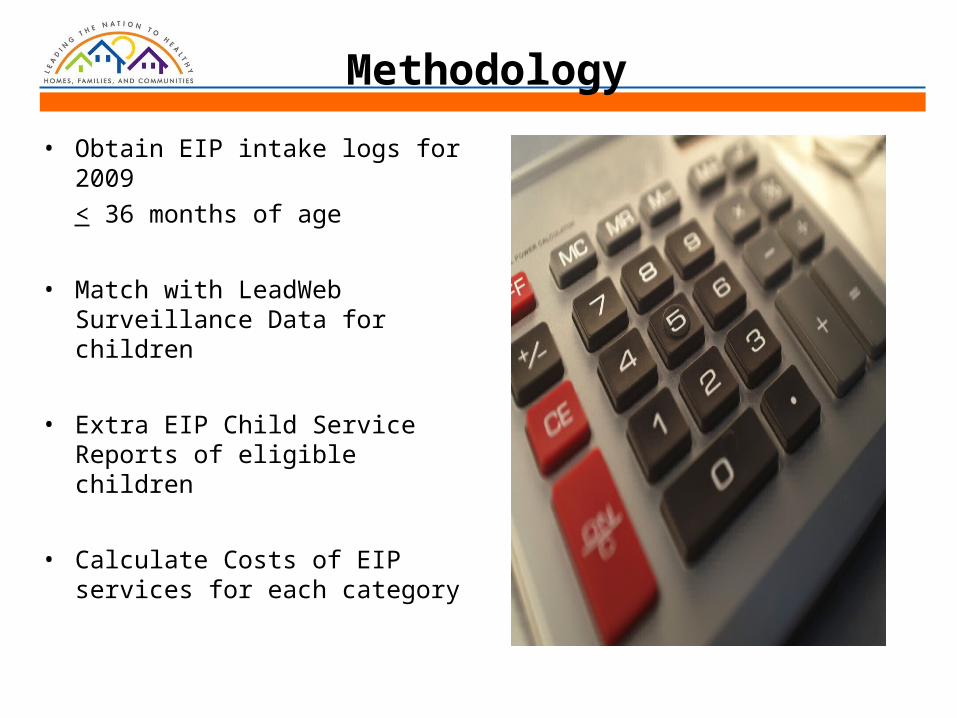
Methodology
• Obtain EIP intake logs for 2009
< 36 months of age
• Match with LeadWeb Surveillance Data for children
• Extra EIP Child Service Reports of eligible children
• Calculate Costs of EIP services for each category
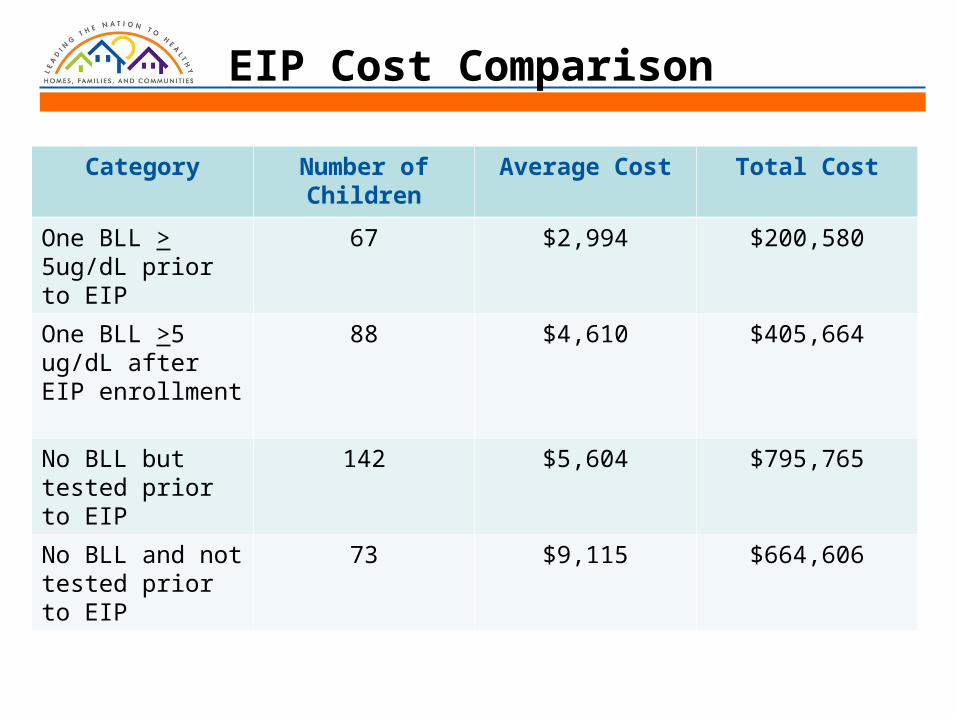
EIP Cost Comparison
Category Number of Children
Average Cost Total Cost
One BLL > 5ug/dL prior to EIP
67 $2,994 $200,580
One BLL >5 ug/dL after EIP enrollment
88 $4,610 $405,664
No BLL but tested prior to EIP
142 $5,604 $795,765
No BLL and not tested prior to EIP
73 $9,115 $664,606
Discussion of Findings
• Children without an EBL referred at an earlier age due to more severe delays and greater need for services?
• Would the findings have been different if used a threshold of 15 ug/dL?
• Need to control for age? Referral source?
• Look at multi-year service data?
LEAN QI Process
Goal: To study the enforcement process
Process Elements:•Process mapping•Visioning•Time studies•Policy review•Inclusion of staff at all levels
Issues of Concern
• Gaining access/contacting tenants• Multiple field visits• Clerical task duplication• Inefficient management of electronic
documents• Long compliance time frames• Hearing schedule backlog

Policy & Procedure Changes
• Updated tenant screening form
• Integration of enforcement efforts – – Combine hearing notice, order posting,
reinspections
• Notice & Information eliminated
• Policy on vacant properties
• Electronic case files and folders
Additional Efforts
• IQ & Lifetime Earnings Loss
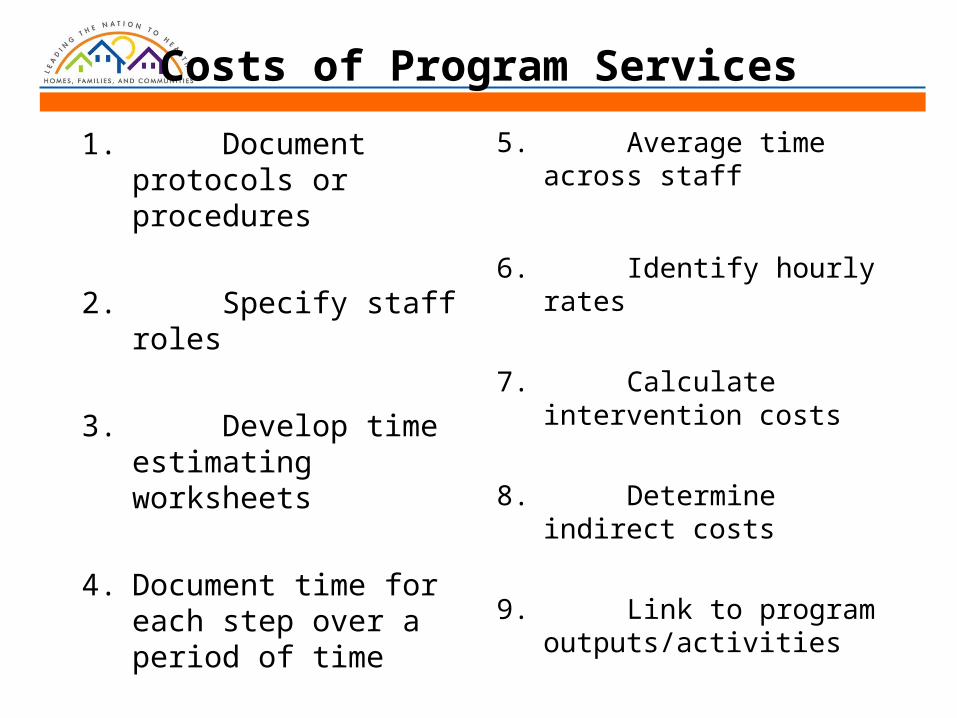
Costs of Program Services
1. Document protocols or procedures
2. Specify staff roles
3. Develop time estimating worksheets
4. Document time for each step over a period of time
5. Average time across staff
6. Identify hourly rates
7. Calculate intervention costs
8. Determine indirect costs
9. Link to program outputs/activities

Risk Assessment Costs by Type
Includes program activities from the time a housing unit is referred into the program thru dust wipe clearance.
Risk Assessment - No hazards identified: $235.17Risk Assessment - Hazards identified: $1,088.70 Risk Assessment – Enforcement: $1,366.22.*
Analysis: •When enforcement is needed the costs to the program increases, at a minimum, by $277.52. •This cost is incurred per hearing date. •Some cases have multiple hearing dates due to chronic non-compliance.
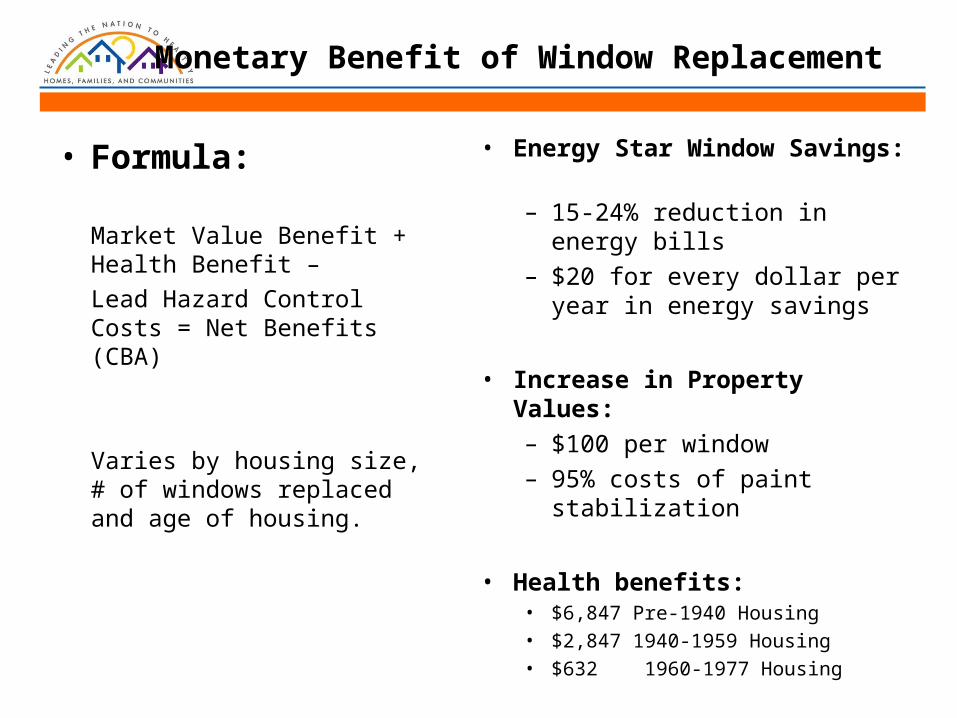
Monetary Benefit of Window Replacement
• Energy Star Window Savings: – 15-24% reduction in energy
bills– $20 for every dollar per year
in energy savings
• Increase in Property Values: – $100 per window– 95% costs of paint
stabilization
• Health benefits: • $6,847 Pre-1940 Housing• $2,847 1940-1959 Housing• $632 1960-1977 Housing
• Formula:
Market Value Benefit + Health Benefit –
Lead Hazard Control Costs = Net Benefits (CBA)
Varies by housing size, # of windows replaced and age of housing.

Data Required
Risk assessment costs
Window replacement costs
Paint stabilization costs
Cleanup and lead dust clearance costs
Number of windows replaced
Annual energy bill pre-lead hazard control

Monetary Benefit of Window Replacement
Costs 800 ft2
Attached7 Windows
1200 ft2
Detached10 Windows
1800 ft2
Detached16 Windows
Window Replacement $6,118 $9,684 $15,494
Weighted Average Interior Paint Stabilization $146 $146 $146
Weighted Average Exterior Paint Stabilization $291 $291 $291
Specialized Cleanup $386 $510 $510
Lead Dust Clearance Testing $175 $219 $219
Average Cost $7,116 $10,850 $16,660
Annual Energy Savings (15%-25%) $130-216 / yr $194-324 / yr $292-486 / yr
Market Value Benefits
Windows $5,485 $8,681 $13,890
Weighted Average Interior Paint Stabilization $144 $144 $144
Weighted Average Exterior Paint Stabilization $270 $270 $270
Average Market Value Benefit $5,899 $9,095 $14,304
Average Lead Hazard Reduction Benefit
Weighted Average in Pre-1940 Housing $6,847 $6,847 $6,847
Weighted Average in 1940–1959 Housing $2,847 $2,847 $2,847
Weighted Average in 1960–1977 Housing $632 $632 $632
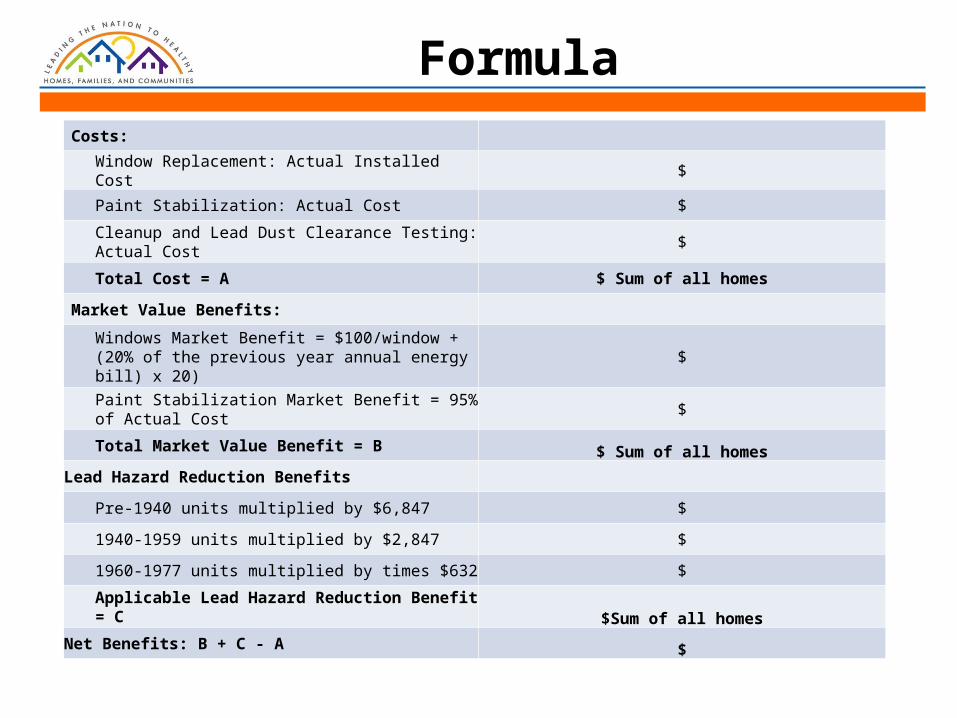
FormulaCosts:
Window Replacement: Actual Installed Cost $
Paint Stabilization: Actual Cost $
Cleanup and Lead Dust Clearance Testing: Actual Cost
$
Total Cost = A $ Sum of all homes
Market Value Benefits:
Windows Market Benefit = $100/window + (20% of the previous year annual energy bill) x 20)
$
Paint Stabilization Market Benefit = 95% of Actual Cost
$
Total Market Value Benefit = B $ Sum of all homes
Lead Hazard Reduction Benefits
Pre-1940 units multiplied by $6,847 $
1940-1959 units multiplied by $2,847 $
1960-1977 units multiplied by times $632 $
Applicable Lead Hazard Reduction Benefit = C$Sum of all homes
Net Benefits: B + C - A $
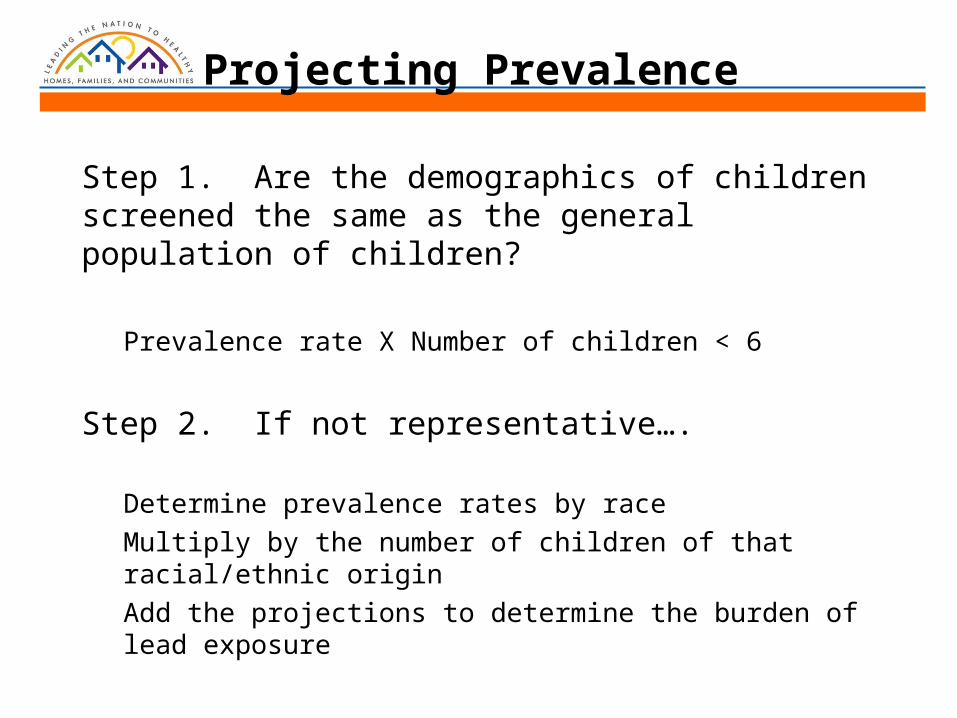
Projecting Prevalence
Step 1. Are the demographics of children screened the same as the general population of children?
Prevalence rate X Number of children < 6
Step 2. If not representative….
Determine prevalence rates by race
Multiply by the number of children of that racial/ethnic origin
Add the projections to determine the burden of lead exposure
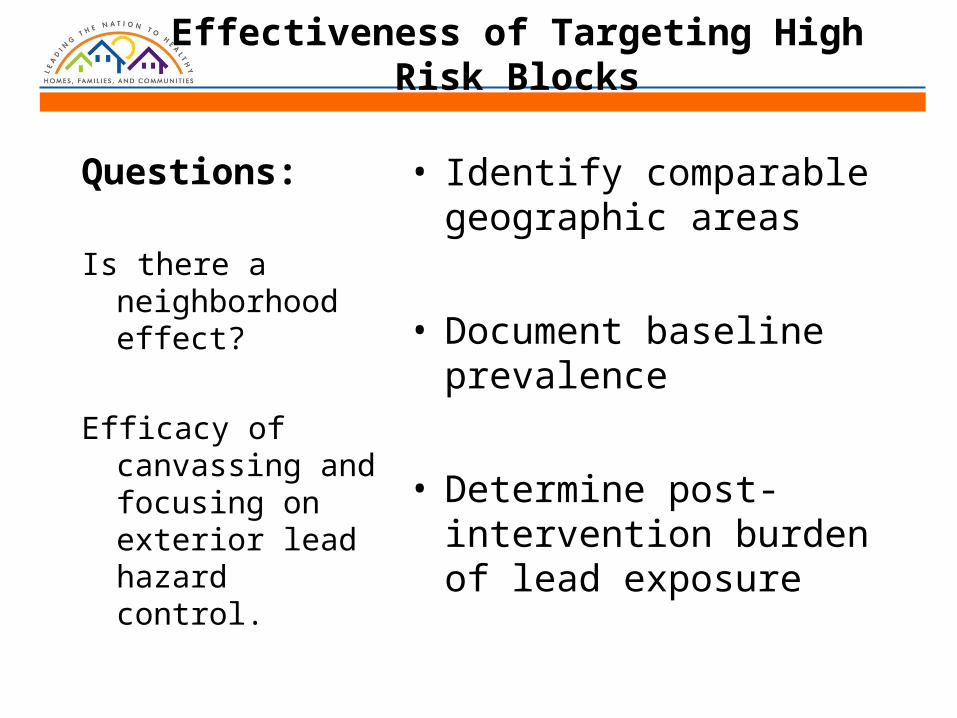
Effectiveness of Targeting High Risk Blocks
Questions:
Is there a neighborhood effect?
Efficacy of canvassing and focusing on exterior lead hazard control.
• Identify comparable geographic areas
• Document baseline prevalence
• Determine post-intervention burden of lead exposure

Post-remediation Follow-up
• How long to housing units remain lead safe?
• What is the level of maintenance after LHC and how important is it?
• What is the contribution of dust lead tracked in from outside sources?
• What is the value of a lead safe housing registry?
• How realistic are community-wide remediation targets?
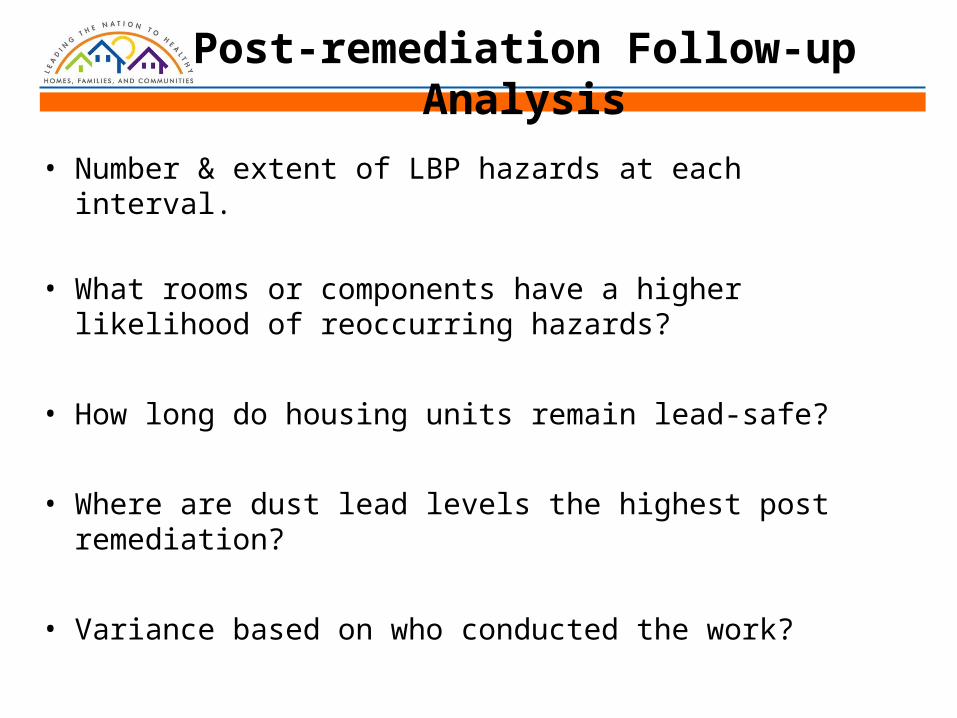
Post-remediation Follow-up Analysis
• Number & extent of LBP hazards at each interval.
• What rooms or components have a higher likelihood of reoccurring hazards?
• How long do housing units remain lead-safe?
• Where are dust lead levels the highest post remediation?
• Variance based on who conducted the work?
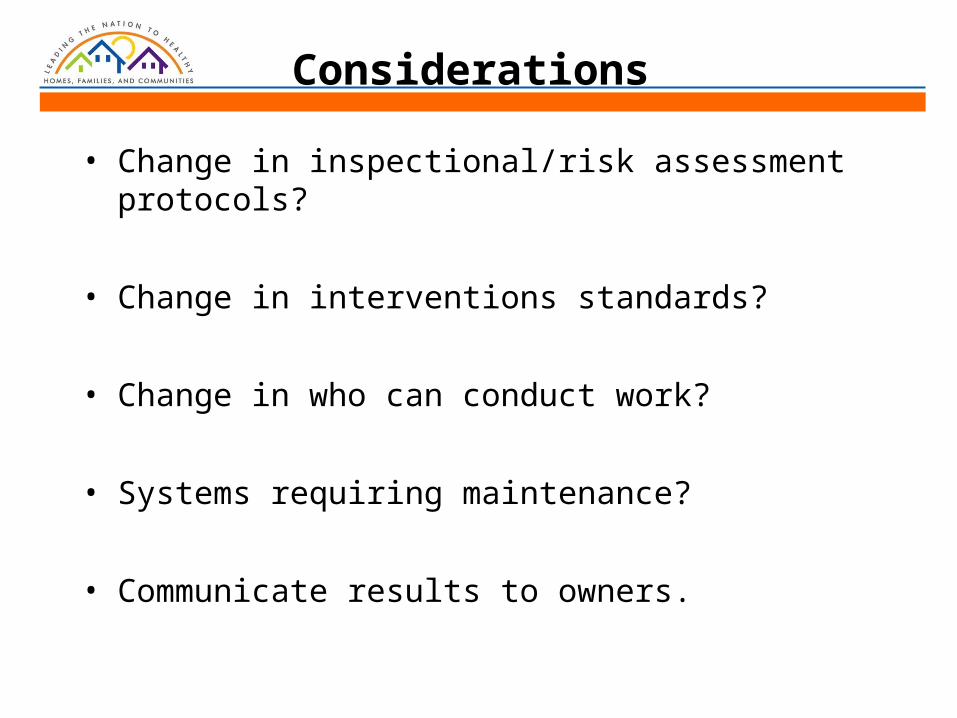
Considerations
• Change in inspectional/risk assessment protocols?
• Change in interventions standards?
• Change in who can conduct work?
• Systems requiring maintenance?
• Communicate results to owners.

Post-remediation Follow-up Options
• Comparison of baseline & post-remediation paint condition.
• Examination of post-remediation paint condition & dust levels.
• Comparison of baseline & post-remediation paint condition & dust levels.
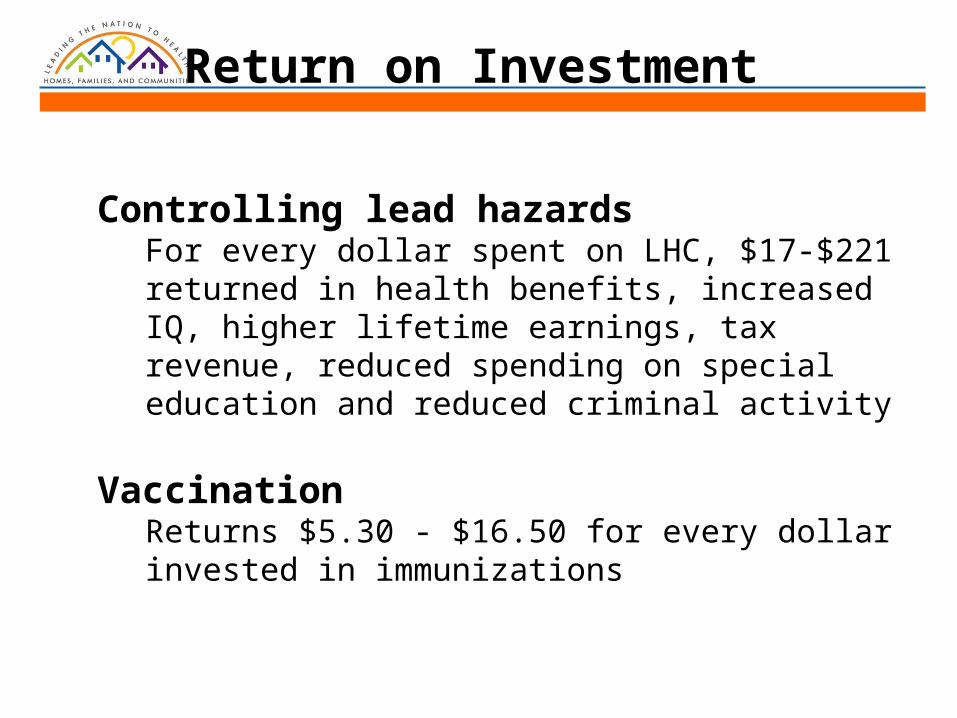
Return on Investment
Controlling lead hazardsFor every dollar spent on LHC, $17-$221 returned in health benefits, increased IQ, higher lifetime earnings, tax revenue, reduced spending on special education and reduced criminal activity
VaccinationReturns $5.30 - $16.50 for every dollar invested in immunizations
References
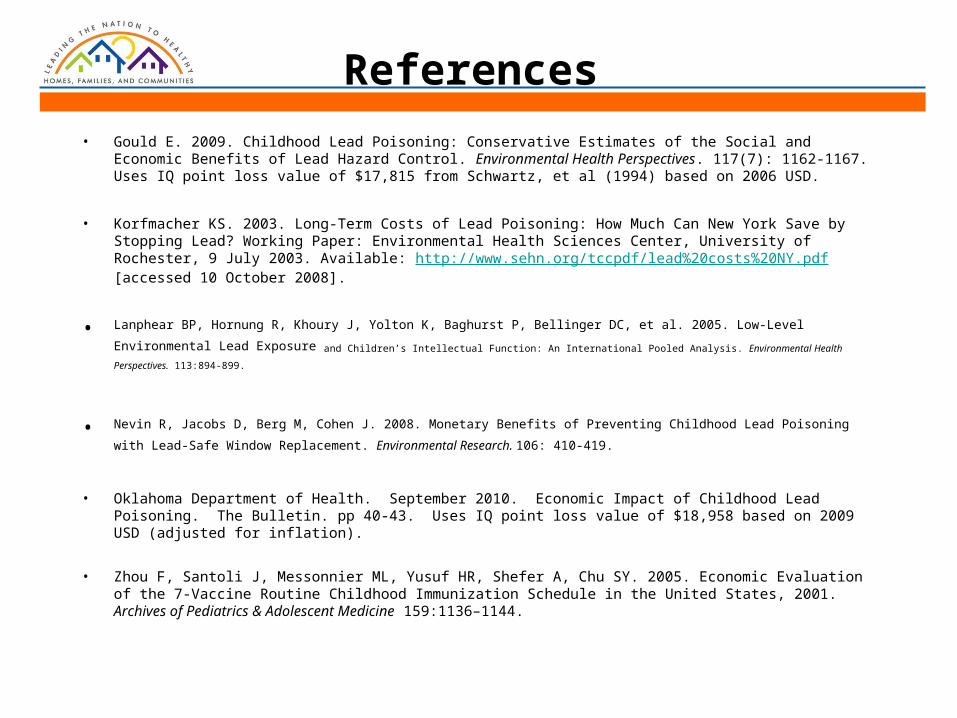
• Gould E. 2009. Childhood Lead Poisoning: Conservative Estimates of the Social and Economic Benefits of Lead Hazard Control. Environmental Health Perspectives. 117(7): 1162-1167. Uses IQ point loss value of $17,815 from Schwartz, et al (1994) based on 2006 USD.
• Korfmacher KS. 2003. Long-Term Costs of Lead Poisoning: How Much Can New York Save by Stopping Lead? Working Paper: Environmental Health Sciences Center, University of Rochester, 9 July 2003. Available: http://www.sehn.org/tccpdf/lead%20costs%20NY.pdf [accessed 10 October 2008].
• Lanphear BP, Hornung R, Khoury J, Yolton K, Baghurst P, Bellinger DC, et al. 2005. Low-Level Environmental Lead
Exposure and Children’s Intellectual Function: An Interna tional Pooled Analysis. Environmental Health Perspectives. 113:894-899.
• Nevin R, Jacobs D, Berg M, Cohen J. 2008. Monetary Benefits of Preventing Childhood Lead Poisoning with Lead-Safe
Window Replacement. Environmental Research. 106: 410-419.
• Oklahoma Department of Health. September 2010. Economic Impact of Childhood Lead Poisoning. The Bulletin. pp 40-43. Uses IQ point loss value of $18,958 based on 2009 USD (adjusted for inflation).
• Zhou F, Santoli J, Messonnier ML, Yusuf HR, Shefer A, Chu SY. 2005. Economic Evaluation of the 7-Vaccine Routine Child hood Immunization Schedule in the United States, 2001. Archives of Pediatrics & Adolescent Medicine 159:1136–1144.
Questions?