Embed Size (px)
Citation preview

5/17/2018 Tools - slidepdf.com
http://slidepdf.com/reader/full/tools-55ab58c08c20c 1/58
Ensign Manual
Draw Tools
Copyright © 2011 Ensign Software, Inc.

5/17/2018 Tools - slidepdf.com
http://slidepdf.com/reader/full/tools-55ab58c08c20c 2/58
Table of Contents
Draw Tools...................................................................................................................................3Overview.................................................................................................................................4
How to draw a Tool on a chart............................................................................................4 Adjusting a Tool..................................................................................................................5Changing the Line Color, Style, Markers, and Defaults.....................................................5Repeat Mode......................................................................................................................5Copy Mode.........................................................................................................................5
Properties................................................................................................................................6Tabs....................................................................................................................................7Removing a Line.................................................................................................................7Slope of a Line....................................................................................................................8
Alarmed Lines.........................................................................................................................9Description................................................................................................................................10
Alan Square..........................................................................................................................10 Andrew Pitchfork...................................................................................................................12Circle.....................................................................................................................................14Cycles...................................................................................................................................16Daily Price Lines...................................................................................................................18Draw Line..............................................................................................................................20Fibonacci Cycle.....................................................................................................................22Fibonacci Levels...................................................................................................................23Fibonacci Retrace.................................................................................................................28Fibonacci Ruler .....................................................................................................................29Formations............................................................................................................................32
Gann Fan..............................................................................................................................34Gann Square.........................................................................................................................36Gartley Butterfly....................................................................................................................39Linear Regression.................................................................................................................42Marker ...................................................................................................................................45Notes.....................................................................................................................................47Parallel Lines........................................................................................................................49Pyrapoint...............................................................................................................................51Speed Lines..........................................................................................................................54Support & Resistance...........................................................................................................55
2

5/17/2018 Tools - slidepdf.com
http://slidepdf.com/reader/full/tools-55ab58c08c20c 3/58
Ensign Draw Tools
Draw ToolsClick the Draw Tools button to display a list of draw tools. Click on atool on the list to add the tool to the chart. The cursor will change toa pencil and you then proceed to construct the tool on the chart byclicking at its construction points. Click elsewhere on the chart to'Finish' the tool.
Hide - Uncheck the Hide check box to keep the Draw Tools panelshowing after a tool has been selected. This permits multiple tools tobe quickly added to the chart. Check the Hide box to close the DrawTools panel after a tool has been selected.
Magnet – Check the Magnet check box to activate the price Magnetfeature. When the Magnet is activated the mouse cursor will snap tothe closest High, Low, Close, or Open price while applying or adjusting
tools on a chart. For example, the Magnet enables you to apply linesand tools exactly on the High or Low price of a bar.
Properties - Click the Properties button to configure which tools areto be shown or hidden on the Draw Tools panel. You may want todisplay only those tools that you use. Click the Save button thatreplaces the Properties button to save the changes.
Help - Click the Help button to open the Draw Tools Manual withinstructions on how to draw a tool on a chart.
Close - Click the red X button to close the Draw Tools panel.
Tip: The Draw Tools form can be sized so only the icons show.
3

5/17/2018 Tools - slidepdf.com
http://slidepdf.com/reader/full/tools-55ab58c08c20c 4/58
Overview
Ensign has an impressive arsenal of Draw Tools. The tools are versatile and easy to use.Draw Tools can be used to indicate support and resistance levels, channel lines, circles,shapes, Pyrapoint, Elliott, Gann, Fibonacci, moon phases, and a variety of price and timeforecasts.
How to draw a Tool on a chart
• Open a Chart and click on the Draw Tools button on the chart's toolbar.
• Click on the desired tool on the Draw Tools panel. The mouse cursor will change to aPencil shape as you move the mouse back over the chart. Each tool requires you toselect either 1, 2, or 3 draw points on the chart.
• Move the mouse to a desired starting point (1st draw point) and click the left mousebutton. If the tool requires 2 points (a start and end point), then move the mouse to the2nd point and click the left mouse button to mark point 2. If the tool requires 3 draw
points, then move the mouse to the 3rd
point and click the left mouse button to markpoint 3.
• Holding down the SHIFT key while moving the mouse or while clicking at the 2nd point,will force the 2nd point to be aligned horizontally or vertically with the 1st draw point.
• After selecting the required draw points for the tool, the tool will be in a 'Selected' state.Small square markers will appear at the draw points. To move a draw point to adifferent location on the chart, point the 'Pencil' cursor at one of the square markersand then hold down the left mouse button. Drag the marker to a new location. Tomove the entire tool, point the 'Pencil' cursor at a line segment between any of thedraw points, hold down the left mouse button and drag the line to a new location.
• Click elsewhere on the chart to 'Finish' the tool and remove the selection boxes.
4

5/17/2018 Tools - slidepdf.com
http://slidepdf.com/reader/full/tools-55ab58c08c20c 5/58
Adjusting a Tool
A tool must be selected before adjusting the location or properties of the tool. To select a tool,move the chart cursor and point at the draw points or the lines that connect the draw points,and then click the mouse. When the tool is selected, the chart cursor will change to a pencil,and square boxes will mark the tool's draw points. To adjust a draw point, drag the squaremarkers to a new location. To move a tool, while maintaining its orientation and size, drag a
line which connects draw points to a new location.
Changing the Line Color, Style, Markers, and Defaults
Right-click the mouse while a draw tool is selected to open the Draw Line properties window.
Repeat Mode
Ensign has an Repeat Mode for use with the draw tools. Repeat mode is where the draw toolwill continue to be drawn with mouse clicks without needing to reselect the draw tool.
While the cursor is a pencil, hold down the Ctrl key and start drawing the tool again. Releasethe Ctrl key and click elsewhere on the chart background to discontinue drawing tools.
Copy Mode
To copy an existing tool, select it so its draw points are marked by the small square boxes.Move the mouse to a new location and press the Space Bar key. The tool will be copied tothe new location, and retain its size and orientation.
5

5/17/2018 Tools - slidepdf.com
http://slidepdf.com/reader/full/tools-55ab58c08c20c 6/58
Properties
Each of the draw tools has a properties window that allows the user to customize the tool.The properties window can be viewed by clicking on the Chart Object button, selecting thetool, and clicking Properties. The following options appear in each properties window:
• Cancel Button - Click the Cancel button to abort any changes that have been made to the propertiesscreen, and close the window. No changes will appear on the draw line or study tool.
• Delete Button - Click the Delete button to remove this study or draw tool from the chart.
• Help - Click the Help button to display documentation for the tool.
• Video Button -Click the Video button to view a training video on the selected tool.
• Use as Default - Check the Use as Default box to save the current settings as the default for all
subsequent uses of the tool. • Draw Behind Bars – Check to draw the tool behind the bars. Uncheck to draw the tool above the bars.
• Privatize - Check the Privatize box to hide a draw tool's name and parameter settings. A chart will thendisplay the name of the draw tool as 'Custom'. This allows users to develop proprietary settings,systems, and layouts without disclosing the exact studies.
6

5/17/2018 Tools - slidepdf.com
http://slidepdf.com/reader/full/tools-55ab58c08c20c 7/58
Show - Check the Show box to display a particular Line feature. The Lines can be extended Ahead or Back.Custom Labels, Standard Deviation Channels, Percentage Channels, and Mirror lines can also be plotted. TheChannel Lines are drawn at either fixed Percentage amount above and below the original Line, or a multiple of the Standard Deviation above and below the original line. Specify the Percentage value in the 'Parameters'panel. Enter a value in the '%' entry box. For example, an entry of 4 would draw channel lines on both sides of the Line (4 percent above and 4 percent below the Line). Place a check mark in the 'Std. Dev. Channel' box todisplay parallel lines based on the Standard Deviation. An entry of 2 in the 'Mult' parameter will draw parallellines at 2 Standard Deviations from the original line. Each line can have an optional custom label. Enter some
text in the 'Custom Label' entry box. The label can be up to 8 characters.
Color - Click on the square Color boxes to select a color for the Line.
Style - Select a Line Style from the Style drop-down lists.
Left Side - Markers can be plotted on the Left Side of the Line.
Right Side - Markers can be placed on the Right Side of the Line.
Horizontal - Place a check mark in the 'Horizontal' box to force a horizontal line to be plotted.
Lock Length - Check the Lock Length box to prevent a line from being adjusted in length (after its initialplacement on the chart). This allows you to re-select a line and move the line around a chart, while alwaysmaintaining a constant line length.
Slope - If desired, you can manually enter the Slope of the line.
Price - If desired, you can manually enter the Price of the line starting point.
Extend Multiplier - The Extend Multiplier is used to lengthen or shorten the line extensions.
Alarmed – Select one of the sound bullets to activate an Alert for the selected line. The alert will trigger eachtime the market price crosses above or below the line in either direction. The line alert sound will use the alertsound settings from the Price Alerts window. Click the Alerts button on the main toolbar to change the alertsounds and settings. The alert banner will use the Font and Panel color selections.
Tabs
There are 15 Tabs at the bottom of the Draw Line Properties window. These Tabs allow youto save 15 different Line options. Select a Tab to load a previously save Line setting. If your mouse has a Mouse-Wheel, you can spin the Mouse-Wheel up or down while a Line isselected to switch between the TAB settings. To copy a Tab setting to a different Tab, displaythe Tab setting that you want to copy. Then, click the Copy Tab button. Then, click the Tabthat you want to copy to. This will copy the original Tab to the new Tab.
Removing a Line
Click the Delete button in the Draw Line properties window to remove the selected Line. Youcan also press the Delete key while the line is selected.
The Chart toolbar also has a Remove Tool button with a garbage can image. Click this buttonto remove draw tools in the reverse order from how they were added to the chart. The tooldrawn last will be the next tool removed when this Remove Tool button is clicked. This buttonwill not remove studies from the chart.
7

5/17/2018 Tools - slidepdf.com
http://slidepdf.com/reader/full/tools-55ab58c08c20c 8/58
Slope of a Line
Slope is defined as the Rise over the Run (Rise divided by Run). Two points on a line arenecessary to calculate the slope. Ensign uses the slope formula to draw lines on charts. Youcan manually set the slope of a Line, in the Draw Line Properties window. The value of theslope is equal to the amount of vertical change (Price) divided by the horizontal change(Bars).
Slope ExampleRise: Given a Line starting price of 120 and an ending price of 150, the Rise equals 30 price units.Run: If the Line’s starting bar count is 2000 and the ending bar is 2060, the Run equals 60 bar units.Slope: The Rise divided by the Run is equal to 30 / 60 = 0.5 price units per bar units.The Line would slope to the upside at a rate of 0.5 price units per bar.
Slope Note: A computerized chart is not a grid paper. The chart can be stretched bothvertically and horizontally without changing a Line’s reference points of price and bars. Thebars can be spread-out wide, or compressed closely together. So, don’t try to equate SLOPEwith the ANGLE of the Line on the computer screen. The chart is a dynamic rescalingmeasurement of price and time. Therefore, the idea that a 45 degree Line must have a slopeof 1, does not compute. In the example formula above, the slope was equal to 0.5 on thechart. The ANGLE of the line has no relation to the SLOPE. You can stretch and compressthe chart and the SLOPE of the line will remain at 0.5 (the Line’s price and bar ratio does notchange, even though you resized the chart). However the visual ANGLE of the line, as youstretch the chart, will change a lot. Therefore, don’t be surprised if you enter a slope of 1, andthe line is not a 45 degree line on your computer screen. Use the ‘Circle’ draw tool to viewconstant 45 degree lines.
Note: The Draw Line properties window can also be accessed by clicking the Chart Objectsbutton from the chart Toolbar. The Chart Objects window displays all the studies, lines, anddraw tools that are currently drawn on a chart. To access the properties window for a line,select Draw Line from the Chart Objects list, and then click the Properties button.
8

5/17/2018 Tools - slidepdf.com
http://slidepdf.com/reader/full/tools-55ab58c08c20c 9/58
Alarmed Lines
Alerts can be set on a Draw Line, Linear Regression line, Fibonacci Levels, FibonacciRetracements, and Daily Price Lines. Each of the property forms for these draw tools havesimilar properties for the alarms.
Check the Alert Message box to show a message at the top of the chart when any of theshown lines are crossed by price action. The message will use the Font and Panel colors.
A sound can also be played, and the example show the message text that will be spoken bythe computer Voice.
Check the Auto Remove Message box if you want the alert message to be hidden when thealert condition is no longer true. The message text is automatically generated by Ensign, andwill be similar to the example shown where the text will say Cross Above or Cross Belowfollowed by a name of the line being crossed.
Alerts that are triggered for Price Alert, Study Alerts and Line Alerts are being logged. Clickthe Yellow Bell button to show the Alerts form. Select which of the three lists you want toview. The example shows the Alert List for Lines with our alert message that the Fibonacci 0line was crossed at 11:17:06 by a price at 1323.25 on the ES #F chart.
Check the E-mail check box to have the alert message e-mailed.
9

5/17/2018 Tools - slidepdf.com
http://slidepdf.com/reader/full/tools-55ab58c08c20c 10/58
Description
Alan Square
To draw the Alan Square on a chart, click the Alan Square button. The cursor will change to a
pencil while in the draw mode. The tool requires two points on a chart to create a square.Select the 1st point from an important High or Low price (or the opening bar of the day) bymoving the cursor to the point, then hold down the left mouse button and drag to the 2ndpoint. The standard square spans the pre-open through regular trading hours session. Thesquare should encompass the highest High and lowest Low of the previous day. The AlanSquare shows possible opportunities, targets, and protection levels.
The major components of the Alan Square are:
Construction Methods
There are various ways to draw the Alan Square. The implementation of the Alan Square inEnsign Windows is just one more of many reasons to switch to Ensign. Those who do notuse Ensign can still draw the square 'the old fashioned way', how Alan drew his square for tenyears prior to his getting Ensign Windows.
10
5/17/2018 Tools - slidepdf.com
http://slidepdf.com/reader/full/tools-55ab58c08c20c 11/58
Click on one of these excellent links for instructions.
• Ensign Alan Square Draw Tool • Manually - Lines and Square (link to dacharts)• Manually - Box and Parallels (discovery method, link to dacharts)
11

5/17/2018 Tools - slidepdf.com
http://slidepdf.com/reader/full/tools-55ab58c08c20c 12/58
Andrew Pitchfork
To draw the Andrews Pitchfork on a chart, click the Andrews Pitchfork button. The cursor willchange to a pencil while in the draw mode. The Pitchfork uses three points on a chart tocreate a triangle. The three points should be constructed from a key High or Low price, andthe next two swings in the market that form a correction. Pitchfork lines extend from the
triangle at specified intervals to dissect the market. The Pitchfork shows possible price levelswhere the market could extend to. Watch for support and resistance on the Pitchfork lines.
Drawing the PitchforkSelect the 1st point from an important High or Low price by moving the cursor to the point,then hold down the left mouse button and drag to the 2nd point. The 2nd point should be theHigh or Low of the subsequent correction. Release the mouse and then move to the 3rd point.The 3rd point will complete the triangle, and is generally the ending point of the correction.Click the left mouse button to mark the 3rd point. The Andrews Pitchfork lines draw to thescreen as the three points are selected.
Adjusting the PitchforkRe-selecting the Pitchfork will activate the ability to move and adjust the lines to a differentlocation. Click the mouse on one of the first two original points (or the main Andrews lines) toactivate the Pitchfork. Square Bullet marks will highlight the three corner points. Place themouse on any of the square bullet marks and drag the Pitchfork to a new location. The wholePitchfork can be moved by dragging the line that connects the first two selected points.
12

5/17/2018 Tools - slidepdf.com
http://slidepdf.com/reader/full/tools-55ab58c08c20c 13/58
PropertiesTo open the Properties window, click the Chart Objects button, select Andrews Pitchfork, andthen click Properties. The Properties window can also be opened by re-selecting the Pitchforklines and then right-clicking the mouse. The Properties window is used to change the Colors,Line Style, and other Defaults.
• Extend A-B - Check the Extend A-B box to extend the Pitchfork lines from points A and B.
• Extend A-C - Check the Extend A-C box to extend the Pitchfork lines from points A and C.
• Parallel B-C - A check mark in the Parallel B-C box will draw Parallel lines using thedistance between the vertex point and the B-C midpoint line.
• Diagonal Grid - Place a check mark here to plot diagonal grid lines in the pitchfork.
• Fork Variations - Select Schiff in the list box to draw the pitchfork handle from thevertical mid-point of the first 2 selection points. Select Modified Schiff in the list boxto draw the handle of the fork for Modified Schiff Lines from the midpoint of the A-Bline. Ensign offers 11 variations for the Andrews Pitchfork handle location.
• Price - The Price of the starting point can be manual adjusted if necessary.
• Extend multiplier - The multiplier allows you to control the length of the fork lines.
13

5/17/2018 Tools - slidepdf.com
http://slidepdf.com/reader/full/tools-55ab58c08c20c 14/58
Circle
The Circle tool can be used to draw a Circle, Ellipse, Rectangle, Pentagon, or Angle Lines atspecified Degrees. To draw a circle on a chart click the Circle button on the Drawing Toolbar.The cursor will change to a pencil while in the draw mode. A center point, and a radius point,are necessary to draw a circle on a chart. Move the cursor to a desired center point and then
drag the mouse to the radius point. Circles are placed on charts to mark chart formations.
The distance between the center and outer edge of the circle can be divided to include morecircles, including Fibonacci levels. Two vector lines can also be drawn from the middle of thecircle. Many traders like these lines to be drawn at forty-five degree angles (upward anddownward). The interior area of the circle can be filled-in with color.
Adjusting a Circle
Re-selecting the circle will activate the ability to move and adjust it to a different location. Clickthe mouse on the center of the circle to activate it. You can always re-select a circle byclicking on the right edge of the Circle (at the midpoint of the circle). The cursor will change toa pencil and square bullets will mark the center and radius points. Drag the square bullets to anew location to adjust the circle.
14

5/17/2018 Tools - slidepdf.com
http://slidepdf.com/reader/full/tools-55ab58c08c20c 15/58
Properties
After drawing a circle, click the Chart Objects button, select Circles, and then click Propertiesto view the properties window. The properties window can also be displayed by re-selectingthe circle and then right-clicking the mouse. Enter a degrees value in the 'Deg' Level entrybox to specify the angle of the 2 optional vector lines. Example, an entry of 60 will plot 60degree angle lines from the middle of the circle. Place a check mark in the 'Show' box to
display the lines.
Degree Fan - Place a check mark in the 'Degree Fan' check box to plot Angle Lines on thechart that draw from the center point. You can specify the desired degrees of each line in the'Level' entry boxes. Place a check mark next to each entry row that you want to display an
Angle Line. The 360 degree radius starts at the right edge of the circle. 90 degrees is straightup. 180 degrees points leftward. 270 degrees points down, etc. The Angle of the Lines will not
change if the chart is rescaled.Default - Place a check mark next to 'Default', 'Ellipse', 'Rectangle', 'Pentagon', or 'AngleLines' to change the shape of the circle. Place a check mark next to 'Fill Interior' if you wouldlike the inside of the shape to be filled.
read more » Integration of Gann, Elliott, and Fibonacci Techniquesread more » Ellipses
15

5/17/2018 Tools - slidepdf.com
http://slidepdf.com/reader/full/tools-55ab58c08c20c 16/58
Cycles
To use the Cycle lines or Moon Phases tool, click the Cycles button. The cursor will change toa pencil while in the draw mode. Cycle lines mark time cycles from important highs and lows.
A bar counter will be displayed while drawing the cycles. This displays how many bars arecontained in each cycle. A start and end point are necessary to draw the cycle lines on achart. The distance between the start and end points will be replicated across the chart.Vertical dashed lines mark each cycle point.
To draw cycles on a chart move the cursor to the starting point and then drag the mouse to
the ending time cycle point. The starting point is generally an important high or low on thechart. The ending point is usually the end of an important trend or correction following thestarting point. The cycle lines can extend into the future and backwards to indicate possiblecycles. Watch for a market to switch directions at the cycle points.
Adjusting Cycles
Re-selecting the cycles will activate the ability to move and adjust the cycles to a differentlocation. Click the mouse on the bottom of a cycle line to activate it. The cursor will change toa pencil and square bullets will mark the original start and end points. Drag the square bulletsto a new location and the cycle lines will adjust.
16

5/17/2018 Tools - slidepdf.com
http://slidepdf.com/reader/full/tools-55ab58c08c20c 17/58
Properties
After drawing a cycle, click the Chart Objects button, select Cycles, and then click Propertiesto view the properties window. The properties window can also be displayed by re-selectingthe cycle lines and then right-clicking the mouse.
In the properties window, place a check mark next to Pin To Bottom to Pin the Cycles to thebottom of the chart. Place a check mark in the 'Mirror' box to cause the cycle lines to extendin both directions. Place a check mark to in the Show box to show the Cycle Arcs, VerticalLines, and Moon Phases. Place a check mark in the 1/2 Cycle, 1/3 Cycle, and 1/4 Cycleboxes to plot additional cycle lines which divide the original cycle.
read more >> Tools: Cycles
17

5/17/2018 Tools - slidepdf.com
http://slidepdf.com/reader/full/tools-55ab58c08c20c 18/58
Daily Price Lines
The Daily Price Lines tool can draw a variety of price lines on a chart. To apply the tool on achart click the Daily Price Lines button on the Drawing Toolbar, and then click on the chart.
Properties
Click the Chart Objects button, select Daily Price Lines, then click the Properties button toopen the Properties window for the tool.
Labels Left/ Right - Place a check mark in the 'Labels Left' or 'Labels Right' boxes to display
labels for each of the lines. Place a check mark in the 'Day Session' box to calculate the DailyPrice Lines using only the Day Session bars. Evening session bars would be ignored.
Daily Price Line Types: The Daily Price Lines tool can plot horizontal lines at the followingprice levels. Make a selection from the 'Description' drop down list to specify a line type. The$ (price) Marker or the % (percent) Marker are often used with these line types.
18

5/17/2018 Tools - slidepdf.com
http://slidepdf.com/reader/full/tools-55ab58c08c20c 19/58
% Today - Enter a Percentage in the 'Level' entry box. Example: Enter 50 to plot a line at themidpoint of today's trading range.
% Yesterday - Enter a Percentage in the 'Level' entry box. A line will plot based on Yesterdaysrange. Example: Enter 25 to plot at line at the 25% level of Yesterdays price range.
% Day 3 - Enter a Percentage in the 'Level' entry box. A line will plot based on the price rangeof the 3rd day back.
% Scale - Enter a Percentage in the 'Level' entry box. A line will plot base on the current chartscale from top to bottom. Example: Enter 50 to plot a line in the middle of the chart.
Price - Enter a price in the 'Level' entry box. A horizontal line will plot at the specified price.
Point + Offset - Enter a price in the 'Level' entry box. A horizontal line will plot at the specifiedprice offset from the click point price. Example, an entry of 1 .50 will plot a line 1.50 higher than the click point price. Enter a negative price to plot a line that is lower than the click pointprice.
Point * Percent - Enter a percent value in the 'Level' entry box. A horizontal line will plot at thespecified price offset from the click point price by the specified Percent. Example, an entry of
2.00 will plot a line 2 percent higher than the click point price. Enter a negative value to plot alower line.
read more » Square of Nineread more » Harmonic Octavesread more » Gradient Line Stylesread more » Yesterday's High, Low, Close
19

5/17/2018 Tools - slidepdf.com
http://slidepdf.com/reader/full/tools-55ab58c08c20c 20/58
Draw Line
Though the Draw Tools panel shows a single entry of Draw Line, the property form can beconfigured to a variety of Draw Line types. Use the tabs to pre-configure line types.
Check the Extend Ahead box to have the draw line extend beyond the 2nd construction point.
Check the Extend Back box to have the draw line extend ahead of the 1 st construction point.
Check the Custom Label box and enter text in the 2 edit boxes on that line. The text in theleft edit box will show ahead of the 1st construction point and the text in the right edit box will
show after the 2nd construction point.
Check the Std Dev Channel box to create a channel whose width is based on a multiple of thestandard deviation of the bars spanned by the draw line. The next line with the Mult. labelholds the multiplier. If this line's box is checked, a 2nd deviation channel at twice the multipleis drawn.
Check the Percent Channel box to create a channel based on a percentage of the price. The
20

5/17/2018 Tools - slidepdf.com
http://slidepdf.com/reader/full/tools-55ab58c08c20c 21/58
percentage multiplier is entered on the next line. And if the box on this percentage line ischecked, a 2nd channel at twice the percentage is drawn.
The Mirror boxes optionally draw a line that is reflected off of a horizontal plane at the 2nd
construction point. The angle of reflection can be at double, actual, or half of the draw line'sangle. These options create a mini-Gann fan.
Check the Horizontal box to have the line drawn horizontally from the 1 st construction pointregardless of the 2nd construction point's vertical placement.
Check the H/L Channel box to create a high low channel based on the extremes in the barsthe draw line spans.
Check the PTT Channel box to create a PriceTime Target formation.
Check the Auto Wedge box to have the tool create wedge lines based on the bars spannedby the draw line. In this example, the blue line was drawn manually.
21

5/17/2018 Tools - slidepdf.com
http://slidepdf.com/reader/full/tools-55ab58c08c20c 22/58
Fibonacci Cycle
This tool is a ruler for measuring time by counting bars using the Fibonacci number sequence.
Click the mouse at the starting point to place the Fibonacci Cycle tool.
Properties
22

5/17/2018 Tools - slidepdf.com
http://slidepdf.com/reader/full/tools-55ab58c08c20c 23/58
Fibonacci Levels
To draw Fibonacci Levels on a chart, click the Fibonacci Levels button. The cursor willchange to a pencil while in the draw mode. Fibonacci Levels indicate possible support andresistance levels from important highs and lows. A start and end point are necessary to drawFibonacci Levels on a chart. All of the levels can be customized and changed to your desiredlevels. The distance between the start and end points is divided into Fibonacci Levels whichsuggest possible support and resistance points. To draw Fibonacci Levels on a chart movethe cursor on the chart to the starting point. The starting point is generally an important highor low on the chart. Click the mouse at the starting point and at the ending point of the trend.Watch for the completion of a trend or correction at the Fibonacci Levels.
Adjusting Fibonacci Levels
Re-selecting the lines will activate the ability to move and adjust them to a different location.Click the mouse on the 0% or 100% horizontal lines to re-activate the Fibonacci Levels. The
cursor will change to a pencil and square bullets will mark the original start and end points.Drag the square bullets to a new location and the Fibonacci Levels will adjust.
Properties
After drawing Fibonacci lines on a chart, click the Chart Objects button, select FibonacciLevels, and then click Properties to view the properties window. The properties window canalso be displayed by re-selecting the Fibonacci lines and then right clicking the mouse. Clickthe Delete button in the properties window to remove the lines from the chart.
23

5/17/2018 Tools - slidepdf.com
http://slidepdf.com/reader/full/tools-55ab58c08c20c 24/58
If necessary, enter a specific price in the anchor 'Price' entry box to specify the startingFibonacci price level. To extend the length of the Fibonacci lines, enter a Multiplier value inthe 'Width Multiplier' box. Use the 'Price Magnet' feature to snap the start and end points tothe nearest bar price. Place a check mark in the 'Show Extensions' box to draw Fibonaccilines from both the start and end levels. Example: a Fibonacci entry of 127.2 will draw twolines. The first line will draw up 127.2 percent from the start price. The second line will drawdown 127.2 percent from the end price level.
Setting the Levels, Color, Line Thickness, and Markers
The properties window is also used to change the Fibonacci percent levels, colors, and line
thickness. Place a check mark in the 'Display' check box to display a particular line level.Enter Fibonacci percent levels in the 'Level' entry boxes. Click on the 'Color' boxes to adjustthe color for each line. Adjust the 'Line Thickness' by selecting a line in the drop down box.Use the marker boxes to label the left and right side of the lines with information such as thepercentage and the price.
24

5/17/2018 Tools - slidepdf.com
http://slidepdf.com/reader/full/tools-55ab58c08c20c 25/58
Storing Fifteen Different Fibonacci Parameter Sets
The Fibonacci tool can store 15 separate parameter settings. Click on one of the Tabs 1through 14 at the bottom of the Properties window to switch to a different setting. This allowsyou to configure several unique combinations of lines, price levels, and colors. Place a checkmark in the 'Use as Default' box to save the currently displayed setting as the default.
Examples
25

5/17/2018 Tools - slidepdf.com
http://slidepdf.com/reader/full/tools-55ab58c08c20c 26/58
26

5/17/2018 Tools - slidepdf.com
http://slidepdf.com/reader/full/tools-55ab58c08c20c 27/58
27

5/17/2018 Tools - slidepdf.com
http://slidepdf.com/reader/full/tools-55ab58c08c20c 28/58
Fibonacci Retrace
The cursor will change to a pencil while in the draw mode. Fibonacci Retracements indicatepossible time and price movements from important highs and lows. A start and end point arenecessary to draw Fibonacci Retracements on a chart. The distance between the start andend points is divided into Fibonacci Levels that suggest support and resistance points.
Diagonal time lines mirror the marked trend and suggest the wave time of the next move. Todraw Fibonacci Retracements on a chart move the cursor on the chart to the starting point.The starting point is generally an important high or low on the chart. Then drag the mouse tothe ending point. The ending point is usually the end of an important trend or correctionfollowing the starting point. The retracement levels and time mirror lines will extend on thechart. Watch for the completion of a trend or correction at the Fibonacci Levels. The mirror lines extend at a one-by-one, two-by-one, and one-by- two relation to the slope of the startand end point line.
The same properties window for Fibonacci Levels applies to Fibonacci Retracements.
28

5/17/2018 Tools - slidepdf.com
http://slidepdf.com/reader/full/tools-55ab58c08c20c 29/58
Fibonacci Ruler
The Fibonacci sequence involves the use of ratios, and the two ratios that are focused on inthis trading tip are 1.618 and 2.618. Time can be forecast by measuring the horizontal timeperiod between two points A and B, and multiplying by the Fibonacci ratios. The result isplotted rightward from point A.
Fibonacci time projections can be made from top to top, bottom to bottom, or top to bottom.Because of the multiplicity of swing tops and bottoms, there is the problem of a multitude of possible relationships. One solution to the problem is to use this tool in conjunction with other time-oriented information, such as Elliott wave counts or cycle analysis.
The following chart illustrates three Fibonacci Time Projections. Each time period measuredis marked with blue lines and arrows labeled A and B. The forecasts are marked with redlines and labeled for the Fibonacci ratio used.
29

5/17/2018 Tools - slidepdf.com
http://slidepdf.com/reader/full/tools-55ab58c08c20c 30/58
Fibonacci Time Projects are easy to make using the Fibonacci Ruler tool in Ensign Windows.To use the Fibonacci Ruler tool, click the Fibonacci Ruler button. The cursor will change to apencil while in the draw mode. The Fibonacci Ruler indicates possible time movements fromeither two or three marked points on a chart. A start point and end point is necessary to drawthe Fibonacci ruler on a chart. Vertical ruler lines extend from Fibonacci distances in relationto the start and point, and indicate possible turning points for the current trend or correction.
To draw the Fibonacci Ruler on a chart move the cursor on the chart to the starting point. Thestarting point is generally an important High or Low on the chart. Click the mouse on the startpoint and on the end point. Vertical dashed lines will mark the Fibonacci Ruler lines. The linesare based on the distance between the start and end points. The Fibonacci Ruler uses .618,1.272, 1.382, 1.5, 1.618, 2, 2.618, and 4.236 as possible ruler settings. Watch for thecompletion of a trend or correction at the ruler lines.
Properties
The percentages, colors and markers are configured on the tool's property form.
After drawing the Fibonacci Ruler on a chart, click the Chart Objects button, select FibonacciRuler, and then click Properties to view the properties window. The properties window canalso be displayed by re-selecting the ruler lines and then right-clicking the mouse.
30

5/17/2018 Tools - slidepdf.com
http://slidepdf.com/reader/full/tools-55ab58c08c20c 31/58
Use 3 Points - Place a check mark in the 'Use 3 Points' check box if you want the FibonacciRuler lines to extend from a 3rd point. In this case, you will need to click on a 3rd point whenapplying the tool. The Fibonacci values will be calculated from the first two points, and thenextend from the 3rd point.
Adjusting the Fibonacci Ruler
Re-selecting the lines will activate the ability to move and adjust them to a different location.Click the mouse on the bottom of the first ruler line to activate the lines. The cursor willchange to a pencil and a square bullet will appear at the bottom of the first cycle line. Drag thesquare bullet to a new location and the ruler lines will adjust.
31

5/17/2018 Tools - slidepdf.com
http://slidepdf.com/reader/full/tools-55ab58c08c20c 32/58
Formations
To draw Formations on a chart, click the Formations button on the Drawing Toolbar. Thecursor will change to a pencil while in the draw mode. The tool can be used to draw a varietyof patterns, including Elliott Wave ABC corrections, Elliott Wave 12345 thrust moves, 3 PointFibonacci Levels, Butterfly Patterns, Gartley Patterns, Triangles, and Trapezoids.
The tool's properties were configured as shown below to create the Fibonacci Extensionformation. Enter Fibonacci percent levels in the 'Level' entry boxes for any Fib levels that youwant to plot. Increase the 'Width Multiplier' to extend the Fibonacci lines horizontally into thefuture.
Adjusting the Lines
Re-selecting the lines will activate the ability to move the lines. Click the mouse on either of
the first two points (or the Lines between the points) to activate the lines. Square Bullet markswill highlight the three original points. Place the mouse on any of the square bullet marks anddrag the lines to a new location.
32

5/17/2018 Tools - slidepdf.com
http://slidepdf.com/reader/full/tools-55ab58c08c20c 33/58
Properties
Click the Chart Objects button, select Formations Tool, then click the Properties button toopen the Properties window for the tool. On the right side of the window is a list of patternsthe tool can draw. Place a check mark next to the desired pattern. The pattern options are:
• Gartley - Plots a Gartley Pattern based on the 3 draw points.
• Butterfly - Plots a Butterfly Pattern based on the 3 draw points.
• Triangle - Plots a Triangle based on the 3 draw points.
• Trapezoid - Plots a Trapezoid based on the 3 draw points.
• Fibonacci - Plots a Fibonacci Extension using 3 draw points.
• read more » Fibonacci Extensions
• read more » AB=CD Pattern
• read more » Lightning Bolt (Elliot Wave Patterns)
•
Risk | Reward - Displays a tool to measure the price of vertical movement andretracements.
• Vertical Ruler - Plots a vertical line from the start point, as a reference line.
• read more » Vertical Ruler
Price - You can manually enter the price for the first draw point if necessary.
There are 15 Tabs at the bottom of the Properties window. Each Tab can save a unique set of
parameter settings. This allows you to have 15 different line settings. The Tab currentlybeing used will have dashes next to the Tab number. In the example below, Tab 1 is thecurrent Tab being used. Click on a Tab to switch to a different setting, or to make changes tothe Tab setting. You must click on a Tab in order to make and save changes to the Tabsettings. You are encouraged to set up a different tab for each of the possible formations.
33
5/17/2018 Tools - slidepdf.com
http://slidepdf.com/reader/full/tools-55ab58c08c20c 34/58
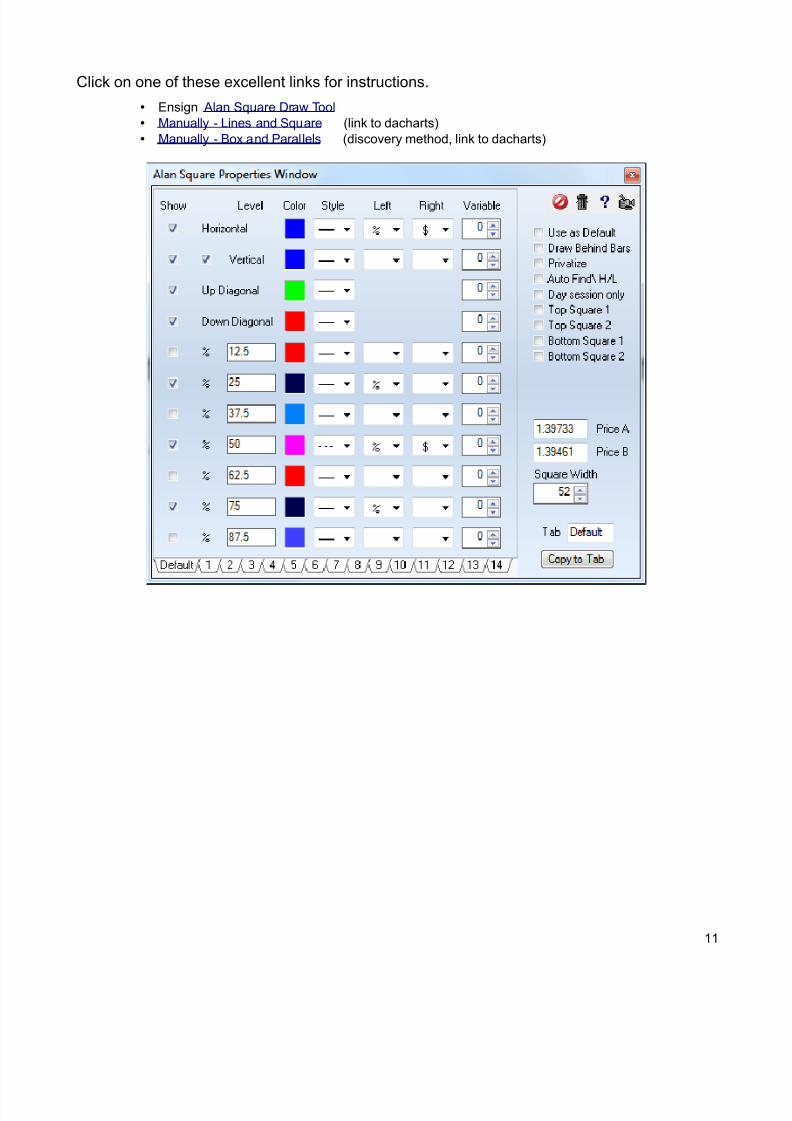
Gann Fan
Gann Fans are lines which project outward from a single starting point. The starting point isusually a major High or Low turning point on the chart. The lines are drawn at specified levelsand suggest possible support and resistance levels based on time and price. To draw a GannFan on a chart, click the Gann Fan button. The cursor will change to a pencil while in the draw
mode.
There are two ways to apply a Gann Fan to a chart, 1) Manual mode, and 2) Automatic mode.
Manual Mode
When applying a Gann Fan to a chart in Manual mode, you must select a starting and endingpoint with the mouse cursor. Move the cursor on the chart to a starting point and click on it.Then click on the ending point. The ending point is usually the end of an important trend or correction following the starting point. The Gann lines will extend on the chart. The linecreated by the start and end point will be the one-by-one line.
Automatic Mode
The Gann Fan can be applied to a chart with just a starting point (if Automatic Mode isactivated). The Gann Fan will automatically determine the proper angle of the fan lines basedon time and price. To enable Automatic Mode, open the Properties window for the Gann Fanand place a check mark in the 'Automatic' box (then click the 'Use as Default' box).
Watch for the completion of a trend or correction at the fan levels.
Read more >> Timing with Gann Angles
34

5/17/2018 Tools - slidepdf.com
http://slidepdf.com/reader/full/tools-55ab58c08c20c 35/58
Properties
After drawing a Gann Fan on a chart, click the Chart Objects button, select Gann Fan, andthen click Properties to view the properties window. The properties window can also bedisplayed by re-selecting the Gann lines and then right-clicking the mouse.
• Automatic - Enables Automatic Mode. The Gann Fan will determine an optimized anglefor you.
• 45 Degrees - This will snap the 1x1 line to a 45 degree angle. The line will remain at a45 degree angle regardless of the chart scaling.
• Label Lines - Will label each Gann fan line with its Gann label (example: 1x1, 2x1, 4x1,etc).
• Half Fan Only - Will only plot half of the Gann fan lines (up to and including the middle1x1 line).
• Mirror Fan - Mirror the fan lines on the other side of the horizontal line.
• Price - You can manually enter the price for the first draw point if necessary.
• Extend Multiplier - Enter a number to specify the length of the Gann lines.
• Horizontal - Place a check mark in the 'Horizontal' box to display a horizontal line fromthe start point.
35

5/17/2018 Tools - slidepdf.com
http://slidepdf.com/reader/full/tools-55ab58c08c20c 36/58
Gann Square
The Gann Square tool in Ensign Windows is very flexible and can be used to show trends,timing, and price levels. Gann Squares indicate possible time and price movements fromimportant highs and lows. To draw a Gann Square on a chart, click the Gann Square buttonon the toolbar, then move the cursor on the chart to the starting point. The starting point isgenerally an important High or Low on the chart. Click the mouse on the start and end pointswhich will be the corners of the square. The end point is often to the right of the chart bars.
Price: A Gann Square can draw horizontal lines at the price levels shown in the Horizontalcheck list. These price levels are similar to those that could be constructed using theFibonacci Price Levels draw tool. Tip: Watch for trends to change directions at the GannSquare price levels.
Time: A Gann Square can draw vertical lines at the intervals shown in the Vertical check list.
These vertical lines are similar to those that could be constructed using the Cycles draw tool.Tip: Watch for trends to change at the Gann Square time intervals. A Gann Square with bothhorizontal price levels and vertical time intervals is shown below.
Properties
After drawing a Gann Square on a chart, click the Chart Objects button, select Gann Square,and then click Properties to view the properties window. The properties window can also bedisplayed by re-selecting the Gann square and then right-clicking the mouse.
36
5/17/2018 Tools - slidepdf.com
http://slidepdf.com/reader/full/tools-55ab58c08c20c 37/58
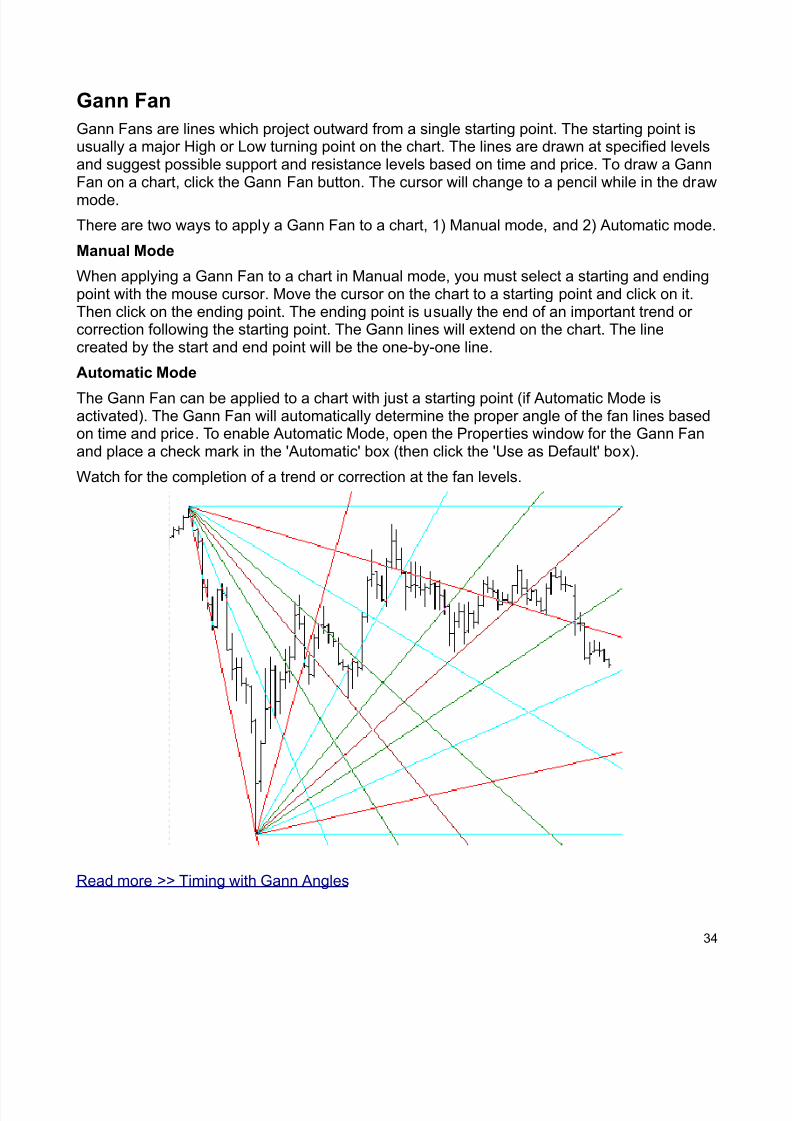
• Fan Lines - Place a check mark in the 'Fan Lines' box to plot diagonal fan linesconnecting the corners and levels. See next example chart.
• % of Price - The Gann Square can also be used to plot Percent Levels. Place a check
mark in the '% of Price A' checkbox to activate this feature. Enter Percent Levels thatyou want to plot in the 'Level' entry boxes. For example, enter 90 if you want a lineplotted at 90% of the price of your starting point (Price A).
• Price - The 'Price' box displays the price of the starting point. This can be fine tuned if necessary.
• Horizontal - Place a check mark in the 'Horz' box to display a horizontal lines
• Vertical - Place a check mark in the 'Vert' box to display a vertical lines
• Level - Enter Gann angle numbers for each line.
37

5/17/2018 Tools - slidepdf.com
http://slidepdf.com/reader/full/tools-55ab58c08c20c 38/58
read more » Gann Grid
38

5/17/2018 Tools - slidepdf.com
http://slidepdf.com/reader/full/tools-55ab58c08c20c 39/58
Gartley Butterfly
One of the formations that Larry Pesavento looks for is the Gartley pattern, which is namedafter H. M. Gartley who wrote 'Profits in the Stock Market' in 1935. The following chart showsa Gartley Sell formation.
The market has had a sizeable move up to put in a top at point X, which is now considered apotential turning point. The Gartley pattern is one with an initial correction to point A, andthen a 3 wave retest back towards the turn at point X. The 3 waves back up are labeled inthe example as B-C-D. There should be symmetry in the retrace, namely A-B equals C-D.Point D should be around 0.618 of the X-A distance. The example shows point D at the 0.707retrace distance. The principle is to sell point D with a protective stop above point X.
Keep in mind you do not initially pick X as the top. You wait for selling to move the market topoint A, and then sell on the retracement approach back to X, looking for a three waveretracement pattern that fulfills a 0.618 retracement distance.
The inverse pattern at potential bottoms would be the Gartley Buy formation. Buy the retestapproach to the bottom turn at the 0.618 retrace level, with a protective stop below the bottomturn price. The next example shows a very nice move up after the Gartley Buy formation.
39

5/17/2018 Tools - slidepdf.com
http://slidepdf.com/reader/full/tools-55ab58c08c20c 40/58
How to Draw
The pattern is marked by clicking the left mouse button at point X, clicking at point A, andclicking on point D. The tool will automatically find points B and C between points A and D,and draw the lines as shown, fill the two triangle interiors with a shade color, and label theretracement percentages. The tool could also show extensions of the C-D leg, or reactionsfrom point D to create a D-E line that is parallel to the x-A line.
40

5/17/2018 Tools - slidepdf.com
http://slidepdf.com/reader/full/tools-55ab58c08c20c 41/58
Properties
Click the Chart Objects button, select Gartley / Butterfly , then click the Properties button toopen the Properties window for the tool.
• % Labels - Select this box to display percentage labels on the Gartley lines.
• Actual % - Select this box to display actual percentages instead of the nearest Fibnumber.
• Triangle - Plots a Triangle based on the 3 draw points.
• Marker @ AB = CD - Plots a Marker at the price and time point where the move wouldend if AB = CD.
• Confluence Zone - Plots 2 lines on the chart that measure Fibonacci retracements of .382 and .618.
• Price A - You can manually enter the price for the first draw point if necessary.
41

5/17/2018 Tools - slidepdf.com
http://slidepdf.com/reader/full/tools-55ab58c08c20c 42/58
Linear Regression
To draw a Linear Regression line on a chart, click the Linear Regression button. The cursor will change to a pencil while in the draw mode. Move the cursor pencil to a starting bar andthen click the left mouse button and click again at an ending bar point. The line will stayselected until the mouse is clicked somewhere else on the screen. At that point, the
regression line will be calculated and the line will be repositioned. The price levels for thestarting and ending points will be determined by the Linear Regression formula. The formulauses the bar prices between the start and end points to calculate a straight line best fit usingthe least squares method. Line parameters can be set to extend the regression line forwardand back, to mirror at different angles, and to change the color.
Adjusting a Line
Re-selecting the Regression Line will activate the ability to move and adjust it to a differentlocation. Click the mouse on the Line to activate it. The cursor will change to a pencil andsquare bullets will mark the start and end points. Drag the square bullets to a new locationand the Line will adjust. Drag the line from the center to move the whole line at once.
Properties
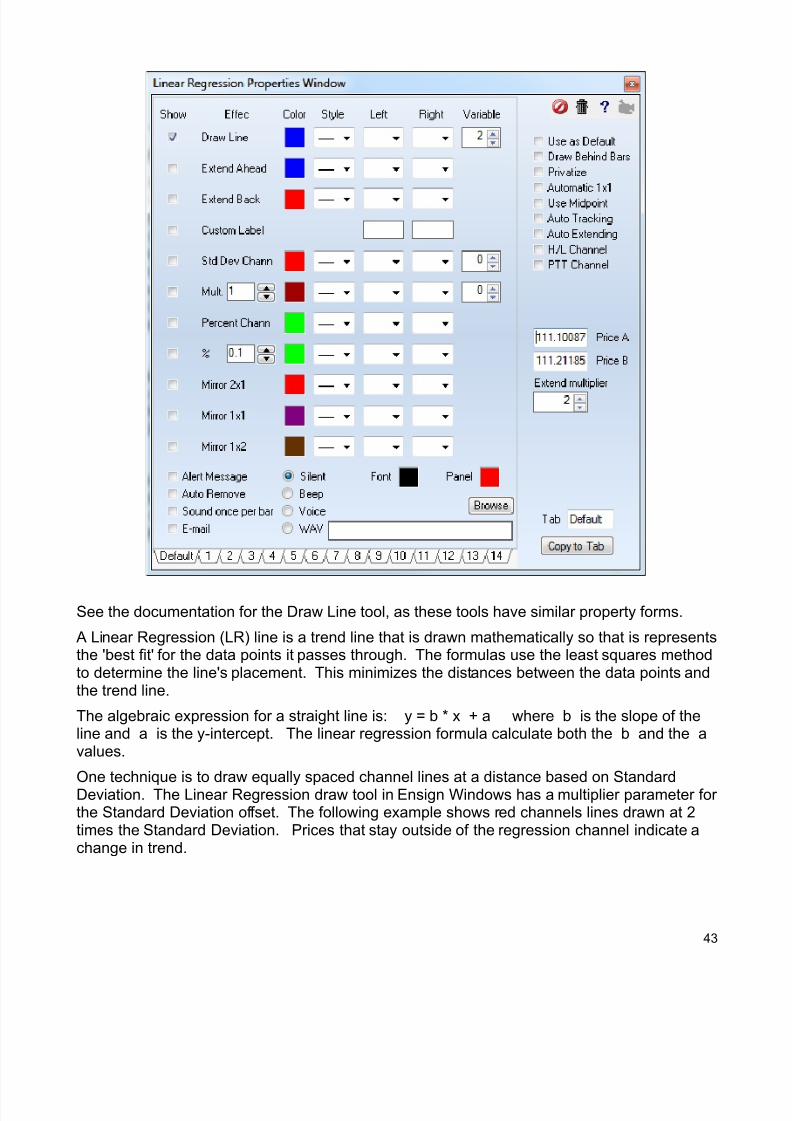
After drawing a Regression Line on a chart, click the Chart Objects button, select Linear Regression, and then click Properties to view the properties window. The properties windowcan also be displayed by re-selecting the line and then right-clicking the mouse. The followingoptions are available on the right side of the properties window:
• Use MidPoint - Uses the Midpoint of the bar (High+Low)/2 instead of the close, for calculations
• Auto Tracking - Will move the Regression line to the right as each new bar is completed. Thestart and end points remain a constant distance apart. For example, a 10 bar Regression linewill recalculate to the most current 10 bars at the completion of each new bar.
• Auto Extending - Will leave the start point in place, and extend the end point to the most
recently completed bar. The distance between the start and end point will increase as new barsare completed.
• H/L Channel - Place a check mark here to plot parallel lines from the High and Low pointssurrounding the Regression line. This makes a nice set of channel lines. The color of thechannel lines can be changed with the 'Std Dev Channel' and 'Mult' color boxes.
• PTT Channel - A Price Time Target line can be plotted on the chart by selecting this box.Ensign will find a swing point between the start and end points of the Regression line, and plota parallel line from this swing point.
• Points Channel - Parallel channel lines can be plotted by selecting this box, and the 'Show' boxfor points channel. Specify the price distance in the 'Pts.' entry box. Lines will be drawn at thisprice distance away from the main Regression line. This box will toggle the lines between'Percent Channel lines' and 'Points Channel lines'.
• Extend Multiplier - Enter a multiplier. The Regression line will be extended forward/back by thismultiplier amount.
• Custom Label - Place a check mark in this box to display custom labels. Enter the label text inthe entry boxes in the Left Side and Right Side marker columns (on the Custom Label row).
• Above/Below - Causes the custom labels to print above or below the line (adjusts the location)
42
5/17/2018 Tools - slidepdf.com
http://slidepdf.com/reader/full/tools-55ab58c08c20c 43/58
See the documentation for the Draw Line tool, as these tools have similar property forms.
A Linear Regression (LR) line is a trend line that is drawn mathematically so that is representsthe 'best fit' for the data points it passes through. The formulas use the least squares methodto determine the line's placement. This minimizes the distances between the data points andthe trend line.
The algebraic expression for a straight line is: y = b * x + a where b is the slope of theline and a is the y-intercept. The linear regression formula calculate both the b and the avalues.
One technique is to draw equally spaced channel lines at a distance based on StandardDeviation. The Linear Regression draw tool in Ensign Windows has a multiplier parameter for the Standard Deviation offset. The following example shows red channels lines drawn at 2times the Standard Deviation. Prices that stay outside of the regression channel indicate achange in trend.
43

5/17/2018 Tools - slidepdf.com
http://slidepdf.com/reader/full/tools-55ab58c08c20c 44/58
44

5/17/2018 Tools - slidepdf.com
http://slidepdf.com/reader/full/tools-55ab58c08c20c 45/58
Marker
Markers can be placed on charts to mark bars or formations. A common use is to indicatewhere a trade was entered or exited. To place a marker on a chart, click the Arrow Marker onthe Draw Tools panel.
The cursor will change to a pencil while in draw mode. Move the pencil to the location for themarker, and click the left mouse button. A default marker will appear on the chart. You cannow click the right mouse button to display a properties form to change the marker shape or the text that appears adjacent to the marker.
Markers can be drawn in a huge variety of shapes. Use the drop down Marker list to select amarker shape. Optionally, various words like 'Long', 'Short' and 'Out' can be displayed withthe marker either above or below, on the left or the right side of the marker.
Tip: Select the marker that you use most frequently, and then check the 'Use as Default' boxon the properties form. Your choice will display as the default when a new marker is placedon a chart.
The preview window shows how the marker will look on the chart. The example showscustom text positioned above the marker made up of four differently colored dots.
Markers can be repositioned by clicking the left mouse button down on the marker, anddragging the object to a new position. The pencil is displayed when a marker is reselected.When a marker is selected, you can click the right mouse button to display its properties form.
Tip: A marker can be placed quite easily on the chart with the mouse. This price can bemanually edited to place the marker exactly on a price, instead of just close to a specific price.
Horizontal Lines
Any of the horizontal line markers in the Right side position make a great tool for quicklyputting horizontal lines on a chart. Text can be optionally shown on the right side of the line,regardless of the length of the horizonal line marker. This makes for a very clean and easyway to put a horizontal line on the chart at the point where the mouse is clicked, and to alsoinclude a custom label on the right side of the line.
45

5/17/2018 Tools - slidepdf.com
http://slidepdf.com/reader/full/tools-55ab58c08c20c 46/58
Tip: If drawing horizontal lines is something you do often, consider doing so using the Marker object instead of the Draw Line object. Set the Default to be a horizontal line that is the lengthmost often used. Configure tab 1 to have similar settings but with a shorter length linemarker. Configure tab 2 as a horizontal line that is a bit longer, and tab 3 a longer line, andtab 4 with the line marker that extends to the right edge of the chart. Then you can quitequickly put on the marker, and use the mouse wheel to scroll through the first several tabs of
the marker object which dials in the length of the line you seek.This sequence of charts illustrates the 4 different horizontal markers suggested for tab 1, tab2, tab 3 and tab 4.
Use a horizontal marker and custom text to label gaps, swings points, yesterday values, etc.For labels oft repeated, consider setting up one of the tabs on the marker to show the oft usedlabel, and then use the mouse wheel to select the tab without going to the object's propertyform to obtain the line and the label you seek.
Tip: Have the Price Magnet enabled and then the point where you seek to place this
horizonal line snaps to the price you are nearest on the bar. In the examples, the line hassnapped to the low of the swing bar just to the left of the horizontal line.
Tip: When a label is used with the marker that draws rightward to the scale, have the marginspace wide enough to show the entire label. If the margin is too narrow, then as the chartmoves leftward, the portion of the label that overlaps the bars will be repeated, which is not asclean as it could be.
46
5/17/2018 Tools - slidepdf.com
http://slidepdf.com/reader/full/tools-55ab58c08c20c 47/58
Notes
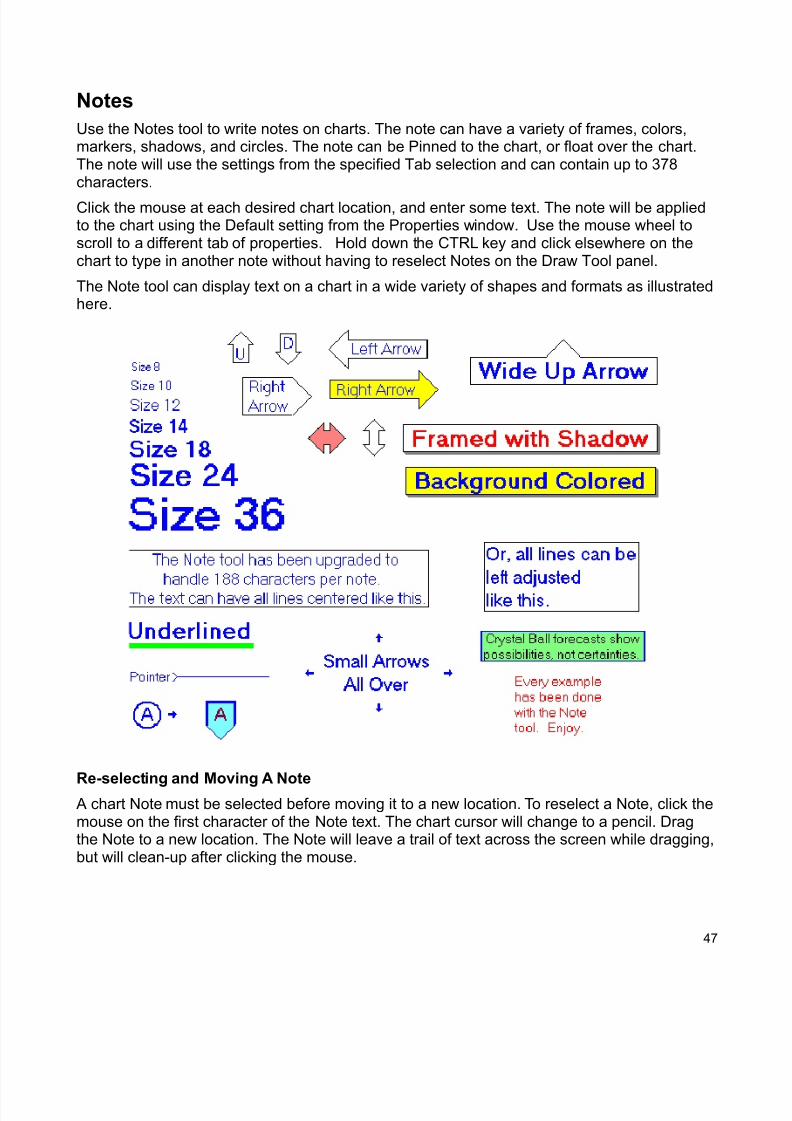
Use the Notes tool to write notes on charts. The note can have a variety of frames, colors,markers, shadows, and circles. The note can be Pinned to the chart, or float over the chart.The note will use the settings from the specified Tab selection and can contain up to 378characters.
Click the mouse at each desired chart location, and enter some text. The note will be appliedto the chart using the Default setting from the Properties window. Use the mouse wheel toscroll to a different tab of properties. Hold down the CTRL key and click elsewhere on thechart to type in another note without having to reselect Notes on the Draw Tool panel.
The Note tool can display text on a chart in a wide variety of shapes and formats as illustratedhere.
Re-selecting and Moving A Note A chart Note must be selected before moving it to a new location. To reselect a Note, click themouse on the first character of the Note text. The chart cursor will change to a pencil. Dragthe Note to a new location. The Note will leave a trail of text across the screen while dragging,but will clean-up after clicking the mouse.
47

5/17/2018 Tools - slidepdf.com
http://slidepdf.com/reader/full/tools-55ab58c08c20c 48/58
Properties
Right-click the mouse while a Note is selected and the cursor looks like a pencil to open theNote Properties window. The properties window is used to change the Note's text, Options,Colors, and Defaults. The following options are available. This is the property window thatcreated the Yellow Right Arrow example.
• Pinned - Place a check mark in the box to Pin the note to the chart. Pinned notes will align withchart bars, and will move with the bars. Unpinned notes will remain in a fixed chart windowposition.
• Pin Price - Place a check mark in the 'Pin Price' box to pin the note to a selected price level.
• Center Text - Center the text in the Note.
• Bold Font - Place a check mark her to cause the font to display in Bold.
• Show - Place a check mark in the Show check box to display a particular Note option. TheNote can have Frames, Shadows, and Circles as optional borders.
•
Color - Click on the square Color boxes to select a color for each Note feature.• Style - Select a Line Style, or Font Size from the Style drop-down lists.
• Left/Bottom - Select Markers that can be placed on the Left or Bottom of a Note.
• Right/Top - Select Markers that can be placed on the Right or Top of a Note.
48

5/17/2018 Tools - slidepdf.com
http://slidepdf.com/reader/full/tools-55ab58c08c20c 49/58
Parallel Lines
To use the Parallel Lines tool on a chart, click the Parallel Lines button. The cursor willchange to a pencil while in the draw mode. Parallel Lines are used to mark channel lines intrending markets. They are also useful for marking support and resistance points. Threepoints are necessary to draw Parallel Lines on a chart.
To draw Parallel Lines on a chart click on the 1st point from an intermediate High or Low bymoving the cursor to the point, then click on the 2nd point. The 2nd point should be asubsequent High or Low in the same trend pattern. This can form the top or bottom line of achannel. Now click on the 3rd point. The 3rd point is the point that a parallel line will be drawnfrom. The distance between the 2nd and 3rd points can be divided for additional parallel linesif desired. The entire formation can also be encapsulated to form a parallelogram. If theSHIFT key on the keyboard is held down when the lines are deselected, then the lines will beplotted either perfectly horizontal or vertical (which ever they are nearest to) regardless of thelast point.
49

5/17/2018 Tools - slidepdf.com
http://slidepdf.com/reader/full/tools-55ab58c08c20c 50/58
Adjusting Parallel Lines
Re-selecting the lines will activate the ability to move and adjust them to a different location.Click the mouse on the end of the top or bottom line to activate the lines. The cursor willchange to a pencil and square bullets will mark the original three points. Drag the squarebullets to a new location and the lines will adjust.
Properties
After drawing Parallel Lines on a chart, click the Chart Objects button, select Parallel Lines,and then click Properties to view the properties window. The properties window can also bedisplayed by re-selecting the lines and then right-clicking the mouse. The following optionsare available in the properties window:
• Ellipse - Place a check mark in the 'Ellipse' box to change the formation to an Ellipse.
• Arc - Place a check mark in the 'Arc' box to change the formation to an Arc.
•
Mirror Lines - Place a check mark in the 'Mirror Lines' box to cause a Mirror Image of the linesto appear.
• Alternate C - Changes the starting location of the 3rd draw point
• Horizontal - Place a check mark in the 'Horizontal' box to display a horizontal lines
• Price A - Manually enter the price for the first draw point, if desired.
• Price B - Manually enter the price for the second draw point, if desired.
• Extend Multiplier - Enter a number to specify the length of the lines.
50

5/17/2018 Tools - slidepdf.com
http://slidepdf.com/reader/full/tools-55ab58c08c20c 51/58
Pyrapoint
The ideas behind the PyraPoint Tool were developed by Don Hall. For more informationregarding PyraPoint and how to trade the tool, you can order Don's PyraPoint Book. The bookexplains all the details, calculations, and gives training on how to trade with the PyraPointtool.
The PyraPoint Tool is a Gann based tool that uses Time and Price. Vertical and Horizontallines are drawn on a chart. Display a chart in Ensign Windows and click the Draw Toolsbutton to show the Draw Tools panel.
The cursor will change to a pencil while in the draw mode. Move the cursor to an importantHigh or Low turning point on the chart and then click the left mouse button. The Horizontallines represent potential support and resistance levels. The Vertical lines represent probableturning points based on Time. Diagonal lines are used to intersect the Horizontal and Verticallines. The market will often ''walk' up and down the diagonal lines. Pyrapoint will appear usingan appropriate degree of rotation parameter selected by Ensign's proprietary artificialintelligence algorithm.
51

5/17/2018 Tools - slidepdf.com
http://slidepdf.com/reader/full/tools-55ab58c08c20c 52/58
Adjusting
Re-selecting the PyraPoint tool will activate the ability to move it to a different location. Clickthe mouse on the Zero starting point to re-select it. The cursor will change to a pencil. Dragthe mouse from the Zero starting point to a new location and the PyraPoint lines will move.Click the mouse again to complete the draw phase.
Properties
To view the properties window click the Chart Objects button, select PyraPoint, then click theProperties button to open the Properties window for the tool.
Normalize > 1000 - Place a check mark in the 'Normalize > 1000' box to prevent the Pyrapoint
from automatically adjusting the horizontal width of the PyraPoint squares when a market is ator near 1000 in price.
Normalize < 100 - Place a check mark in the 'Normalize < 100' box to normalize the study on2 digits.
Price - The 'Price' box shows the exact price where the Pyrapoint is anchored. The Price canbe edited if necessary.
Degrees - Click the Up and Down selection arrows to change the Degrees setting. TheDegrees setting will effect the number of lines that are drawn on the Pyrapoint tool and howclosely they are spaced apart. When the Pyrapoint tool is in a selected state, you can alsoclick the light-blue Up (Previous) and Down (Next) arrows on the Controls Toolbar. This will
also change the Degrees setting.
Click the up or down spinner arrow to double or halve the Degree of Rotation parameter. 45degrees is shown in the example. Clicking the up arrow will change it to 90 degrees. Clickingthe down arrow will change it to 22.5 degrees. Also, you can enter any degree in the edit box.Entering a value greater than or equal to 1 will be treated as degrees. Any value between 0and 1 will be treated as a percent of 180 degrees. A value of 0.5 is the same as 90 degrees.
After selecting your preferred colors, Line Thickness and Line Style, check the Use as Default
52

5/17/2018 Tools - slidepdf.com
http://slidepdf.com/reader/full/tools-55ab58c08c20c 53/58
box to save the parameters as the default.
To fully understand Pyrapoint, its mathematics, implementation, design, use and how to tradewith Pyrapoint, you need to buy Don Hall's Pyrapoint Book or Pyrapoint CD. The Book is aprofessionally published 234-page hard cover book.
ExampleHere is a daily chart of JNPR with the construction started on the highest high. All pricelevels, time intervals, and trend lines are constructed mathematically from two pieces of information: the price $244.50 on the date 10-16-2000.
read more >> Tools: Pyrapoint
53

5/17/2018 Tools - slidepdf.com
http://slidepdf.com/reader/full/tools-55ab58c08c20c 54/58
Speed Lines
Speed Lines use three points on a chart to create a triangle. The first two points mark a trendline from a major low to a major high, or vice versa. The third point marks a vertical line fromthe 2nd point. Speed lines are drawn from the 1st point to intersect the chart at selectedintervals. To draw Speed Lines on a chart, click the Speed Lines button. The cursor will
change to a pencil while in the draw mode. Move the cursor to an important High or Low onthe chart, then click on each ending point. The ending point is usually the end of an importanttrend or correction following the starting point. The Speed Lines will extend on the chart. Clickthe left mouse button once to finish the tool.
Adjusting Speed Lines
Re-selecting the Speed Lines will activate the ability to move them to a different location.Click the mouse on the starting point of the fan (or the main Speed Lines) to activate the lines.The cursor will change to a pencil and square bullets will mark the three points of the triangle.Drag the square bullets to a new location and the Speed Lines will adjust. Move the whole fanby dragging the line that connects the first two select points.
Properties
After drawing Speed Lines on a chart, click the Chart Objects button, select Speed Lines, andthen click Properties to view the properties window. The properties window can also bedisplayed by re-selecting the lines and then right-clicking the mouse.
• Price - The 'Price' box displays the price of the starting point. This can be fine tuned if necessary.
• Extend Multiplier - Enter a number to specify the length of the lines.
54

5/17/2018 Tools - slidepdf.com
http://slidepdf.com/reader/full/tools-55ab58c08c20c 55/58
Support & Resistance
The Support and Resistance tool uses specified chart prices to calculate Support andResistance lines. The High, Low, and Close prices of a daily range are often used as 3 inputprices. To apply the Support and Resistance tool on a chart click the Support and Resistancebutton. The cursor will change to a pencil while in the draw mode. Click on the 1st point from
a high point (usually the High of a bar), then click on the 2nd point. The 2nd point should bethe Low of the bar or trading range. Now click on the 3rd point. The 3rd point is the pointwhere the market is currently trading, or the Closing point of the range. Click the left mousebutton once to mark the 3rd point.
Place a check mark on the tools' property form in the 'Find H-L-C' box to automatically find thePivot value using the indicated prices in the drop-down list box. The drop-down list boxallows you to choose a few variations on which prices to use for the Pivot calculation. Makesure that you place a check mark in the 'Find H-L-C' box if you want to use the pricesindicated in the drop-down list box. Example, if you select (H+L+C+O)/4 from the listbox, thetool will auto-find these prices for you.
Adjusting Support and Resistance LinesRe-selecting the lines will activate the ability to move the lines. Click the mouse on either of the first two points to activate the lines. Square Bullet marks will highlight the three originalpoints. Place the mouse on any of the square bullet marks and drag the lines to a newlocation.
55

5/17/2018 Tools - slidepdf.com
http://slidepdf.com/reader/full/tools-55ab58c08c20c 56/58
Properties
Click the Chart Objects button, select Support & Resistance, then click the Properties buttonto open the Properties window for the tool.
Find H-L-C - Place a check mark in the 'Find H-L-C' box to automatically find the Pivot valueusing the indicated prices in the drop-down list box. The drop-down list box allows you tochoose a few variations on which prices to use for the Pivot calculation. Make sure that youplace a check mark in the 'Find H-L-C' box if you want to use the prices indicated in the drop-down list box. Example, if you select (H+L+C+O)/4 from the list box, the tool will auto-findthese prices for you.
Labels Left/Right - Place a check mark in the 'Labels Left' box to print the labels on the Left of the lines. Place a check mark in the 'Labels Right' box to print the labels on the Right of thelines. Place a check mark in the 'Show Mid Lines' box to plot midpoint lines between thespecified lines.
Day Session - Use only the Day Session chart bars for the calculation.
The 'Price' boxes can be used to enter specific prices for the 3 entry points. Increase the'Extend Multiplier' to make the lines longer. Support and Resistance lines are plotted basedon the calculated Pivot point. The lines indicate possible support and resistance levels.Watch for support and resistance on the lines. NOTE: The first 4 Support and Resistancelines can be accessed by the Alerts Trading System draw tool.
56

5/17/2018 Tools - slidepdf.com
http://slidepdf.com/reader/full/tools-55ab58c08c20c 57/58
Formula
• Pivot = (High Point + Low Point + Close Point) / 3 (example)
• Range = High Point – Low Point
• 4R [4th Resistance] = 2R + Range
• 3R [3rd Resistance] = 1R + Range
• 2R [2nd Resistance] = Pivot + Range
• 1R [1st Resistance] = Pivot + (Pivot - Low)
• H [Yesterday's High]
• P [Pivot Price, i.e. Midpoint]
• L [Yesterday's Low]
• 1S [1st Support] = Pivot - (High-Pivot)
• 2S [2nd Support] = Pivot - Range
• 3S [3rd Support] = 1S – Range
• 4S [4th Support] = 2S - Range
Pivot Price
The pivot price is always contained within the range of theHigh and the Low points. When the formula for the Pivot is(High+Low+Close)/3 then the Pivot will be in the middlethird of the High-Low range. The highest pivot price wouldbe when the Close is at the High, wherein the Pivot is at66.7% of the daily range. The lowest pivot price would bewhen the Close is at the Low, wherein the Pivot would beat 33.3% of the daily range. The illustration shows themaximum extremes of the pivot price for the oft used
formula of Pivot = (H+L+C)/3.
1st Support and 1st Resistance
The 1st Support and 1st Resistance levels are created by inverting the daily range verticallyabout the pivot point. I guess that is where the pivot point gets its name. This illustrationshows the effect of pivoting the 1st bar which is shown in two colors to illustrate the part thatis above the pivot and the part that is below the pivot. The 2nd bar is the 1st bar invertedabout the pivot point, and it shows where the 1st Support and the 1st Resistance levels comefrom.
57

5/17/2018 Tools - slidepdf.com
http://slidepdf.com/reader/full/tools-55ab58c08c20c 58/58
2nd Support and 2nd Resistance
These two levels are calculated by adding thedaily range to the pivot price and subtracting thedaily range from the pivot price. The daily rangeis shown graphically as the vertical blue lines
above and below the pivot price.
3rd Support and 3rd Resistance
These two levels are similar to the 2nd S&Rlevels. The daily range is added to the 1stResistance level and subtracted from the 1st
Support level. The graphical illustration of this isshown using the orange lines to measure thedaily range.
Other Formulas
There are other variations of the above theme for calculating Support andResistance levels. The most common variation is to use a different formulafor the Pivot Price. Ensign Windows supports the following variations throughthe use of the drop down listbox to select the Pivot Price formula. The mostcommonly used formula for the Pivot is the (H+L+C)/3 selection.
Other formula may look different that what has been presented in this article. More often thannot, algebraic rearrangement of the formula terms simplify the formulas to those given in thisarticle.
read more >> Support and Resistance Color Zones
58