Embed Size (px)
Citation preview

London Cycling Design Standards consultation draft – June 2014 24
Chapter 2 – Tools and techniques
Chapter 2
Tools and techniques
2.1 The Tube Network for the Bike 25
Overview 25
London’s cycling network strategy 26
Stakeholder involvement 28
Cycling Level of Service assessment 29
Junction assessment tool 33
2.2 Developing a coherent cycle network 36
Review of existing conditions 36
Mesh density analysis 38
Accessibility classification 40
Area porosity analysis 41
Cycling Level of Service audit 42
Example approaches to developing the network 44
Planning cycling into new development 46
2.3 Scheme delivery 49
Scheme stages 49
Traffic Regulation Orders for cycling schemes 52
Procedures for creating cycle tracks and shared use paths 53
2.4 Maintenance 54

London Cycling Design Standards consultation draft – June 2014 25
Chapter 2 – Tools and techniques
2.1 The Tube Network for the Bike
Overview
2.1.1
This chapter sets out network planning, route planning and implementation tools and
techniques, showing how planning, design and delivery are related. All the tools
described here are intended to serve the over-riding objectives of efficiently delivering
safer, more comfortable, direct, coherent, attractive and adaptable cycling
infrastructure. They should be applied in a proportionate manner.
The level of route delivery planning, design and stakeholder involvement needs to be
appropriate for the level of intervention proposed. Where there are limited changes to
be made, as is likely for large stretches of Quietway routes, then a minimal approach
should be taken and procedural demands should not be allowed to impede delivery.
2.1.2
The relationship between different techniques and procedures is shown in figure 2.1
below.
Figure 2.1 Overview of techniques and procedures for delivery cycle infrastructure
As appropriate through the process:
Stakeholder involvement
Cycling Level of Service assessment
Influencing other emerging schemes
NETWORK STRATEGY
NETWORK PLANNING & LAND USE PLANNING
ROUTE ASSEMBLY
SCHEME DELIVERY
MONITORING, MAINTENANCE, ENFORCEMENT

London Cycling Design Standards consultation draft – June 2014 26
Chapter 2 – Tools and techniques
London’s cycling network strategy
2.1.3
The network strategy for London is the development of the ‘Tube Network for the Bike’
approach described in The Mayor’s Vision for Cycling. Its application in London is geared
to enabling more people to cycle more safely, mindful of the expected growth in numbers
of cyclists. Routes and schemes that contribute to the network in outer London are aimed
at transforming cycling in areas where numbers of cyclists may be low or stable but where
there is great potential for further growth.
2.1.4
The elements that make up the network are:
Cycle Superhighways New Superhighways Upgrade of the four existing Superhighways
Quietways Central London Grid New Quietways in inner and outer London
Mini-Hollands Transformation of town centres and associated areas in three boroughs: Enfield, Kingston-upon Thames and Waltham Forest
2.1.5
Different approaches have been planned for areas of different cycling potential. Area-wide
infrastructure is appropriate for central London or specific outer London town centres,
where there is a high density of potential and existing cycle journeys. Outside these urban
centres, the cycling potential is less concentrated, so planned infrastructure such as
Superhighway or Quietway routes will be adapted accordingly.
Superhighways
2.1.6
The first four Superhighways brought about an average 77 percent increase in cycling on
the routes concerned – 30 per cent of those cycling trips are new or switched from another
mode. The contribution of the Cycle Superhighway programme to the overall network has
been revised in the light of the aspirations set out in the Mayor’s Vision for Cycling. Cycle
Superhighways in the new network will include upgraded versions of the existing routes
and new routes.
London Cycling Design Standards consultation draft – June 2014 27
Chapter 2 – Tools and techniques
2.1.7
The Cycle Superhighways programme has a large interface with the responsibilities of
London boroughs and others. In some cases, the route is on borough-owned roads and
there needs to be close working between TfL and the boroughs to obtain approvals and
buy-in to any proposals. Even where TfL is the highway authority, boroughs should still be
closely involved in the design process as the measures implemented are likely to have an
impact beyond the TLRN highway.
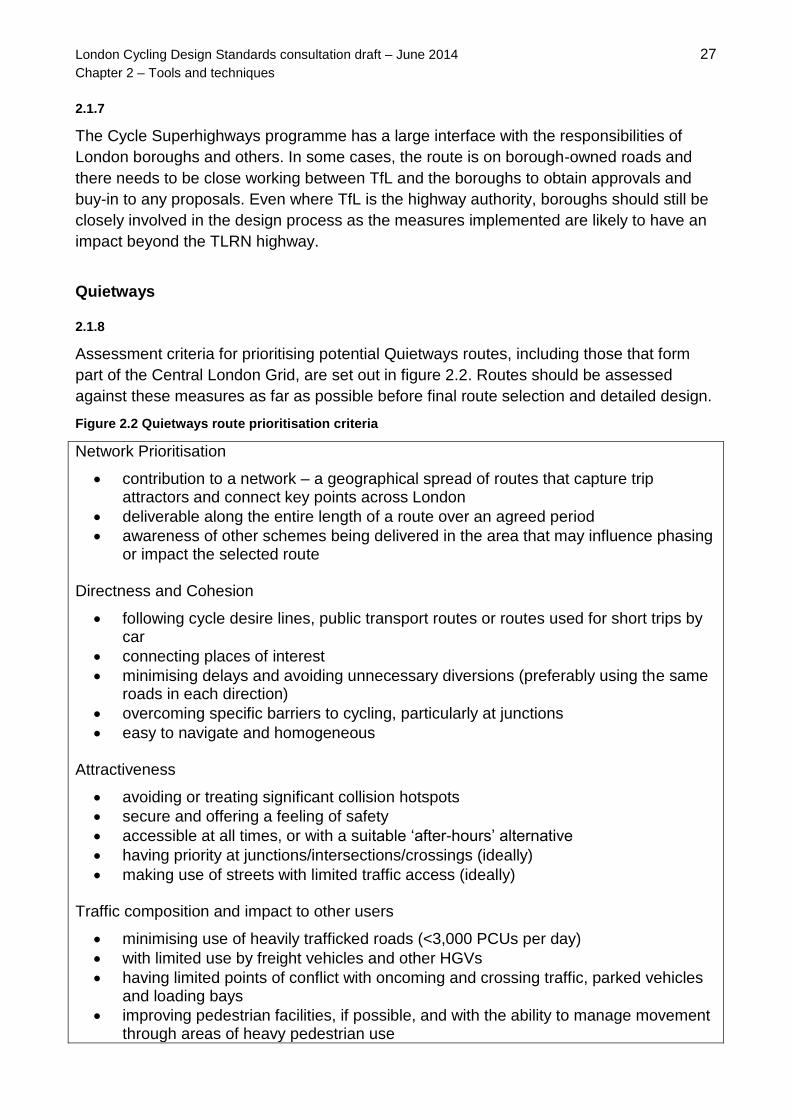
Quietways 2.1.8
Assessment criteria for prioritising potential Quietways routes, including those that form
part of the Central London Grid, are set out in figure 2.2. Routes should be assessed
against these measures as far as possible before final route selection and detailed design.
Figure 2.2 Quietways route prioritisation criteria
Network Prioritisation
contribution to a network – a geographical spread of routes that capture trip attractors and connect key points across London
deliverable along the entire length of a route over an agreed period
awareness of other schemes being delivered in the area that may influence phasing or impact the selected route
Directness and Cohesion
following cycle desire lines, public transport routes or routes used for short trips by car
connecting places of interest
minimising delays and avoiding unnecessary diversions (preferably using the same roads in each direction)
overcoming specific barriers to cycling, particularly at junctions
easy to navigate and homogeneous Attractiveness
avoiding or treating significant collision hotspots
secure and offering a feeling of safety
accessible at all times, or with a suitable ‘after-hours’ alternative
having priority at junctions/intersections/crossings (ideally)
making use of streets with limited traffic access (ideally) Traffic composition and impact to other users
minimising use of heavily trafficked roads (<3,000 PCUs per day)
with limited use by freight vehicles and other HGVs
having limited points of conflict with oncoming and crossing traffic, parked vehicles and loading bays
improving pedestrian facilities, if possible, and with the ability to manage movement through areas of heavy pedestrian use

London Cycling Design Standards consultation draft – June 2014 28
Chapter 2 – Tools and techniques
Buildability
known significant outstanding land ownership, access issues or ecological issues
with significant sections already to a good standard
limited requirement for signals work
practicality and cost effectiveness of any modification to junctions Political support
with support in principle for the entire route from the managing authority, senior officer and/or relevant Member
with agreement on alignments and improvements secured between all boroughs involved
Stakeholder involvement
2.1.9
Stakeholder support and consultation throughout the process is important for schemes to
be successful. They can provide valuable information and local knowledge during route
planning and scheme development. To be meaningful, it needs to be conducted at times
when it can positively influence outcomes without causing delay and done in a
proportionate manner. Stakeholder involvement has two distinct functions: incorporating
and responding to stakeholder interests, and keeping stakeholders informed of issues that
affect their interests.
2.1.10
Stakeholders are likely to include:
ward councillors and highway authority
TfL, including modal specific representatives such as buses and taxis and private hire
local employers and other generators (or potential generators) of significant cyclist movement, such as higher education establishments and hospitals
cycling organisations
freight industry representatives
groups with an interest in pedestrian accessibility
developers or landowners whose land may be affected or who may be asked to contribute to funding
residents, local amenity groups, conservation groups and English Heritage.

London Cycling Design Standards consultation draft – June 2014 29
Chapter 2 – Tools and techniques
Cycling Level of Service assessment
2.1.11
A Cycling Level of Service (CLoS) assessment has been developed in order to set a
common standard for the performance of cycling infrastructure for routes and schemes,
and for individual junctions. The purpose of the CLoS assessment is to frame discussion
about design options so that schemes are appealing for existing cyclists and can entice
new cyclists onto the network. It may be used on any scheme that has an impact on the
street environment.
2.1.12
As it is focused on ‘rideability’, the experience of cycling and the performance of links and
junctions, CLoS does not differentiate between street types. Infrastructure appropriate to
the street type is a prior consideration, although acceptable scoring ranges may need
adjustment by street type according to how programme-specific requirements are defined.
2.1.13
CLoS builds on the knowledge of existing systems such as the CIHT Cycle Audit and
Cycle Review, the London Cycling Campaign’s User Quality Audit and 'Love London, Go
Dutch' matrix and the Dutch 'Bicycle Balance' system. It does not replace any existing
audit system such as the Road Safety Audit, Non Motorised User Audit or Cycle Audit. It is
designed to raise issues already covered by regulatory and statutory documents rather
than introducing new requirements and can be used in conjunction with toolkits such as
PERS and FERS, the pedestrian and freight environment review systems.
2.1.14
Anybody can undertake the CLoS assessment but highway authorities or consultants
working within the industry are capable of giving extra quality assurance in using the tool.
The assessment is designed to promote discussion, and should be balanced with the
judgement of the engineer or planner involved.
2.1.15
The CLoS should fit into several stages of the lifecycle of a scheme:
at planning stage, it could help to identify issues, frame objectives and quantify benefits arising from potential improvements to inform a business case (by using existing economic evaluation procedures) – this particularly refers to route assessment and route prioritisation
at design brief stage, it could be used to give a baseline score for the existing conditions
at a preliminary design stage, several feasibility options could be measured against each other and the differences used to inform discussion with stakeholders
post-completion, it could help ensure that maintenance of the route remains a priority

London Cycling Design Standards consultation draft – June 2014 30
Chapter 2 – Tools and techniques
2.1.16
CLoS is based on the six design outcomes of safety, directness, coherence, comfort,
attractiveness and adaptability. It then breaks down each into specific factors. At the next
level of detail are indicators that can be used to measure performance against each factor.
For example, the ‘safety’ element contains three factors: collision risk, feeling of safety and
social safety. CLoS focuses on environments that would entice new cyclists to switch
journeys from other modes and maintain this modal shift for the long term.
2.1.17
As figure 2.3 shows, each indicator has a set of descriptions and score values – either 0, 1
or 2. The ‘basic’ level of service, or zero score, may trigger the need for improvement, but
this depends on the overall context of the route and of the project. Zero scores should be a
prompt for examining whether the factor in question will have a negative impact on the
propensity to cycle. Users are encouraged to set expectations that are ambitious while
also being achievable.
2.1.18
Certain factors also have ‘critical’ scores, which describe circumstances that should be a
cause for particular concern. Clients and designers must address these as a priority, even
if only to ‘lift’ them to a zero score – a scheme that registers as ‘critical’ on any one
indicator has not met the required standard for programmes and projects funded under the
Mayor’s Vision for Cycling. To be given greater weighting in the scoring system, it is
suggested that the 0, 1 or 2 scores for where critical factors are identified should be
multiplied by 3.
2.1.19
At the route planning stage, it is not likely that all factors can be measured, largely
because routes are likely to include many types of additional cycling provision. In this
case, factors that are of greatest importance and relevance at the network level should be
prioritised.

31 Figure 2.3 Cycling Level of Service assessment matrix (part 1)
Factor Indicator Critical Basic CLoS (score=0) Good CLoS (score=1, or 3 for critical indicators)
Highest CLoS (score=2, or 6 for critical indicators)
Max score
Safety
Collision risk
Left/right hook at junctions
Heavy streams of turning traffic cut across main cycling stream
Side road junctions frequent and/or untreated. Conflicting movements at major junctions not separated
Fewer side road junctions. Use of entry treatments. Conflicting movements on cycle routes are separated at major junctions
Side roads closed or footway is continuous. All conflicting streams separated at major junction
6
Collision alongside or from behind
Nearside lane in pinch point range 3.2 to 3.9m
Cyclists in wide (4m+) nearside traffic lanes or cycle lanes less than 2m wide
Cyclists in cycle lanes at least 2m wide
Cyclists with a high degree of separation from motorised traffic
6
Kerbside activity or risk of collision with door
Narrow cycle lanes <1.5m alongside parking/loading / no buffer
Frequent kerbside activity on nearside of cyclists / cycle lanes giving effective width of 1.5m
Less frequent kerbside activity on nearside of cyclists / cycle lanes giving effective width of 2m
No kerbside activity / Parking and loading on outside of cycling facility
6
Other vehicle fails to give way or disobeys signals
Reasonable visibility, route continuity across junctions and priority not necessarily clear
Clear route continuity through junctions, good visibility, priority clear for all users, visual priority for cyclists across side roads
Cycle priority at signalised junctions; visual priority for cyclists across side roads
2
Feeling of safety
Separation from heavy traffic
Cycle lanes 1.5-2m wide / ASLs at junctions
Cycle lanes at least 2m wide / some form of separation
Cyclists physically separ-ated from other traffic at junctions and on links
2
Speed of traffic (where cyclists are not separated)
85th percentile greater than 30mph
85th percentile greater than 25mph
85th percentile 20-25mph
85th percentile less than 20mph
6
Volume of traffic (where cyclists are not separated)
>1,000 vehicles / hour at peak
500 -1,000 vehicles / hour at peak < 5 per cent HGV or critical
200 - 500 vehicles / hour at peak, <2 per cent HGV
<200 vehicles / hour at peak
6
Interaction with HGVs Frequent, close interaction
Some interaction Occasional interaction No interaction 6
Social safety
Risk/fear of crime Risk is managed: no ‘ambush spots’, reasonable level of street maintenance
Low risk: area is open, and well designed and maintained
No fear of crime: high quality streetscene and pleasant interaction
2
Lighting Some stretches of darkness
Few stretches of darkness
Route lit thoroughly 2
Isolation Route generally close to activity, for most of the day
Route close to activity, for all of the day
Route always overlooked
2
Impact of highway design on behaviour
Seeks to controls behaviour in parts
Controls behaviour throughout
Encourages civilised behaviour: negotiation and forgiveness
2
Directness
Journey time
Ability to maintain own speed on links
Cyclists travel at speed of slowest vehicle/cycle ahead
Cyclists can usually pass traffic and other cyclists
Cyclists choose their own speed (within reason)
2
Delay to cyclists at junctions
Journey time slightly longer than motor vehicles
Journey time around the same as motor vehicles
Journey time less than motor vehicles (eg cyclists can bypass signals)
2
Value of time
For cyclists compared to private car use (normal weather conditions)
VOT only slightly greater than private car use value due to some site-specific factors
VOT equivalent to private car use value: similar delay-inducing factors and convenience
VOT less than private car use value due to attractive nature of route
2
Direct-ness
Deviation of route (against straight line)
Deviation factor 35-50 per cent
Deviation factor 20-35 per cent
Deviation factor <20 per cent
2
Coherence
Connec-tions
Ability to join/leave route safely and easily
Cyclists do not have to dismount to connect to other routes
Cyclists can connect to other routes relatively easily
Cyclists provided with have dedicated conn- ections to other routes
2
Density of other routes
Network density mesh width >400m
Network density mesh width 250 - 400m
Network density mesh width <250m
2
Way-finding
Signing Basic road markings provided
Some signs and road markings, making it hard to get lost
Consistent signing of range of routes and destinations at decision points
2

32 Figure 2.3 Cycling Level of Service assessment matrix (part 2)
Factor Indicator Critical Basic CLoS (score=0) Good CLoS (score=1, or 3 for critical indicators)
Highest CLoS (score=2, or 6 for critical indicators)
Max score
Comfort
Surface quality
Defects: non cycle friendly ironworks, raised/ sunken covers/gullies
Major defects Some localised defects but generally acceptable
Minor defects only Smooth high grip surface
6
Surface material
Construction: asphalt concrete, HRA or blocks/bricks/sets
Hand laid asphalt; no unstable blocks/sets
Machine laid asphalt concrete or HRA; smooth blocks
Machine laid asphalt concrete; smooth and firm blocks undisturbed by turning vehicles
2
Effective width without conflict
Allocated riding zone range. Lane allocation each direction
<1.5m Superhighway <1.2m elsewhere
1.5-2.0m Superhighway 1.2-1.5m elsewhere (or 3-3.2m shared bus/cycle lane)
2.0-2.5m Superhighway 1.5-2.0m elsewhere (or 4.0m+ bus lane)
>2.5m Superhighway >2m elsewhere
6
Gradient Uphill gradient over 100m
>5 per cent 3-5 per cent <3 per cent 2
Deflect-ions
Pinch points caused by horizontal deflections
(Remaining) lane width <3.2m
(Remaining) lane width >4.0m
Traffic is calmed so no need for horizontal deflections
2
Undu-lations
Vertical deflections Round top humps Sinusoidal humps No vertical deflections 2
Attractiveness
Impact on walking
Highway layout, function and road markings adjusted to minimise impact on pedestrians
Largely achieves Pedestrian Comfort Level (PCL) B but C in some high activity locations
No impact on pedestrian provision / PCL never lower than B
Pedestrian provision enhanced by cycling provision / PCL A
2
Greening Green infrastructure or sustainable materials incorp-orated into design
No greening element Some greening elements Full integration of greening elements
2
Air quality PM10 & NOX values referenced from concentration maps
Medium to High Low to Medium Low 2
Noise polution
Noise level from recommended riding range
>78DB 65-78DB <65DB 2
Minimise street clutter
Signage and road markings required to support scheme layout
Little signage in excess of regulatory requirements
Moderate amount of signage, particularly around junctions
Minimal signage, eg. for wayfinding purposes only
2
Secure cycle parking
Ease of access to secure cycle parking within businesses and on street
Minimum levels of cycle parking provided (ie to London Plan standards)
Some cycle parking provided above minimum, to meet current demand, and attention to quality and security
Cycle parking is provided to meet future demand and is of good quality, securely located
2
Adaptability
Public transport inte-gration
Smooth transition between modes or route continuity maintained through interchanges
No additional consideration for cyclists within interchange area
Cycle route continuity maintained through interchange and some cycle parking available
Cycle route continuity maintained and secure cycle parking provided. Transport of cycles available.
2
Flexibility Facility can be expanded or layouts adopted within area constraints
No adjustments are possible within constraints. Road works may require some closure
Links can be adjusted to meet demand but junctions are constrained by vehicle capacity limitations. Road works will not require closure; cycling will be maintained although route quality may be compromised to some extent
Layout can be adapted freely without constrain to meet demand or collision risk. Adjustments can be made to maintain full route quality when roadworks are present
2
Growth enabled
Route matches predicted usage and has exceedence built into the design
Provision copes with current levels of demand
Provision is matched to predicted demand flows
Provision has spare capacity for large increases in predicted cycle use
2
TOTAL (max 100)

London Cycling Design Standards consultation draft – June 2014 33
Chapter 2 – Tools and techniques
2.1.20
User satisfaction surveys can be particularly useful for capturing some of the more
subjective judgements in the assessment. It is important to make a clear connection
between the needs of the local users and the reasons for making certain design decisions.
As figure 2.3 shows, subjective safety – therefore the perception of risk – is a key factor in
measuring the fitness-for-purpose of a cycling facility, even where the collision history of a
location, for example, might indicate that the objectively measured risk is low.
2.1.21
The impact on walking is a critical element in the assessment, even though it may not be
directly linked to level of service for cyclists. A Pedestrian Comfort Assessment, as
described in TfL’s Pedestrian Comfort Guidance, should be used as in the CLoS to provide
an objective rating for the balanced profile.
Junction assessment tool
2.1.22
As collisions tend to be clustered around junctions, a supplementary process for assessing
junctions has been developed. This may be used to inform a broader assessment of a
given location, or in order to inform scoring of the collision risk criteria in the CLoS
assessment.
2.1.23
Rather than going through the entire CLoS assessment for each possible movement of a
cyclist through a junction, an estimation of potential conflict can be done through briefly
assessing each of the potential movements in turn and marking them on a plan of the
junction, as shown in figure 2.4. Each movement can be rated ‘red’, ‘amber’ or ‘green’
according to how safely and comfortably it can be made by cyclists:
where conditions exist that are most likely to give rise to the above collision types, then the movement should be represented on the plan as a red arrow
where the risk of those collision types has been reduced by design layout or traffic management interventions, then the movement should be coloured amber
where the potential for collisions has been removed entirely, then the route should be coloured green
‘green’ should be taken to mean suitable for all cyclists; ‘red’ means suitable only for a minority of cyclists (and, even for them, it may be uncomfortable to make)
2.1.24
Any banned movements for cyclists should be shown in black with a cross at the end.
Movements that can be made but would involve a particularly high level of risk to the
cyclist should be noted with a red cross at the end. These are movements that most cycle
trainers would advise against making.

London Cycling Design Standards consultation draft – June 2014 34
Chapter 2 – Tools and techniques
Figure 2.4 Example assessment for a generic junction
Ahead movements in two directions are aided by lanes marked through junctions and have been marked as green.
The street at the top is one-way – showing the banned cycling movements highlights a potential need to open it up to contraflow cycling.
The three possible right turns are all relatively difficult to make, being opposed turns, although ASLs help in each case.
In two cases, the pedestrian crossing island on the opposite arm gives some protection for right-turning cyclists from opposing traffic, so these have been scored as amber.
However, the right turn from the arm at the bottom scores a red because it would be hard for a cyclist to find a safe waiting place while ahead and right-turning traffic emerges from the one-way street.
2.1.25
For ‘red’ movements, one solution might be to enable the movement at a location away
from the main point of potential conflict, but there may be many different ways of
reconfiguring the junction to provide better and safer provision for cyclists (see chapter 4
for more details on junction design).
2.1.26
To help in comparing options, a score can be given based on each movement: 0 for red, 1
for amber and 2 for green. In this way, a total can be generated for the junction, or even for
individual routes through the junction (if it is the case that one route or movement for
cyclists is a significantly higher priority than another). The highest possible score for a
crossroad junction would be 24 and for a T-junction 12. In order to help assess junction
movements, figure 2.5 suggests typical scenarios that might lead to a ‘red’, ‘amber’ or
‘green’ rating.

London Cycling Design Standards consultation draft – June 2014 35
Chapter 2 – Tools and techniques
Figure 2.5 Indicative criteria for scoring junction assessments
Factors needing removal or mitigation
Possible improvements Further improvements
RED AMBER GREEN
Heavy left turn movement with high HGV mix
Opposed right turns with general traffic accelerating quickly into opportunistic gaps
Left slip lane
Guard-railing
Large junction radii
High speed motor traffic through junction
Uphill gradients
Wide junction crossings
No clear nearside access
Multiple lanes
Entry treatment at side road junction
Continuation of lane across junction
Right-turn protected island
Tight corner radii; pinch points removed (avoiding nearside lane of 3.2-3.9m)
Bus lane of 3.0-3.2m or of 4.5m or more
2m wide central feeder lane
ASLs (preferably 5m+ deep)
Signal adjustments to cycle movements
Left turn ban for general traffic
Opposing right turn banned for general traffic
Physically protected turn
Left bypass of signals
Segregation of cycle movements using dedicated cycle signals
Raised tables
Area-wide speed limit/reduction
2.1.27
The CLoS assessment also provides an argument for how improvements for cycling could
be made in stages. A closure to motor vehicles, allowing filtered permeability for cyclists,
may be a first stage of meeting longer-term objectives for area improvements, making
streets better, safer places for all. The first stage represent one intermediate level of
service, the second a higher level.

London Cycling Design Standards consultation draft – June 2014 36
Chapter 2 – Tools and techniques
2.2 Developing a coherent cycle network
2.2.1
This section covers examples of techniques that can be used to help network planning.
Step-by-step it covers the full process for planning a network for cycling, taking into
account urban form and land use as well as street types and route characteristics – as
summarised in figure 2.6. In reality, some of the network is likely to be in place (but may be
in need of upgrading) and some of the analysis may already exist, so these steps are not
requirements in route planning and scheme development. They are presented here as
helpful techniques that may be applied to support the development of a coherent network
and that could be used in communicating what a good network for cycling looks and feels
like.
Figure 2.6 Planning a cycle network from the beginning
Review of existing conditions
2.2.2
Figure 2.7 shows a typical London street layout with a railway line, a canal, a park and
different road classifications such as connectors, high roads, high streets, city streets, city
places and local roads. These are suggested by the road thickness and frontages.
Character buildings and major trip generators have also been highlighted. Proposals for
cycling should reflect the character of an area and the movement and place functions of its
streets. Cycling infrastructure should improve the quality of streets and so coherent
network planning needs to be sensitive to its surroundings.
Review existing conditions
Mesh density analysis
Classification audit
Porosity analysis
Cycling Level of Service assessment

London Cycling Design Standards consultation draft – June 2014 37
Chapter 2 – Tools and techniques
2.2.3
Overlaid on the street plan is a 400m by 400m grid: this is also the standard mesh density
sought for cycle networks in central London, as referenced in the CLoS. The coloured lines
show the existing cycle networks. In this case, the red route forms part of the national
cycle network which spans the UK and, in some cases, joins up with the international
EuroVelo network. It should be recognised that this network has a strategic importance
and any changes to it could affect many users. The blue routes shown are local routes that
may well have been developed as part of the London Cycle Network programme and so
may serve a strategic function as part of long-held desire lines for cyclists. Routes of this
type can date back many years, may be best considered for future network adoption and
often already feature cycle-friendly interventions. The green route shows a route along a
canal towpath that may form part of the greenway network. This route may not be suitable
for all types of cyclists, particularly commuter cyclists, but could form a part of the area
cycle network due to its attractive, traffic-free condition.
2.2.4
In any area the remnants of previously planned strategic cycle networks should be evident
and these should be referenced on the base plan so that gaps or other failures can be
assessed. It is important to view routes in context and incorporate cycling within the unique
layout of the area without compromising strategic network considerations such as
coherence and directness. At all stages of this process, it is also important to source up-to-
date and accurate information.
Figure 2.7 Existing context showing base network
Key
London Cycling Design Standards consultation draft – June 2014 38
Chapter 2 – Tools and techniques
Method
briefly assess place characteristics: natural features, key constraints (eg waterways or railways, including bridging points), local centres, land uses, trip generators (see figure 2.17 for a fuller list)
identify key trip generators, active frontages, character buildings
classify roads based on RTF street types (or refer to street type maps where this work has already been done)
overlay existing cycle networks, including strategic and local routes
Analysis
look for gaps in the existing cycle networks
look to see if cycling provision is appropriate for the RTF street type
look for desire lines between trip generators
identify character areas and heritage areas
Mesh density analysis
2.2.6
In a properly joined-up cycle network, cyclists should not have to travel more than 400m to
get to a parallel route of similar quality. As referenced in CLoS, this attribute of a cycle
network is known as ‘mesh density’: it describes whether the grid of cycle routes is tighter
(with more route choice) or looser (less extensive).
2.2.7
Analysis of mesh density is best undertaken with GIS software and there are two main
methods to follow – see figure 2.8. The first involves dividing the area into cells and
measuring the length of cycle network in each cell. A 1km by 1km cell should have 4km of
cycle network. The second method involves starting with the cycle network and its routes
and measuring the size of the areas bounded by the routes. An area of 160,000sqm would
be present inside a 400m by 400m mesh and so this can be used as the standard to
measure against. Smaller areas should show as hotter on the heat map (reds and
oranges) as there is more coverage than required and higher areas should show as cooler
(blues) as there is not enough coverage.
2.2.8
Sections of network that run across major barriers to cycling, such as major untreated
junctions and gyratory systems, should not be counted in either method. The data used in
the Transport for London Cycle Guides represents the best available picture of cycle
routes in London but local authorities may have more up-to-date information about the
condition and extent of local networks.

London Cycling Design Standards consultation draft – June 2014 39
Chapter 2 – Tools and techniques
Figure 2.8 Heat map representation of the density
Cell example
Area bound example
2.2.9
Figure 2.9 shows a heat map representation of the density of routes in the study area. The
analysis highlights in yellow the ‘cooler’ areas, with poorer cycle network coverage. The
‘hotter’ red areas have a lower mesh density: less distance between parallel routes. This
type of analysis can be used to test the impact of planned interventions and can be run
after networks have been extended to test even coverage.
Figure 2.9 Mesh density heat map
Key

London Cycling Design Standards consultation draft – June 2014 40
Chapter 2 – Tools and techniques
Method
assess cycle networks for major barriers
load cycle network data into
overlay existing cycle networks, strategically planned and local routes
highlight bridges, natural features and constraints
Analysis
look for areas of low network coverage and identify potential route options
look for areas of high network coverage and identify most strategic alignments
Accessibility classification
2.2.10
Figure 2.10 shows a reclassification of every road in the area based on the level of
experience needed to ride it comfortably. Primary roads (coloured red) suggest a high
level of confidence, secondary roads (amber) are cyclable in comfort by most cyclists and
routes free of motorised traffic (green) are suitable for cyclists of any age and experience.
The majority of London’s roads are secondary and so are rideable but certain primary
roads can be intimidating for new cyclists and so it is important to identify these. Local
knowledge and the input of cycle trainers within the authority should help identify the
correct classifications. The main determinants are street types, speed and volume of
traffic, mix of vehicle types and the extent to which cyclists are required to integrate with
general traffic and perform manoeuvres whilst in traffic.
2.2.11
This red, amber and green approach can also be taken to assessing crossings in the area.
The difference between primary and secondary crossings of primary roads is particularly
important in network terms as cyclists tend to migrate towards the more comfortable
crossing conditions. Local cycling stakeholders should be able to provide information
about where these pleasant crossings are located if resources are not available to do a full
network audit. Ordnance Survey GIS systems also provide this data.
Method
Assess all links on the network to determine level of experience needed to cycle in comfort
Highlight comfortable secondary crossings of primary roads
Analysis
Look for potential new crossing sites, bearing in mind the benefits that can be secured for other users as well as cyclists (ensuring a balanced approach)
Look for areas dominated by primary roads and consider interventions

London Cycling Design Standards consultation draft – June 2014 41
Chapter 2 – Tools and techniques
Figure 2.10 Accessibility classification of road network
Key
Primary Secondary Routes free of motorised traffic
Area porosity analysis
2.2.10
Area porosity is a measure of how many places there are for cyclists to enter, pass
through and leave an area comfortably. A location that is ‘porous’ is a space that cyclists
can pass through with ease and comfort – usually a junction. If the porosity of an area is
high, then overall it is very permeable for cyclists (but often less so for other vehicles).
Figure 2.11 shows areas bound by primary roads. Comfortable (porous) secondary
crossings are shown as gateways as these effectively open up areas to less confident
cyclists. The provision of a gateway crossing can enable many square kilometres of route
options to be opened up and also serve as key navigational points across areas.
2.2.11
Where areas are bound by primary roads and have no gateways, then they are coloured
red. Where they have one gateway they are coloured amber and where then have two
they are coloured green. Rather than focussing on routes, this method shows the porosity
of an area by highlighting different crossing options on different streets. This approach is
particularly useful when planning routes to schools as it allows children and their parents
to be clear about the standard of roads they will encounter and where key crossings are.

London Cycling Design Standards consultation draft – June 2014 42
Chapter 2 – Tools and techniques
Method
Create areas bound by primary roads
Gather information as to where the current comfortable secondary crossings and access points are
Colour in bounded area based on the number of access points
Analysis
Look for areas that are effectively cut off as they are bound by busy primary roads
Assess where the likeliest new crossing can be provided into an area
Identify where access is needed for maintenance (for vehicles carrying out maintenance works)
Plan adjustments to networks to incorporate gateways, mindful of the directness design outcome
Figure 2.11 Area porosity analysis showing areas bound by primary roads and number of gateways
Key
Cycling Level of Service audit
2.2.12
Figure 2.12 shows road classification based on the Cycling Level of Service. This takes
time to complete in full but gives a comprehensive baseline of the rideability of the streets
in an area. Routes that fall below the standards stipulated in the CLoS should be
considered for upgrading or, if constraints are too great, then this approach can highlight
alternative alignments. The red, amber and green colouring is likely to look similar to the
accessibility classification system: this approach, based on the key design outcomes, adds
a greater level of sophistication, should it be required. Note that the value ranges may

London Cycling Design Standards consultation draft – June 2014 43
Chapter 2 – Tools and techniques
need to be adjusted according to specific programme requirements. On the example in
figure 2.12, the greenway route along the canal is rated as amber in CLoS as there may
be concerns about social safety, connections, effective width and lighting.
2.2.13
Potential strategic routes in the chosen area may require substantial investment, which
may need detailed justification. It is important that the junction assessment tool is used on
all junctions along planned strategic network routes and where cycle routes pass across
busier roads. If multiple roads are assessed, then the effect of area traffic management
improvements can be measured against the established baseline. This method is the most
time-consuming but helps collect vital information to underpin scheme prioritisation and
area traffic network strategies.
Method
Use the CLoS and junction assessment tool to assess the area network or focus on particular established or planned strategic routes
Analysis
Look where best conditions are and assess whether these can be connected to form routes
Assess potential for upgrading junctions to higher CLoS standards
Assess the standard of existing networks routes and look for potential improved alignments
Figure 2.12 Cycling Level of Service indicative ratings for network links and key nodes
Key

London Cycling Design Standards consultation draft – June 2014 44
Chapter 2 – Tools and techniques
Example approaches to developing the network
2.2.14
These tools can help identify where interventions would make the whole area accessible to
all cyclists. To develop this into a strategy, there are two main options: area-based
approaches and route-based approaches. The examples below describe how the
application of these strategic approaches may work in practice. In both cases, working
through the detail involves engaging with the impact on all modes and considering existing
on-street infrastructure and the potential for improving it for a broader range of users.
Area option – filtered permeability
2.2.15
Figure 2.13 shows a potential intervention that takes an area-based approach to improving
conditions for cycling by removing through motor traffic in zoned areas around a traffic-free
centre. Motorised traffic can enter and leave the zones but cannot pass between them
without using the primary routes or alternative roads outside the zones. Cyclists can pass
freely through motorised traffic restrictions between zones and so are favoured in terms of
journey time and convenience. Residents benefit from removal of through-traffic and their
homes can still be served by deliveries and parking. Most motorised vehicle movements
will be made by residents themselves. The general level of traffic is reduced to such an
extent that the CLoS scores are improved on all roads dramatically without the need for
cycle-specific infrastructure. This is a bold approach but delivers a high level of service for
cycling in a cost-effective manner.
Figure 2.13 Filtered permeability area treatment example
Key

London Cycling Design Standards consultation draft – June 2014 45
Chapter 2 – Tools and techniques
2.2.16
This approach has no obvious cycling facilities to entice new cyclists but is a method
employed by many towns and cities with high mode shares for cyclists. The London
Borough of Hackney has implemented this approach in certain areas and has the highest
modal share for cycling in London. Other cities and towns have used features such as
rivers and railway lines to divide areas into zones. If quick and easy access for pedestrians
and cyclists are implemented across these barriers then these modes will flourish, while
motorised traffic has to take longer, more circuitous routes.
Route option – network delivery
2.2.17
Figure 2.14 shows a route-based approach, where networks have been expanded,
connected and revised based on the five-step analysis. In the example, major
interventions such as a full junction redesign on a connector road where a Superhighway
meets a Quietway have been proposed as well as a new bridge link allowing a Quietway to
continue within the stipulated mesh density range. Land purchase has been suggested
through some private land acquisition to the south-east of the town centre, enabling two
Quietways to connect. New parallel secondary crossings have also been proposed to
increase area porosity.
Figure 2.14 Network delivery route treatment example
Key

London Cycling Design Standards consultation draft – June 2014 46
Chapter 2 – Tools and techniques
2.2.18
Some of the interventions are likely to be costly but justification can be made with
reference to the five-step process. This presents a logical, best practice assessment of an
area’s cycling potential and clearly points out network deficiencies and potential
improvements.
2.2.19
Cycle networks are often planned at a strategic, city-wide level but this process shows how
these can be adjusted locally to reflect the character, constraints and opportunities of the
surrounding area. Each local authority should incorporate these approaches into their area
planning strategies and this should lead to the mainstream establishment of cycling as a
viable mainstream transport option in line with the Mayor’s Vision.
Planning cycling into new development
2.2.20
The cycling network strategy should be an important influence on the planning of larger
development areas and should be integrated into authority- and area-wide spatial planning
frameworks as well being reflected in site-specific proposals. Figure 2.15 summarises how
the cycling design outcomes might be addressed in these plans and strategies.
2.2.21
Cycling infrastructure cannot be fitted into the streets of a new development once it has
been designed. High quality cycling provision must be designed into all new development
from the beginning. This does not mean token cycle parking, token painted separation on
footways or token advanced stop lines. It means designing new developments so that the
way cyclists move through the development meets the standards set down in this
document from the moment the first residents or tenants move in.
2.5.22
TfL’s online Transport Assessment Guidance tool describes the purpose and content of
transport assessments as part of the planning application process. This deals with areas
such as consideration of pedestrian and cycle linkages, trip generation, modelling and
impact. It is important to establish that access for cyclists to and through a development
will be provided to a desired quality. This is likely to require the input of cycling officers to
the development control process. Through pre-application discussions, the application
stage and enforcement, the planning process should ensure that proposals meet policy
requirements, that they are fit for purpose for the proposed site and development, and that
they are implemented as planned.

London Cycling Design Standards consultation draft – June 2014 47
Chapter 2 – Tools and techniques
2.5.23
The right balance needs to be struck between prescription and flexibility when planning
cycling infrastructure. When negotiating Section 106 contributions and Community
Infrastructure Levy (CIL) from developments to help fund improvements to cycling in an
area, it is better to describe the desired outcomes rather than specifying in the legal
agreement exactly what must be built. Where Section 106 requirements and CILs are
overly restrictive, they can be difficult to enact, or enacting them may have adverse
consequences for cycling.
2.5.24
In an outline planning consent, there should be a
commitment to providing dedicated cycling
facilities, but some flexibility should remain about
the type and exact location of cycling provision.
Over-prescription at this stage could undermine
attempts to design the most appropriate
treatments once detail of street and building
design becomes clearer. Setting out the strategy
for cycling in an outline application is more
important than the detail: ideally this should draw
on an existing network strategy (see section 2.1).
Cycling Strategy – Vauxhall Nine Elms on the South Bank
Figure 2.15 Support for cycling in planning policies, strategies and site-specific proposals
Strategic: planning and policy-making
Area-wide planning Site specific (planning applications)
Safety
Commitments to reducing death and injury on London’s streets, and to creating low speed environments.
Analysis of existing conditions for cyclists and pedestrians. Commitment to meeting design standards in improving provision.
Road Safety Audit, Non-Motorised User Audit or Quality Audit as part of Transport Assessment
Directness
Policy that prioritises sustainable forms of transport and supports accessible, legible, permeable urban form.
Analysis of the relationship between origins and destinations (schools, local centres, parks, homes, places of work), how cycling links will be provided between them and how all road user needs should be balanced.
Detail on proposed route(s), showing analysis of directness and likely delay for cyclists. Identification of barriers to be overcome by improving cycling provision.

London Cycling Design Standards consultation draft – June 2014 48
Chapter 2 – Tools and techniques
Strategic: planning and policy-making
Area-wide planning Site specific (planning applications)
Comfort
Linking air quality and environmental improvements to shifts from motorised forms of transport.
Requirements on level of service to be provided on identified routes. Evidence of responding to identified future demand for cycling.
Sufficient detail to allow analysis of effective width, gradient, deflections and capacity and surface quality. Should describe impacts on pedestrian comfort (using TfL’s Pedestrian Comfort Guidance).
Coherence
Commitment to sustainable forms of development and good integration between transport modes.
A hierarchy of streets and routes that clearly shows a joined-up, legible network for cycling.
Details of how proposals contribute to the development of a coherent network in the wider area.
Attractiveness
Recognition of the benefits of more people walking and cycling and interventions that promote better places for all. Provision of good quality, well located, secure cycle parking to help support growth in cycling.
Design guidance or code that deals with public realm quality – for example, setting out indicative street types that clearly how show good provision for cyclists will be provided. This should include indicative locations and quantity of cycle parking.
Detailed proposals for materials, cycle parking, other street furniture, signage, landscaping, management arrangements and maintenance costs.
Adaptability
Provision for measuring and monitoring strategic outcomes on cycling (eg route use, vehicle volumes and speeds) to help adapt to changing contexts.
Implementation plan that allows (re)assessment of cycling provision during and beyond the various development phases. Consideration of how improvements to cycling and walking are to be funded, for example through CIL or S106.
Proposals that set out how cycling facilities operate with other uses and kerbside activity and how provision can respond to change in demand over time.

London Cycling Design Standards consultation draft – June 2014 49
Chapter 2 – Tools and techniques
2.3 Scheme delivery
2.3.1
The network planning stage provides a framework for assessing and prioritising routes in
more detail. Once a route has been selected, the progress of a scheme involving
substantial intervention will normally follow the stages shown in figure 2.16 below.
Scheme stages
2.3.2
The full process set out here should include all necessary consultation, approvals, checks
and audits. The six design outcomes – safety, comfort, directness, coherence,
attractiveness and adaptability – should be used to frame scheme objectives, together with
recognising the intended outcomes for other modes besides cycling.
Figure 2.16 Scheme stages
Includes objectives related to design outcomes, programme-specific requirements, network strategy and route assessment.
Includes consideration of: stats and utilities, other schemes or maintenance programmes, other modes, community issues, local character, any signal modeling requirements. Stage 1 Road Safety Audit.
Traffic Management Act (TMA) notification: works location, scope, timescale. New Roads & Street Works Act Section 58 notices: coordination of works. Permits from neighbouring authorities for works on the boundary.
Internal consultation and review processes On-street notification or public consultation, as appropriate Consultation report In line with legal responsibilities, eg Highways Act 1980, CDM Regulations 2007, Road Traffic Regulation Act 1995, Traffic Management Act 2004, Disability Discrimination Act 1995.
Stage 2 Road Safety Audit.
Includes F10 Notification of Construction Project, Construction Phase Plan and any Traffic Management Orders required.
TMA works approval required from TfL.
Stage 3 Road Safety Audit once works are completed
Stage 4 Road Safety Audit one year after completion and when 3 years of collision data are available
1. Scheme brief
2. Feasibility
3. Notifications
4. Consultation
5. Detailed design
6. Pre-construction
7. Site supervision
8. Maintenance

London Cycling Design Standards consultation draft – June 2014 50
Chapter 2 – Tools and techniques
2.3.2
Figure 2.17 below shows the type of information that could be assessed in order to inform
design options in the feasibility stage. An assessment may have already been undertaken
during network planning (see section 2.2), but there may be a need to revisit this in more
detail once routes have been prioritised. Data collection needs to be done in a
proportionate manner, appropriate to the level of intervention proposed.
Figure 2.17 Current route characteristics
Place characteristics
Land uses and mix of activities Trees and other planting Materials Lighting Height, scale and massing of buildings
New developments and other schemes
Changes to physical layout New or removed generators of cycle movement
Major barriers/severance
Waterways, railways and main roads Large, contiguous landholdings
Legal aspects
Traffic Orders Land ownership Conservation areas and Listed buildings Tree Preservation Orders
Pedestrian amenity and activity
Conflicting movements at junctions and crossings Volumes of pedestrians Levels of pedestrian comfort Shared use and shared space Intersection with (off-highway) walking routes, including Strategic Walk Network
Traffic operations
Volume, speed and mix of traffic Capacity of links and junctions Heavy turning movements Main conflicting movements at junctions
Kerbside activity
Loading/unloading provision, including loading bays Parking provision, including parking bays Bus stops and stands Activities of taxis and private hire vehicles Frontage access and islands
Cycle movements and cyclists’ needs
Routes, flows and main movements Collision statistics Complaints and comments
Available widths
Highway, carriageway and footway Specific pinch-points and narrowing
24-hour access
Time-limited bus and mandatory cycle lanes Limits on access through parks and green spaces (formal and risk-based)

London Cycling Design Standards consultation draft – June 2014 51
Chapter 2 – Tools and techniques
2.3.3
If signal works are necessary then these should be programmed with TfL during the
feasibility stage. If modelling capability is not present in-house then a consultant should be
commissioned to run through the Model Auditing Process (MAP) with TfL. MAP is a
requirement for schemes that have an impact on the TLRN or Strategic Road Network,
and represents good practice for any other scheme. It has been developed to ensure that
models submitted to TfL for audit are developed, calibrated and validated to an appropriate
standard and is described fully in TfL’s Traffic Modelling Guidelines (2010). Signal design
should then be agreed with TfL during the detailed design stage – further information is
provided in chapter 4.
2.3.4
Road safety audits (RSAs) are well-established procedures, widely applied to cycling and
other traffic schemes. RSAs consider the road safety implications of all measures and their
impact on the network under all anticipated operating conditions. The effects on all classes
of road user are considered. In the hands of competent practitioners, RSAs improve the
design and safety of cycle schemes. TfL has produced guidance on its safety audit
procedures in the form of document SQA-0170, Road Safety Audit, Issue 4 (2011).
2.3.5
A balanced approach needs to be taken to RSAs in order to ensure that risk reduction
measures and restrictions are proportionate and appropriate for the street environment. It
is important that they contribute fully to the six design outcomes for cycling. Note that
RSAs are not appropriate tools for determining cycling priorities and requirements that will
support growth.
2.3.6
Changes to schemes are recommended as the audit team considers appropriate. On
receipt of the safety audit report, the scheme engineer/designer should consider its
content and amend the scheme accordingly. If the project sponsor authority does not wish
to incorporate some or all recommendations of the safety audit they are required to
prepare an ‘exception report’ stating the reason(s) why they consider the recommended
action is not appropriate.
2.3.7
During the pre-construction phase, TMA works approval should be submitted to TfL.
Works notification should happen by letter to those affected at least 2 weeks before works
begin. Notice required for parking suspensions is 17 days, bus suspensions 3 days and
signal switch-offs 3 days. If the works do not proceed then a cancellation notice should be
submitted. Works permits should be submitted a minimum of 10 days before works start.
Start notice should be submitted by 4.30pm the next working day and stop notice should
be submitted by 4.30pm the next working day following the end of the works. The CDM
coordinator should approve the construction phase plan before any works progress.

London Cycling Design Standards consultation draft – June 2014 52
Chapter 2 – Tools and techniques
Traffic Regulation Orders for cycling schemes
2.3.8
Proposed changes to regulations stand to give highway authorities greater discretion to
take decisions about procedures relevant to cycling infrastructure. This has the potential to
streamline processes that have previously added time and complexity to schemes, such
Traffic Regulation Order (TRO) requirements. Importantly, the Briefing on the
Government’s ambitions for cycling (2013) commits to removing the requirement for a
TRO for creating mandatory and contraflow cycle lanes, and for creating exemption for
cyclists from certain prohibitions for other vehicles. This includes simply adding ‘except
cycles’ to an existing ‘no entry’ restriction.
2.3.9
The Consultation on the draft Traffic Signs Regulations and General Directions 2015
(2014) confirms this intention, which will come into effect in 2015, subject to the results of
consultation. Until that time, TROs should still be prepared as set out by the Road Traffic
Regulation Act (1984) (RTRA). Should TROs no longer be required, it will still be important
for authorities to engage key stakeholders in an appropriate, timely and proportionate way
on any proposed changes to highways.
2.3.10
Traffic authorities are empowered under the RTRA to make TROs to regulate and manage
the speed, movement and parking and loading of vehicles and to regulate pedestrian
movement. The Environment Act 1995 enables Orders to be made in pursuit of national or
local air quality management strategies. The use of TROs to exempt cyclists from certain
prohibitions is an important tool in delivering coherent cycling infrastructure, particularly as
part of a ‘filtered permeability’ strategy.
Exemptions for cyclists in City of London: Fann Street and Milton Street
2.3.11
The detail of TROs is also relevant to cycling where it places prohibitions on parking and
waiting. On-street, these are shown by yellow line markings on the carriageway and the
kerb (see section 3.5 for more details). In environmentally sensitive areas, the

London Cycling Design Standards consultation draft – June 2014 53
Chapter 2 – Tools and techniques
intrusiveness of standard yellow line road-markings may be reduced by using narrower
lines and a paler shade of yellow.
2.3.12
TROs may be permanent, experimental (up to 18 months) or temporary (in most cases up
to 18 months). Temporary traffic orders are normally used for road works or emergencies.
Where they are required, specific consideration should be given to maintaining conditions
for cycling on cycle routes (see appendix B for further guidance on dealing with cyclists at
roadworks). Experimental orders may be useful where monitoring the effect of and public
reaction to an exemption, for example, may help make the case for a permanent change.
Procedures for creating cycle tracks and shared use paths
2.3.13
Scheme delivery may also need to build in the process for designating certain
infrastructure as being appropriate for cyclists. All on-highway but off-carriageway cycle
surfaces (cycle tracks, shared use paths and shared areas) must be formally approved
and have effective Notices in place. This will entail approval (by delegated authority) under
Section 65(1) of the 1980 Highway Act. For the TLRN this is carried-out by a TfL
designated officer. For roads managed by London boroughs, this is normally delegated to
a senior officer. As well as major areas of shared use and cycle track, the shared use
sections to either side of Toucan crossings will need to have effective Notices.
2.3.14
The TfL Traffic Orders Team hold copies of all Notices for existing TfL/TLRN cycle track,
shared use and adjacent/segregated use. These are recorded under HA Section 65(1), not
TROs. London boroughs normally have a similar system within their Traffic Order section.
2.3.15
Cycling is not permitted on public footpaths, unless an order has been made under Section
3 of the Cycle Tracks Act (1984) to convert the footpath to a cycle track.
Shared use path away from the highway, Queen Elizabeth Olympic Park
Footpath part-converted into cycle track, Hackney

London Cycling Design Standards consultation draft – June 2014 54
Chapter 2 – Tools and techniques
2.4 Maintenance
2.4.1
Effective maintenance for cycle routes needs to be to a higher standard than Highway Act
(1980) stipulations suggest. Minor defects can unseat a rider and rough surface quality
can increase the effort required to cycle to the extent that it deters cycle use. Cycle route
maintenance should therefore be prioritised over roads of equal degradation. Access by
maintenance vehicles to all parts of a route needs to be provided for.
2.4.2
Relevant to effective maintenance are ownership issues and the New Roads and Street
Works Act, 1991. NRSWA provides a legislative framework for street works activities by all
undertakers, with the aim of coordinating them efficiently for the benefit of all road users. In
some instances, certain responsibilities under the Highways Act and NRSWA are devolved
to contractors.
Figure 2.20 Maintenance issues for cyclists: surface quality
Surface cracking or excessive rutting
Standing water due to uneven or slack gradients, blocked gullies, rutting of surface or leaking water valves.
Road markings: worn, barely visible, missing (not replaced after repairs), proud (usually resulting from excessive remarking) or low (masked off for repeated surface overlay).
Worn/smooth manhole covers
Unsuitable road gullies: dished, with longitudinal waterway gaps or with frame set below adjacent surface.
Missing surface material or failed reinstatement/use of smooth metal plates to ‘cover’ open trenches

London Cycling Design Standards consultation draft – June 2014 55
Chapter 2 – Tools and techniques
2.4.3
Quietways and Superhighways need to be inspected regularly and resurfaced regularly as
budgets permit. Examples of the main types of defects which effect cycle routes are shown
in figure 2.20. Occurrences of any of these defects should be rectified in order to maintain
the comfort level of service rating.
2.4.4
Surface quality issues
The presence of issues set out in figure 2.20 should be assessed through regular
maintenance inspections. Addressing them should be built into the highway authority’s
operational practices. An appropriate intervention level needs to be set, defining when
action needs to be taken, and recommending repair methods as appropriate.
2.4.5
Standing water is a risk as it results in an unnecessarily slippery surface and cyclists
swerving to avoid spray from passing vehicles. It needs to be treated as a priority all year
round and not just in cold weather. Leaking water valves are the responsibility of the water
authority and NRSWA coordinator.
2.4.6
Covers sitting low or loose in frames can, for cyclists, be a source of discomfort or even a
safety risk where they need to swerve to avoid the cover. Most inspection covers (other
than gullies and other surface water chambers) are the responsibility of service providers:
electricity, water, gas, communications etc. These companies may have their own
intervention levels but these may not adequately meet the needs of cyclists. Highway
authorities may replace covers but may not be able to recover costs. Replacement covers
must be ‘badged’ identifying the owner (as set out by NRASWA, 1991).
2.4.7
Poor maintenance practices can result in the tops of gullies being set unnecessarily low,
which is not only a problem for cyclists but also results in vehicle impact loading and early
failure. To avoid this issue, contract specifications should address materials and
construction details and supervision of work is required.

London Cycling Design Standards consultation draft – June 2014 56
Chapter 2 – Tools and techniques
2.4.8
Refuse and spillages
Some maintenance issues should involve borough street cleansing and refuse collection
teams in a programme of inspection and checking, or in the identification of problem areas
such as spillages from refuse vehicles. Inspections should focus on typical problem
locations, such as the areas around bus stops and petrol stations.
Refuse bags for collection left
on edge of cycle lane
Diesel or oil spillage
Litter in cycle track
2.4.9
Vegetation
Vegetation growing over the edges of cycle lanes and tracks can reduce the effective
width of a facility, or mean that cyclists avoid it altogether. Certain overhanging trees and
hedges that may not affect pedestrians or motor vehicles could be a significant barrier for
cyclists. Inspections need to be proactive and enforcement letters to private owners under
section 154 of Highways Act 1980 issued before the problem becomes unacceptable. The
authority must have in place a procedure for checking out the works in default of a notice
and an inspection regime for their own trees. Issues around grass encroaching on cycle
tracks should be addressed to the borough street cleansing manager.
2.4.10
Lighting
Inadequate lighting of cycling facilities ideally needs to be addressed through proper
design and/or improvement schemes. Frequent inspections can help identify issues, which
should be raised with the borough Highway Engineering Manager.
2.4.11
Winter maintenance
Cycle lanes and tracks can become unusable without adequate salting or gritting.
However, excessive grit accumulating by the road, in cycling facilities, is also a problem.
Issues identified in regular inspections should be raised with the borough Winter
Maintenance Manager

London Cycling Design Standards consultation draft – June 2014 57
Chapter 2 – Tools and techniques
2.4.12
Street furniture and signage
Maintenance inspections should highlight where any street furniture close to the kerb
represents an obstruction for cyclists. This includes permanent, temporary or fly-posted
signs attached to poles and lighting columns. Any missing or damaged signs should also
be noted during inspections and reported to the borough Highway Engineering Manager.
Damaged sign
obstructing cycle track
Obstruction by street
furniture
Building materials left
on cycle track
Contractors obstructing
cycle route
2.4.13
Obstructions to cycle infrastructure
Skips, hoardings, scaffold and building materials left on cycle lanes and tracks should be
identified in inspections and reported to the borough licensing team for highway works.
Effective planning, programming and supervision of works is required to avoid contractors
and statutory and private utility companies obstructing cycle infrastructure with
compounds, machinery, plant and equipment. Obstructions caused by advertising material
or other unofficial street furniture, or by persistent parking, should be dealt with through
enforcement and reported to the borough NRSWA team.