Embed Size (px)
Citation preview
TOPFINDINGSWorking Conditions in Professional Football
2016 FIFPro GLOBAL EMPLOYMENT REPORT
BEYOND THE FLOODLIGHTSThe global football employment market is a tale of three worlds
2016 Football Employment Report
TOP FINDING
Published for the fi rst time, the 2016 FIFPro Global Employment Report is the most comprehensive and far-reaching survey of its kind, analysing the labour conditions of professional players in the world’s most popular team sport.
Football is deeply rooted in our societies and generates passion, commitment and a strong sense of
community. As a consequence, it has developed into a global economy and the employment of professional players is at the heart of the game.
The global employment market for professional footballers is as fragmented as the competitiveness and wealth in football overall. The borders of this segmented world map can neither be grouped by geography nor by league – and striking differences sometimes exist even within a single club.
2
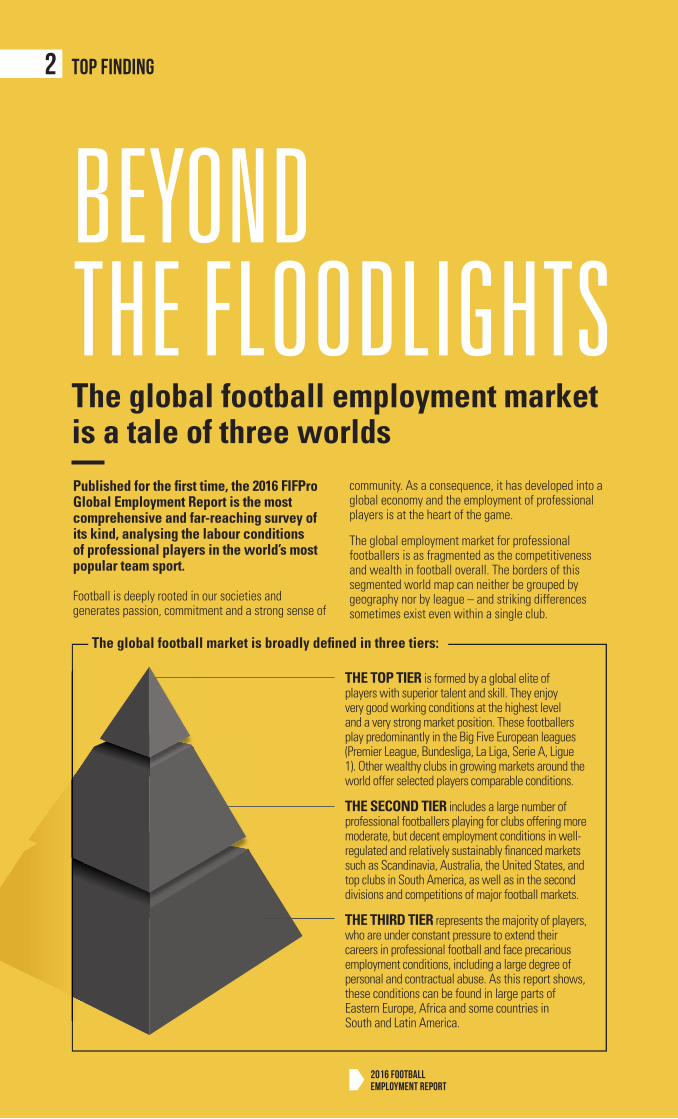
The global football market is broadly defi ned in three tiers:
THE TOP TIER is formed by a global elite of players with superior talent and skill. They enjoy very good working conditions at the highest level and a very strong market position. These footballers play predominantly in the Big Five European leagues (Premier League, Bundesliga, La Liga, Serie A, Ligue 1). Other wealthy clubs in growing markets around the world offer selected players comparable conditions.
THE SECOND TIER includes a large number of professional footballers playing for clubs offering more moderate, but decent employment conditions in well-regulated and relatively sustainably fi nanced markets such as Scandinavia, Australia, the United States, and top clubs in South America, as well as in the second divisions and competitions of major football markets.
THE THIRD TIER represents the majority of players, who are under constant pressure to extend their careers in professional football and face precarious employment conditions, including a large degree of personal and contractual abuse. As this report shows, these conditions can be found in large parts of Eastern Europe, Africa and some countries in South and Latin America.
Working conditions In professional football
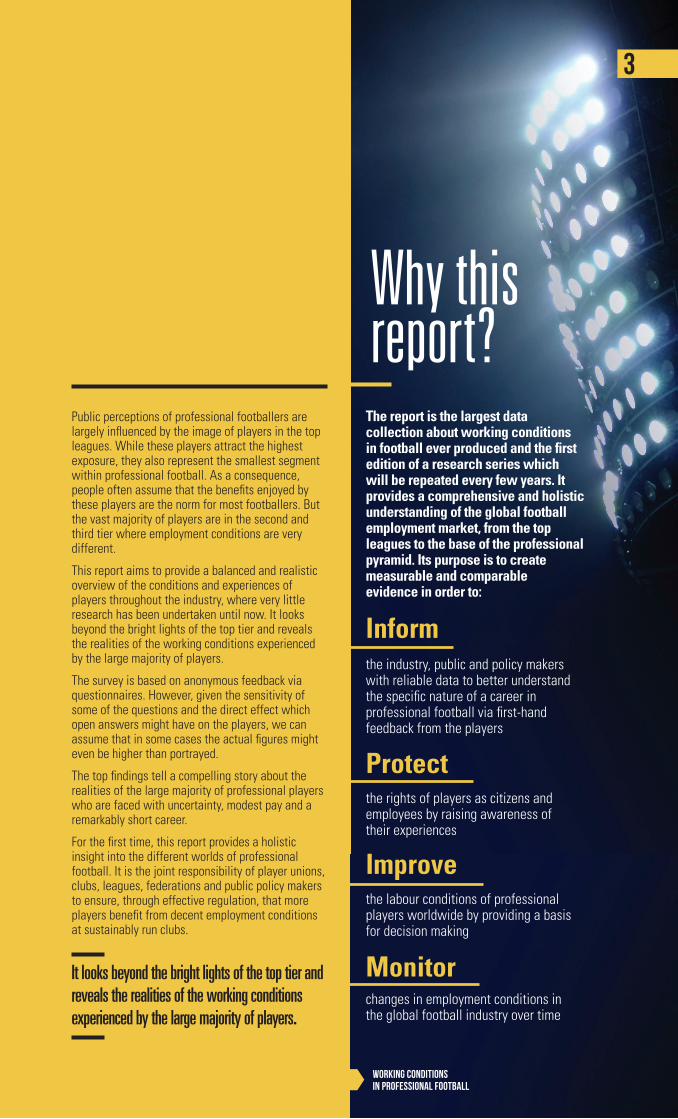
The report is the largest data collection about working conditions in football ever produced and the first edition of a research series which will be repeated every few years. It provides a comprehensive and holistic understanding of the global football employment market, from the top leagues to the base of the professional pyramid. Its purpose is to create measurable and comparable evidence in order to:
Why this report?
3
Inform
Protect
Improve
Monitor
the industry, public and policy makers with reliable data to better understand the specific nature of a career in professional football via first-hand feedback from the players
the rights of players as citizens and employees by raising awareness of their experiences
the labour conditions of professional players worldwide by providing a basis for decision making
changes in employment conditions in the global football industry over time
Public perceptions of professional footballers are largely influenced by the image of players in the top leagues. While these players attract the highest exposure, they also represent the smallest segment within professional football. As a consequence, people often assume that the benefits enjoyed by these players are the norm for most footballers. But the vast majority of players are in the second and third tier where employment conditions are very different.
This report aims to provide a balanced and realistic overview of the conditions and experiences of players throughout the industry, where very little research has been undertaken until now. It looks beyond the bright lights of the top tier and reveals the realities of the working conditions experienced by the large majority of players.
The survey is based on anonymous feedback via questionnaires. However, given the sensitivity of some of the questions and the direct effect which open answers might have on the players, we can assume that in some cases the actual figures might even be higher than portrayed.
The top findings tell a compelling story about the realities of the large majority of professional players who are faced with uncertainty, modest pay and a remarkably short career.
For the first time, this report provides a holistic insight into the different worlds of professional football. It is the joint responsibility of player unions, clubs, leagues, federations and public policy makers to ensure, through effective regulation, that more players benefit from decent employment conditions at sustainably run clubs.
It looks beyond the bright lights of the top tier and reveals the realities of the working conditions experienced by the large majority of players.
2016 Football Employment Report
1
2
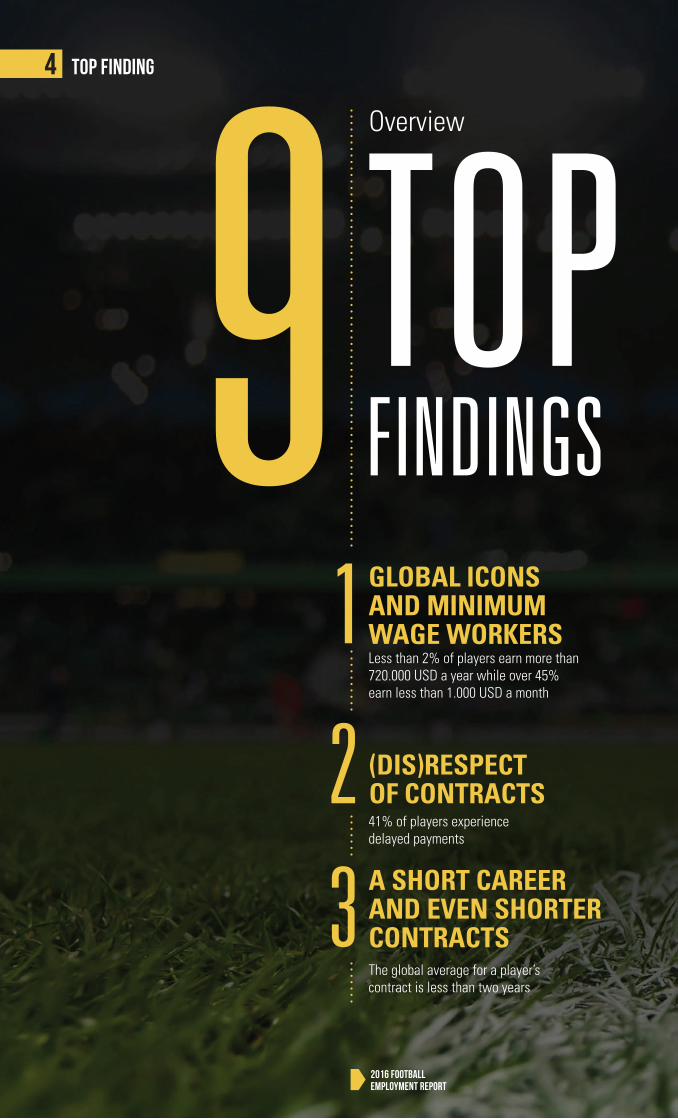
9 FINDINGSTOP
GLOBAL ICONS AND MINIMUM WAGE WORKERS
A SHORT CAREER AND EVEN SHORTER CONTRACTS
(DIS)RESPECT OF CONTRACTS
Less than 2% of players earn more than 720.000 USD a year while over 45% earn less than 1.000 USD a month
41% of players experience delayed payments
The global average for a player’s contract is less than two years
Overview
3
TOP FINDING4
4
5
6FINDINGSTOP
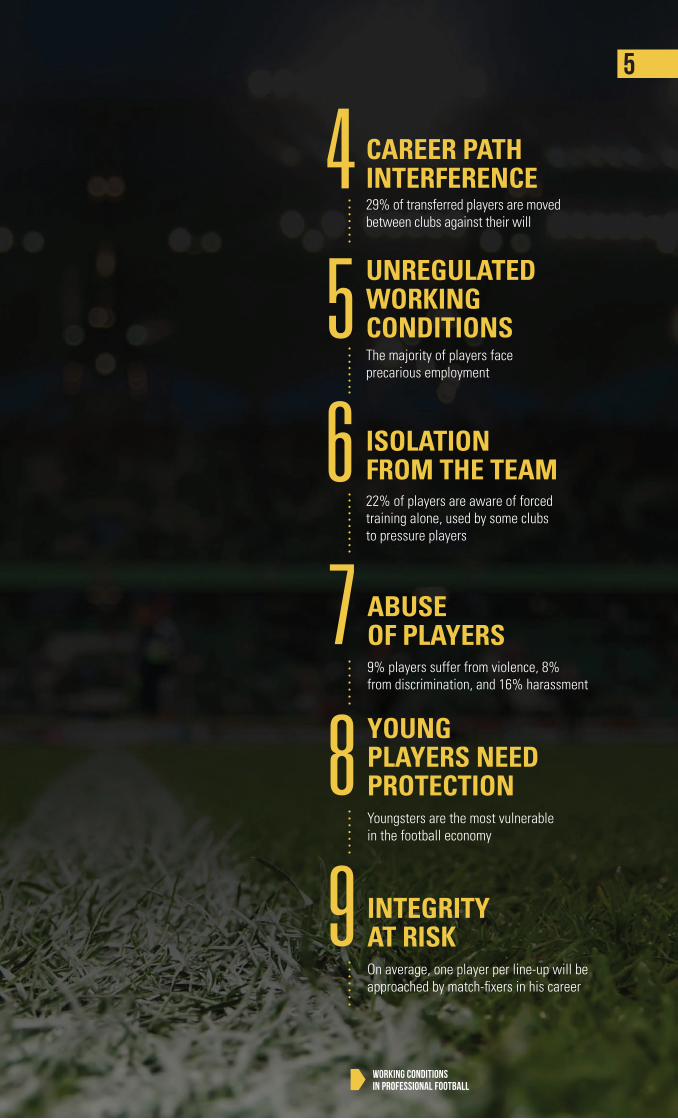
CAREER PATH INTERFERENCE
UNREGULATED WORKING CONDITIONS
ISOLATION FROM THE TEAM
ABUSE OF PLAYERS
YOUNG PLAYERS NEED PROTECTION
INTEGRITY AT RISK
22% of players are aware of forced training alone, used by some clubs to pressure players
29% of transferred players are moved between clubs against their will
The majority of players face precarious employment
Youngsters are the most vulnerable in the football economy
On average, one player per line-up will be approached by match-fixers in his career
7
8
9
5
9% players suffer from violence, 8% from discrimination, and 16% harassment
Working conditions In professional football
2016 Football Employment Report
6 TOP FINDINGS
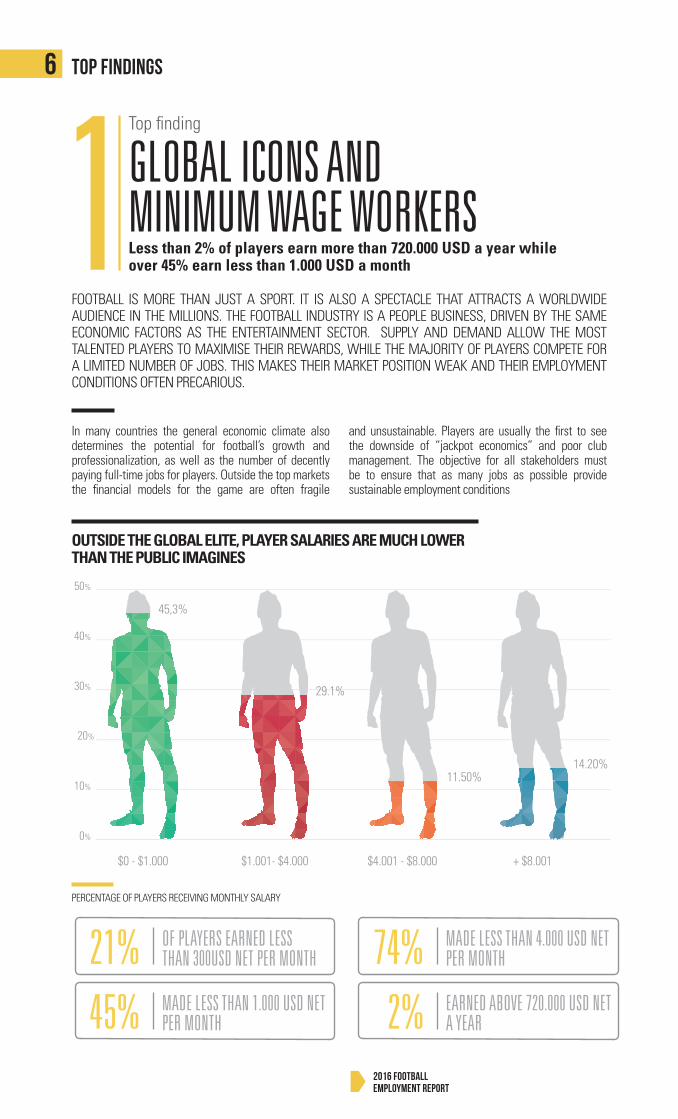
OF PLAYERS EARNED LESS THAN 300USD NET PER MONTH21% MADE LESS THAN 1.000 USD NET PER MONTH 45%
MADE LESS THAN 4.000 USD NET PER MONTH
EARNED ABOVE 720.000 USD NET A YEAR
74%
2%
FIGURE 4.1 PERCENTAGE OF PLAYERS RECEIVING MONTHLY SALARY
FIGURE 4.1 PERCENTAGE OF PLAYERS RECEIVING MONTHLY SALARY
OR
45,3%
11.50%14.20%
$0 - $1.000 $1.001- $4.000 $4.001 - $8.000 + $8.001
0%
10%
20%
30%
40%
50%
29.1%
45,3%
$0 - $1.000 $1.001- $4.000 $4.001 - $15.000 + $15.001
0%
10%
20%
30%
40%
50%
29,1%
18,90%
6,90%
FOOTBALL IS MORE THAN JUST A SPORT. IT IS ALSO A SPECTACLE THAT ATTRACTS A WORLDWIDE AUDIENCE IN THE MILLIONS. THE FOOTBALL INDUSTRY IS A PEOPLE BUSINESS, DRIVEN BY THE SAME ECONOMIC FACTORS AS THE ENTERTAINMENT SECTOR. SUPPLY AND DEMAND ALLOW THE MOST TALENTED PLAYERS TO MAXIMISE THEIR REWARDS, WHILE THE MAJORITY OF PLAYERS COMPETE FOR A LIMITED NUMBER OF JOBS. THIS MAKES THEIR MARKET POSITION WEAK AND THEIR EMPLOYMENT CONDITIONS OFTEN PRECARIOUS.
OUTSIDE THE GLOBAL ELITE, PLAYER SALARIES ARE MUCH LOWER THAN THE PUBLIC IMAGINES
PERCENTAGE OF PLAYERS RECEIVING MONTHLY SALARY
In many countries the general economic climate also determines the potential for football’s growth and professionalization, as well as the number of decently paying full-time jobs for players. Outside the top markets the fi nancial models for the game are often fragile
and unsustainable. Players are usually the fi rst to see the downside of “jackpot economics” and poor club management. The objective for all stakeholders must be to ensure that as many jobs as possible provide sustainable employment conditions
GLOBAL ICONS AND MINIMUM WAGE WORKERSLess than 2% of players earn more than 720.000 USD a year while over 45% earn less than 1.000 USD a month
Top fi nding
1
Working conditions In professional football
7
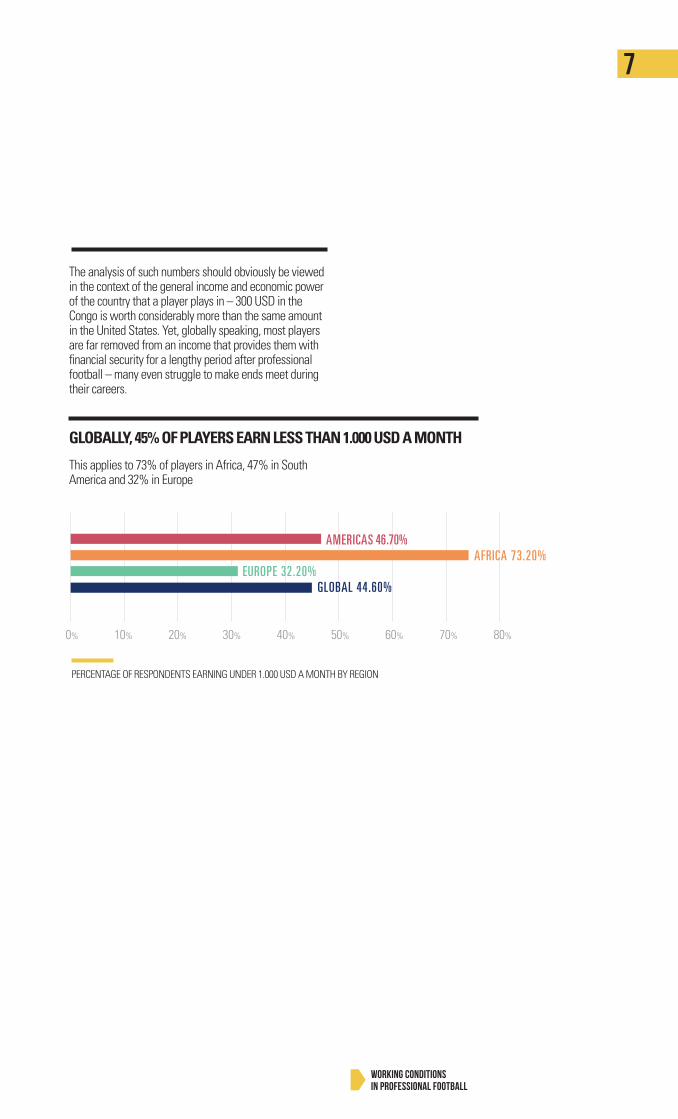
The analysis of such numbers should obviously be viewed in the context of the general income and economic power of the country that a player plays in – 300 USD in the Congo is worth considerably more than the same amount in the United States. Yet, globally speaking, most players are far removed from an income that provides them with financial security for a lengthy period after professional football – many even struggle to make ends meet during their careers.
This applies to 73% of players in Africa, 47% in South America and 32% in Europe
PERCENTAGE OF RESPONDENTS EARNING UNDER 1.000 USD A MONTH BY REGION
GLOBALLY, 45% OF PLAYERS EARN LESS THAN 1.000 USD A MONTH
2016 Football Employment Report
8 TOP FINDINGS
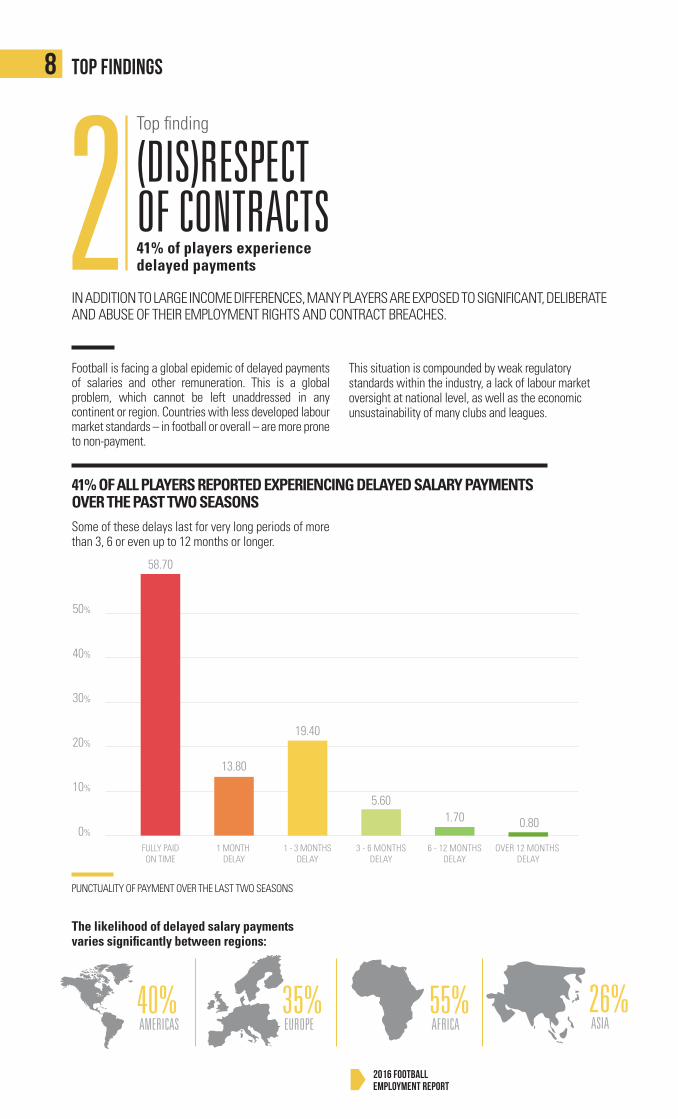
IN ADDITION TO LARGE INCOME DIFFERENCES, MANY PLAYERS ARE EXPOSED TO SIGNIFICANT, DELIBERATE AND ABUSE OF THEIR EMPLOYMENT RIGHTS AND CONTRACT BREACHES.
Football is facing a global epidemic of delayed payments of salaries and other remuneration. This is a global problem, which cannot be left unaddressed in any continent or region. Countries with less developed labour market standards – in football or overall – are more prone to non-payment.
This situation is compounded by weak regulatory standards within the industry, a lack of labour market oversight at national level, as well as the economic unsustainability of many clubs and leagues.
Some of these delays last for very long periods of more than 3, 6 or even up to 12 months or longer.
The likelihood of delayed salary payments varies significantly between regions:
41% OF ALL PLAYERS REPORTED EXPERIENCING DELAYED SALARY PAYMENTS OVER THE PAST TWO SEASONS
PUNCTUALITY OF PAYMENT OVER THE LAST TWO SEASONS
AMERICAS EUROPE AFRICA40% 35%
ASIA26% 55%
FIGURE 3.6 AVAILABILITY OF A WRITTEN CONTRACT AND CITIZENSHIP
FIGURE 3.5 AVAILABILITY OF A WRITTEN CONTRACT AND AGE GROUP
LACK OF WRITTEN CONTRACT WRITTEN CONTRACT
Under 18
18 - 23
24 - 28
29 - 33
Above 33
70% 0% 10% 20% 30%80% 90% 100%
AMERICAS CITIZEN
AMERICAS NON-CITIZEN
EUROPE CITIZEN
EUROPE NON-CITIZEN
AFRICA CITIZEN
AFRICA NO-CITIZEN
NO WRITTEN CONTRACT
0% 10% 20%
2 (DIS)RESPECT OF CONTRACTS41% of players experience delayed payments
Top finding
Working conditions In professional football
9
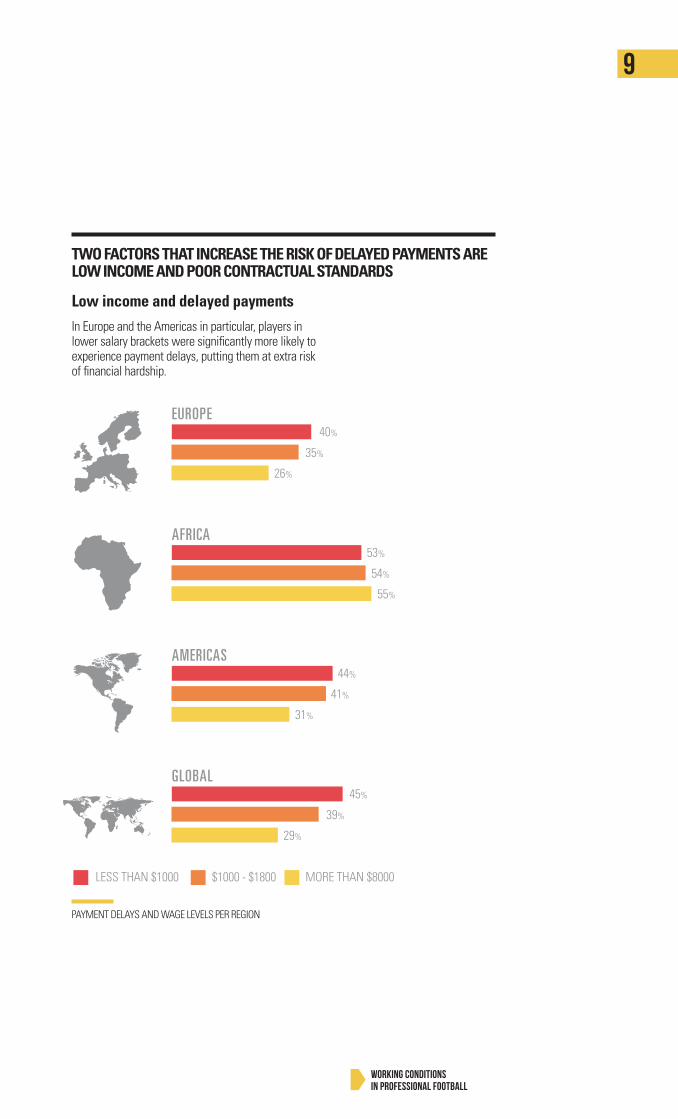
Low income and delayed payments
In Europe and the Americas in particular, players in lower salary brackets were significantly more likely to experience payment delays, putting them at extra risk of financial hardship.
TWO FACTORS THAT INCREASE THE RISK OF DELAYED PAYMENTS ARE LOW INCOME AND POOR CONTRACTUAL STANDARDS
PAYMENT DELAYS AND WAGE LEVELS PER REGION
ASIA
FIGURE 5.11 PAYMENT DELAYS AND WAGE LEVELS PER REGION
LESS THAN $1000 $1000 - $1800 MORE THAN $8000
EUROPE40%
35%
26%
AFRICA53%
54%
55%
AMERICAS44%
41%
31%
GLOBAL45%
39%
29%
FIGURE 5.12 PLACE OF PAYMENT DELAYS
CURRENT CLUBDIFFERENT CLUB SAME COUNTRY
DIFFERENT CLUB DIFFERENT COUNTRY
62,7
29,5
7,5
FIGURE 5.11 PAYMENT DELAYS AND WAGE LEVELS PER REGION
LESS THAN $1000 $1000 - $1800 MORE THAN $8000
EUROPE40%
35%
26%
AFRICA53%
54%
55%
AMERICAS44%
41%
31%
GLOBAL45%
39%
29%
FIGURE 5.12 PLACE OF PAYMENT DELAYS
CURRENT CLUBDIFFERENT CLUB SAME COUNTRY
DIFFERENT CLUB DIFFERENT COUNTRY
62,7
29,5
7,5
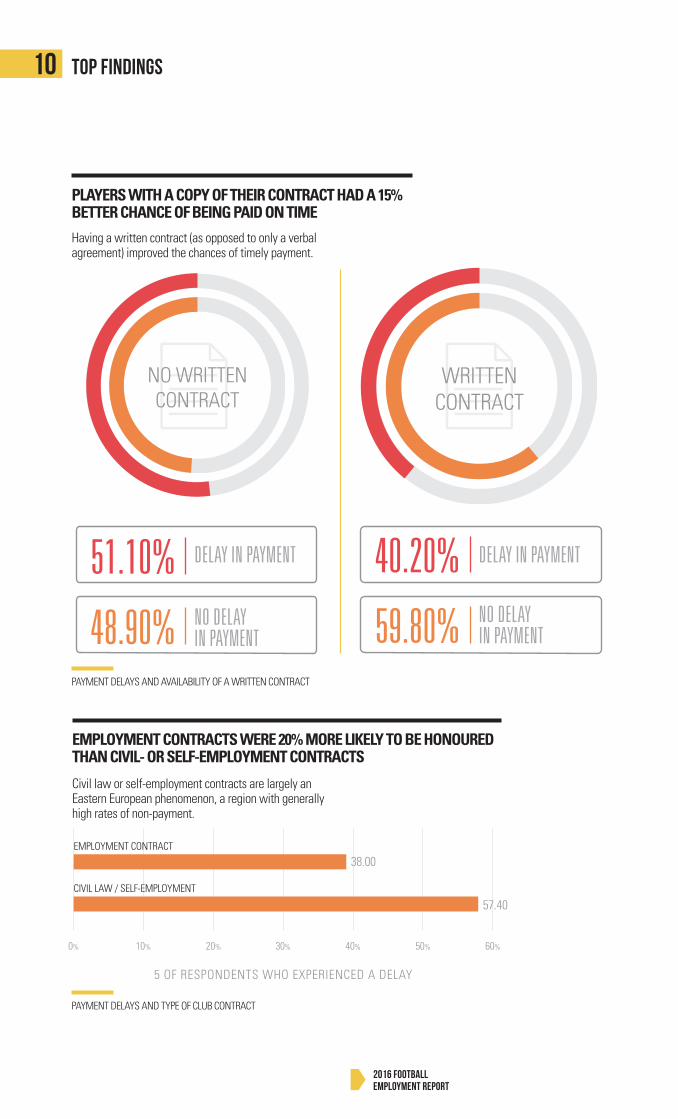
FIGURE 5.4 PAYMENT DELAYS AND AVAILABILITY OF A WRITTEN CONTRACT
WRITTENCONTRACT
59,80% NO DELAYIN PAYMENT
40,20% DELAYIN PAYMENT
NO WRITTENCONTRACT
48,90% NO DELAYIN PAYMENT
51,10% DELAYIN PAYMENT
2016 Football Employment Report
10 TOP FINDINGS
Having a written contract (as opposed to only a verbal agreement) improved the chances of timely payment.
Civil law or self-employment contracts are largely an Eastern European phenomenon, a region with generally high rates of non-payment.
PLAYERS WITH A COPY OF THEIR CONTRACT HAD A 15% BETTER CHANCE OF BEING PAID ON TIME
EMPLOYMENT CONTRACTS WERE 20% MORE LIKELY TO BE HONOURED THAN CIVIL- OR SELF-EMPLOYMENT CONTRACTS
PAYMENT DELAYS AND AVAILABILITY OF A WRITTEN CONTRACT
PAYMENT DELAYS AND TYPE OF CLUB CONTRACT
FIGURE 5.4 PAYMENT DELAYS AND AVAILABILITY OF A WRITTEN CONTRACT
WRITTENCONTRACT
59,80% NO DELAYIN PAYMENT
40,20% DELAYIN PAYMENT
NO WRITTENCONTRACT
48,90% NO DELAYIN PAYMENT
51,10% DELAYIN PAYMENT
DELAY IN PAYMENT DELAY IN PAYMENT
NO DELAY IN PAYMENT
NO DELAY IN PAYMENT
51.10% 40.20%
48.90% 59.80%

Working conditions In professional football
11
It’s one of the best jobs in the world, but people should also know that it’s difficult to reach a high level and only very few make it to the top.
Defender, Italy
“
CONTRACT LENGTH AND MONTHLY SALARY 2016 Football Employment Report
12 TOP FINDINGS
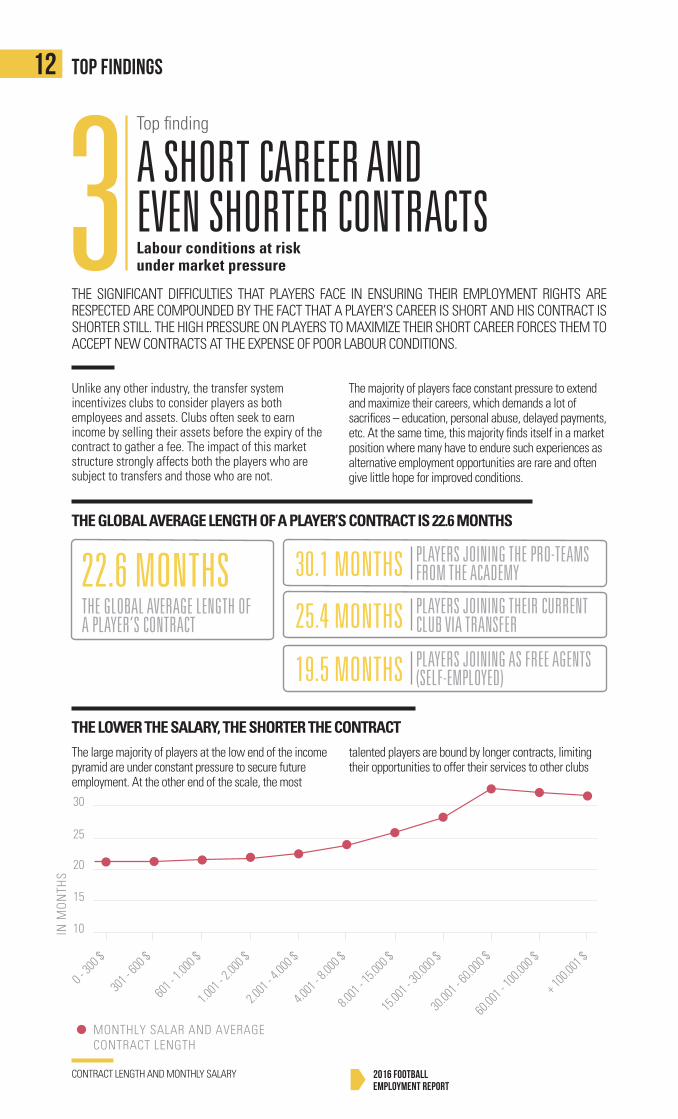
THE SIGNIFICANT DIFFICULTIES THAT PLAYERS FACE IN ENSURING THEIR EMPLOYMENT RIGHTS ARE RESPECTED ARE COMPOUNDED BY THE FACT THAT A PLAYER’S CAREER IS SHORT AND HIS CONTRACT IS SHORTER STILL. THE HIGH PRESSURE ON PLAYERS TO MAXIMIZE THEIR SHORT CAREER FORCES THEM TO ACCEPT NEW CONTRACTS AT THE EXPENSE OF POOR LABOUR CONDITIONS.
Unlike any other industry, the transfer system incentivizes clubs to consider players as both employees and assets. Clubs often seek to earn income by selling their assets before the expiry of the contract to gather a fee. The impact of this market structure strongly affects both the players who are subject to transfers and those who are not.
The majority of players face constant pressure to extend and maximize their careers, which demands a lot of sacrifices – education, personal abuse, delayed payments, etc. At the same time, this majority finds itself in a market position where many have to endure such experiences as alternative employment opportunities are rare and often give little hope for improved conditions.
The large majority of players at the low end of the income pyramid are under constant pressure to secure future employment. At the other end of the scale, the most
talented players are bound by longer contracts, limiting their opportunities to offer their services to other clubs
THE GLOBAL AVERAGE LENGTH OF A PLAYER’S CONTRACT IS 22.6 MONTHS
THE LOWER THE SALARY, THE SHORTER THE CONTRACT
MONTHLY SALAR AND AVERAGE CONTRACT LENGTH
10
15
20
25
30
35
IN M
ON
THS
FIGURE 4.6: CONTRACT LENGTH AND MONTHLY SALARY
10 MONTHS+ BETWEEN $30.000 TO $60.000IS THE MAJOR AUGMENTATIONOF CONTRACT LENGHT
37 MONTHS IS THE LONGEST CONTRACT
0 - 30
0 $
301 -
600 $
601 -
1.00
0 $
1.001
- 2.00
0 $
2.001
- 4.00
0 $
4.001
- 8.00
0 $
8.001
- 15.0
00 $
15.00
1 - 30
.000 $
30.00
1 - 60
.000 $
60.00
1 - 10
0.000
$
+ 100
.001 $
PLAYERS JOINING THE PRO-TEAMS FROM THE ACADEMY
THE GLOBAL AVERAGE LENGTH OF A PLAYER’S CONTRACT
PLAYERS JOINING THEIR CURRENT CLUB VIA TRANSFER
PLAYERS JOINING AS FREE AGENTS (SELF-EMPLOYED)
30.1 MONTHS 22.6 MONTHS 25.4 MONTHS
19.5 MONTHS
3 A SHORT CAREER AND EVEN SHORTER CONTRACTS Labour conditions at risk under market pressure
Top finding
MONTHLY SALAR AND AVERAGE CONTRACT LENGTH
MONTHLY SALARYAND CONTRACT LENGTH(6-YEARS+ CONTRACTS EXCLUDED)
10
15
20
25
30
35
IN M
ON
THS
FIGURE 4.6: CONTRACT LENGTH AND MONTHLY SALARY
10 MONTHS+ BETWEEN $30.000 TO $60.000IS THE MAJOR AUGMENTATIONOF CONTRACT LENGHT
37 MONTHS IS THE LONGEST CONTRACT
0 - 30
0 $
301 -
600 $
601 -
1.00
0 $
1.001
- 2.00
0 $
2.001
- 4.00
0 $
4.001
- 8.00
0 $
8.001
- 15.0
00 $
15.00
1 - 30
.000 $
30.00
1 - 60
.000 $
60.00
1 - 10
0.000
$
+ 100
.001 $
Working conditions In professional football
13
PERCENTAGE OF PLAYERS RECEIVING MONTHLY WAGE AND HOW THEY ENTERED INTO THEIR CONTRACT
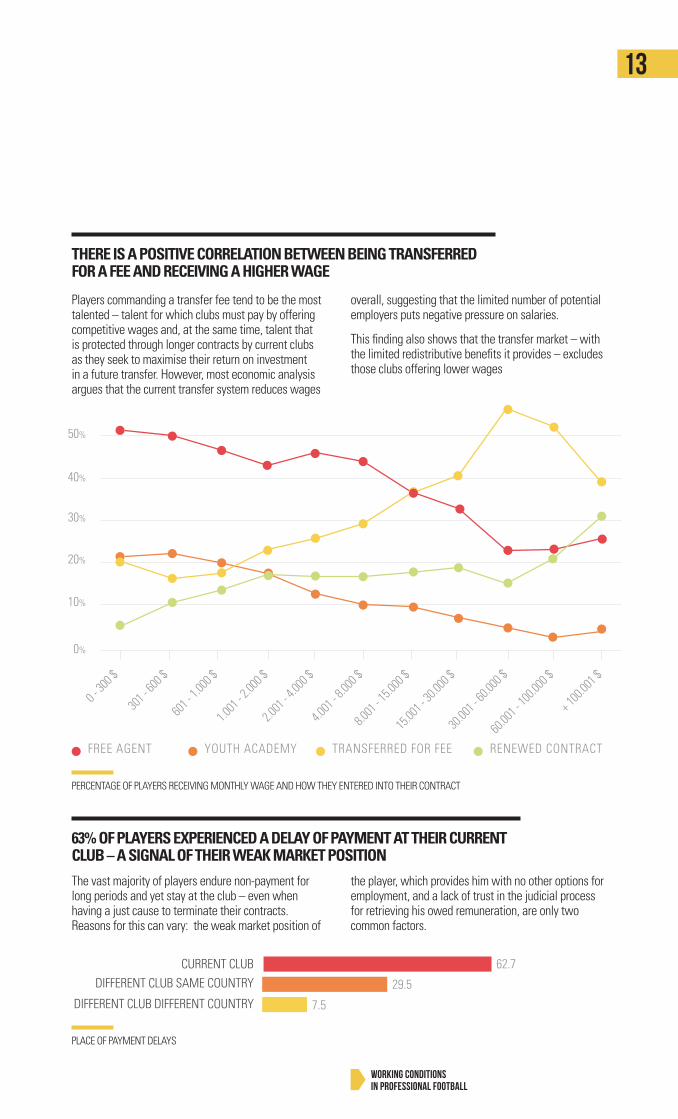
Players commanding a transfer fee tend to be the most talented – talent for which clubs must pay by offering competitive wages and, at the same time, talent that is protected through longer contracts by current clubs as they seek to maximise their return on investment in a future transfer. However, most economic analysis argues that the current transfer system reduces wages
overall, suggesting that the limited number of potential employers puts negative pressure on salaries.
This finding also shows that the transfer market – with the limited redistributive benefits it provides – excludes those clubs offering lower wages
THERE IS A POSITIVE CORRELATION BETWEEN BEING TRANSFERRED FOR A FEE AND RECEIVING A HIGHER WAGE
FREE OF AGENT PLAYERS HAVE LOWER WAGESTHAN TRANSFERED FEE PLAYERS THAT HAVE HIGHER WAGES
FIGURE 4.11 PERCENTAGE OF PLAYERS RECEIVING MONTHLY WAGEAND HOW THEY ENTERED INTO THEIR CONTRACT
0%
10%
20%
30%
40%
50%
60%
0 - 30
0 $
301 -
600 $
601 -
1.00
0 $
1.001
- 2.00
0 $
2.001
- 4.00
0 $
4.001
- 8.00
0 $
8.001
- 15.0
00 $
15.00
1 - 30
.000 $
30.00
1 - 60
.000 $
60.00
1 - 10
0.000
$
+ 100
.001 $
FREE AGENT YOUTH ACADEMY TRANSFERRED FOR FEE RENEWED CONTRACT
The vast majority of players endure non-payment for long periods and yet stay at the club – even when having a just cause to terminate their contracts. Reasons for this can vary: the weak market position of
the player, which provides him with no other options for employment, and a lack of trust in the judicial process for retrieving his owed remuneration, are only two common factors.
63% OF PLAYERS EXPERIENCED A DELAY OF PAYMENT AT THEIR CURRENT CLUB – A SIGNAL OF THEIR WEAK MARKET POSITION
FIGURE 5.11 PAYMENT DELAYS AND WAGE LEVELS PER REGION
LESS THAN $1000 $1000 - $1800 MORE THAN $8000
EUROPE39.70%
35.50%
25.90%
AFRICA53.10%
54.10%
55.40%
AMERICAS43.90%
41%
31.30%
GLOBAL45.50%
39.20%
29.50%
FIGURE 5.12 PLACE OF PAYMENT DELAYS
CURRENT CLUBDIFFERENT CLUB SAME COUNTRY
DIFFERENT CLUB DIFFERENT COUNTRY
62.7
29.5
7.5
PLACE OF PAYMENT DELAYS
14 TOP FINDINGS
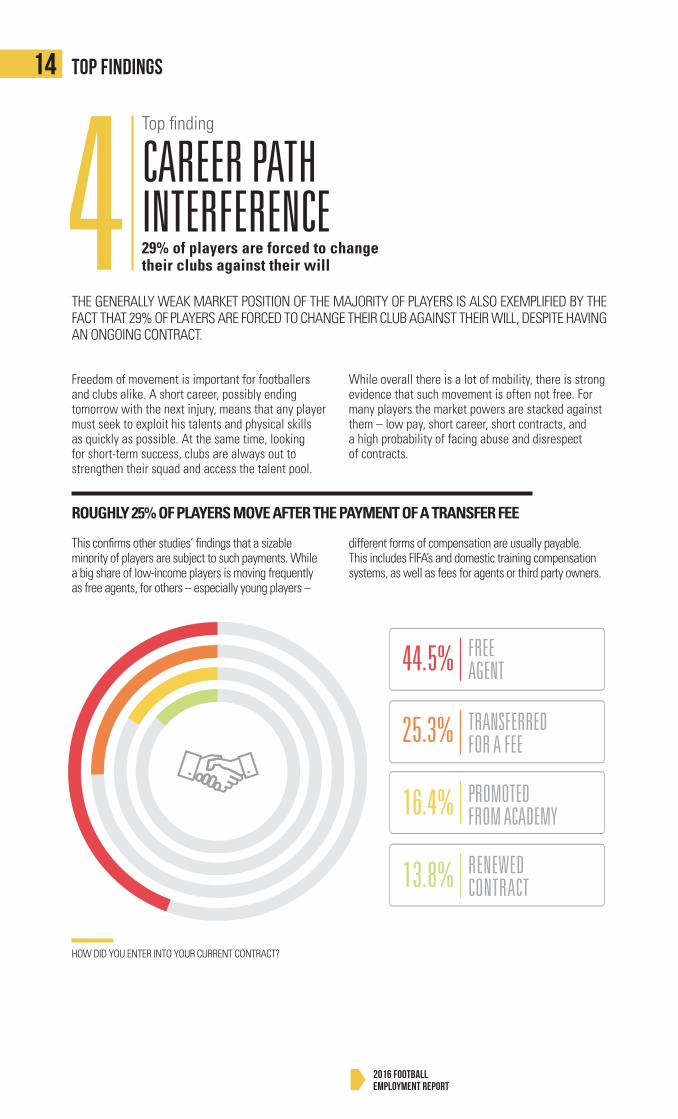
THE GENERALLY WEAK MARKET POSITION OF THE MAJORITY OF PLAYERS IS ALSO EXEMPLIFIED BY THE FACT THAT 29% OF PLAYERS ARE FORCED TO CHANGE THEIR CLUB AGAINST THEIR WILL, DESPITE HAVING AN ONGOING CONTRACT.
Freedom of movement is important for footballers and clubs alike. A short career, possibly ending tomorrow with the next injury, means that any player must seek to exploit his talents and physical skills as quickly as possible. At the same time, looking for short-term success, clubs are always out to strengthen their squad and access the talent pool.
While overall there is a lot of mobility, there is strong evidence that such movement is often not free. For many players the market powers are stacked against them – low pay, short career, short contracts, and a high probability of facing abuse and disrespect of contracts.
ROUGHLY 25% OF PLAYERS MOVE AFTER THE PAYMENT OF A TRANSFER FEE
This confi rms other studies’ fi ndings that a sizable minority of players are subject to such payments. While a big share of low-income players is moving frequently as free agents, for others – especially young players –
different forms of compensation are usually payable. This includes FIFA’s and domestic training compensation systems, as well as fees for agents or third party owners.
HOW DID YOU ENTER INTO YOUR CURRENT CONTRACT?
FIGURE 4.9: HOW DID YOU ENTER YOUR CURRENT CONTRACT (BY REGION AS A %)?
AMERICAS
EUROPE
AFRICA
FREE AGENT YOUTH ACADEMY TRANSFER FEE RENEWED
0% 10% 20% 30% 40% 50% 60% 70% 80% 90% 100%
FIGURE 4.8: HOW DID YOU ENTERINTO YOUR CURRENT CONTRACT?
16% PROMOTED FROM ACADEMY
25% TRANSFERREDFOR A FEE
14% RENEWEDCONTRACT
45% FREEAGENT
FREEAGENT
RENEWED CONTRACT
TRANSFERREDFOR A FEE
PROMOTEDFROM ACADEMY
2016 Football Employment Report
CAREER PATH INTERFERENCE 29% of players are forced to change their clubs against their will
Top fi nding
4
15
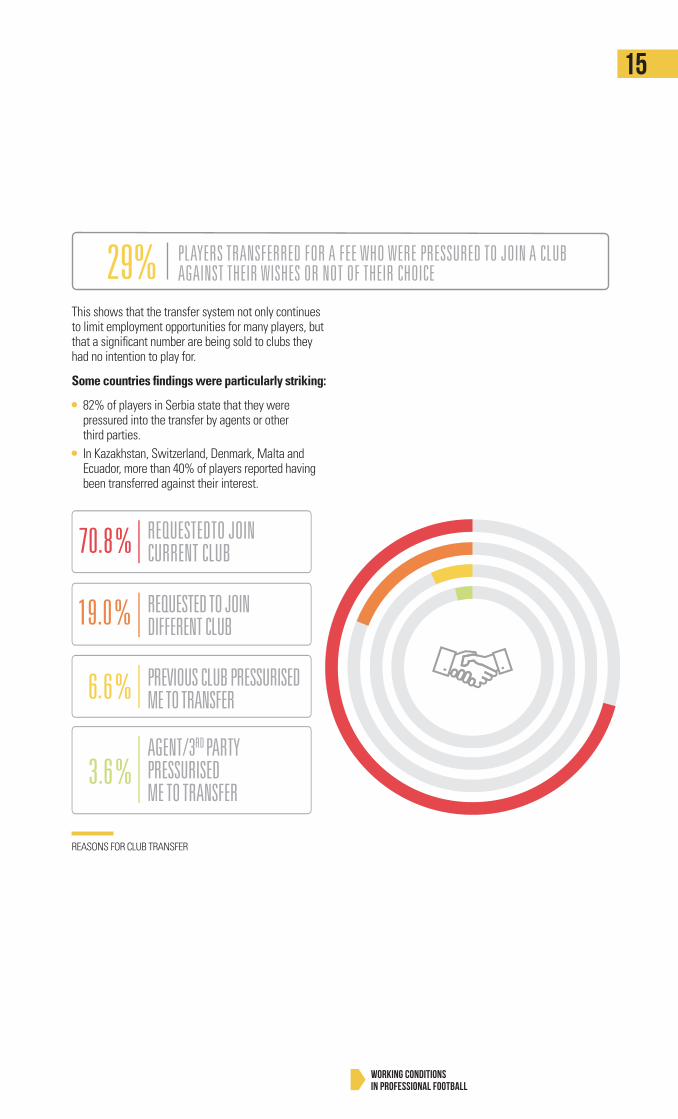
REASONS FOR CLUB TRANSFER
Working conditions In professional football
This shows that the transfer system not only continues to limit employment opportunities for many players, but that a signifi cant number are being sold to clubs they had no intention to play for.
Some countries fi ndings were particularly striking:
82% of players in Serbia state that they were pressured into the transfer by agents or other third parties.
In Kazakhstan, Switzerland, Denmark, Malta and Ecuador, more than 40% of players reported having been transferred against their interest.
REQUESTEDTO JOIN CURRENT CLUB
AGENT/3RD PARTY PRESSURISED ME TO TRANSFER
REQUESTED TO JOIN DIFFERENT CLUB
PREVIOUS CLUB PRESSURISED ME TO TRANSFER
FIGURE 4.12: REASONS FOR CLUB TRANSFER
6%PREVIOUS CLUBPRESSURISED METO TRANSFER
18%REQUESTEDTO JOIN DIFFERENTCLUB
4%AGENT/3RD PARTYPRESSURISED METO TRANSFER
72%REQUESTEDTO JOIN CURRENTCLUB
29%PLAYERS TRANSFERRED FORA FEE WHO WERE PRESSUREDTO JOIN A CLUB AGAINST THEIRWISHES OR NOT OF THEIR CHOICE
PLAYERS TRANSFERRED FOR A FEE WHO WERE PRESSURED TO JOIN A CLUB AGAINST THEIR WISHES OR NOT OF THEIR CHOICE29%
16 TOP FINDINGS
2016 Football Employment Report
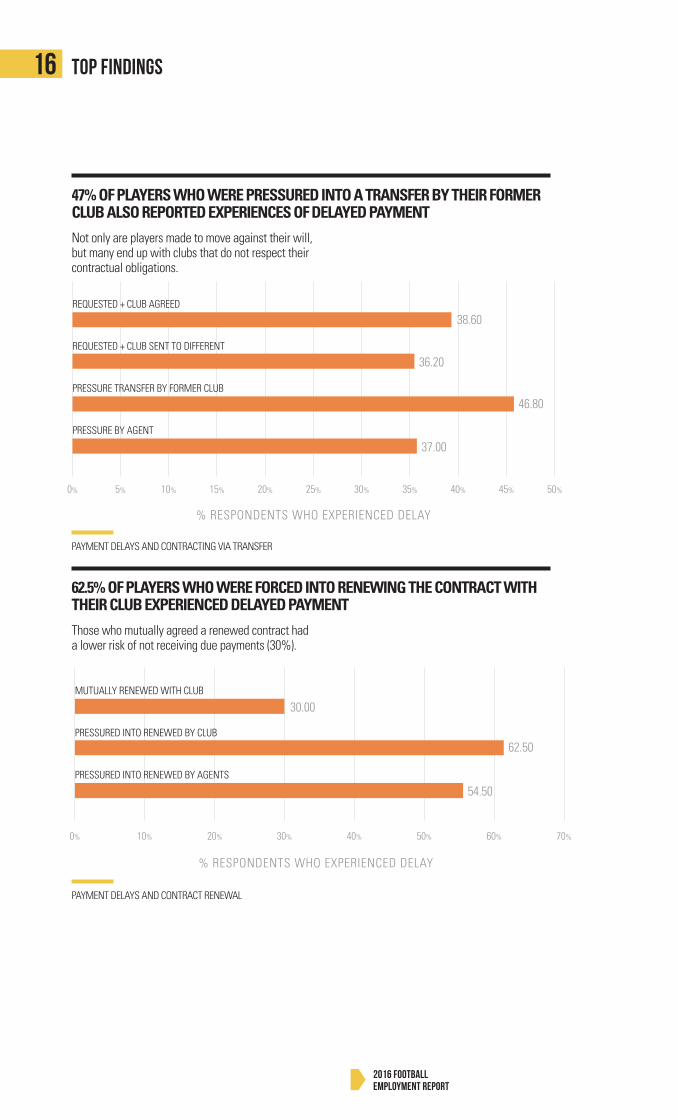
Not only are players made to move against their will, but many end up with clubs that do not respect their contractual obligations.
Those who mutually agreed a renewed contract had a lower risk of not receiving due payments (30%).
47% OF PLAYERS WHO WERE PRESSURED INTO A TRANSFER BY THEIR FORMER CLUB ALSO REPORTED EXPERIENCES OF DELAYED PAYMENT
62.5% OF PLAYERS WHO WERE FORCED INTO RENEWING THE CONTRACT WITH THEIR CLUB EXPERIENCED DELAYED PAYMENT
PAYMENT DELAYS AND CONTRACTING VIA TRANSFER
PAYMENT DELAYS AND CONTRACT RENEWAL
Working conditions In professional football
17
There are a lot of lies in football. A lot of promises about contracts and salaries don’t come true.
Defender, Ireland
“
18 TOP FINDINGS
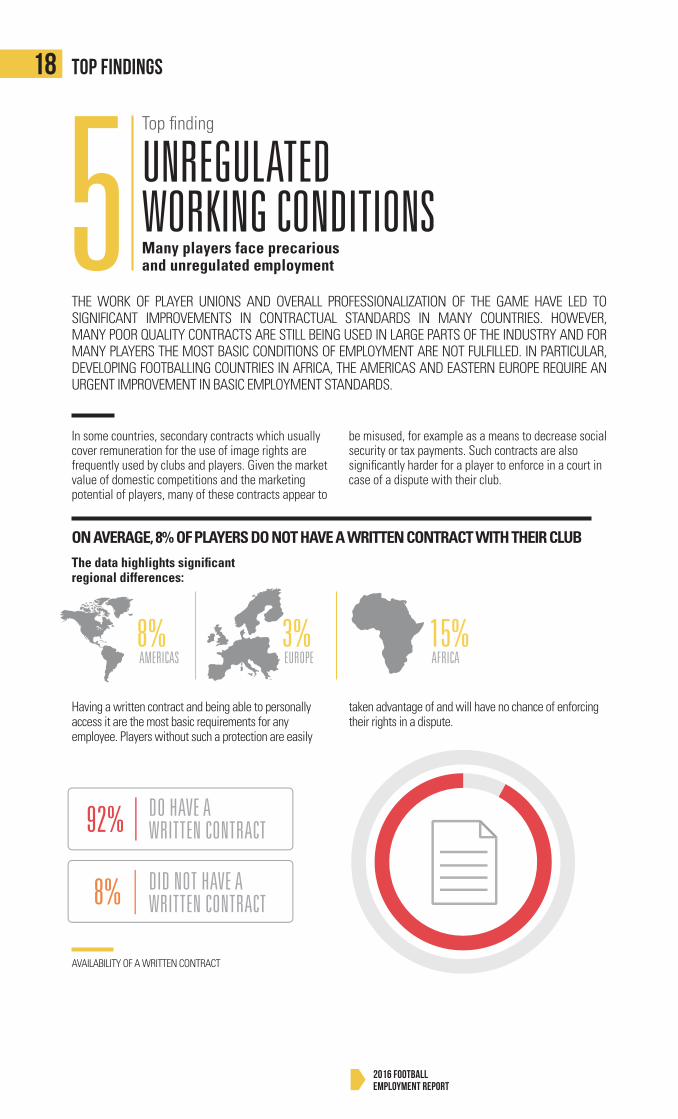
THE WORK OF PLAYER UNIONS AND OVERALL PROFESSIONALIZATION OF THE GAME HAVE LED TO SIGNIFICANT IMPROVEMENTS IN CONTRACTUAL STANDARDS IN MANY COUNTRIES. HOWEVER, MANY POOR QUALITY CONTRACTS ARE STILL BEING USED IN LARGE PARTS OF THE INDUSTRY AND FOR MANY PLAYERS THE MOST BASIC CONDITIONS OF EMPLOYMENT ARE NOT FULFILLED. IN PARTICULAR, DEVELOPING FOOTBALLING COUNTRIES IN AFRICA, THE AMERICAS AND EASTERN EUROPE REQUIRE AN URGENT IMPROVEMENT IN BASIC EMPLOYMENT STANDARDS.
In some countries, secondary contracts which usually cover remuneration for the use of image rights are frequently used by clubs and players. Given the market value of domestic competitions and the marketing potential of players, many of these contracts appear to
be misused, for example as a means to decrease social security or tax payments. Such contracts are also significantly harder for a player to enforce in a court in case of a dispute with their club.
2016 Football Employment Report
ON AVERAGE, 8% OF PLAYERS DO NOT HAVE A WRITTEN CONTRACT WITH THEIR CLUB
The data highlights significant regional differences:
AMERICAS EUROPE AFRICA8% 3% 15%
FIGURE 3.6 AVAILABILITY OF A WRITTEN CONTRACT AND CITIZENSHIP
FIGURE 3.5 AVAILABILITY OF A WRITTEN CONTRACT AND AGE GROUP
LACK OF WRITTEN CONTRACT WRITTEN CONTRACT
Under 18
18 - 23
24 - 28
29 - 33
Above 33
70% 0% 10% 20% 30%80% 90% 100%
AMERICAS CITIZEN
AMERICAS NON-CITIZEN
EUROPE CITIZEN
EUROPE NON-CITIZEN
AFRICA CITIZEN
AFRICA NO-CITIZEN
NO WRITTEN CONTRACT
0% 10% 20%
Having a written contract and being able to personally access it are the most basic requirements for any employee. Players without such a protection are easily
taken advantage of and will have no chance of enforcing their rights in a dispute.
DO HAVE A WRITTEN CONTRACT
DID NOT HAVE A WRITTEN CONTRACT
AVAILABILITY OF A WRITTEN CONTRACT
UNREGULATED WORKING CONDITIONSMany players face precarious and unregulated employment
Top finding
5
19
Working conditions In professional football
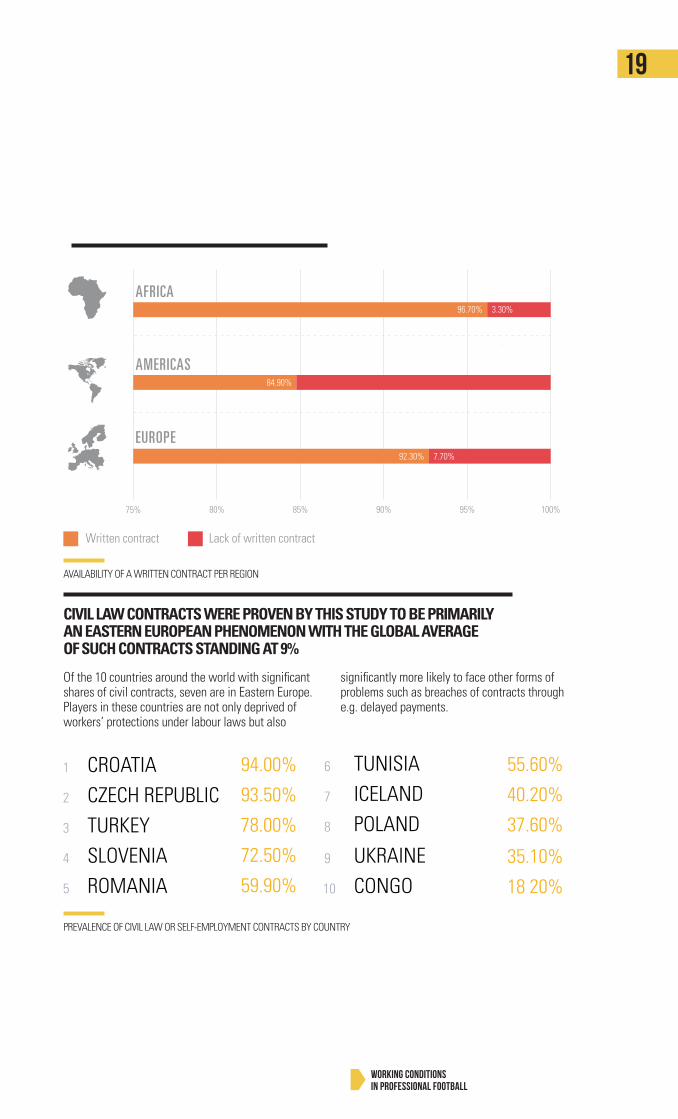
CIVIL LAW CONTRACTS WERE PROVEN BY THIS STUDY TO BE PRIMARILY AN EASTERN EUROPEAN PHENOMENON WITH THE GLOBAL AVERAGE OF SUCH CONTRACTS STANDING AT 9%
Of the 10 countries around the world with signifi cant shares of civil contracts, seven are in Eastern Europe. Players in these countries are not only deprived of workers’ protections under labour laws but also
signifi cantly more likely to face other forms of problems such as breaches of contracts through e.g. delayed payments.
AVAILABILITY OF A WRITTEN CONTRACT PER REGION
PREVALENCE OF CIVIL LAW OR SELF-EMPLOYMENT CONTRACTS BY COUNTRY
FIGURE 3.1 AVAILABILITY OF A WRITTEN CONTRACT
92% DO HAVE AWRITTEN CONTRACT
8% DO NOT HAVE AWRITTEN CONTRACT
FIGURE 3.2 AVAILABILITY OF A WRITTEN CONTRACT PER REGION
75%
15.10%
80% 85% 90% 95% 100%
AFRICA96.70% 3.30%
EUROPE92.30% 7.70%
AMERICAS84.90%
20 TOP FINDINGS
2016 Football Employment Report
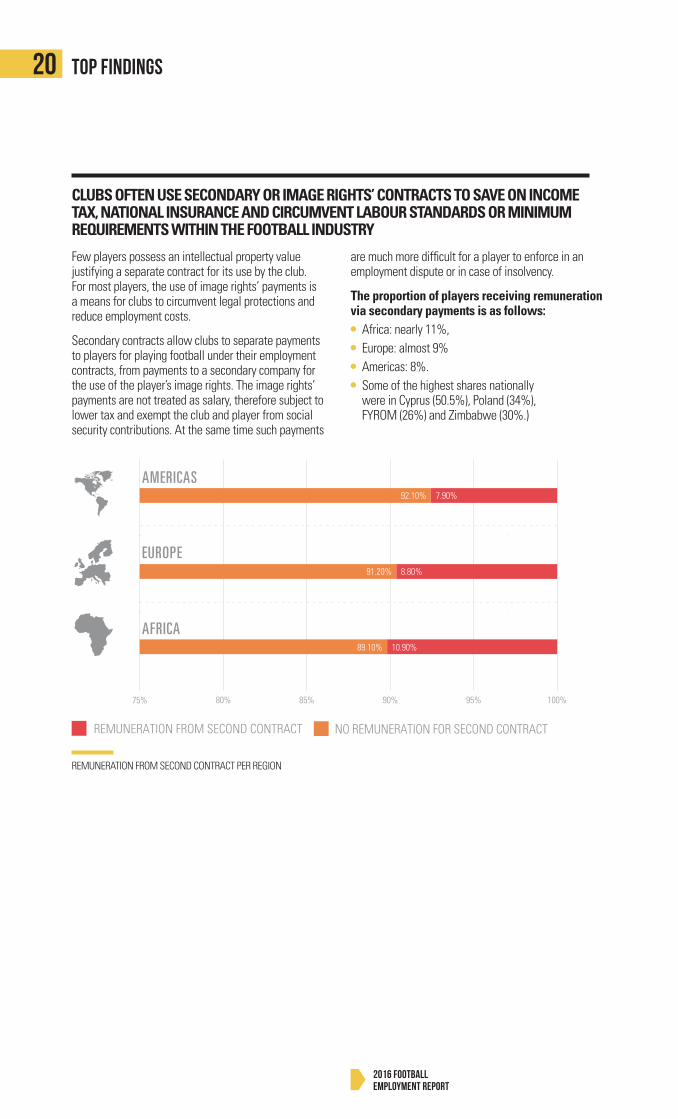
Few players possess an intellectual property value justifying a separate contract for its use by the club. For most players, the use of image rights’ payments is a means for clubs to circumvent legal protections and reduce employment costs.
Secondary contracts allow clubs to separate payments to players for playing football under their employment contracts, from payments to a secondary company for the use of the player’s image rights. The image rights’ payments are not treated as salary, therefore subject to lower tax and exempt the club and player from social security contributions. At the same time such payments
are much more diffi cult for a player to enforce in an employment dispute or in case of insolvency.
The proportion of players receiving remuneration via secondary payments is as follows: Africa: nearly 11%, Europe: almost 9% Americas: 8%. Some of the highest shares nationally
were in Cyprus (50.5%), Poland (34%), FYROM (26%) and Zimbabwe (30%.)
CLUBS OFTEN USE SECONDARY OR IMAGE RIGHTS’ CONTRACTS TO SAVE ON INCOME TAX, NATIONAL INSURANCE AND CIRCUMVENT LABOUR STANDARDS OR MINIMUM REQUIREMENTS WITHIN THE FOOTBALL INDUSTRY
FIGURE 3.14 REMUNERATION FROM SECOND CONTRACT PER REGION
REMUNERATION FROM SECOND CONTRACT
AMERICAS
EUROPE
AFRICA
NO REMUNERATION FOR SECOND CONTRACT
75%
7.90%92.10%
91.20% 8.80%
89.10% 10.90%
80% 85% 90% 95% 100%
FIGURE 3.15 REMUNERATIONFROM SECONDARY CONTRACTS PER COUNTRY
0% 10% 20% 30% 40% 50% 60% 70%
FYROM
POLAND
CYPRUS
TURKEY
BULGARIA
SOUTH AFRICA
GABON
KENYA
ZIMBABWE
NAMIBIA
COSTA RICABRAZIL
GUATEMALAPERU
ECUADOR
REMUNERATION FROM SECOND CONTRACT PER REGION

Working conditions In professional football
21
There is no stability. You have one, two, three-year contracts your whole career so you’re always looking over your shoulder thinking, where am I going next?
Defender, New Zealand
“
22 TOP FINDINGS
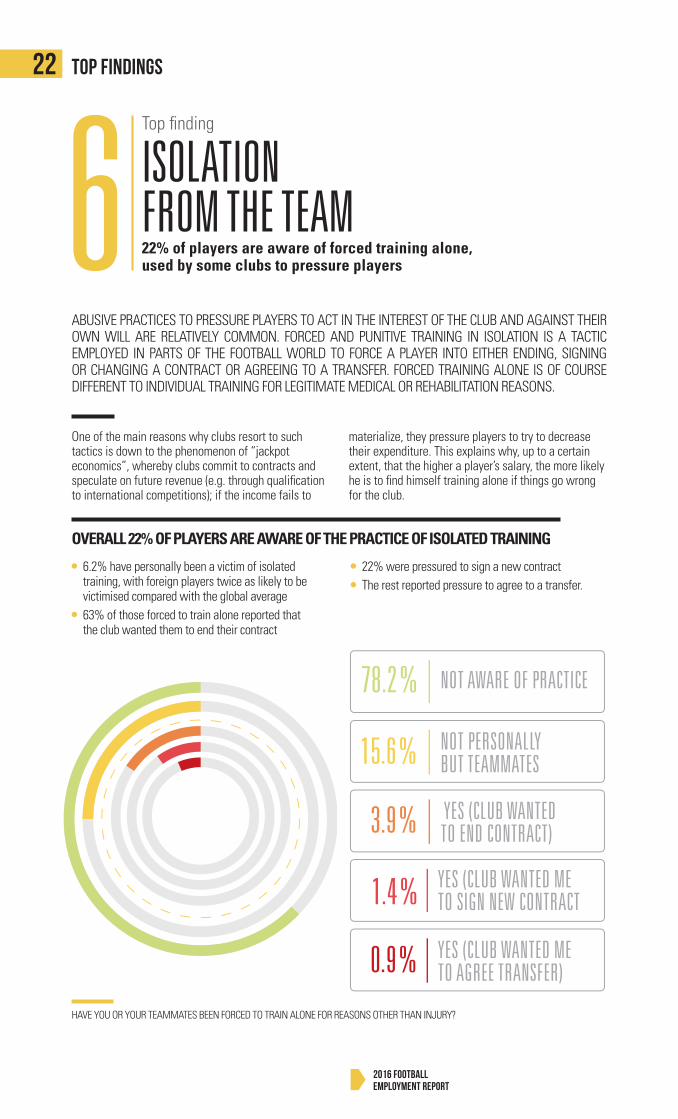
ABUSIVE PRACTICES TO PRESSURE PLAYERS TO ACT IN THE INTEREST OF THE CLUB AND AGAINST THEIR OWN WILL ARE RELATIVELY COMMON. FORCED AND PUNITIVE TRAINING IN ISOLATION IS A TACTIC EMPLOYED IN PARTS OF THE FOOTBALL WORLD TO FORCE A PLAYER INTO EITHER ENDING, SIGNING OR CHANGING A CONTRACT OR AGREEING TO A TRANSFER. FORCED TRAINING ALONE IS OF COURSE DIFFERENT TO INDIVIDUAL TRAINING FOR LEGITIMATE MEDICAL OR REHABILITATION REASONS.
One of the main reasons why clubs resort to such tactics is down to the phenomenon of “jackpot economics”, whereby clubs commit to contracts and speculate on future revenue (e.g. through qualification to international competitions); if the income fails to
materialize, they pressure players to try to decrease their expenditure. This explains why, up to a certain extent, that the higher a player’s salary, the more likely he is to find himself training alone if things go wrong for the club.
2016 Football Employment Report
OVERALL 22% OF PLAYERS ARE AWARE OF THE PRACTICE OF ISOLATED TRAINING
HAVE YOU OR YOUR TEAMMATES BEEN FORCED TO TRAIN ALONE FOR REASONS OTHER THAN INJURY?
YES (CLUB WANTED METO SIGN NEW CONTRACT
YES (CLUB WANTED METO AGREE TRANSFER)
NOT AWARE OF PRACTICE
YES (CLUB WANTED TO END CONTRACT)
NOT PERSONALLYBUT TEAMMATES
6.2% have personally been a victim of isolated training, with foreign players twice as likely to be victimised compared with the global average
63% of those forced to train alone reported that the club wanted them to end their contract
22% were pressured to sign a new contract The rest reported pressure to agree to a transfer.
ISOLATION FROM THE TEAM22% of players are aware of forced training alone, used by some clubs to pressure players
Top finding
6
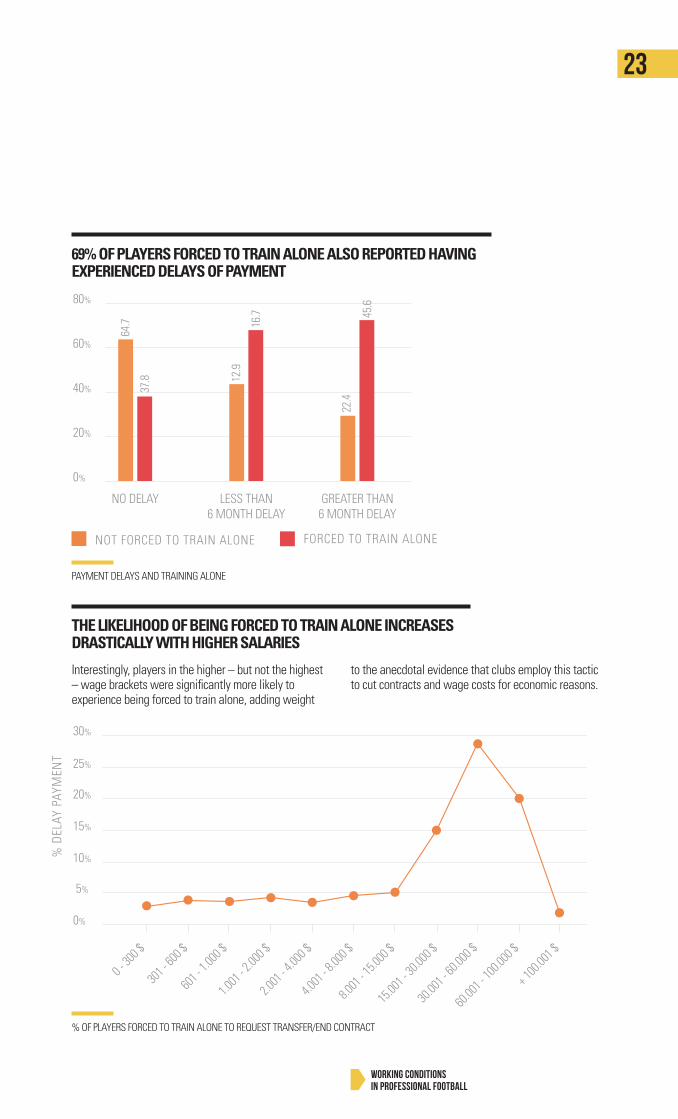
FIGURE 5.14B % OF PLAYERS FORCED TO TRAIN ALONE TO REQUEST TRANSFER/END CONTRACT BY SALARY
0%
5%
10%
15%
20%
25%
30%
35%
% D
ELAY
PAY
MEN
T
0 - 30
0 $
301 -
600 $
601 -
1.00
0 $
1.001
- 2.00
0 $
2.001
- 4.00
0 $
4.001
- 8.00
0 $
8.001
- 15.0
00 $
15.00
1 - 30
.000 $
30.00
1 - 60
.000 $
60.00
1 - 10
0.000
$
+ 100
.001 $
FIGURE 5.15 PAYMENT DELAYS AND TRAINING ALONE
0%
NOT FORCED TO TRAIN ALONE
FORCED TO TRAIN ALONE
20%
40%
60%
80%
100%
NO DELAY LESS THAN6 MONTH DELAY
GREATER THAN6 MONTH DELAY
23
Working conditions In professional football
% OF PLAYERS FORCED TO TRAIN ALONE TO REQUEST TRANSFER/END CONTRACT
PAYMENT DELAYS AND TRAINING ALONE
69% OF PLAYERS FORCED TO TRAIN ALONE ALSO REPORTED HAVING EXPERIENCED DELAYS OF PAYMENT
THE LIKELIHOOD OF BEING FORCED TO TRAIN ALONE INCREASES DRASTICALLY WITH HIGHER SALARIES
Interestingly, players in the higher – but not the highest – wage brackets were significantly more likely to experience being forced to train alone, adding weight
to the anecdotal evidence that clubs employ this tactic to cut contracts and wage costs for economic reasons.
FIGURE 5.14B % OF PLAYERS FORCED TO TRAIN ALONE TO REQUEST TRANSFER/END CONTRACT BY SALARY
0%
5%
10%
15%
20%
25%
30%
35%
% D
ELAY
PAY
MEN
T
0 - 30
0 $
301 -
600 $
601 -
1.00
0 $
1.001
- 2.00
0 $
2.001
- 4.00
0 $
4.001
- 8.00
0 $
8.001
- 15.0
00 $
15.00
1 - 30
.000 $
30.00
1 - 60
.000 $
60.00
1 - 10
0.000
$
+ 100
.001 $
FIGURE 5.15 PAYMENT DELAYS AND TRAINING ALONE
0%
NOT FORCED TO TRAIN ALONE
FORCED TO TRAIN ALONE
20%
40%
60%
80%
100%
NO DELAY LESS THAN6 MONTH DELAY
GREATER THAN6 MONTH DELAY
FIGURE 5.14B % OF PLAYERS FORCED TO TRAIN ALONE TO REQUEST TRANSFER/END CONTRACT BY SALARY
0%
5%
10%
15%
20%
25%
30%
35%%
DEL
AY P
AYM
ENT
0 - 30
0 $
301 -
600 $
601 -
1.00
0 $
1.001
- 2.00
0 $
2.001
- 4.00
0 $
4.001
- 8.00
0 $
8.001
- 15.0
00 $
15.00
1 - 30
.000 $
30.00
1 - 60
.000 $
60.00
1 - 10
0.000
$
+ 100
.001 $
FIGURE 5.15 PAYMENT DELAYS AND TRAINING ALONE
0%
NOT FORCED TO TRAIN ALONE
FORCED TO TRAIN ALONE
20%
40%
60%
80%
100%
NO DELAY LESS THAN6 MONTH DELAY
GREATER THAN6 MONTH DELAY
37.8
64.7 16
.7 45.6
22.4
12.9
2016 Football Employment Report
24 TOP FINDINGS
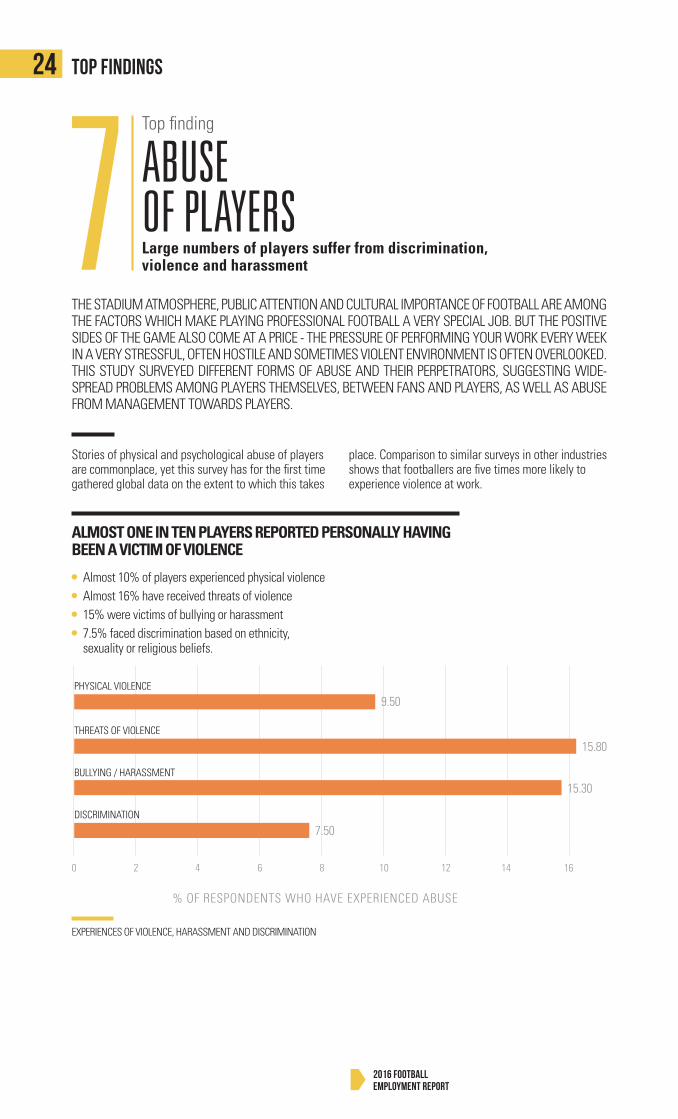
THE STADIUM ATMOSPHERE, PUBLIC ATTENTION AND CULTURAL IMPORTANCE OF FOOTBALL ARE AMONG THE FACTORS WHICH MAKE PLAYING PROFESSIONAL FOOTBALL A VERY SPECIAL JOB. BUT THE POSITIVE SIDES OF THE GAME ALSO COME AT A PRICE - THE PRESSURE OF PERFORMING YOUR WORK EVERY WEEK IN A VERY STRESSFUL, OFTEN HOSTILE AND SOMETIMES VIOLENT ENVIRONMENT IS OFTEN OVERLOOKED. THIS STUDY SURVEYED DIFFERENT FORMS OF ABUSE AND THEIR PERPETRATORS, SUGGESTING WIDE-SPREAD PROBLEMS AMONG PLAYERS THEMSELVES, BETWEEN FANS AND PLAYERS, AS WELL AS ABUSE FROM MANAGEMENT TOWARDS PLAYERS.
Stories of physical and psychological abuse of players are commonplace, yet this survey has for the first time gathered global data on the extent to which this takes
place. Comparison to similar surveys in other industries shows that footballers are five times more likely to experience violence at work.
ALMOST ONE IN TEN PLAYERS REPORTED PERSONALLY HAVING BEEN A VICTIM OF VIOLENCE
EXPERIENCES OF VIOLENCE, HARASSMENT AND DISCRIMINATION
Almost 10% of players experienced physical violence Almost 16% have received threats of violence 15% were victims of bullying or harassment 7.5% faced discrimination based on ethnicity,
sexuality or religious beliefs.
ABUSE OF PLAYERSLarge numbers of players suffer from discrimination, violence and harassment
Top finding
7
Working conditions In professional football
25
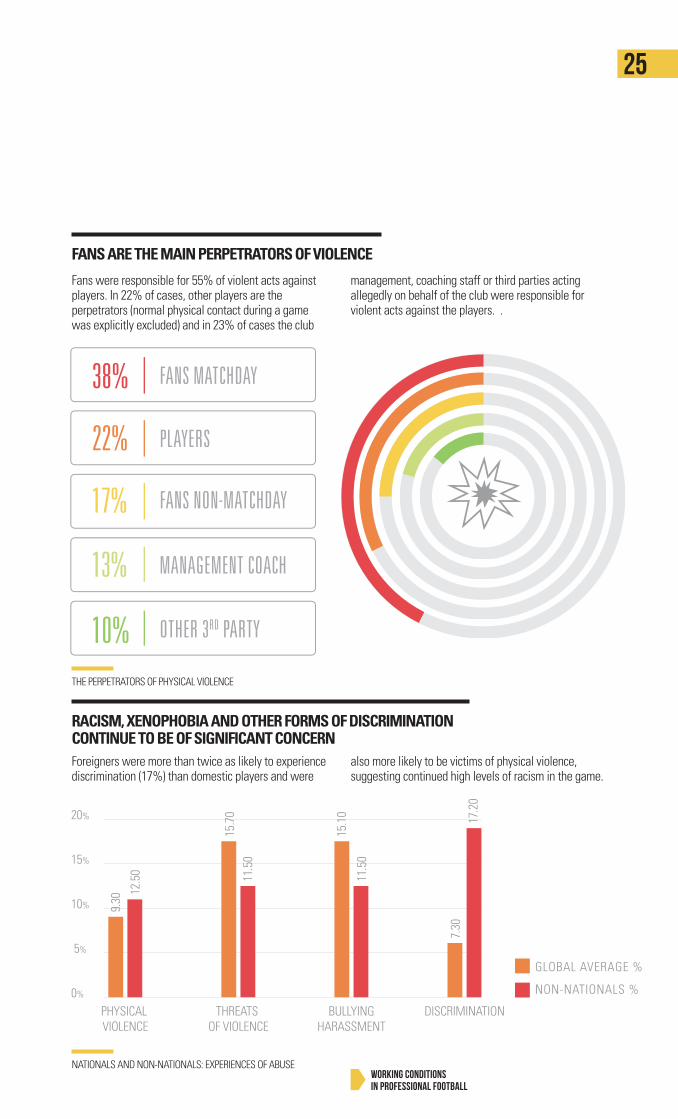
FANS ARE THE MAIN PERPETRATORS OF VIOLENCE
RACISM, XENOPHOBIA AND OTHER FORMS OF DISCRIMINATION CONTINUE TO BE OF SIGNIFICANT CONCERN
Fans were responsible for 55% of violent acts against players. In 22% of cases, other players are the perpetrators (normal physical contact during a game was explicitly excluded) and in 23% of cases the club
management, coaching staff or third parties acting allegedly on behalf of the club were responsible for violent acts against the players. .
Foreigners were more than twice as likely to experience discrimination (17%) than domestic players and were
also more likely to be victims of physical violence, suggesting continued high levels of racism in the game.
NATIONALS AND NON-NATIONALS: EXPERIENCES OF ABUSE
THE PERPETRATORS OF PHYSICAL VIOLENCE
FIGURE 5.17 EXPERIENCES OF VIOLENCE, HARASSMENT AND DISCRIMINATION
FIGURE 5.18: THE PERPETRATORS OF PHYSICAL VIOLENCE
% OF RESPONDENTS WHO HAVE EXPERIENCED ABUSE
0 2 4 6 8 12
14 16
10
THREATS OF VIOLENCE
PHYSICAL VIOLENCE
BULLYING / HARASSMENT
DISCRIMINATION
38% FANS MATCHDAY
17% FANSNON-MATCHDAY
13% MANAGEMENTCOACH
10% OTHER 3RD PARTY
22% PLAYERS
FANS MATCHDAY
PLAYERS
MANAGEMENT COACH
FANS NON-MATCHDAY
OTHER 3RD PARTY
2016 Football Employment Report
26 TOP FINDINGS
THE FINDINGS OF THIS REPORT SUGGEST THAT IN A VARIETY OF WAYS THE YOUNGEST PLAYERS (IDENTIFIED IN THE TWO LOWEST AGE GROUPS MEASURED, UNDER-18 AND 18-23) FACE THE SAME AND, IN SOME AREAS, EVEN WORSE ADVERSE EFFECTS THAN OLDER PLAYERS. AT THE SAME TIME, THE VAST MAJORITY OF YOUNG AND MINOR PLAYERS SACRIFICE THEIR TERTIARY OR EVEN THEIR SECONDARY EDUCATION TO PURSUE THEIR DREAM OF BECOMING A FOOTBALLER.
THE MATCH AND COMPETITION CALENDAR ALSO POSE SIGNIFICANT CHALLENGES FOR YOUNG TALENTS. HOWEVER, ONLY A SMALL MINORITY SUCCEED IN THEIR AMBITIONS AND ARE OFTEN ILL-EQUIPPED FOR A CAREER OUTSIDE OF FOOTBALL.
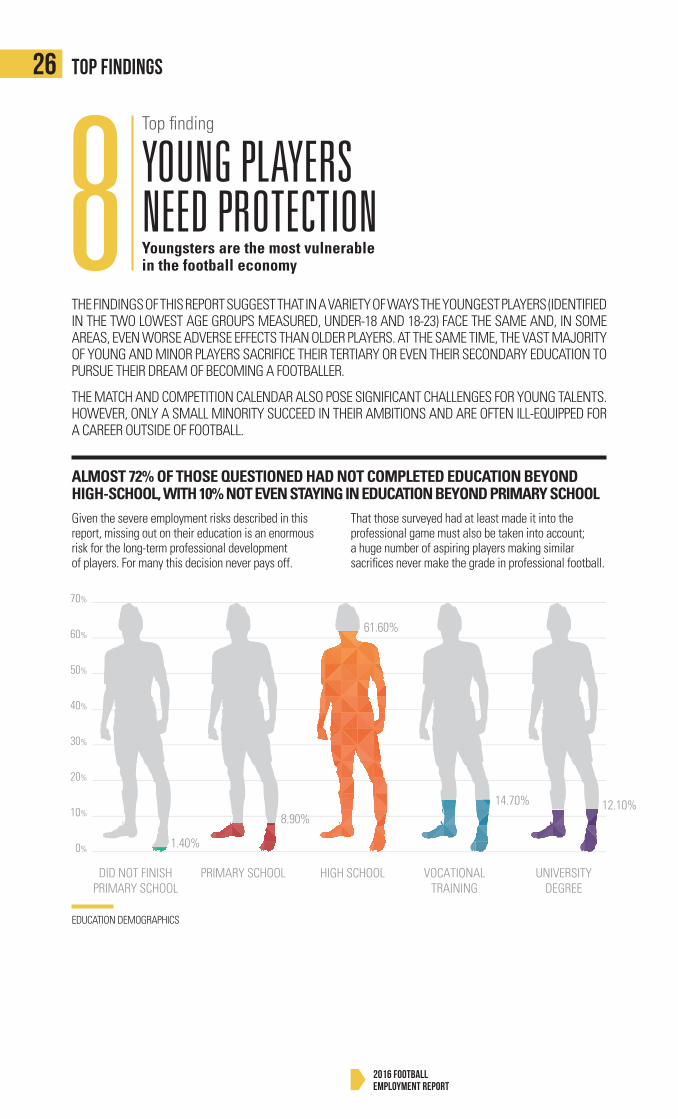
ALMOST 72% OF THOSE QUESTIONED HAD NOT COMPLETED EDUCATION BEYOND HIGH-SCHOOL, WITH 10% NOT EVEN STAYING IN EDUCATION BEYOND PRIMARY SCHOOLGiven the severe employment risks described in this report, missing out on their education is an enormous risk for the long-term professional development of players. For many this decision never pays off.
That those surveyed had at least made it into the professional game must also be taken into account; a huge number of aspiring players making similar sacrifices never make the grade in professional football.
EDUCATION DEMOGRAPHICS
YOUNG PLAYERS NEED PROTECTIONYoungsters are the most vulnerable in the football economy
Top finding
8
Working conditions In professional football
27
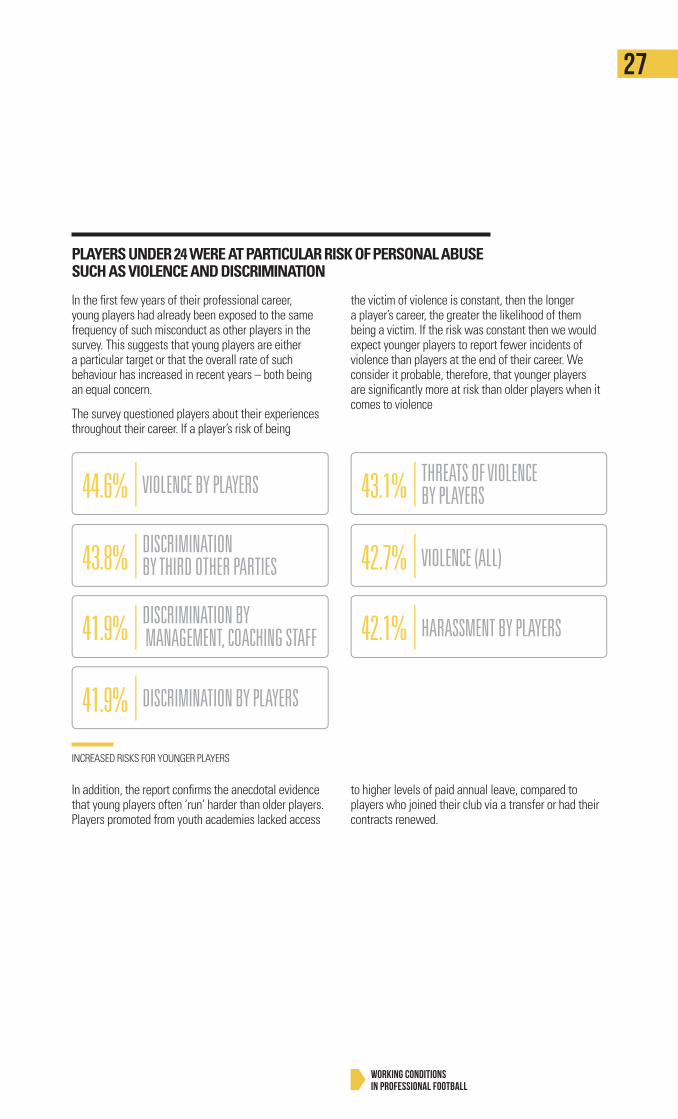
PLAYERS UNDER 24 WERE AT PARTICULAR RISK OF PERSONAL ABUSE SUCH AS VIOLENCE AND DISCRIMINATION
In the first few years of their professional career, young players had already been exposed to the same frequency of such misconduct as other players in the survey. This suggests that young players are either a particular target or that the overall rate of such behaviour has increased in recent years – both being an equal concern.
The survey questioned players about their experiences throughout their career. If a player’s risk of being
the victim of violence is constant, then the longer a player’s career, the greater the likelihood of them being a victim. If the risk was constant then we would expect younger players to report fewer incidents of violence than players at the end of their career. We consider it probable, therefore, that younger players are significantly more at risk than older players when it comes to violence
In addition, the report confirms the anecdotal evidence that young players often ‘run’ harder than older players. Players promoted from youth academies lacked access
to higher levels of paid annual leave, compared to players who joined their club via a transfer or had their contracts renewed.
INCREASED RISKS FOR YOUNGER PLAYERS
VIOLENCE BY PLAYERS
DISCRIMINATION BY PLAYERS
THREATS OF VIOLENCE BY PLAYERS
DISCRIMINATION BY THIRD OTHER PARTIES VIOLENCE (ALL)
DISCRIMINATION BY MANAGEMENT, COACHING STAFF
43.8% 42.7%
41.9% HARASSMENT BY PLAYERS42.1%
41.9%
44.6% 43.1%
2016 Football Employment Report
28 TOP FINDINGS
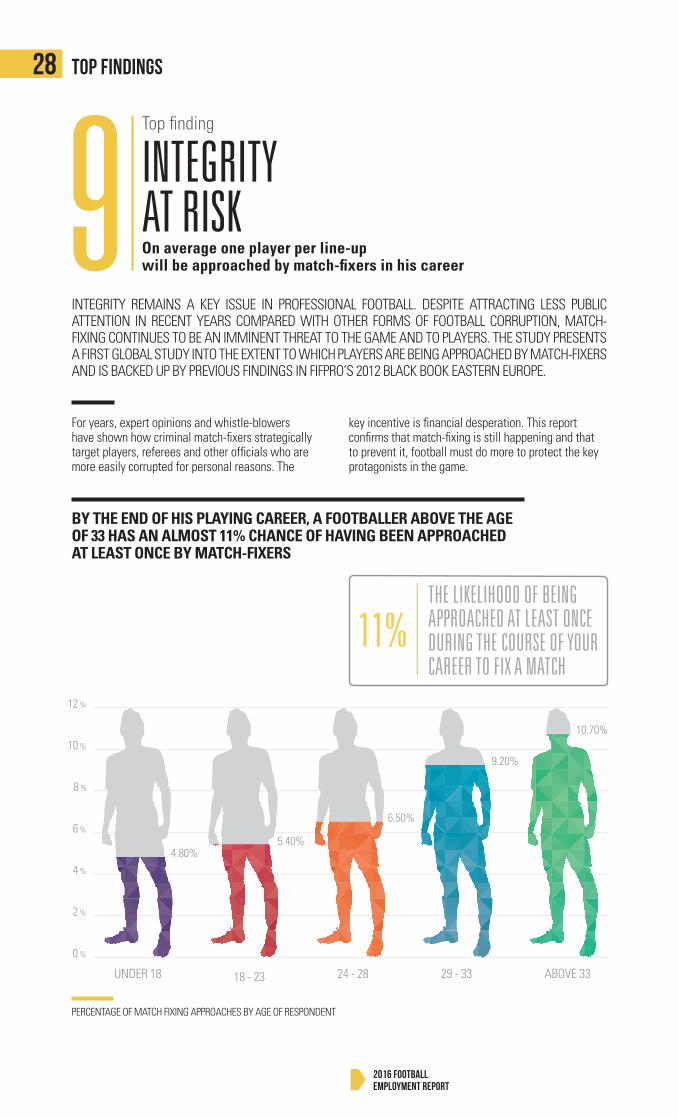
INTEGRITY REMAINS A KEY ISSUE IN PROFESSIONAL FOOTBALL. DESPITE ATTRACTING LESS PUBLIC ATTENTION IN RECENT YEARS COMPARED WITH OTHER FORMS OF FOOTBALL CORRUPTION, MATCH-FIXING CONTINUES TO BE AN IMMINENT THREAT TO THE GAME AND TO PLAYERS. THE STUDY PRESENTS A FIRST GLOBAL STUDY INTO THE EXTENT TO WHICH PLAYERS ARE BEING APPROACHED BY MATCH-FIXERS AND IS BACKED UP BY PREVIOUS FINDINGS IN FIFPRO’S 2012 BLACK BOOK EASTERN EUROPE.
For years, expert opinions and whistle-blowers have shown how criminal match-fi xers strategically target players, referees and other offi cials who are more easily corrupted for personal reasons. The
key incentive is fi nancial desperation. This report confi rms that match-fi xing is still happening and that to prevent it, football must do more to protect the key protagonists in the game.
BY THE END OF HIS PLAYING CAREER, A FOOTBALLER ABOVE THE AGE OF 33 HAS AN ALMOST 11% CHANCE OF HAVING BEEN APPROACHED AT LEAST ONCE BY MATCH-FIXERS
PERCENTAGE OF MATCH FIXING APPROACHES BY AGE OF RESPONDENT
FIGURE 7.4 MATCH-FIXING APPROACHES BY AGE RANGEFIGURE 7.5 PERCENTAGE OF MATCH FIXING APPROACHES BY AGE OF RESPONDENT
11% THE LIKELIHOOD OF BEING APPROACHED AT LEAST ONEDURING THE COURSE OF YOUR CAREER TO FIX A MATCH
4.80%5.40%
6.50%
9.20%
10.70%
UNDER 18 18 - 23 24 - 28 29 - 33 ABOVE 33
0 %
2 %
4 %
6 %
8 %
10 %
12 %
THE LIKELIHOOD OF BEING APPROACHED AT LEAST ONCEDURING THE COURSE OF YOUR CAREER TO FIX A MATCH
INTEGRITY AT RISK On average one player per line-up will be approached by match-fi xers in his career
Top fi nding
9
Working conditions In professional football
29
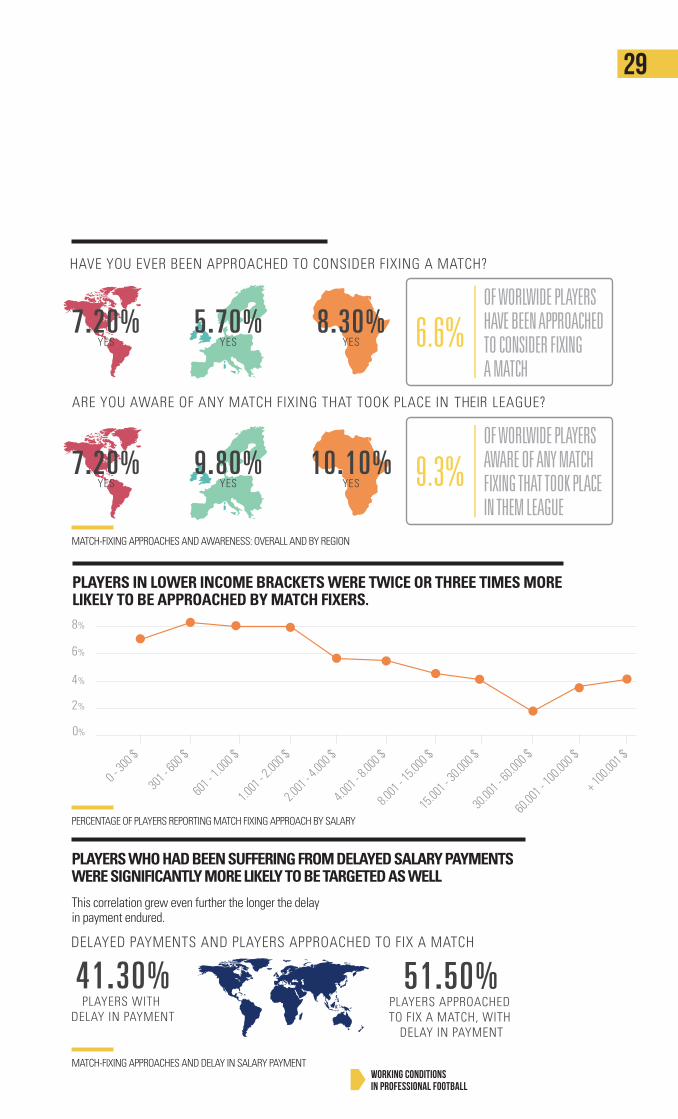
PLAYERS IN LOWER INCOME BRACKETS WERE TWICE OR THREE TIMES MORE LIKELY TO BE APPROACHED BY MATCH FIXERS.
MATCH-FIXING APPROACHES AND AWARENESS: OVERALL AND BY REGION
OF WORLWIDE PLAYERS HAVE BEEN APPROACHED TO CONSIDER FIXING A MATCH
OF WORLWIDE PLAYERS AWARE OF ANY MATCHFIXING THAT TOOK PLACE IN THEM LEAGUE
PERCENTAGE OF PLAYERS REPORTING MATCH FIXING APPROACH BY SALARY
PLAYERS WHO HAD BEEN SUFFERING FROM DELAYED SALARY PAYMENTS WERE SIGNIFICANTLY MORE LIKELY TO BE TARGETED AS WELL
This correlation grew even further the longer the delay in payment endured.
MATCH-FIXING APPROACHES AND DELAY IN SALARY PAYMENT
FIGURES 7.6A AND 7.6B PERCENTAGE OF PLAYERS REPORTING MATCH FIXING APPROACH BY SALARY
FIGURE 7.7 MATCH-FIXING APPROACHES AND DELAY IN SALARY PAYMENT
HAVE YOU BEEN APPROACHED TO FIX A MATCH?
51.50%YES, WITH DELAY
IN PAYMENTYES, WITH NO
DELAY IN PAYMENT
41.30%
0%
1%
2%
3%
4%
5%
6%
7%
8%
9%
0 - 30
0 $
301 -
600 $
601 -
1.00
0 $
1.001
- 2.00
0 $
2.001
- 4.00
0 $
4.001
- 8.00
0 $
8.001
- 15.0
00 $
15.00
1 - 30
.000 $
30.00
1 - 60
.000 $
60.00
1 - 10
0.000
$
+ 100
.001 $
30 TOP FINDINGS
2016 Football Employment Report
CONCLUSIONS/ RECOMMENDATIONS
Decent employment conditions for players fuel the overall positive development of both club and national team football. It must be a core objective of the industry to improve the working conditions of the large majority of footballers. It must also be a core objective to create as many quality jobs as possible for players and move them from the third into the second tier.
Factors to improve employment conditions in football include:
Stronger minimum employment and arbitration standards
Better and greatly reformed international regulation of transfer and transfer-related activities
Strengthening of collective bargaining as a core component of football governance
Increased economic sustainability, innovation and better management standards
Tackling the social and criminal risks faced by football and its players.
All professional football stakeholders, FIFA under its new leadership, the confederations, FAs as well as public policy makers and legislators must act together and with decisiveness in the interest of the world’s game and its players.
STRONGER MINIMUM EMPLOYMENT AND LEGAL STANDARDS
This study leaves no doubts about the need for stronger and more ambitious regulatory frameworks for better employment conditions and stronger protection for players (and clubs).
While new approaches responding to industry developments are required, some mechanisms are already in place and simply require more vigorous efforts to implement and enforce them.
These include:
Global implementation of minimum requirements for standard player contracts as agreed by European social partners, UEFA and FIFA
Improved arbitration at national (NDRCs) and international level, which ensures swift recourse to justice
Club licensing systems, which must properly address employment standards on many levels
Labour laws at national and supranational level, which must be more consistently applied to professional football
BETTER INTERNATIONAL REGULATIONS
The regulations and operation of the transfer system and related activities such as agents must also be thoroughly reviewed and fundamentally reformed.
This survey confirms the failure of market regulations in football to achieve their core stated objectives of ensuring respect of contracts and fairly balancing the interests of clubs and players.
A reform of the regulations on transfers of players must, at the very least, provide stronger protections of players against material breaches of contracts by clubs such as: shorter and proportionate periods of overdue payment justifying a termination, prohibitions of abusive practices such as forced training alone and stronger deterrents for actions in bad faith. The overall impact of transfers on the employment market and interference with the career path of a player must be addressed.
Via a new industry agreement, the global reach and enforceability of such regulations must be put to better use to ensure that players are paid and employment conditions performed with mutual respect.
Top findings
1
2
Working conditions In professional football
31
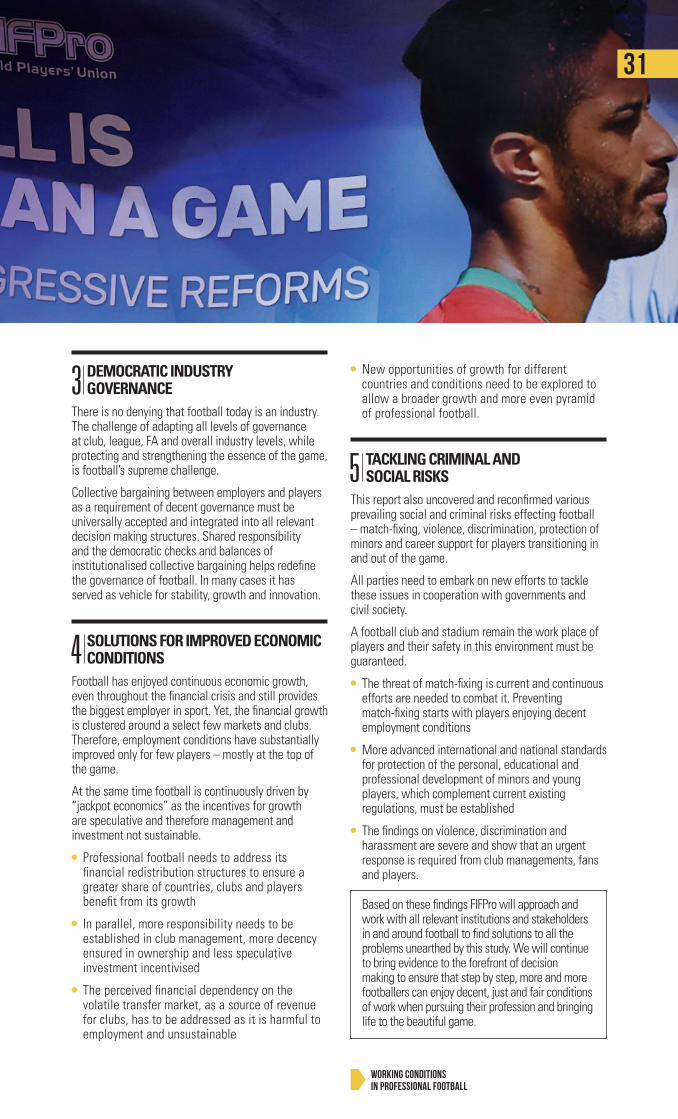
DEMOCRATIC INDUSTRY GOVERNANCE
There is no denying that football today is an industry. The challenge of adapting all levels of governance at club, league, FA and overall industry levels, while protecting and strengthening the essence of the game, is football’s supreme challenge.
Collective bargaining between employers and players as a requirement of decent governance must be universally accepted and integrated into all relevant decision making structures. Shared responsibility and the democratic checks and balances of institutionalised collective bargaining helps redefine the governance of football. In many cases it has served as vehicle for stability, growth and innovation.
SOLUTIONS FOR IMPROVED ECONOMIC CONDITIONS
Football has enjoyed continuous economic growth, even throughout the financial crisis and still provides the biggest employer in sport. Yet, the financial growth is clustered around a select few markets and clubs. Therefore, employment conditions have substantially improved only for few players – mostly at the top of the game.
At the same time football is continuously driven by “jackpot economics” as the incentives for growth are speculative and therefore management and investment not sustainable.
Professional football needs to address its financial redistribution structures to ensure a greater share of countries, clubs and players benefit from its growth
In parallel, more responsibility needs to be established in club management, more decency ensured in ownership and less speculative investment incentivised
The perceived financial dependency on the volatile transfer market, as a source of revenue for clubs, has to be addressed as it is harmful to employment and unsustainable
3
4
New opportunities of growth for different countries and conditions need to be explored to allow a broader growth and more even pyramid of professional football.
TACKLING CRIMINAL AND SOCIAL RISKS
This report also uncovered and reconfirmed various prevailing social and criminal risks effecting football – match-fixing, violence, discrimination, protection of minors and career support for players transitioning in and out of the game.
All parties need to embark on new efforts to tackle these issues in cooperation with governments and civil society.
A football club and stadium remain the work place of players and their safety in this environment must be guaranteed.
The threat of match-fixing is current and continuous efforts are needed to combat it. Preventing match-fixing starts with players enjoying decent employment conditions
More advanced international and national standards for protection of the personal, educational and professional development of minors and young players, which complement current existing regulations, must be established
The findings on violence, discrimination and harassment are severe and show that an urgent response is required from club managements, fans and players.
Based on these findings FIFPro will approach and work with all relevant institutions and stakeholders in and around football to find solutions to all the problems unearthed by this study. We will continue to bring evidence to the forefront of decision making to ensure that step by step, more and more footballers can enjoy decent, just and fair conditions of work when pursuing their profession and bringing life to the beautiful game.
5
DEMOGRAPHICS Key personal information – age,
education and citizenship
ABUSE Personal and
contractual abuse faced by players
CONTRACTS Key facts about contract
standards between clubs and players
MATCH-FIXING Approaches and awareness
of match-fixing and its relation to employment conditions of players.
THE MARKET Details on the economic and legal position of players on
the employment market
HEALTH ANDWELL-BEING
Medical standards, rest periods and more
32 TOP FINDINGS
2016 Football Employment Report
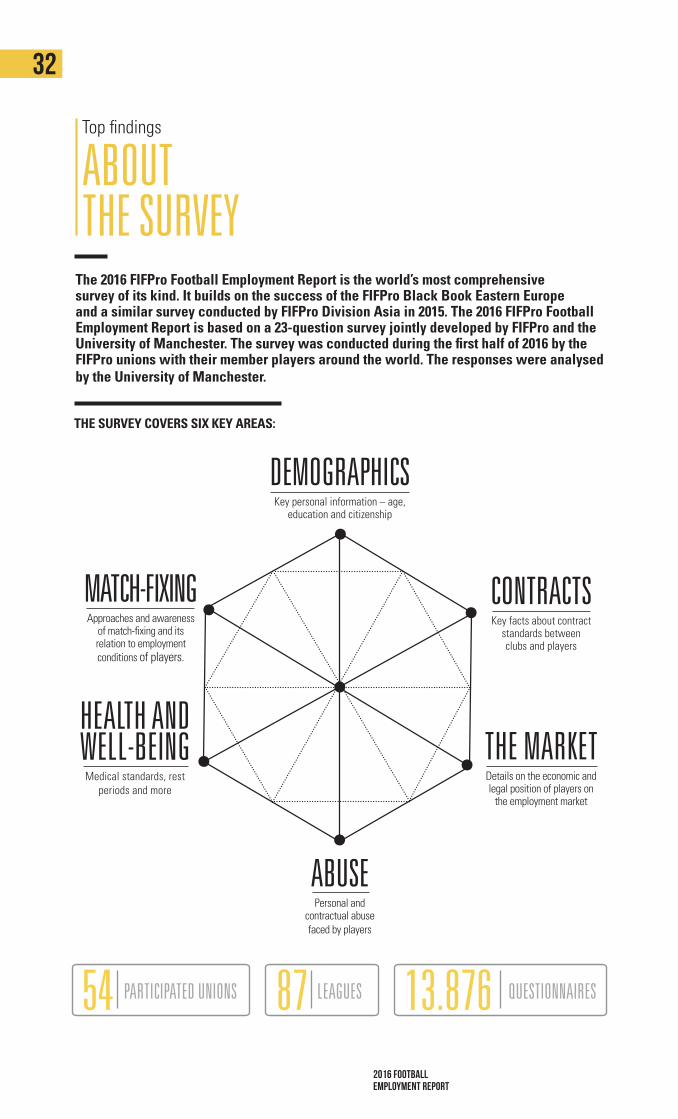
ABOUT THE SURVEY
The 2016 FIFPro Football Employment Report is the world’s most comprehensive survey of its kind. It builds on the success of the FIFPro Black Book Eastern Europe and a similar survey conducted by FIFPro Division Asia in 2015. The 2016 FIFPro Football Employment Report is based on a 23-question survey jointly developed by FIFPro and the University of Manchester. The survey was conducted during the first half of 2016 by the FIFPro unions with their member players around the world. The responses were analysed by the University of Manchester.
Top findings
THE SURVEY COVERS SIX KEY AREAS:
LEAGUESPARTICIPATED UNIONS 8754 QUESTIONNAIRES13.876
Working conditions In professional football
33
UNIVERSITY OF MANCHESTER The analysis of the responses by the University of Manchester sought to identify global trends, regional and national phenomena, as well as particularities in the employment market for professional footballers, vis-à-vis workers in other sectors.
Cross tabulations, comparing results of two or more questions, can lead to a deeper understanding of the prevalence of certain phenomena as regards, for example, certain age groups, national or international players, or, more broadly, how results relate to each other. As this survey is intended to be the first of a series, its findings will provide a baseline for future comparison and measurement of specific areas.
MARKETS COVERED BY THE REPORTThe report covers the member markets of player unions in Africa, the Americas and Europe: Austria, Bolivia, Botswana, Brazil, Bulgaria, Cameroon, Congo, Costa Rica, Croatia, Cyprus, Czech Republic, Denmark, Ecuador, Egypt, Finland, France, FYROM (Macedonia), Gabon, Georgia, Ghana, Greece, Guatemala, Hungary, Iceland, Ireland, Israel , Italy, Ivory Coast, Kazakhstan, Kenya , Malta, Montenegro, Morocco, Namibia, Norway, Paraguay, Peru, Poland, Romania, Russia, Scotland, Serbia, Slovenia, South Africa, Sweden, Switzerland, Tunisia , Turkey, Ukraine, Uruguay, USA, Venezuela, Zimbabwe.
As FIFPro Asia conducted a similar regional report in 2015, the results were used for global comparisons in some areas of this report but are not integrated in their entirety due to methodological differences. The full data is available in a separate section of the report.
The report does not cover England, Spain and Germany. While data from these markets would have certainly been interesting, it would have had only a minimum impact on the report’s focus, in revealing the working conditions of the large majority of professional players represented by the second and third tier of the global employment market.
The women’s game continues to make great strides in terms of participation, attracting crowds and revenues in some countries. Yet the economic and development gap between male and female football is still a reality of today’s game, which makes it difficult to compare these two markets. FIFPro will be conducting a separate survey on professional women’s football.


Scorpius 1612132 LR HoofddorpNetherlands
Tel: +31(0)23-5546970Fax: +31(0)23-5546971E-mail: [email protected]


![[RKRD] 2,4 MB Bundesliga](https://img.pdfslide.net/doc/110x75/568bd6511a28ab20349b9fe9/rkrd-24-mb-bundesliga.jpg)