Embed Size (px)
Citation preview
Page 1/21Page 1/21Bursa Malaysia : 7113 SGX : BVA Reuters : TPGC.KL Bloomberg : TOPG MK ADR CUSIP : 890534100
TOP GLOVE CORPORATION BHDInvestor Presentation
03 Sept 2018
Page 2/21
TG BUSINESS ETHICS CLAPS
Ready, 1 2 3
Claps, 2x 3x 2x
Prepared By: Ng Chin Yong @ 14/07/17
Checked & Verified By: Ng Yong Lin @ 14/07/17
Page 3/21
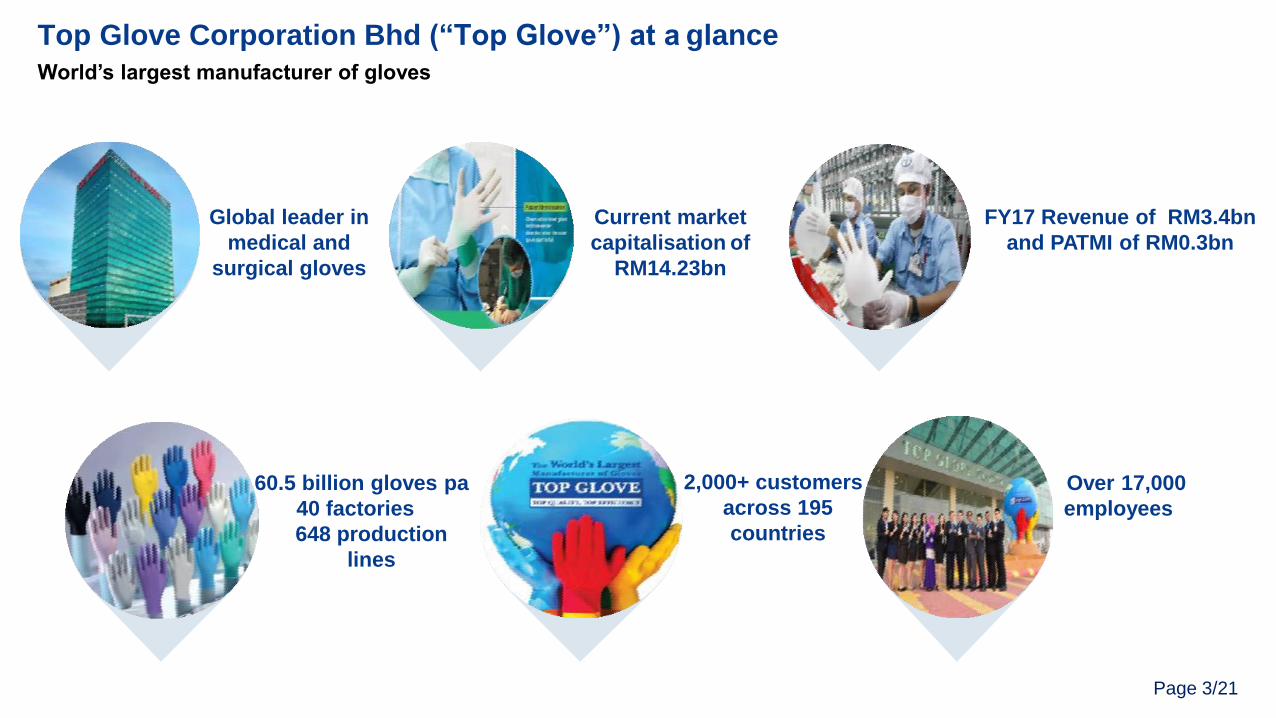
Top Glove Corporation Bhd (“Top Glove”) at a glance
60.5 billion gloves pa
40 factories
648 production
lines
2,000+ customers
across 195
countries
FY17 Revenue of RM3.4bn
and PATMI of RM0.3bn
Current market
capitalisation of
RM14.23bn
Global leader in
medical and
surgical gloves
World’s largest manufacturer of gloves
Over 17,000
employees
Page 4/21
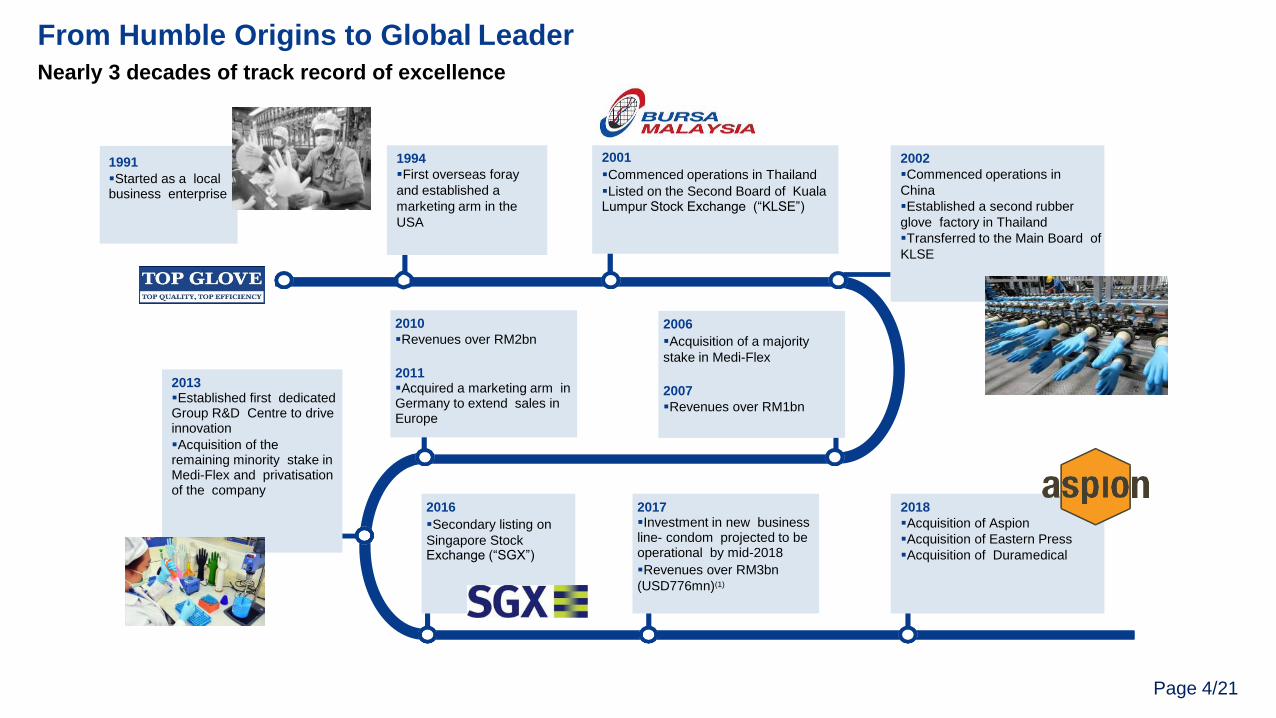
1991
Started as a local business enterprise
2013Established first dedicated Group R&D Centre to drive innovation
Acquisition of the remaining minority stake in Medi-Flex and privatisation of the company
1994
First overseas foray
and established a
marketing arm in the
USA
2006
Acquisition of a majority
stake in Medi-Flex
2007
Revenues over RM1bn
2016
Secondary listing on
Singapore StockExchange (“SGX”)
2017Investment in new business line- condom projected to be operational by mid-2018
Revenues over RM3bn
(USD776mn)(1)
2018
Acquisition of Aspion
Acquisition of Eastern Press
Acquisition of Duramedical
2010
Revenues over RM2bn
2011Acquired a marketing arm in Germany to extend sales in Europe
2002
Commenced operations in
China
Established a second rubber
glove factory in Thailand
Transferred to the Main Board of
KLSE
2001
Commenced operations in Thailand
Listed on the Second Board of Kuala Lumpur Stock Exchange (“KLSE”)
From Humble Origins to Global Leader
Nearly 3 decades of track record of excellence
Page 5/21
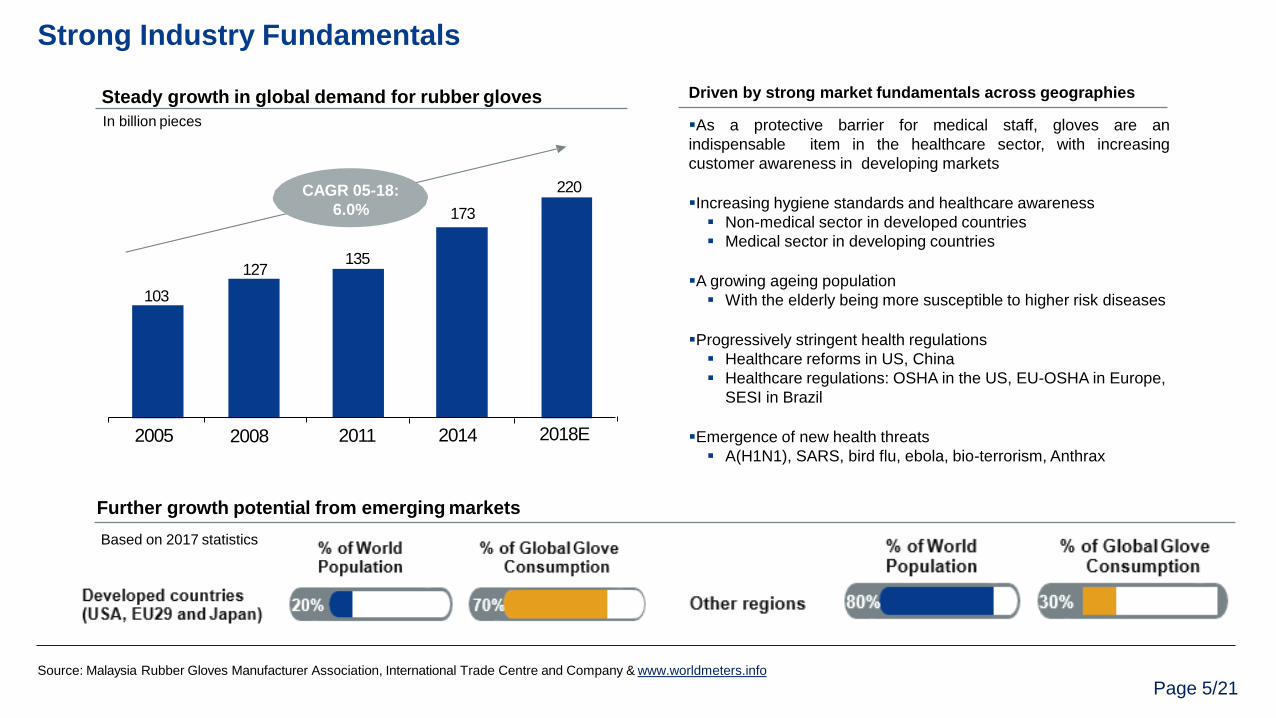
103
127135
173
220
2005 2008 2011 2014 2018E
Steady growth in global demand for rubber gloves
CAGR 05-18:
6.0%
Driven by strong market fundamentals across geographies
As a protective barrier for medical staff, gloves are an
indispensable item in the healthcare sector, with increasing
customer awareness in developing markets
Increasing hygiene standards and healthcare awareness
Non-medical sector in developed countries
Medical sector in developing countries
A growing ageing population
With the elderly being more susceptible to higher risk diseases
Progressively stringent health regulations
Healthcare reforms in US, China
Healthcare regulations: OSHA in the US, EU-OSHA in Europe,
SESI in Brazil
Emergence of new health threats
A(H1N1), SARS, bird flu, ebola, bio-terrorism, Anthrax
Further growth potential from emerging markets
Based on 2017 statistics
In billion pieces
Source: Malaysia Rubber Gloves Manufacturer Association, International Trade Centre and Company & www.worldmeters.info
Strong Industry Fundamentals
Page 6/21
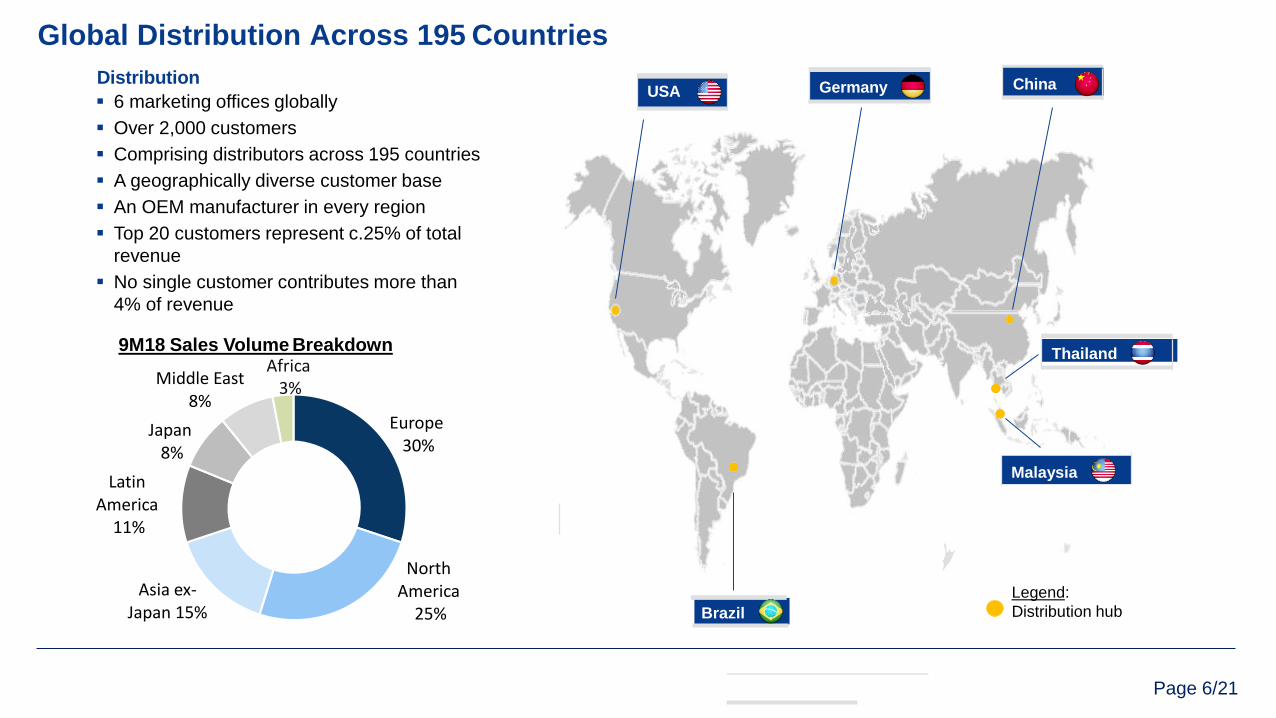
GermanyUSA China
Malaysia
Thailand
Legend:
Distribution hub
Distribution
6 marketing offices globally
Over 2,000 customers
Comprising distributors across 195 countries
A geographically diverse customer base
An OEM manufacturer in every region
Top 20 customers represent c.25% of total
revenue
No single customer contributes more than
4% of revenue
9M18 Sales Volume Breakdown
Brazil
Global Distribution Across 195 Countries
Europe30%
North America
25%
Asia ex-Japan 15%
Latin America
11%
Japan8%
Middle East8%
Africa3%
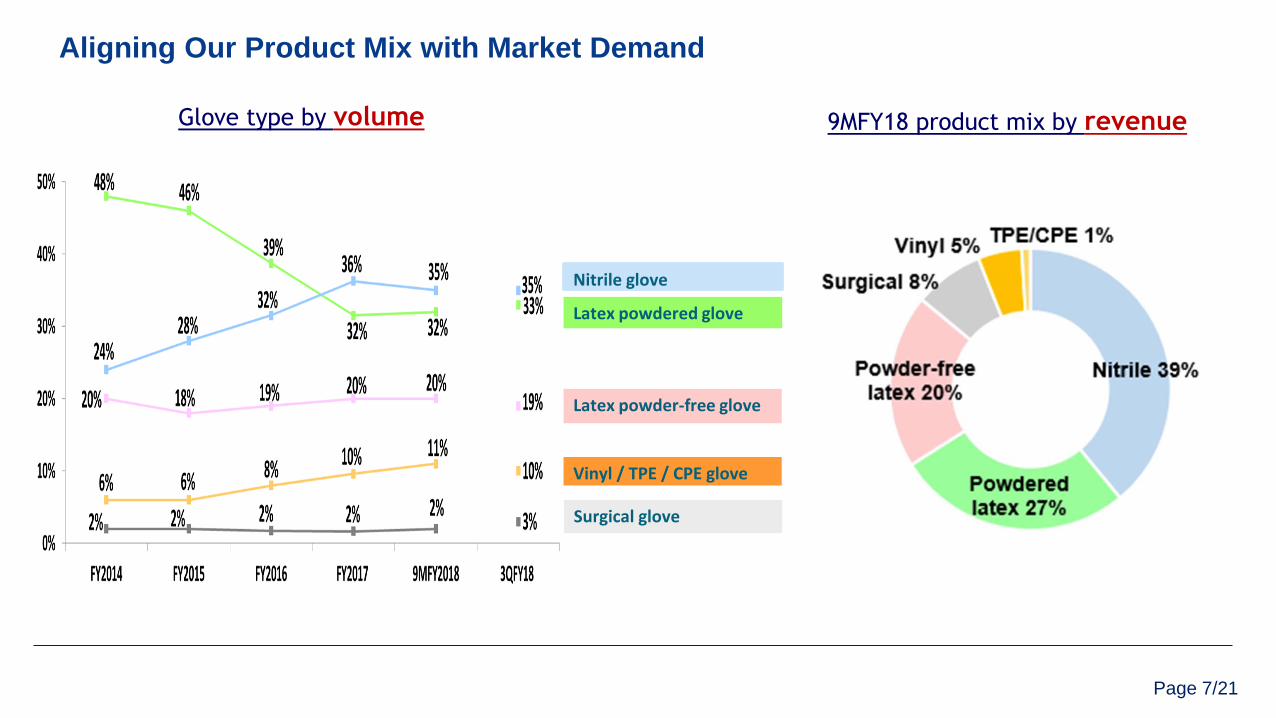
Page 7/21
9MFY18 product mix by revenue
Latex powdered glove
Nitrile glove
Vinyl / TPE / CPE glove
Surgical glove
Latex powder-free glove
Glove type by volume
Aligning Our Product Mix with Market Demand

Page 8/21
China
1 Glove Factory
Producing:
Vinyl gloves
Malaysia
Headquarters
28 Glove Factories
2 Chemical Factories
1 Glove Former
1 Packaging factory
1 Dental dam factory
1 Condom factory
Producing:
Latex & nitrile examination gloves
Surgical, household, cleanroom,
CPE/TPE gloves
Former & Chemical Manufacturing
Dental Dam
Condom
Thailand
2 Latex Plants
2 Glove Factories
Producing:
Latex examination gloves
Latex concentrate
Clear blueprint for further growth
Boosting nitrile capacity in tandem with growingdemand
Faster, more efficient and technologically advanced production lines
Increased automation throughout the manufacturing process
On-going facility optimisation initiatives which include the construction of highly-efficient factories
Continuous Growth in Manufacturing Capabilities
Manufacturing Country Glove typeNumber of
production linesCapacity
(pieces per annum)
Current:
Glove : 32 glove factories All 648 lines 60.5 bn
Expansion in progress : Glove
F32 1st Phase (Early 2019) Malaysia Nitrile 24 lines 2.4 bn
F32 2nd Phase (End 2019)
F33 New Block (March 2019)
F5A New Block (Oct 2019)
F8A New Factory (Early 2020)
Malaysia
Malaysia
Malaysia
Thailand
Nitrile
Nitrile
Nitrile
Nitrile/Latex
20 lines
12 lines
20 lines
32 lines
2.0 bn
1.2 bn
2.0 bn
3.2 bn
Total expansion 108 lines 10.8 bn
Total by 2020: 34 glove factories 756 lines 71.3 bn
Current:
F35CD Condom Factory Latex 1 line 0.1 bn
Latex Processing
Top Glove: 2 latex plants Sourcing majority of the latex requirements
Existing facilities
Page 9/21
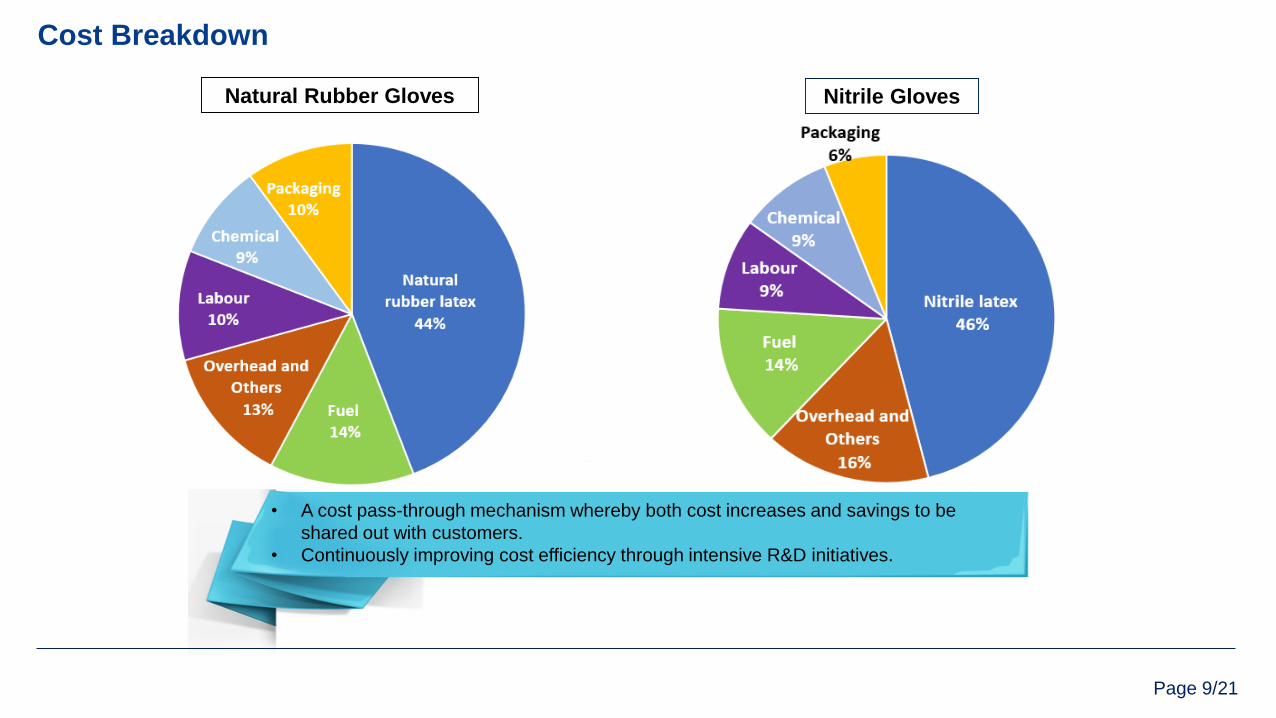
• A cost pass-through mechanism whereby both cost increases and savings to be
shared out with customers.
• Continuously improving cost efficiency through intensive R&D initiatives.
Natural Rubber Gloves Nitrile Gloves
Cost Breakdown
Page 10/21
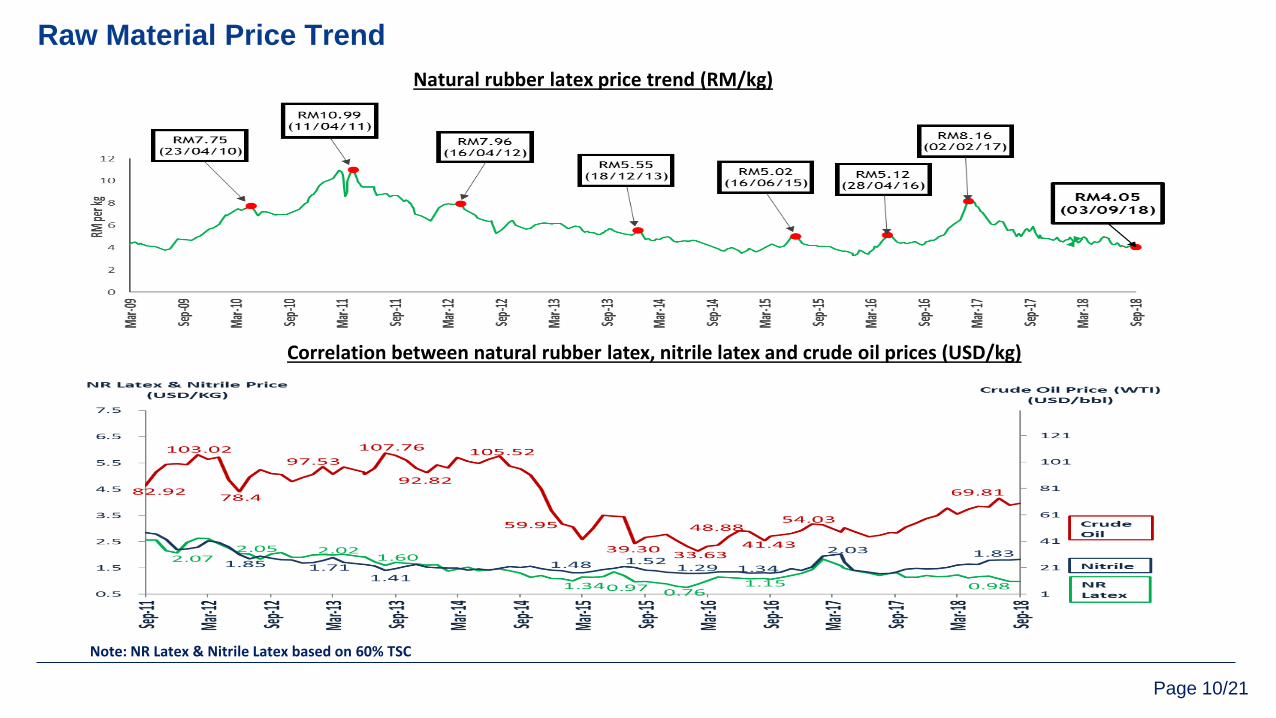
Note: NR Latex & Nitrile Latex based on 60% TSC
Natural rubber latex price trend (RM/kg)
Raw Material Price Trend
Correlation between natural rubber latex, nitrile latex and crude oil prices (USD/kg)
Page 11/21Page 11/21
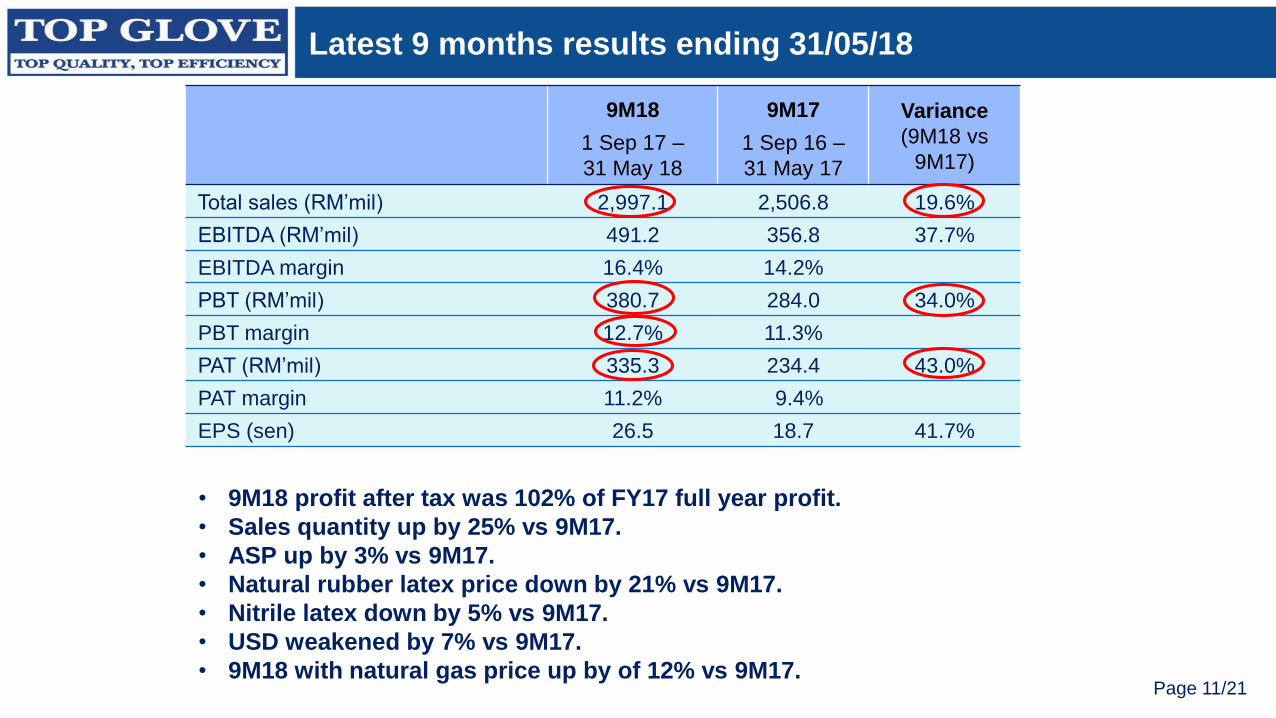
9M18
1 Sep 17 –
31 May 18
9M17
1 Sep 16 –
31 May 17
Variance
(9M18 vs
9M17)
Total sales (RM’mil) 2,997.1 2,506.8 19.6%
EBITDA (RM’mil) 491.2 356.8 37.7%
EBITDA margin 16.4% 14.2%
PBT (RM’mil) 380.7 284.0 34.0%
PBT margin 12.7% 11.3%
PAT (RM’mil) 335.3 234.4 43.0%
PAT margin 11.2% 9.4%
EPS (sen) 26.5 18.7 41.7%
Latest 9 months results ending 31/05/18
• 9M18 profit after tax was 102% of FY17 full year profit.
• Sales quantity up by 25% vs 9M17.
• ASP up by 3% vs 9M17.
• Natural rubber latex price down by 21% vs 9M17.
• Nitrile latex down by 5% vs 9M17.
• USD weakened by 7% vs 9M17.
• 9M18 with natural gas price up by of 12% vs 9M17.
Page 12/21
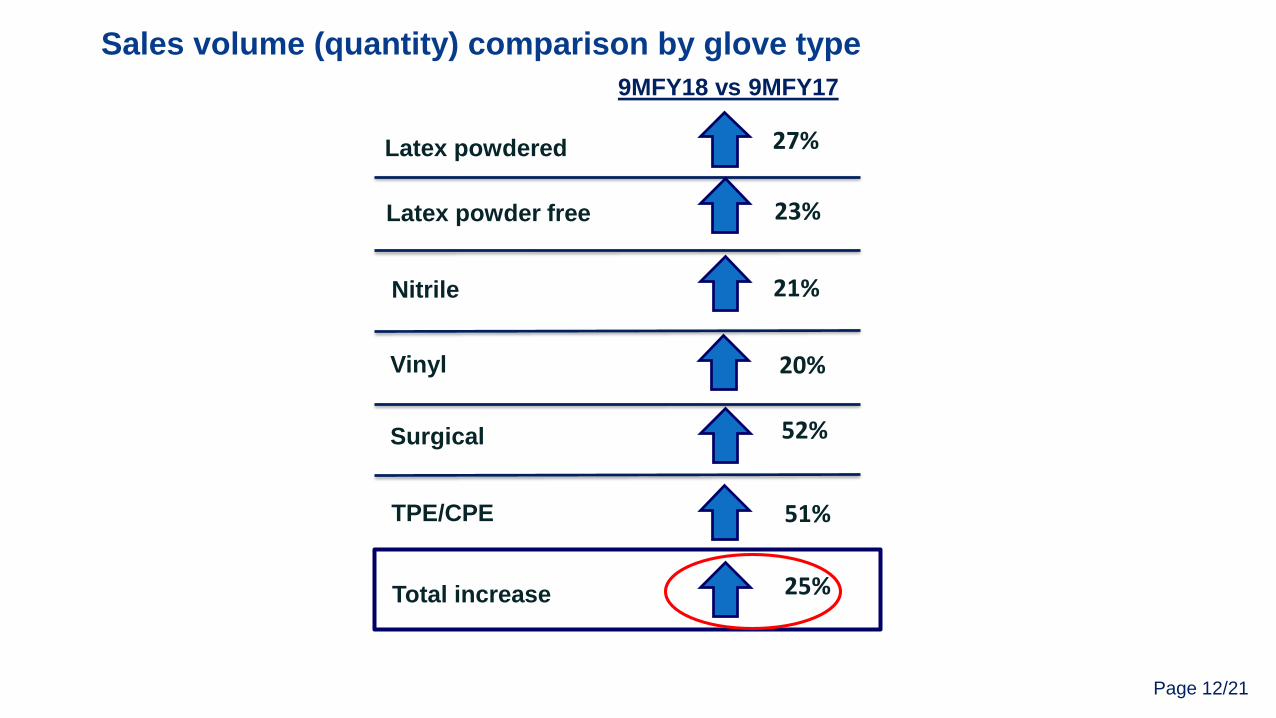
Sales volume (quantity) comparison by glove type
Latex powdered
Latex powder free
Nitrile
Surgical
Total increase
Vinyl
TPE/CPE
27%
23%
21%
52%
25%
9MFY18 vs 9MFY17
20%
51%
Page 13/21
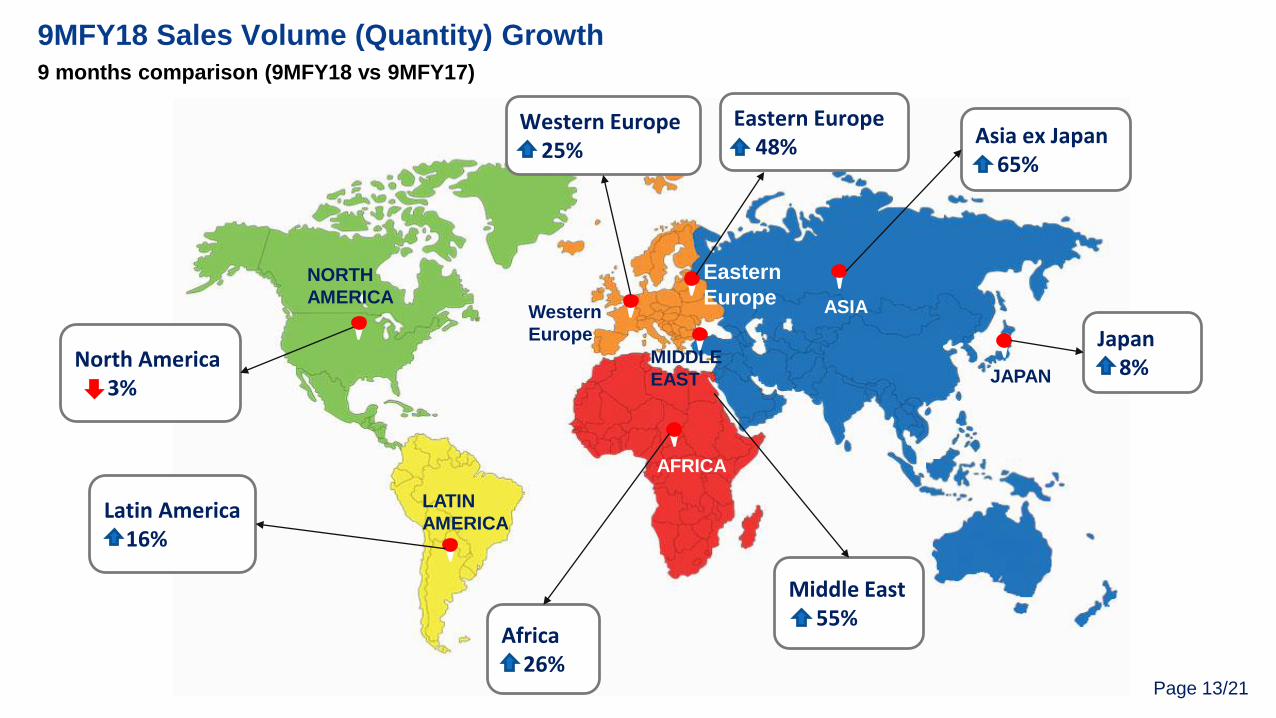
Middle East55%
North America 3%
Latin America16%
Africa26%
Western Europe25%
Eastern Europe48%
Japan8%
Asia ex Japan65%
NORTH
AMERICA
LATIN
AMERICA
AFRICA
MIDDLE
EAST
Western
Europe
Eastern
Europe ASIA
JAPAN
9MFY18 Sales Volume (Quantity) Growth
9 months comparison (9MFY18 vs 9MFY17)
Page 14/21Page 14/21
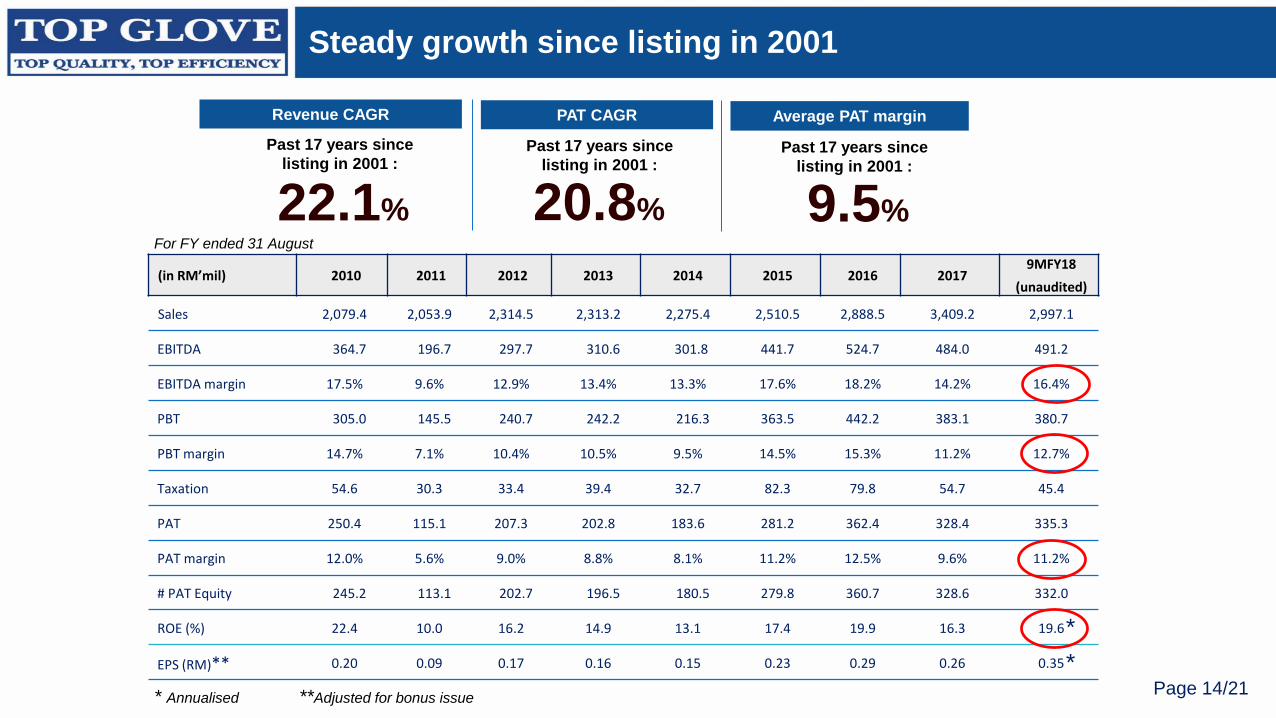
Steady growth since listing in 2001
(in RM’mil) 2010 2011 2012 2013 2014 2015 2016 20179MFY18
(unaudited)
Sales 2,079.4 2,053.9 2,314.5 2,313.2 2,275.4 2,510.5 2,888.5 3,409.2 2,997.1
EBITDA 364.7 196.7 297.7 310.6 301.8 441.7 524.7 484.0 491.2
EBITDA margin 17.5% 9.6% 12.9% 13.4% 13.3% 17.6% 18.2% 14.2% 16.4%
PBT 305.0 145.5 240.7 242.2 216.3 363.5 442.2 383.1 380.7
PBT margin 14.7% 7.1% 10.4% 10.5% 9.5% 14.5% 15.3% 11.2% 12.7%
Taxation 54.6 30.3 33.4 39.4 32.7 82.3 79.8 54.7 45.4
PAT 250.4 115.1 207.3 202.8 183.6 281.2 362.4 328.4 335.3
PAT margin 12.0% 5.6% 9.0% 8.8% 8.1% 11.2% 12.5% 9.6% 11.2%
# PAT Equity 245.2 113.1 202.7 196.5 180.5 279.8 360.7 328.6 332.0
ROE (%) 22.4 10.0 16.2 14.9 13.1 17.4 19.9 16.3 19.6
EPS (RM)** 0.20 0.09 0.17 0.16 0.15 0.23 0.29 0.26 0.35
Average PAT marginRevenue CAGR PAT CAGR
20.8%22.1% 9.5%For FY ended 31 August
Past 17 years since
listing in 2001 :Past 17 years since
listing in 2001 :Past 17 years since
listing in 2001 :
* Annualised **Adjusted for bonus issue
*
*
Page 15/21Page 15/21
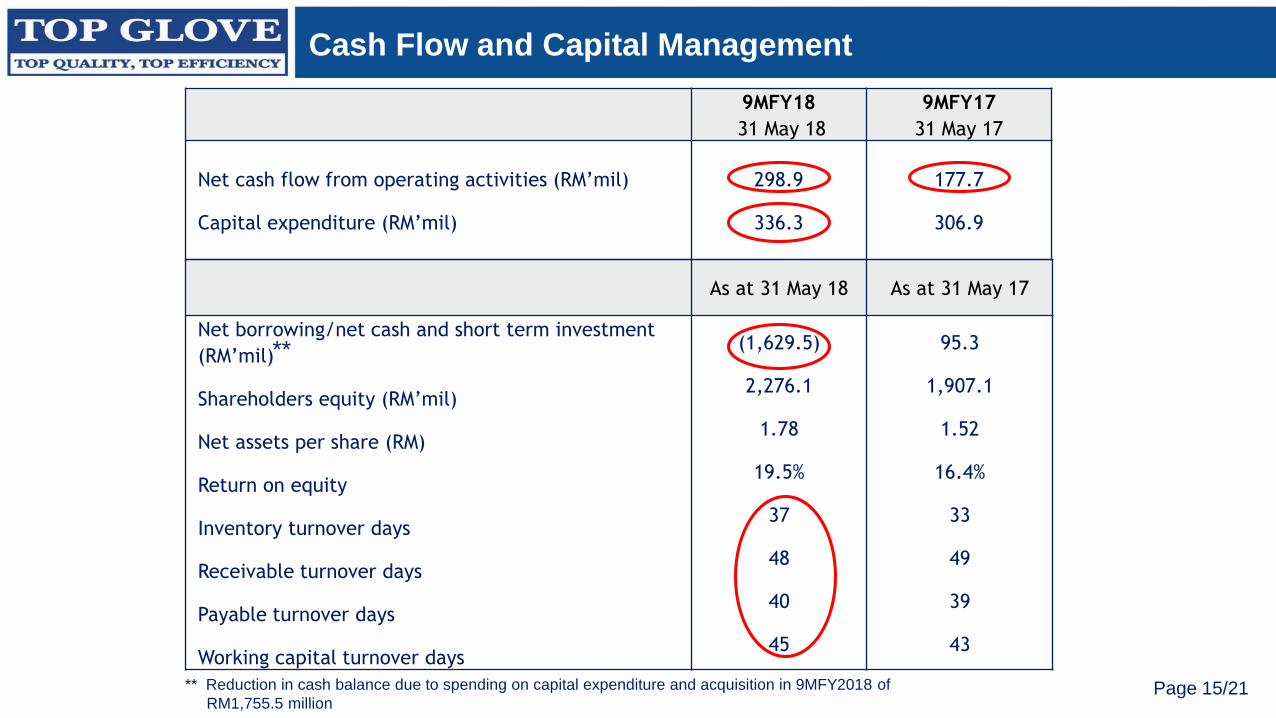
Cash Flow and Capital Management
As at 31 May 18 As at 31 May 17
Net borrowing/net cash and short term investment
(RM’mil)
Shareholders equity (RM’mil)
Net assets per share (RM)
Return on equity
Inventory turnover days
Receivable turnover days
Payable turnover days
Working capital turnover days
(1,629.5)
2,276.1
1.78
19.5%
37
48
40
45
95.3
1,907.1
1.52
16.4%
33
49
39
43
9MFY18
31 May 18
9MFY17
31 May 17
Net cash flow from operating activities (RM’mil)
Capital expenditure (RM’mil)
298.9
336.3
177.7
306.9
** Reduction in cash balance due to spending on capital expenditure and acquisition in 9MFY2018 of
RM1,755.5 million
**
Page 16/21Page 16/21
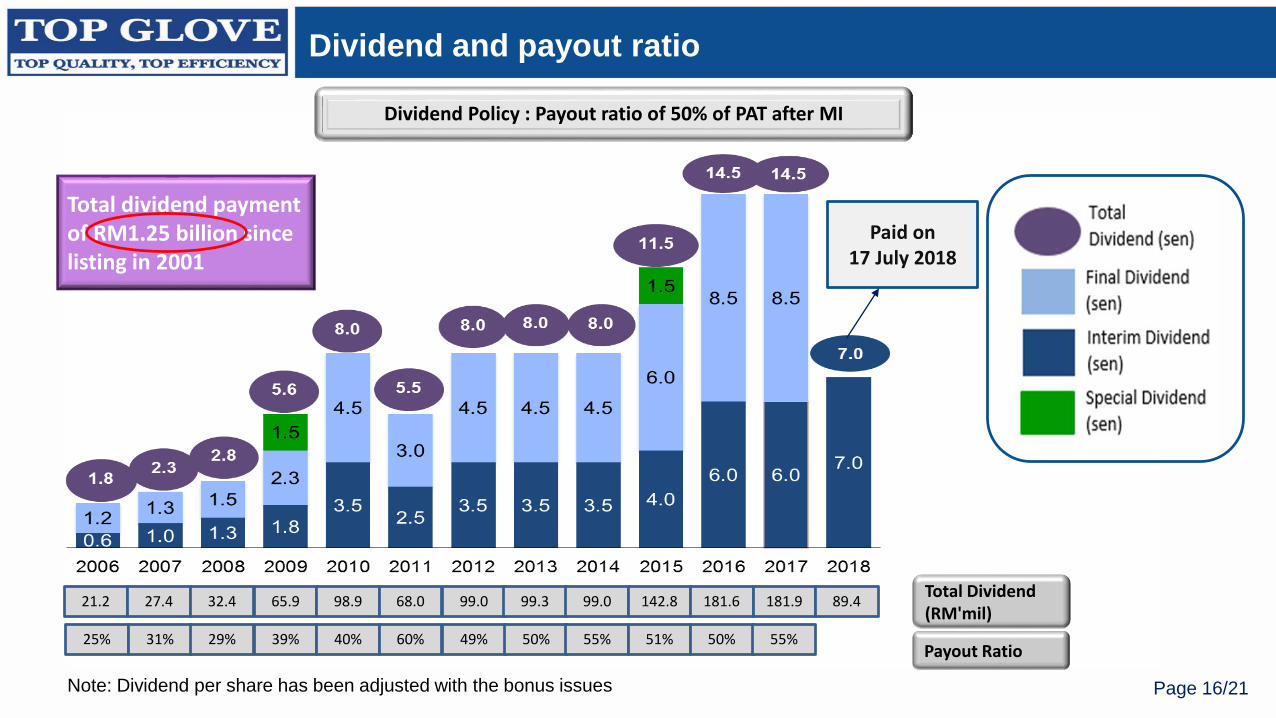
Dividend and payout ratio
Dividend Policy : Payout ratio of 50% of PAT after MI
Note: Dividend per share has been adjusted with the bonus issues
Total dividend payment of RM1.25 billion since listing in 2001
Payout Ratio
Total Dividend (RM'mil)
21.2 27.4 32.4 65.9 98.9 68.0 99.0 99.3 99.0 142.8 181.6
25% 31% 29% 39% 40% 60% 49% 50% 55% 51% 50%
181.9
55%
89.4
Paid on 17 July 2018
Page 17/21
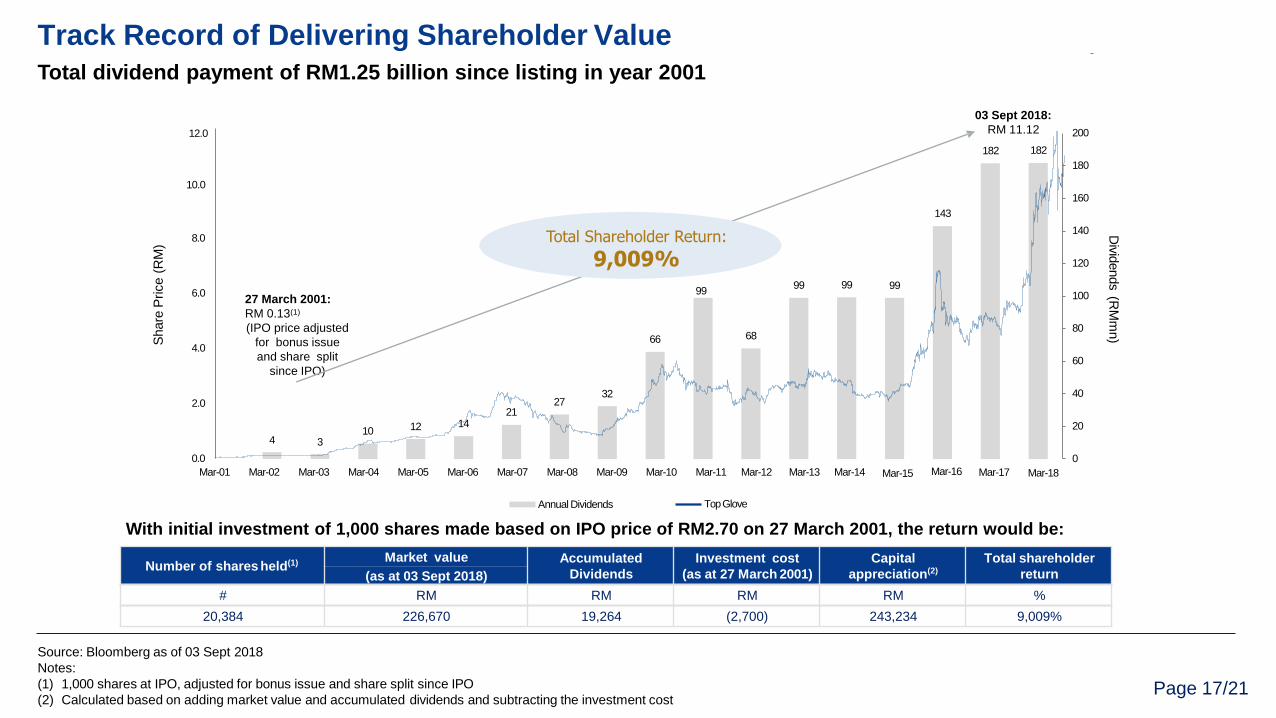
4 310 12 14
2127
32
66 68
99 99 99
143
182 182
0
20
40
60
80
100
120
140
160
180
200
0.0
2.0
4.0
6.0
8.0
10.0
Mar-01 Mar-02 Mar-03 Mar-04 Mar-05 Mar-06 Mar-07 Mar-10 Mar-11 Mar-12 Mar-13 Mar-14 Mar-15 Mar-16 Mar-17 Mar-18Mar-08 Mar-09
Annual Dividends TopGlove
03 Sept 2018:
RM 11.12
27 March 2001:
RM 0.13(1)
(IPO price adjusted
for bonus issue
and share split
since IPO)
Share
Price
(RM
)
Total Shareholder Return:
9,009%
Number of shares held(1) Market value Accumulated
Dividends
Investment cost
(as at 27 March 2001)
Capital
appreciation(2)
Total shareholder
return(as at 03 Sept 2018)
# RM RM RM RM %
20,384 226,670 19,264 (2,700) 243,234 9,009%
With initial investment of 1,000 shares made based on IPO price of RM2.70 on 27 March 2001, the return would be:
Div
idends
(RM
mn)
Source: Bloomberg as of 03 Sept 2018
Notes:
(1) 1,000 shares at IPO, adjusted for bonus issue and share split since IPO
(2) Calculated based on adding market value and accumulated dividends and subtracting the investment cost
Track Record of Delivering Shareholder Value
Total dividend payment of RM1.25 billion since listing in year 2001
12.0
99
Page 18/21Page 18/21
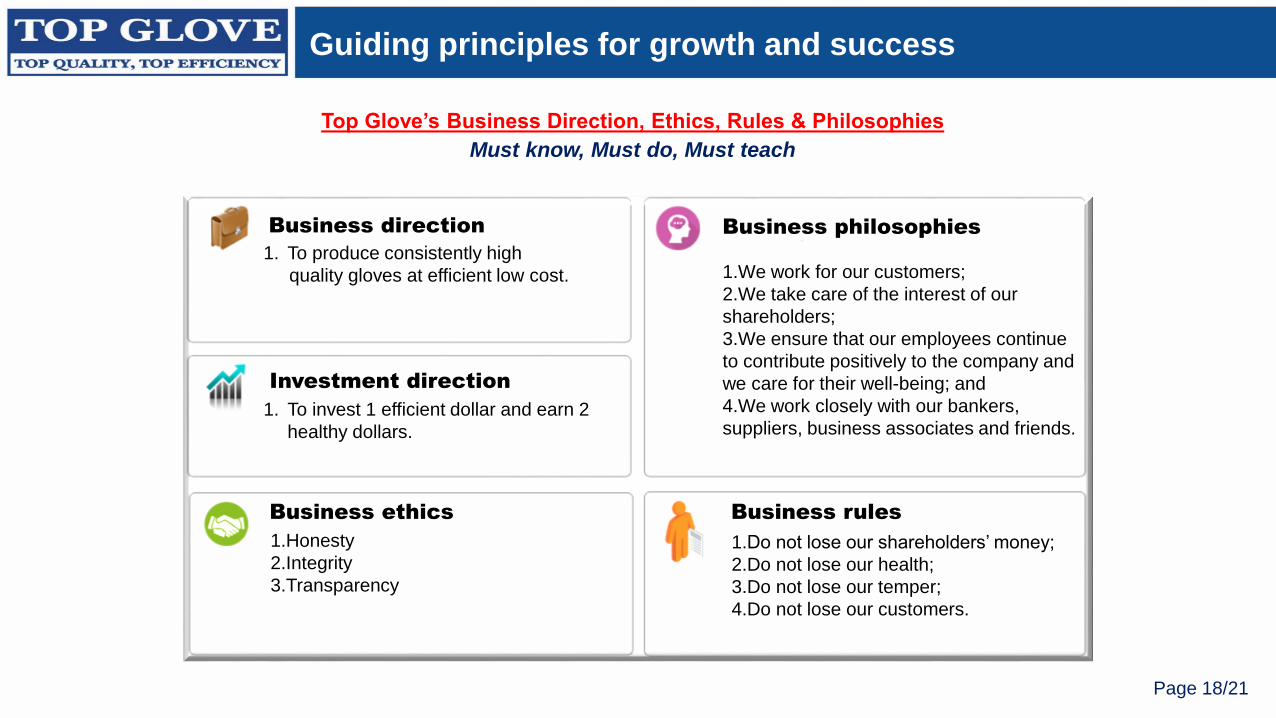
Must know, Must do, Must teach
Top Glove’s Business Direction, Ethics, Rules & Philosophies
1. To produce consistently high
quality gloves at efficient low cost.
1.Do not lose our shareholders’ money;
2.Do not lose our health;
3.Do not lose our temper;
4.Do not lose our customers.
1.We work for our customers;
2.We take care of the interest of our
shareholders;
3.We ensure that our employees continue
to contribute positively to the company and
we care for their well-being; and
4.We work closely with our bankers,
suppliers, business associates and friends.
1.Honesty
2.Integrity
3.Transparency
Business rules
Business direction Business philosophies
Business ethics
Investment direction
Guiding principles for growth and success
1. To invest 1 efficient dollar and earn 2
healthy dollars.
Page 19/21
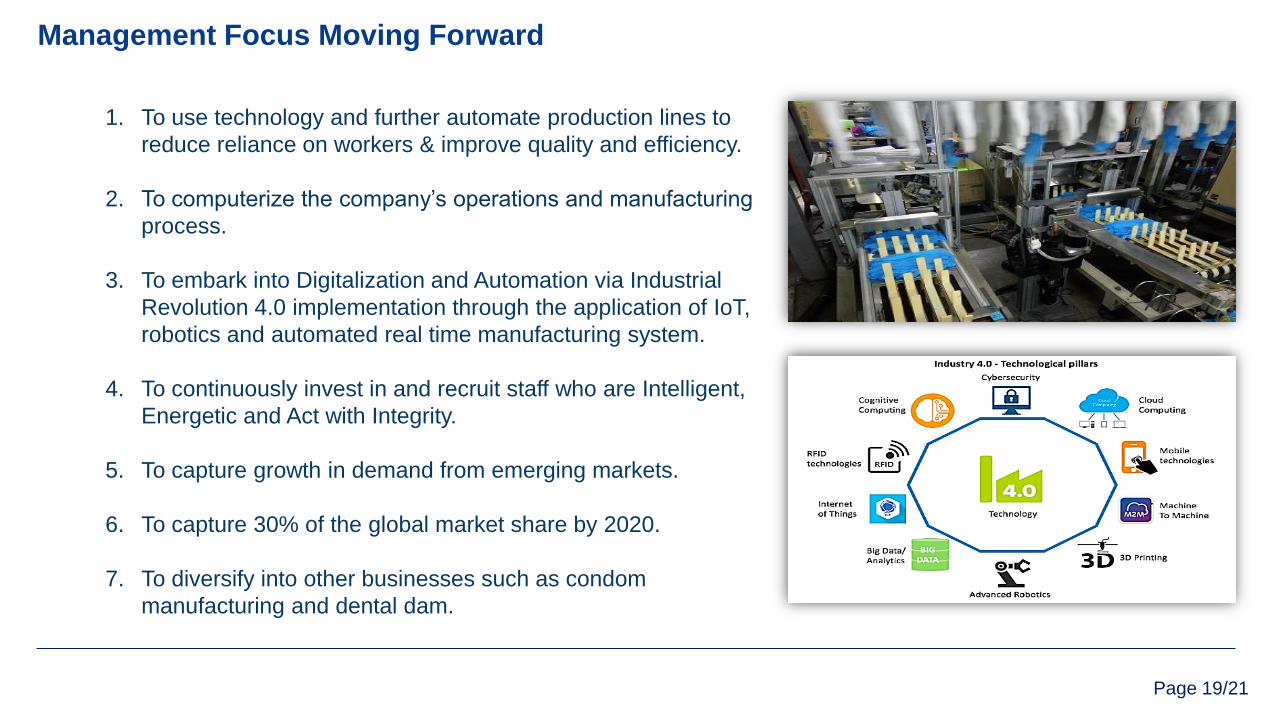
Management Focus Moving Forward
1. To use technology and further automate production lines to
reduce reliance on workers & improve quality and efficiency.
2. To computerize the company’s operations and manufacturing
process.
3. To embark into Digitalization and Automation via Industrial
Revolution 4.0 implementation through the application of IoT,
robotics and automated real time manufacturing system.
4. To continuously invest in and recruit staff who are Intelligent,
Energetic and Act with Integrity.
5. To capture growth in demand from emerging markets.
6. To capture 30% of the global market share by 2020.
7. To diversify into other businesses such as condom
manufacturing and dental dam.
Page 21/21
Ready, 1 2 3
TOP GLOVE
Claps, 2X 3X 2X
YES! YES! YES!
Top Quality
TOP GLOVE GROUP OF COMPANIES
Prepared by : QA Admin (Rev. 6, Date Prepared : 14/7/17)
Verified by : Ms. Loo Sun Nooi / QA DGM
Top Quality
Top Quality