Embed Size (px)
DESCRIPTION
Read a sample and get insight into the leading Australian companies on the sharemarket
Citation preview
Top Stocks 2015 iii
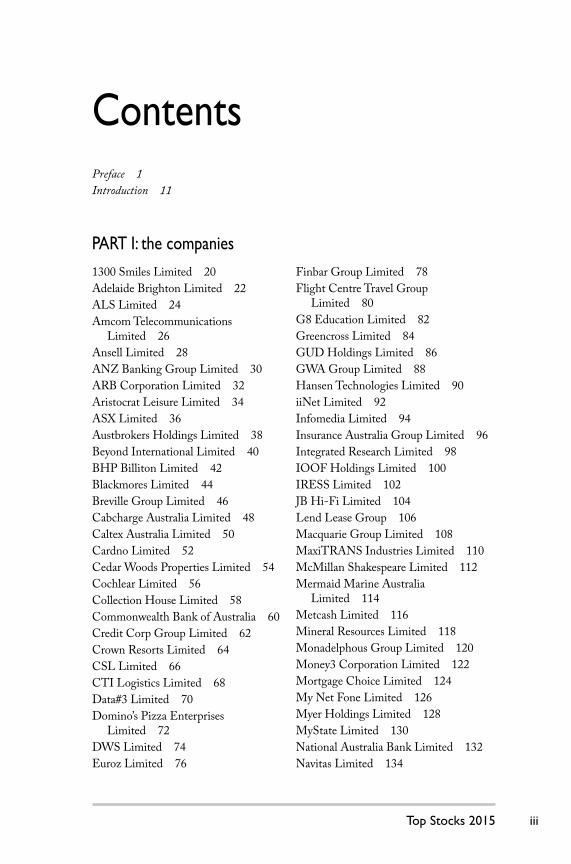
Contents
1300 Smiles Limited 20
Adelaide Brighton Limited 22
ALS Limited 24
Amcom Telecommunications Limited 26
Ansell Limited 28
ANZ Banking Group Limited 30
ARB Corporation Limited 32
Aristocrat Leisure Limited 34
ASX Limited 36
Austbrokers Holdings Limited 38
Beyond International Limited 40
BHP Billiton Limited 42
Blackmores Limited 44
Breville Group Limited 46
Cabcharge Australia Limited 48
Caltex Australia Limited 50
Cardno Limited 52
Cedar Woods Properties Limited 54
Cochlear Limited 56
Collection House Limited 58
Commonwealth Bank of Australia 60
Credit Corp Group Limited 62
Crown Resorts Limited 64
CSL Limited 66
CTI Logistics Limited 68
Data#3 Limited 70
Domino’s Pizza Enterprises Limited 72
DWS Limited 74
Euroz Limited 76
Finbar Group Limited 78
Flight Centre Travel Group Limited 80
G8 Education Limited 82
Greencross Limited 84
GUD Holdings Limited 86
GWA Group Limited 88
Hansen Technologies Limited 90
iiNet Limited 92
Infomedia Limited 94
Insurance Australia Group Limited 96
Integrated Research Limited 98
IOOF Holdings Limited 100
IRESS Limited 102
JB Hi-Fi Limited 104
Lend Lease Group 106
Macquarie Group Limited 108
MaxiTRANS Industries Limited 110
McMillan Shakespeare Limited 112
Mermaid Marine Australia Limited 114
Metcash Limited 116
Mineral Resources Limited 118
Monadelphous Group Limited 120
Money3 Corporation Limited 122
Mortgage Choice Limited 124
My Net Fone Limited 126
Myer Holdings Limited 128
MyState Limited 130
National Australia Bank Limited 132
Navitas Limited 134
Preface 1
Introduction 11
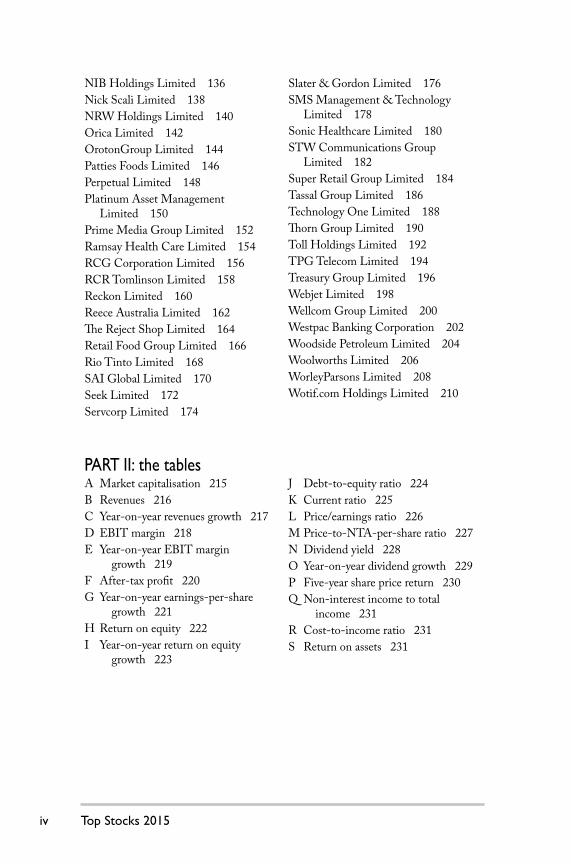
PART I: the companies
Top Stocks 2015 BOOK.indb iiiTop Stocks 2015 BOOK.indb iii 30/09/14 4:30 PM30/09/14 4:30 PM
Top Stocks 2015iv
NIB Holdings Limited 136
Nick Scali Limited 138
NRW Holdings Limited 140
Orica Limited 142
OrotonGroup Limited 144
Patties Foods Limited 146
Perpetual Limited 148
Platinum Asset Management Limited 150
Prime Media Group Limited 152
Ramsay Health Care Limited 154
RCG Corporation Limited 156
RCR Tomlinson Limited 158
Reckon Limited 160
Reece Australia Limited 162
Th e Reject Shop Limited 164
Retail Food Group Limited 166
Rio Tinto Limited 168
SAI Global Limited 170
Seek Limited 172
Servcorp Limited 174
Slater & Gordon Limited 176
SMS Management & Technology Limited 178
Sonic Healthcare Limited 180
STW Communications Group Limited 182
Super Retail Group Limited 184
Tassal Group Limited 186
Technology One Limited 188
Th orn Group Limited 190
Toll Holdings Limited 192
TPG Telecom Limited 194
Treasury Group Limited 196
Webjet Limited 198
Wellcom Group Limited 200
Westpac Banking Corporation 202
Woodside Petroleum Limited 204
Woolworths Limited 206
WorleyParsons Limited 208
Wotif.com Holdings Limited 210
PART II: the tablesA Market capitalisation 215
B Revenues 216
C Year-on-year revenues growth 217
D EBIT margin 218
E Year-on-year EBIT margin growth 219
F After-tax profi t 220
G Year-on-year earnings-per-share growth 221
H Return on equity 222
I Year-on-year return on equity growth 223
J Debt-to-equity ratio 224
K Current ratio 225
L Price/earnings ratio 226
M Price-to-NTA-per-share ratio 227
N Dividend yield 228
O Year-on-year dividend growth 229
P Five-year share price return 230
Q Non-interest income to total income 231
R Cost-to-income ratio 231
S Return on assets 231
Top Stocks 2015 BOOK.indb ivTop Stocks 2015 BOOK.indb iv 30/09/14 4:30 PM30/09/14 4:30 PM

Top Stocks 2015 1
It was the best of times, it was the worst of times.
Th e famous opening words of A Tale of Two Cities sum up the frustrations
of many investors. Th e local sharemarket has had a dazzling run, with the
benchmark S&P/ASX 200 index up around 40 per cent between June 2012
and September 2014. As a result, large numbers of stocks look to be very
expensive. It has become hard for sharebuyers to fi nd companies that appear
to off er value. Yet, as I write this, markets keep rising.
In the words of Max Mason, writing in the Australian Financial Review in
August 2014:
Finding value in the Australian sharemarket is becoming
increasingly like walking a wild path in the Amazon jungle with
a machete — there’s a lot to cut through to fi nd El Dorado. Th e
Spanish conquistadors may never have found the city of gold but
there is still a glimmer of hope for local investors — if they look
hard enough.
Th is is the 21st edition of Top Stocks, and guiding investors towards value
stocks has been one of the paramount aims of the book from the very fi rst
edition. Indeed, one of the rationales for the book has always been to highlight
the truth that Australia boasts many excellent companies that enjoy high
profi ts — and growing profi ts — regardless of the direction of the markets.
Despite the title, Top Stocks is actually a book about companies.
So right from the start it has been an attempt to help investors fi nd the best
public companies in Australia, using strict criteria.
Preface
Top Stocks 2015 BOOK.indb 1Top Stocks 2015 BOOK.indb 1 30/09/14 4:30 PM30/09/14 4:30 PM
Top Stocks 20152
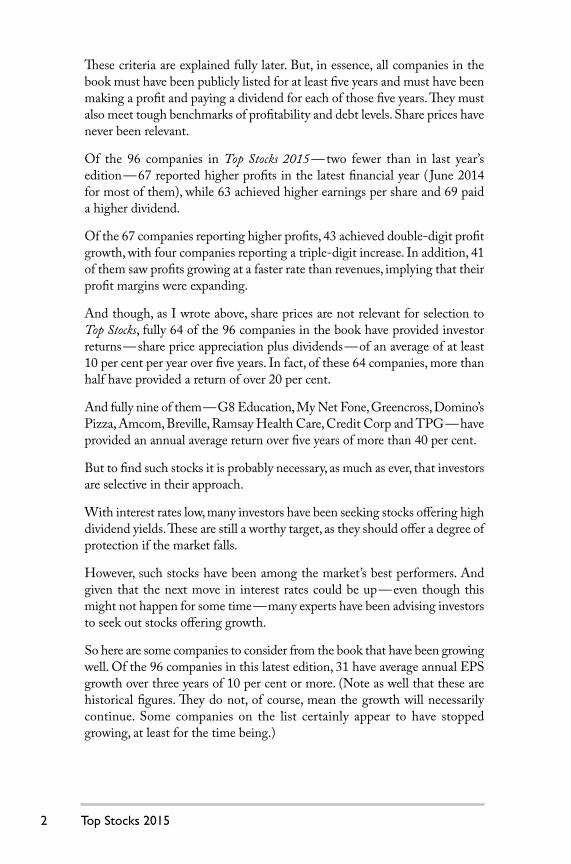
Th ese criteria are explained fully later. But, in essence, all companies in the
book must have been publicly listed for at least fi ve years and must have been
making a profi t and paying a dividend for each of those fi ve years. Th ey must
also meet tough benchmarks of profi tability and debt levels. Share prices have
never been relevant.
Of the 96 companies in Top Stocks 2015 — two fewer than in last year’s
edition — 67 reported higher profi ts in the latest fi nancial year ( June 2014
for most of them), while 63 achieved higher earnings per share and 69 paid
a higher dividend.
Of the 67 companies reporting higher profi ts, 43 achieved double-digit profi t
growth, with four companies reporting a triple-digit increase. In addition, 41
of them saw profi ts growing at a faster rate than revenues, implying that their
profi t margins were expanding.
And though, as I wrote above, share prices are not relevant for selection to
Top Stocks, fully 64 of the 96 companies in the book have provided investor
returns — share price appreciation plus dividends — of an average of at least
10 per cent per year over fi ve years. In fact, of these 64 companies, more than
half have provided a return of over 20 per cent.
And fully nine of them — G8 Education, My Net Fone, Greencross, Domino’s
Pizza, Amcom, Breville, Ramsay Health Care, Credit Corp and TPG — have
provided an annual average return over fi ve years of more than 40 per cent.
But to fi nd such stocks it is probably necessary, as much as ever, that investors
are selective in their approach.
With interest rates low, many investors have been seeking stocks off ering high
dividend yields. Th ese are still a worthy target, as they should off er a degree of
protection if the market falls.
However, such stocks have been among the market’s best performers. And
given that the next move in interest rates could be up — even though this
might not happen for some time — many experts have been advising investors
to seek out stocks off ering growth.
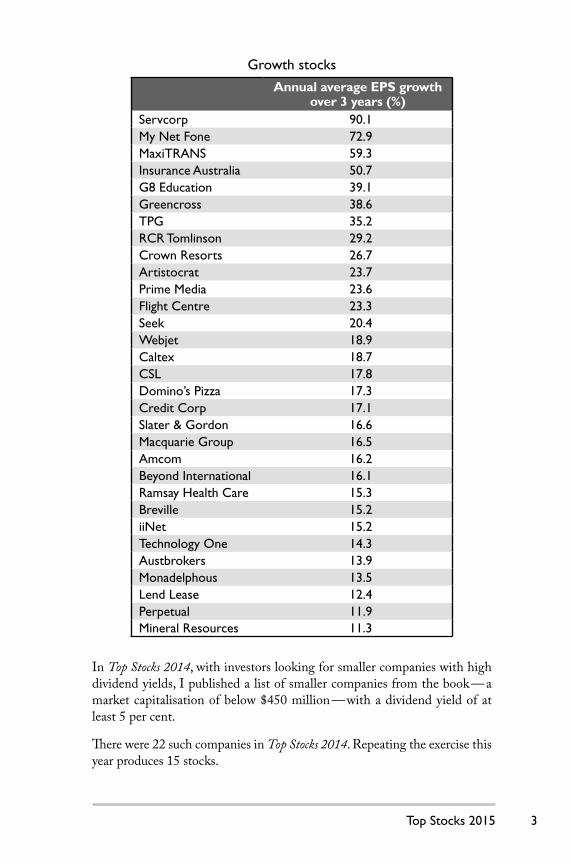
So here are some companies to consider from the book that have been growing
well. Of the 96 companies in this latest edition, 31 have average annual EPS
growth over three years of 10 per cent or more. (Note as well that these are
historical fi gures. Th ey do not, of course, mean the growth will necessarily
continue. Some companies on the list certainly appear to have stopped
growing, at least for the time being.)
Top Stocks 2015 BOOK.indb 2Top Stocks 2015 BOOK.indb 2 30/09/14 4:30 PM30/09/14 4:30 PM
Top Stocks 2015 3
Growth stocks
Annual average EPS growth over 3 years (%)
Servcorp 90.1
My Net Fone 72.9
MaxiTRANS 59.3
Insurance Australia 50.7
G8 Education 39.1
Greencross 38.6
TPG 35.2
RCR Tomlinson 29.2
Crown Resorts 26.7
Artistocrat 23.7
Prime Media 23.6
Flight Centre 23.3
Seek 20.4
Webjet 18.9
Caltex 18.7
CSL 17.8
Domino’s Pizza 17.3
Credit Corp 17.1
Slater & Gordon 16.6
Macquarie Group 16.5
Amcom 16.2
Beyond International 16.1
Ramsay Health Care 15.3
Breville 15.2
iiNet 15.2
Technology One 14.3
Austbrokers 13.9
Monadelphous 13.5
Lend Lease 12.4
Perpetual 11.9
Mineral Resources 11.3
In Top Stocks 2014, with investors looking for smaller companies with high
dividend yields, I published a list of smaller companies from the book — a
market capitalisation of below $450 million — with a dividend yield of at
least 5 per cent.
Th ere were 22 such companies in Top Stocks 2014. Repeating the exercise this
year produces 15 stocks.
Top Stocks 2015 BOOK.indb 3Top Stocks 2015 BOOK.indb 3 30/09/14 4:30 PM30/09/14 4:30 PM
Top Stocks 20154
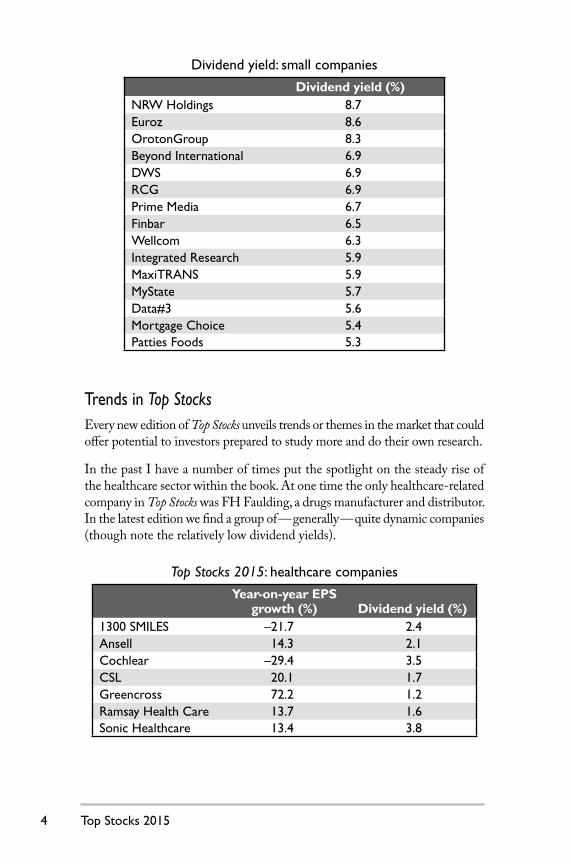
Dividend yield: small companies
Dividend yield (%)NRW Holdings 8.7
Euroz 8.6
OrotonGroup 8.3
Beyond International 6.9
DWS 6.9
RCG 6.9
Prime Media 6.7
Finbar 6.5
Wellcom 6.3
Integrated Research 5.9
MaxiTRANS 5.9
MyState 5.7
Data#3 5.6
Mortgage Choice 5.4
Patties Foods 5.3
Trends in Top StocksEvery new edition of Top Stocks unveils trends or themes in the market that could
off er potential to investors prepared to study more and do their own research.
In the past I have a number of times put the spotlight on the steady rise of
the healthcare sector within the book. At one time the only healthcare-related
company in Top Stocks was FH Faulding, a drugs manufacturer and distributor.
In the latest edition we fi nd a group of — generally — quite dynamic companies
(though note the relatively low dividend yields).
Top Stocks 2015: healthcare companies
Year-on-year EPS growth (%) Dividend yield (%)
1300 SMILES –21.7 2.4
Ansell 14.3 2.1
Cochlear –29.4 3.5
CSL 20.1 1.7
Greencross 72.2 1.2
Ramsay Health Care 13.7 1.6
Sonic Healthcare 13.4 3.8
Top Stocks 2015 BOOK.indb 4Top Stocks 2015 BOOK.indb 4 30/09/14 4:30 PM30/09/14 4:30 PM

Top Stocks 2015 5
Something similar has been happening with high-tech stocks. Th ere was a time
when the only technology-related company in the book was Computershare.
In the latest edition are no fewer than 13 high-tech (from the Information
Technology and Telecommunication Services sectors) stocks.
Top Stocks 2015: high-tech companies
Year-on-year EPS growth (%) Dividend yield (%)
Amcom 7.3 3.1
Data#3 –38.0 5.6
DWS –23.5 6.9
Hansen Technologies 60.5 4.2
iiNet 3.4 2.9
Infomedia 21.3 3.5
Integrated Research –6.8 5.3
IRESS –43.6 3.7
My Net Fone 32.6 1.5
Reckon 4.0 4.2
SMS –41.0 3.1
Technology One 13.9 1.7
TPG Telecom 63.3 1.2
Th e growth in local companies off ering education services is an interesting
development. Australia has a well-developed private education sector
attracting thousands of foreign students. Some of the companies are using
skills developed in Australia to expand into overseas markets.
Western Australian company Navitas is a leader in this business. Recruitment
services specialist Seek is also active. New to the latest edition of the book is
childcare provider G8 Education.
Another trend that certainly becomes evident in the new Top Stocks is
companies that appear to be achieving success in new moves expanding
overseas.
Investors have on occasion been sceptical about Australian companies taking
a big plunge into overseas markets, believing that such moves will invariably
fail. Th ese doubts have sometimes proven correct. Some local corporations,
successful at home, have done poorly abroad. But others have performed very
well. Examples include Cochlear and CSL.
Top Stocks 2015 BOOK.indb 5Top Stocks 2015 BOOK.indb 5 30/09/14 4:30 PM30/09/14 4:30 PM
Top Stocks 20156
Here are some companies from Top Stocks 2015 that are making interesting
moves abroad. Note that, among their other attractions, they are generally
benefi ciaries of a weaker Australian dollar:
• Domino’s Pizza Enterprises has been active in France, Belgium and
the Netherlands, and has now expanded to Japan, where it has an
ambitious growth strategy.
• Ramsay Health Care, Australia’s largest operator of private hospitals,
is also active in the UK and is in the process of becoming the leader in
private hospitals in France.
• Seek is realising some excellent growth from its moves into job seeker
markets in Asia and Latin America.
• Slater & Gordon, a law fi rm, is quite aggressively moving into
the British market, acquiring practices there and achieving some
excellent growth.
• Treasury Group, a successful local funds management specialist, plans
to merge with an American asset management business to create a
new global business.
An interesting fi nal trend is the rise of what I dub Th e Consolidators, companies
that are achieving growth — sometimes quite exceptional growth — by uniting
a fragmented industry.
An early example is Sonic Healthcare, which has been buying up pathology
clinics — in Australia and abroad — and, to a lesser extent, doctors’ practices,
and joining them together in a large group. Th is delivers numerous benefi ts
from generating all kinds of economies of scale.
Another example is Austbrokers, which has been buying stakes of at least
50 per cent in insurance brokers around Australia, and then having them
continue operating with the original owners. Th is has allowed the businesses
to preserve their local identity and management, while benefi ting from the
support of a large group. Austbrokers is able to help its members develop their
businesses through growth initiatives, including the addition of new products,
and sometimes through appropriate bolt-on acquisitions.
Other examples from the book are 1300 SMILES (dentistry practices), G8
Education (childcare centres), Greencross (veterinary clinics) and Slater &
Gordon (legal practices).
Who Is Top Stocks written for?
Top Stocks is written for all those investors wishing to exercise a degree of
control over their portfolios. It is for those just starting out as well as for
Top Stocks 2015 BOOK.indb 6Top Stocks 2015 BOOK.indb 6 30/09/14 4:30 PM30/09/14 4:30 PM
Top Stocks 2015 7
those with plenty of experience but who still feel the need for some guidance
through the thickets of around 2200 listed stocks.
It is not a how-to book. It does not give step-by-step instructions to ‘winning’
in the stock market. Rather, it is an independent and objective evaluation of
leading companies, based on rigid criteria, with the intention of yielding a large
selection of stocks that can become the starting point for investors wishing
to do their own research.
A large amount of information is presented on each company, and another
key feature of the book is that the data is presented in a common format, to
allow readers to make easy comparisons between companies.
It is necessarily a conservative book. All stocks must have been listed for
fi ve years even to be considered for inclusion. It is especially suited for those
seeking out value stocks for longer term investment.
Yet, perhaps ironically, the book is also being used by short-term traders
seeking a goodly selection of fi nancially sound and reliable companies whose
shares they can trade.
In addition, there are many regular readers who buy the book each year, and
to them in particular I express my thanks.
What are the entry criteria?
Th e criteria for inclusion in Top Stocks are strict:
• All companies must be included in the All Ordinaries index, which
comprises Australia’s 500 largest stocks (out of around 2200).
Th e reason for excluding smaller companies is that there is often
little investor information available on many of them and some are so
thinly traded as to be almost illiquid. In fact, the 500 All Ordinaries
companies comprise, by market capitalisation, more than 95 per cent
of the entire market.
• It is necessary that all companies be publicly listed since at least
the end of 2009, and have a fi ve-year record of profi ts and dividend
payouts each year.
• All companies are required to post a return-on-equity ratio of at least
10 per cent in their latest fi nancial year.
• No company should have a debt-to-equity ratio of more than 70 per cent.
• It must be stressed that share price performance is not one of the
criteria for inclusion in this book. Th e purpose is to select companies
with good profi ts and a strong balance sheet. Th ese may not off er the
Top Stocks 2015 BOOK.indb 7Top Stocks 2015 BOOK.indb 7 30/09/14 4:30 PM30/09/14 4:30 PM

Top Stocks 20158
spectacular share-price returns of a biotech start-up or a promising
gold miner, but they should also present far less risk.
• Th ere are several notable exclusions. Listed managed investments — as
defi ned by the ASX — are out, as these mainly buy other shares or
investments. Examples are Australian Foundation Investment
Company and all the property trusts.
• A further exclusion are the foreign stocks listed on the ASX. Th ere
is sometimes a lack of information available about such companies.
In addition, their stock prices tend to move on events and trends in
their home countries, making it diffi cult at times for local investors to
follow them.
It is surely a tribute to the strength and resilience of Australian corporations
that, despite the volatility of the past few years, so many companies have
qualifi ed for the book.
Changes to this edition
A total of 18 companies from Top Stocks 2014 have been omitted from this
new edition.
Th ree companies were acquired during the year and delisted:
• Country Road
• David Jones
• SFG Australia.
One, Hunter Hall International, is no longer in the All Ordinaries index,
a requirement for inclusion in the book. Another, Forge Group, went into
receivership.
Th e remaining 13 excluded companies — fi ve of them mining support companies
— had return-on-equity fi gures that fell below the required 10 per cent:
• Ausdrill
• Austin Engineering
• Bentham IMF (formerly IMF
Australia)
• Bradken
• Cash Converters
• Codan
• Equity Trustees
• Fantastic Holdings
• Gazal
• Incitec Pivot
• Lycopodium
• Melbourne IT
• Sedgman.
Top Stocks 2015 BOOK.indb 8Top Stocks 2015 BOOK.indb 8 30/09/14 4:30 PM30/09/14 4:30 PM

Top Stocks 2015 9
There are 16 new companies in this book (although six of them have
appeared in earlier editions of the book, but were not in Top Stocks 2014).
Th e companies are:
• Beyond International*
• Collection House*
• CTI Logistics*
• Euroz
• G8 Education*
• GWA
• IOOF Holdings
• Macquarie Group
• Money3*
• My Net Fone*
• Myer*
• MyState*
• National Australia Bank
• Orica
• Prime Media*
• TPG Telecom*.
* Companies that have not appeared in any previous edition of Top Stocks.
Companies in every edition of Top StocksTh is is the 21st edition of Top Stocks. Just three companies have appeared in
each one of those editions:
• ANZ
• Commonwealth Bank of Australia
• Westpac Banking.
Once again it is my hope that Top Stocks will serve you well.
Martin Roth
Melbourne
September 2014
Top Stocks 2015 BOOK.indb 9Top Stocks 2015 BOOK.indb 9 30/09/14 4:30 PM30/09/14 4:30 PM

Top Stocks 2015 11
Th e 96 companies in this book have been placed as much as possible into
a common format, for ease of comparison. Please study the following
explanations in order to get as much as possible from the large amount of data.
Th e tables have been made as concise as possible, though they repay careful
study, as they contain large amounts of information.
Note that the tables for the banks have been arranged a little diff erently from
the others. Details of these are later in this Introduction.
Entry head
At the head of each entry is the company name, with its three-letter ASX
code and the website address.
Share-price chart
Under the company name is a fi ve-year share-price chart, to September 2014,
provided by Alan Hull (www.alanhullbooks.com.au), author of Invest My Way,
Trade My Way and Active Investing.
Small table
Under the share-price chart is a small table with the following data.
Share price
Th ese are prices from early September 2014. Also included are the 12-month
high and low prices.
Introduction
Top Stocks 2015 BOOK.indb 11Top Stocks 2015 BOOK.indb 11 30/09/14 4:30 PM30/09/14 4:30 PM

Top Stocks 201512
Market capitalisation
Th is is the size of the company, as determined by the stock market. It is the
share price (again, as of early September 2014) multiplied by the number of
shares on issue. All companies in this book must be in the All Ordinaries
index, which comprises Australia’s 500 largest stocks, as measured by market
capitalisation.
Price-to-NTA-per-share ratio
Th e NTA-per-share fi gure expresses the worth of a company’s net tangible
assets — that is, its assets minus its liabilities and intangible assets — for
each share of the company. Th e price-to-NTA-per-share ratio relates this
fi gure to the share price.
A ratio of one means that the company is valued exactly according to the
value of its assets. A ratio below one suggests that the shares are a bargain,
though usually there is a good reason for this. Profi ts are more important
than assets.
Some companies in this book have a negative NTA-per-share fi gure — as a
result of having intangible assets valued at more than their remaining net assets
— and a price-to-NTA-per-share ratio cannot be calculated.
See table M, in part II of this book, for a little more detail on this ratio.
Five-year share-price return
Th is is the total return you could have received from the stock in the fi ve years
to September 2014. It includes reinvested dividends, bonus stock, rights issues
and capital gain from the stock’s appreciation. It is expressed as a compounded
annual rate of return.
Dividend reinvestment plan
A dividend reinvestment plan (DRP) allows shareholders to receive additional
shares in their company in place of the dividend. Usually — though not
always — these shares are provided at a small discount to the prevailing price,
which can make them quite attractive. And of course no broking fees apply.
Around a third of all large companies seem to off er such plans. However,
they come and go. When a company needs fi nance it may introduce a DRP.
When its fi nancing requirements become less pressing it may withdraw it.
Some companies that have a DRP in place may decide to deactivate it for a
short time.
Top Stocks 2015 BOOK.indb 12Top Stocks 2015 BOOK.indb 12 30/09/14 4:30 PM30/09/14 4:30 PM

Top Stocks 2015 13
Th e information in this book is based on up-to-date information from the
companies. But if you are investing in a particular company in expectations
of a DRP be sure to check that it is still on off er. Th e company’s own website
will often provide this information.
Price/earnings ratio
Th e price/earnings ratio (PER) is one of the most popular measures of whether
a share is cheap or expensive. It is calculated by dividing the share price — in
this case the price for early September 2014 — by the earnings per share fi gure.
Obviously the share price is continually changing, so the PER fi gures in this
book are for guidance only. Many newspapers publish each morning the latest
PER for every stock.
Dividend yield
Th is is the latest full-year dividend expressed as a percentage of the share price.
Like the price/earnings ratio, it changes as the share price moves. It is a useful
fi gure, especially for investors who are buying shares for income, as it allows
you to compare this income with alternative investments, such as a bank term
deposit or a rental property.
Sector comparisons
It is sometimes useful to compare a company’s price/earnings ratio and its
dividend yield with those of its sector. Figures used in this book are those of
the S&P/ASX sectors from September 2014.
Company commentary
Each commentary begins with a brief introduction to the company and its
activities. Th en follow the highlights of its latest business results. For the
majority of the companies these are their June 2014 results, which were issued
during July and August 2014. Finally, there is a section on the outlook for
the company.
Main table
Here is what you can fi nd in the main table.
Revenues
Th ese are the company’s revenues from its business activities, generally the
sale of products or services. However, it does not usually include additional
income from such sources as investments, bank interest or the sale of assets.
Top Stocks 2015 BOOK.indb 13Top Stocks 2015 BOOK.indb 13 30/09/14 4:30 PM30/09/14 4:30 PM
Top Stocks 201514
If the information is available, the revenues fi gure has been broken down into
the major product areas.
Earnings before interest and taxation
Earnings before interest and taxation (EBIT) is the fi rm’s profi t from its
operations before the payment of interest and tax. Th is fi gure is often used
by analysts examining a company. Th e reason is that some companies have
borrowed extensively to fi nance their activities, while others have opted for
alternative means. By expressing profi ts before interest payments it is possible
to compare more precisely the performance of these companies. Th e net
interest fi gure — interest payments minus interest receipts — has been used
for this calculation.
EBIT margin
Th is is the company’s EBIT expressed as a percentage of its revenues. It is a
gauge of a company’s effi ciency. A high EBIT margin suggests that a company
is achieving success in keeping its costs low.
Gross margin
Th e gross margin is the company’s gross profi t as a percentage of its sales. Th e
gross profi t is the amount left over after deducting from a company’s sales
fi gure its cost of sales; that is, its manufacturing costs or, for a retailer, the cost
of purchasing the goods it sells. Th e cost of goods sold fi gure does not usually
include marketing or administration costs.
As there are diff erent ways of calculating the cost of goods sold fi gure, this
ratio is best used for year-to-year comparisons of a single company’s effi ciency,
rather than in comparing one company with another.
Many companies do not present a cost of goods sold fi gure, so a gross margin
ratio is not given for every stock in this book.
Th e revenues for some companies include a mix of sales and services. Where
a breakdown is possible, the gross profi t fi gure will relate to sales only.
Profi t before tax/profi t after tax
Th e profi t before tax fi gure is simply the EBIT fi gure minus net interest
payments. Th e profi t after tax fi gure is, of course, the company’s profi t after the
payment of tax, and also after the deduction of minority interests. Minority
interests are that part of a company’s profi t that is claimed by outside interests,
usually the other shareholders in a subsidiary which is not fully owned by the
company. Many companies do not have any minority interests, and for those
Top Stocks 2015 BOOK.indb 14Top Stocks 2015 BOOK.indb 14 30/09/14 4:30 PM30/09/14 4:30 PM
Top Stocks 2015 15
that do it is generally a tiny fi gure. Th e after-tax profi t fi gure will also usually
incorporate the profi ts (or losses) from discontinued businesses.
As much as possible, I have adjusted the profi t fi gures to exclude non-recurring
profi ts and losses, which are often referred to as signifi cant items. It is for this
reason that the profi t fi gures in Top Stocks sometimes diff er from those in the
fi nancial media or on fi nancial websites, where profi t fi gures normally include
signifi cant items.
Signifi cant items are those that have an abnormal impact on profi ts, even
though they happen in the normal course of the company’s operations.
Examples are the profi t from the sale of a business, or losses from a business
restructuring, the write-down of property, an inventory write-down, a bad-debt
loss or a write-off for research and development expenditure.
Signifi cant items are controversial. It is often a matter of subjective judgement
as to what is included and what excluded. After analysing the accounts of
hundreds of companies, while writing the various editions of this book, it
is clear that diff erent companies use quite widely varying interpretations of
what is signifi cant.
Further, when they do report a signifi cant item there is no consistency as to
whether they use pre-tax fi gures or after-tax fi gures. Some report both, making
it easy to adjust the profi t fi gures in the tables in this book. But diffi culties
arise when only one fi gure — generally pre-tax — is given for signifi cant items.
In normal circumstances most companies do not report signifi cant items. But
investors should be aware of this issue. It sometimes causes consternation
for readers of Top Stocks to fi nd that a particular profi t fi gure in this book is
substantially diff erent from that given by some other source. My publisher
occasionally receives emails from readers enquiring why a profi t fi gure in this
book is so diff erent from that reported elsewhere. In virtually all cases the
reason is that I have stripped out a signifi cant item.
Earnings per share
Earnings per share is the after-tax profi t divided by the number of shares.
Because the profi t fi gure is for a 12-month period the number of shares used
is a weighted average of those on issue during the year. Th is number is provided
by the company in its annual report and its results announcements.
Cash fl ow per share
Th e cash fl ow per share ratio tells — in theory — how much actual cash the
company has generated from its operations.
Top Stocks 2015 BOOK.indb 15Top Stocks 2015 BOOK.indb 15 30/09/14 4:30 PM30/09/14 4:30 PM

Top Stocks 201516
In fact, the ratio in this book is not exactly a true measure of cash fl ow. It is
simply the company’s depreciation and amortisation fi gures for the year added
to the after-tax profi t, and then divided by a weighted average of the number of
shares. Depreciation and amortisation are expenses that do not actually utilise
cash, so can be added back to after-tax profi t to give a kind of indication of
the company’s cash fl ow.
By contrast, a true cash fl ow — including such items as newly raised capital
and money received from the sale of assets — would require quite complex
calculations based on the company’s statement of cash fl ows.
However, many analysts use the ratio as I present it, because it is easy to
calculate, and it is certainly a useful guide to how much funding the company
has available from its operations.
Dividend
Th e dividend fi gure is the total for the year, interim and fi nal. It does not
include special dividends. Th e level of franking is also provided.
Net tangible assets per share
Th e NTA per share fi gure tells the theoretical value of the company — per
share — if all assets were sold and then all liabilities paid. It is very much a
theoretical fi gure, as there is no guarantee that corporate assets are really worth
the price put on them in the balance sheet. Intangible assets such as goodwill,
newspaper mastheads and patent rights are excluded because of the diffi culty
in putting a sales price on them, and also because they may in fact not have
much value if separated from the company.
As already noted, some companies in this book have a negative NTA, due to
the fact that their intangible assets are so great, and no fi gure can be listed
for them.
Where a company’s most recent fi nancial results are the half-year fi gures, these
are used to calculate this ratio.
Interest cover
Th e interest cover ratio indicates how many times a company could make its
interest payments from its pre-tax profi t. A rough rule of thumb says a ratio of
at least three times is desirable. Below that and fast-rising interest rates could
imperil profi ts. Th e ratio is derived by dividing the EBIT fi gure by net interest
payments. Some fortunate companies have interest receipts that are higher
than their interest payments, which turns the interest cover into a negative
fi gure, and so it is not listed.
Top Stocks 2015 BOOK.indb 16Top Stocks 2015 BOOK.indb 16 30/09/14 4:30 PM30/09/14 4:30 PM

Top Stocks 2015 17
Return on equity
Return on equity is the after-tax profi t expressed as a percentage of the
shareholders’ equity. In theory, it is the amount that the company’s managers
have made for you — the shareholder — on your money. Th e shareholders’
equity fi gure used is an average for the year.
Debt-to-equity ratio
Th is ratio is one of the best-known measures of a company’s debt levels. It is
total borrowings minus the company’s cash holdings, expressed as a percentage
of the shareholders’ equity. Some companies have no debt at all, or their cash
position is greater than their level of debt, which results in a negative ratio, so
no fi gure is listed for them.
Where a company’s most recent fi nancial results are the half-year fi gures, these
are used to calculate this ratio.
Current ratio
Th e current ratio is simply the company’s current assets divided by its current
liabilities. Current assets are cash or assets that can, in theory, be converted
quickly into cash. Current liabilities are normally those payable within a year.
Th us, the current ratio measures the ability of a company to repay in a hurry
its short-term debt, should the need arise. Th e surplus of current assets over
current liabilities is referred to as the company’s working capital.
Where a company’s most recent fi nancial results are the half-year fi gures, these
are used to calculate this ratio.
Banks
Th e tables for the banks are somewhat diff erent from those for most other
companies. EBIT and debt-to-equity ratios have little relevance for them, as
they have such high interest payments (to their customers). Other diff erences
are examined below.
Operating income
Operating income is used instead of sales revenues. Operating income is the
bank’s net interest income — that is, its total interest income minus its interest
expense — plus other income, such as bank fees, fund management fees and
income from businesses such as corporate fi nance and insurance.
Top Stocks 2015 BOOK.indb 17Top Stocks 2015 BOOK.indb 17 30/09/14 4:31 PM30/09/14 4:31 PM
Top Stocks 201518
Net interest income
Banks borrow money — that is, they accept deposits from savers — and they
lend it to businesses, homebuyers and other borrowers. Th ey charge the
borrowers more than they pay those who deposit money with them, and the
diff erence is known as net interest income.
Operating expenses
Th ese are all the costs of running the bank. Banks have high operating
expenses, and one of the keys to profi t growth is cutting these expenses. Add
the provision for doubtful debts to operating expenses, then deduct the total
from operating income, and you get the pre-tax profi t.
Non-interest income to total income
Banks have traditionally made most of their income from savers and from
lending out money. But they are also working to diversify into new fi elds, and
this ratio is an indication of their success.
Cost-to-income ratio
As noted, the banks have high costs — numerous branches, expensive computer
systems, many staff , and so on — and they are all striving to reduce these. Th e
cost-to-income ratio expresses their expenses as a percentage of their operating
income, and is one of the ratios most often used as a gauge of effi ciency. Th e
lower the ratio drops the better.
Return on assets
Banks have enormous assets, in sharp contrast to, say, a high-tech start-up
whose main physical assets may be little more than a set of computers and
other technological equipment. So the return on assets — the after-tax profi t
expressed as a percentage of the year’s average total assets — is another measure
of effi ciency.
Top Stocks 2015 BOOK.indb 18Top Stocks 2015 BOOK.indb 18 30/09/14 4:31 PM30/09/14 4:31 PM

The companies
PART IPART I
Top Stocks 2015 BOOK.indb 19Top Stocks 2015 BOOK.indb 19 30/09/14 4:31 PM30/09/14 4:31 PM

Top Stocks 201520
ASX code: ONT www.1300smiles.com.au
Share price ($) 6.05
12-month high ($) 7.25
12-month low ($) 5.35
Market capitalisation ($mn) 143.3
Price-to-NTA-per-share ratio 17.4
5-year share price return (% p.a.) 20.9
Dividend reinvestment plan No
Sector: Health care Company SectorPrice/earnings ratio (times) 28.7 26.3
Dividend yield (%) 2.4 2.1
Townsville-based 1300 SMILES, founded in 2000, runs a chain of more
than two dozen dental practices in 10 cities and towns of Queensland, and
has also expanded to South Australia and New South Wales. Its main role is
the provision of dental surgeries and practice management services to self-
employed dentists, allowing them to focus on dental services. It also manages
its own small dental business. Th e founder and managing director Dr Daryl
Holmes owns 60 per cent of the company equity.
Latest business results (June 2014, full year)Revenues and profi ts fell, as the company continued to be hit by the ending
of the government’s Chronic Disease Dental Scheme in November 2012.
Th is had been responsible for funding about 20 per cent of dental treatment
revenues. It led to a sharp spike in business before the formal ending of the
scheme, followed by a major downturn during 2013. However, business began
1300 Smiles Limited
Top Stocks 2015 BOOK.indb 20Top Stocks 2015 BOOK.indb 20 30/09/14 4:31 PM30/09/14 4:31 PM

Top Stocks 2015 21
Year to 30 June 2013 2014Revenues ($mn) 35.4 30.9
EBIT ($mn) 8.5 7.0
EBIT margin (%) 23.9 22.7
Profi t before tax ($mn) 8.9 7.4
Profi t after tax ($mn) 6.4 5.0
Earnings per share (¢) 26.9 21.1
Cash fl ow per share (¢) 35.8 30.7
Dividend (¢) 18.5 14.5
Percentage franked 100 100
Net tangible assets per share ($) 0.62 0.35
Interest cover (times) – –
Return on equity (%) 23.6 17.4
Debt-to-equity ratio (%) – –
Current ratio 1.7 0.4
a steady recovery during 2014, and the company reported that the June 2014
half saw a pleasant rise in revenues and profi ts over the December 2013 half.
In response to the termination of the Chronic Disease Dental Scheme, the
company in October 2012 launched its own subscription-based Dental Care
Plan, and this has been showing steady growth. By June 2014 it was generating
annual revenues — from membership fees plus treatment charges — of more
than $3 million. In April 2014 the company made its fi rst acquisition in New
South Wales, and in May 2014 it completed its largest-ever acquisition, BOH
Dental in the Brisbane CBD.
OutlookTh e dental business in Australia is fragmented, with a majority of dentists
working in their own private practices. A gradual consolidation is taking place,
with 1300 SMILES one of the leaders in this work. It buys dental practices,
then retains the dentists, who pay a fee to 1300 SMILES for services received.
Th e company continues to seek out new practices to buy, though has strict
benchmarks concerning the price it will pay. A new agreement with Queensland
Health for the treatment of public dental patients is boosting business. Th e
company is also now receiving annualised revenues of some $3 million from the
government’s Child Dental Benefi ts Scheme, while its own Dental Care Plan
continues to show steady grow. It expects its new BOH Dental acquisition to
make an annual contribution to EBIT of at least $1.25 million. In addition,
seven of the 10 BOH dentists are senior specialists, allowing 1300 SMILES
to make referrals within the company.
Top Stocks 2015 BOOK.indb 21Top Stocks 2015 BOOK.indb 21 30/09/14 4:31 PM30/09/14 4:31 PM
TOP STOCKS 2015 A Sharebuyer’s Guide to Leading Australian Companies
We hope you have enjoyed this sample from
by Martin Roth
ISBN: 9780730315063Available November 2014RRP AU$29.95 / NZ$33.99

Learn more with practicaladvice from our experts
Charting Secrets, revised editionLouise Bedford
Online Investing on the Australian Sharemarket, 4th editionRoger Kinsky
Think Like the Great InvestorsColin Nicholson
Building Wealth in the Stock Market Colin Nicholson
Guppy TradingDaryl Guppy
FX Trading, 2nd editionAlex Douglas, Larry Lovrenic and Peter Pontikis
Bulls, Bears and a CroupierMatthew Kidman
An End to the BullGary Norden
Trading in a Nutshell, 10thanniversary ed.Stuart McPhee
Available in print and e-book formats
Top Stocks 2015 BOOK.indb 235Top Stocks 2015 BOOK.indb 235 30/09/14 4:31 PM30/09/14 4:31 PM

Th e author and publisher would like to thank Alan Hull (author of Active Investing, Revised Edition, Trade My Way and Invest My Way; www.alanhull.com) for generating the fi ve-year share-price charts.
Th is twenty-fi rst edition fi rst published in 2015 by Wrightbooksan imprint of John Wiley & Sons Australia, Ltd42 McDougall Street, Milton Qld 4064
Offi ce also in Melbourne
Typeset in 10/12.4 pt Caslon
First edition published as Top Stocks by Wrightbooks in 1995New edition published annually
© Martin Roth 2015Th e moral rights of the author have been asserted
ISBN: 9780730315063 (pbk.) 9780730315070 (ebook)
All rights reserved. Except as permitted under the Australian Copyright Act 1968 (for example, a fair dealing for the purposes of study, research, criticism or review), no part of this book may be reproduced, stored in a retrieval system, communicated or transmitted in any form or by any means without prior written permission. All enquiries should be made to the publisher at the address above.
Cover design: WileyCover image: Financial Chart © istockphoto.com/Petrovich9
Charts created using TradeStation © TradeStation Technologies, Inc. 2001–2014. All rights reserved. No investment or trading advice, recommendation or opinions are being given or intended.
Printed in Australia by Ligare Book Printer
10 9 8 7 6 5 4 3 2 1
Disclaimer
Th e material in this publication is of the nature of general comment only, and does not represent professional advice. It is not intended to provide specifi c guidance for particular circumstances and it should not be relied on as the basis for any decision to take action or not take action on any matter which it covers. Readers should obtain professional advice where appropriate, before making any such decision. To the maximum extent permitted by law, the author and publisher disclaim all responsibility and liability to any person, arising directly or indirectly from any person taking or not taking action based on the information in this publication.
Top Stocks 2015 BOOK.indb iiTop Stocks 2015 BOOK.indb ii 30/09/14 4:30 PM30/09/14 4:30 PM
MARTIN ROTH’SB E S T - S E L L I N G A N N U A L
A S H A R E B U Y E R ’ S G U I D E T O
LEADING AUSTRALIANCOMPANIES
STOCKS
2015
TOPTWENTY-FIRST EDITION
AUSTRALIA’S BEST-SELLING SHAREMARKET TITLE IS BACK IN ITS 21ST EDITION
Top Stocks 2015 is the definitive guide to the best stocks to buy on the Australian sharemarket. With all the key information in an easy-to-read format, this book allows even inexperienced investors the chance to build an impressive portfolio. Cut through the noise and hype to find clear, objective information on top Australian companies, with a focus on profitability, debt levels and dividends. You’ll have easy access to each company’s financial data in a format perfect for quick comparison.
This resource profiles the companies that met a meticulous set of criteria, distilled to a concise selection of premium purchases across market sectors. It gives you:
• individual, unbiased analysis of the latest results from 96 of Australia’s leading companies, with a focus on profitability, dividends and debt levels
• comparative sales and profits data, as well as in-depth ratio analysis
• comprehensive research on each company’s overall outlook, and tables ranking all companies according to financial data.
Leave the complex data to the analysts and focus on the clear winners. With Top Stocks 2015, you get the data you need and the expert insight you trust.
MARTIN ROTH is an internationally successful financial journalist. Based in Melbourne, he is one of Australia’s leading authors of investment books.
INVESTINGCover Design: Wiley Cover Image: © iStock.com/Petrovich9
TOP
STO
CK
S 2
01
5ROTH


![Publications Books/Proceedings · Publications Books/Proceedings [1] Martin Atzmueller, Samia Oussena, and Thomas Roth-Berghofer, editors. En-terprise Big Data Engineering, Analytics](https://img.pdfslide.net/doc/110x75/5edf94c9ad6a402d666aea81/publications-booksproceedings-publications-booksproceedings-1-martin-atzmueller.jpg)