Embed Size (px)
Citation preview
UNDERSTANDING
THE RANKINGS
Top-to-Bottom (TTB) School Rankings
2015-2016
Introduction
Description Roadmap
� What changed vs what stayed the same
� Brief z-score refresher
� Top-to-Bottom (TTB) ranking description
� Achievement Gap ranking description
� Update on Labels
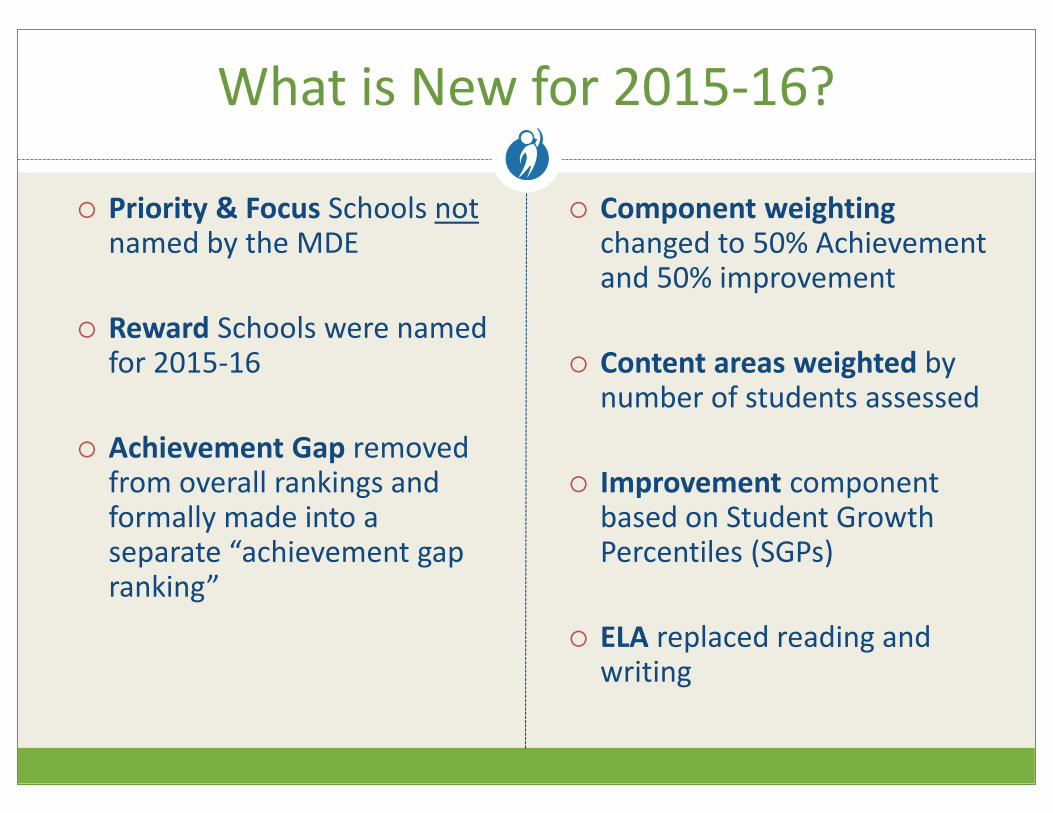
What is New for 2015-16?
¡ Priority & Focus Schools notnamed by the MDE
¡ Reward Schools were named for 2015-16
¡ Achievement Gap removed from overall rankings and formally made into a separate “achievement gap
ranking”
¡ Component weightingchanged to 50% Achievement and 50% improvement
¡ Content areas weighted by number of students assessed
¡ Improvement component based on Student Growth Percentiles (SGPs)
¡ ELA replaced reading and writing
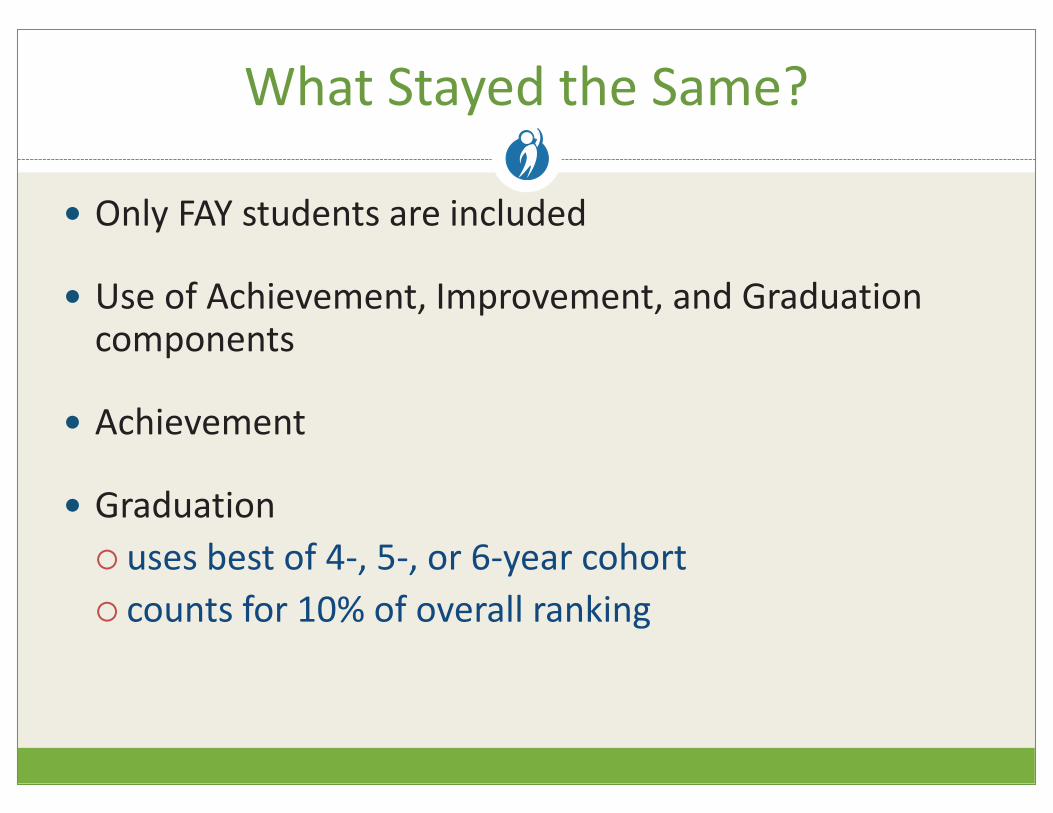
What Stayed the Same?
� Only FAY students are included
� Use of Achievement, Improvement, and Graduation components
� Achievement
� Graduation
¡ uses best of 4-, 5-, or 6-year cohort
¡ counts for 10% of overall ranking
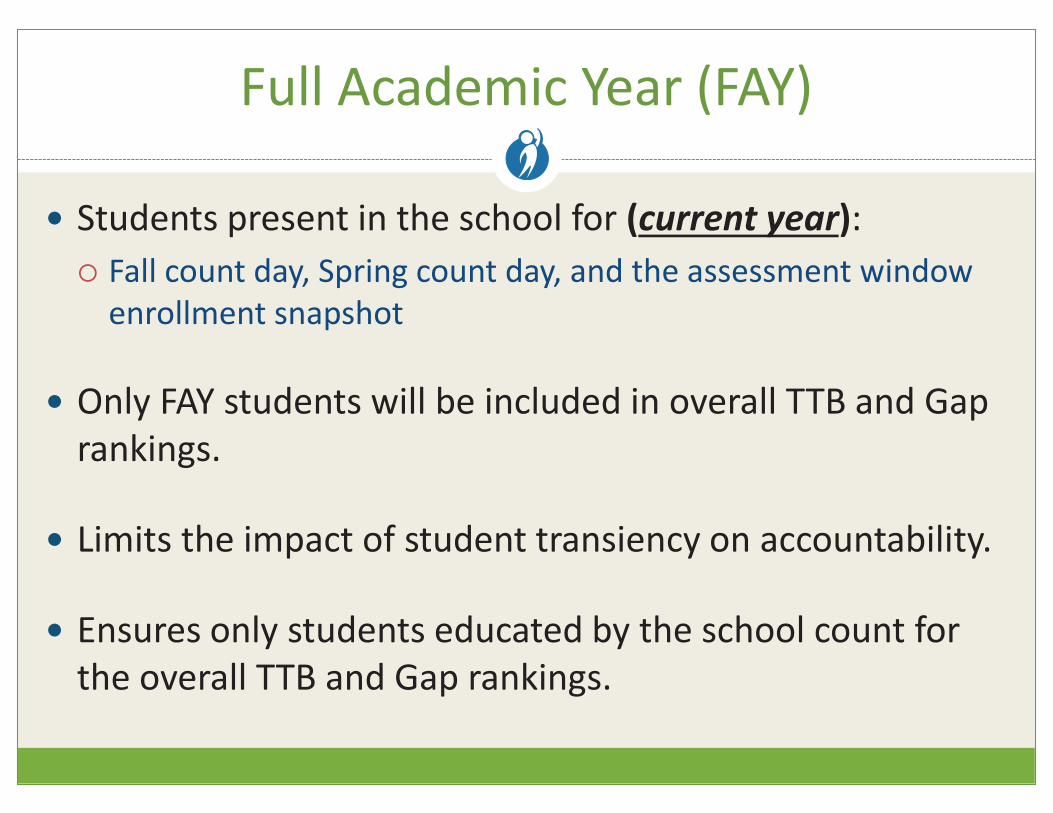
Full Academic Year (FAY)
� Students present in the school for (current year):
¡ Fall count day, Spring count day, and the assessment window
enrollment snapshot
� Only FAY students will be included in overall TTB and Gap
rankings.
� Limits the impact of student transiency on accountability.
� Ensures only students educated by the school count for
the overall TTB and Gap rankings.
Z-Score Refresher
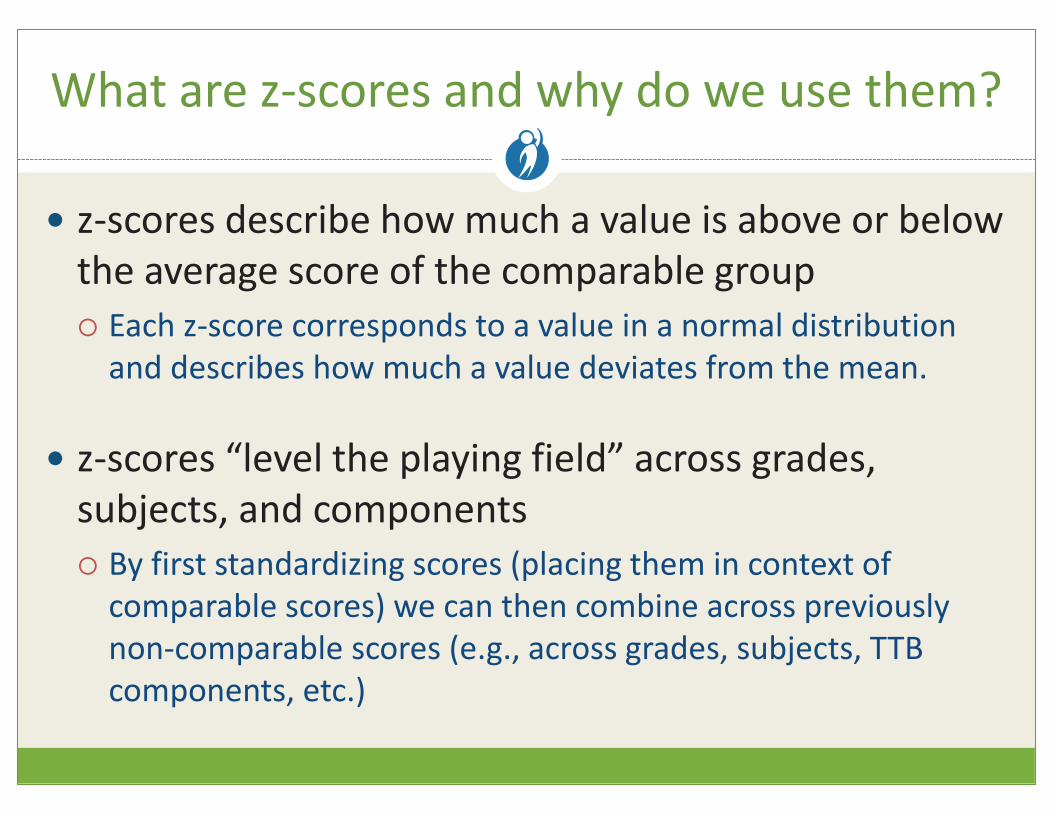
What are z-scores and why do we use them?
� z-scores describe how much a value is above or below
the average score of the comparable group
¡ Each z-score corresponds to a value in a normal distribution
and describes how much a value deviates from the mean.
� z-scores “level the playing field” across grades,
subjects, and components
¡ By first standardizing scores (placing them in context of
comparable scores) we can then combine across previously
non-comparable scores (e.g., across grades, subjects, TTB
components, etc.)
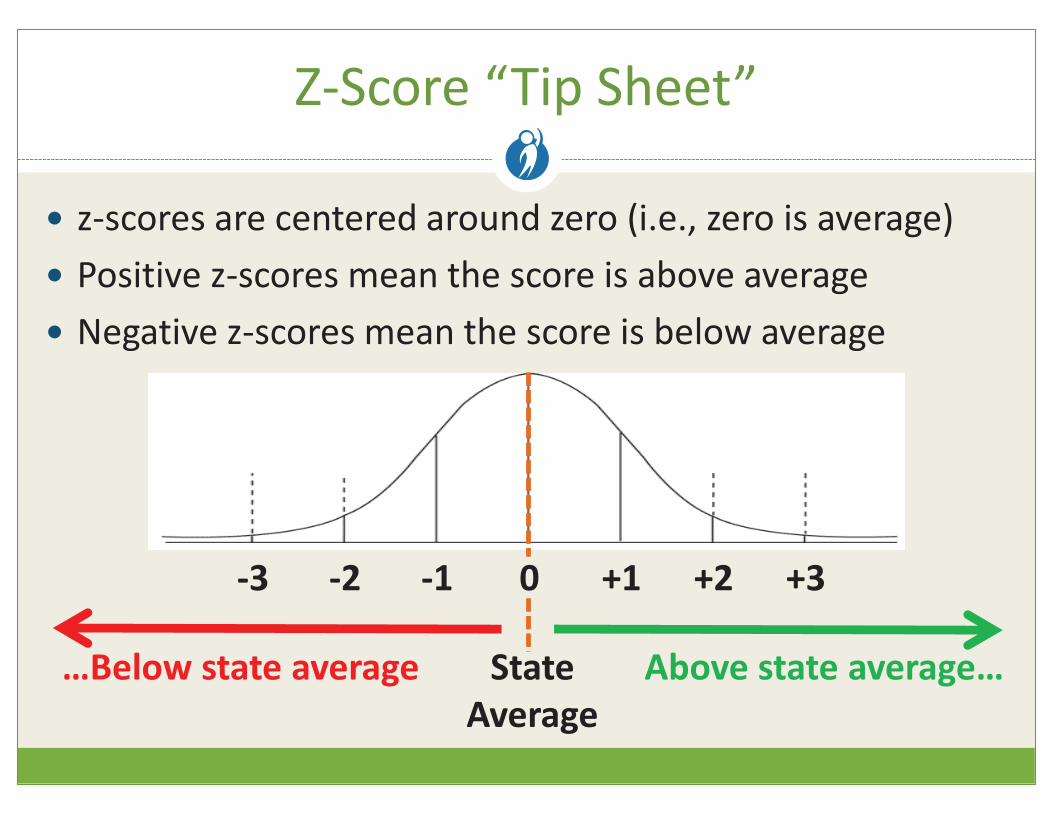
Z-Score “Tip Sheet”
� z-scores are centered around zero (i.e., zero is average)
� Positive z-scores mean the score is above average
� Negative z-scores mean the score is below average
…Below state average State
Average
Above state average…
-3 -2 -1 0 +1 +2 +3
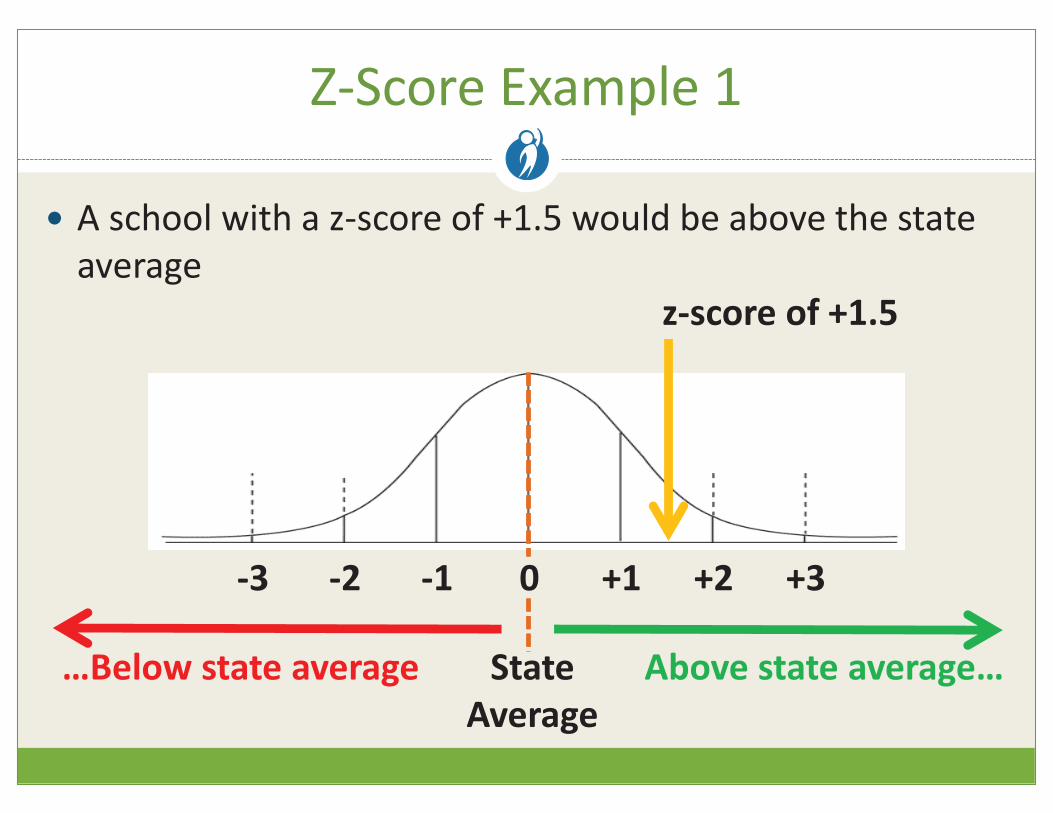
Z-Score Example 1
� A school with a z-score of +1.5 would be above the state
average
…Below state average State
Average
Above state average…
-3 -2 -1 0 +1 +2 +3
z-score of +1.5
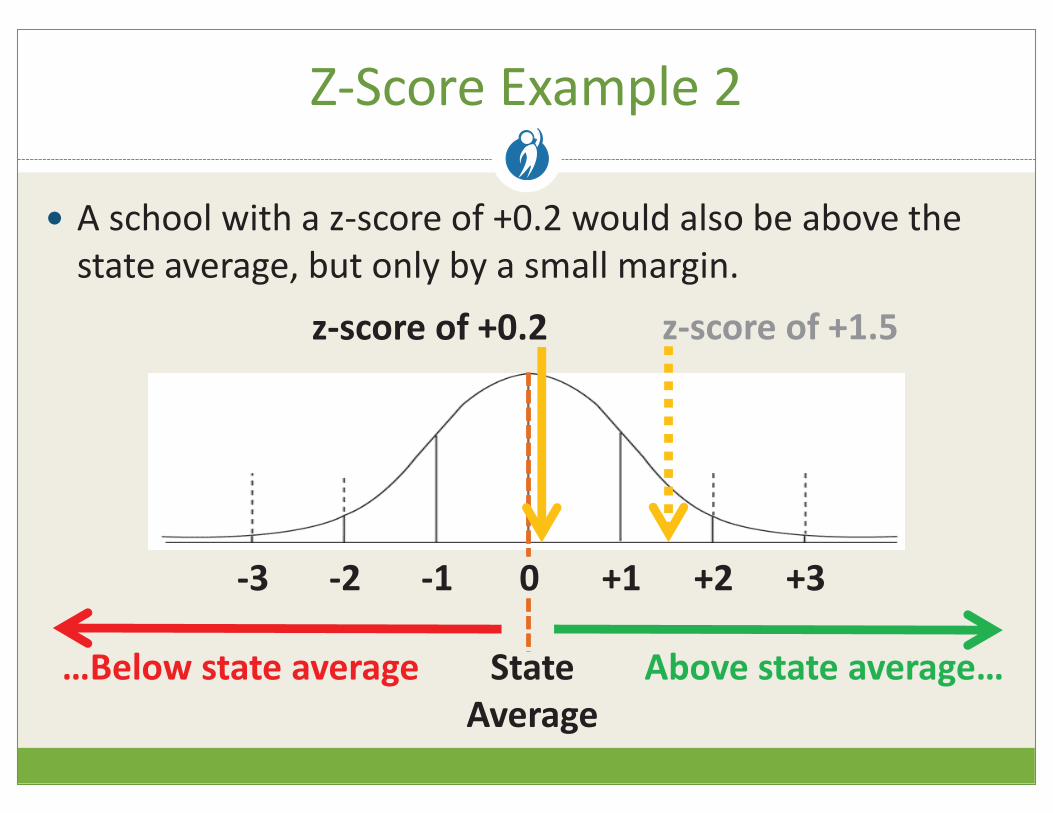
� A school with a z-score of +0.2 would also be above the
state average, but only by a small margin.
…Below state average State
Average
Above state average…
-3 -2 -1 0 +1 +2 +3
z-score of +1.5z-score of +0.2
Z-Score Example 2
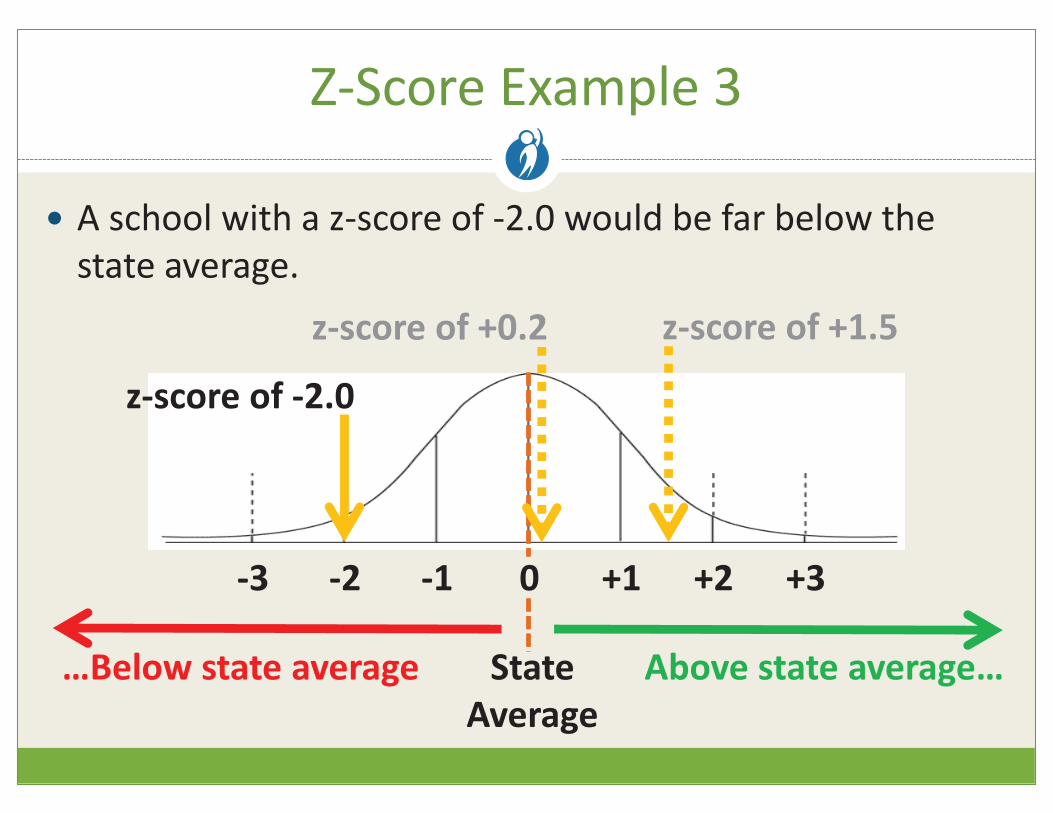
Z-Score Example 3
� A school with a z-score of -2.0 would be far below the
state average.
…Below state average State
Average
Above state average…
-3 -2 -1 0 +1 +2 +3
z-score of +1.5z-score of +0.2
z-score of -2.0
Top-to-Bottom School
Rankings
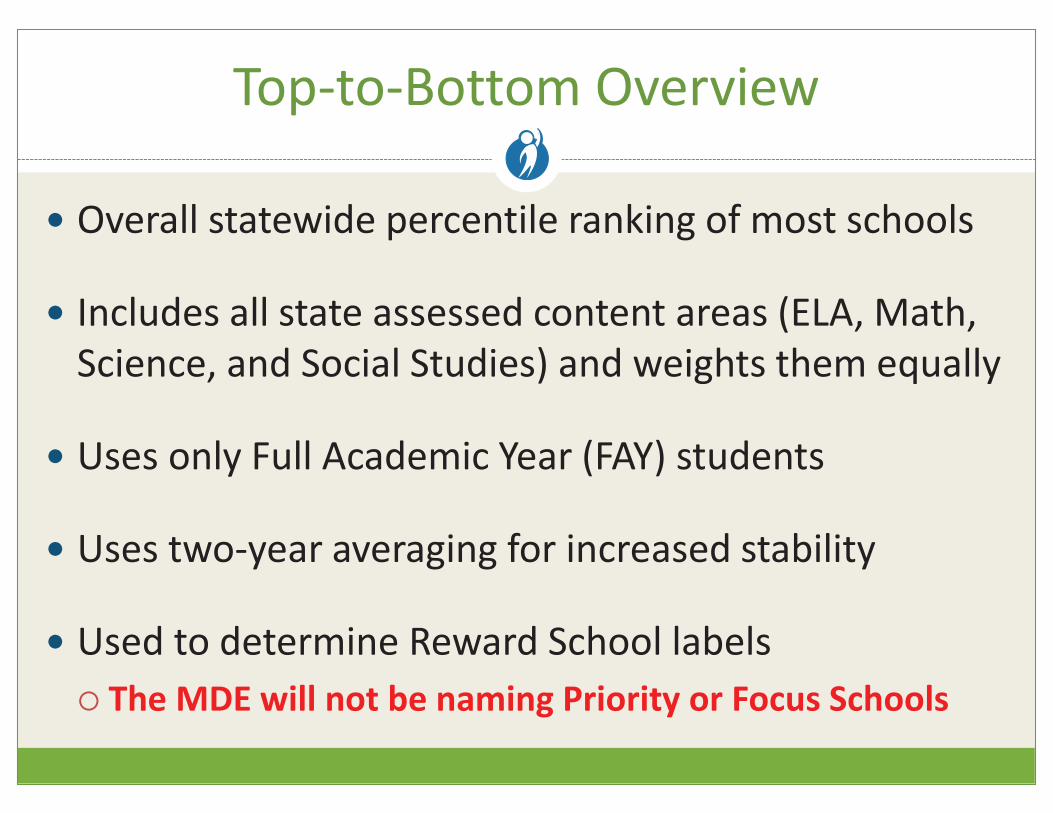
Top-to-Bottom Overview
� Overall statewide percentile ranking of most schools
� Includes all state assessed content areas (ELA, Math,
Science, and Social Studies) and weights them equally
� Uses only Full Academic Year (FAY) students
� Uses two-year averaging for increased stability
� Used to determine Reward School labels
¡ The MDE will not be naming Priority or Focus Schools
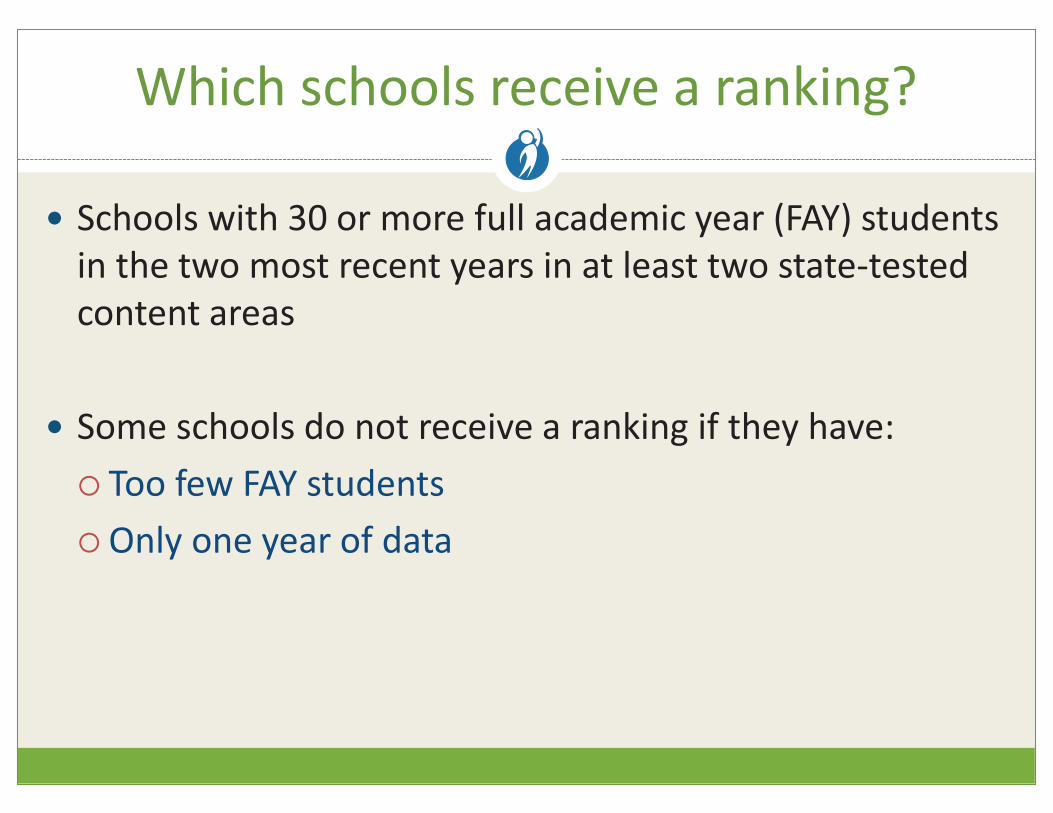
Which schools receive a ranking?
� Schools with 30 or more full academic year (FAY) students
in the two most recent years in at least two state-tested
content areas
� Some schools do not receive a ranking if they have:
¡ Too few FAY students
¡ Only one year of data
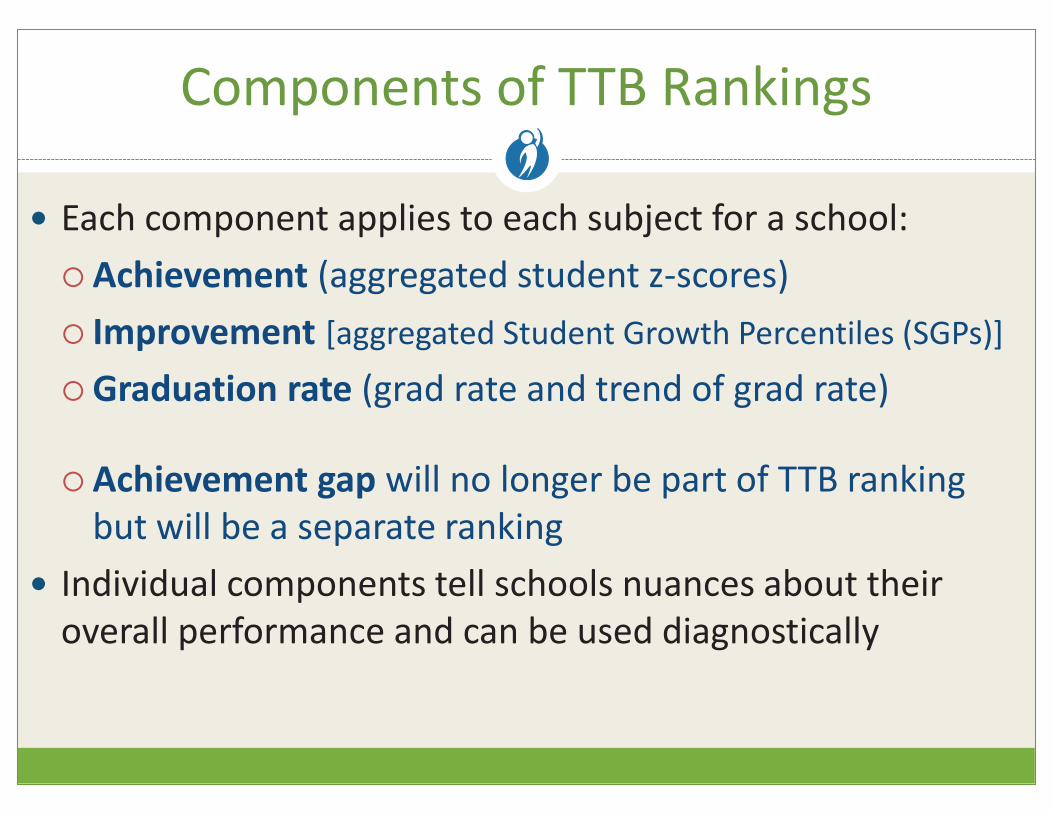
Components of TTB Rankings
� Each component applies to each subject for a school:
¡ Achievement (aggregated student z-scores)
¡ Improvement [aggregated Student Growth Percentiles (SGPs)]
¡ Graduation rate (grad rate and trend of grad rate)
¡ Achievement gap will no longer be part of TTB ranking
but will be a separate ranking
� Individual components tell schools nuances about their
overall performance and can be used diagnostically
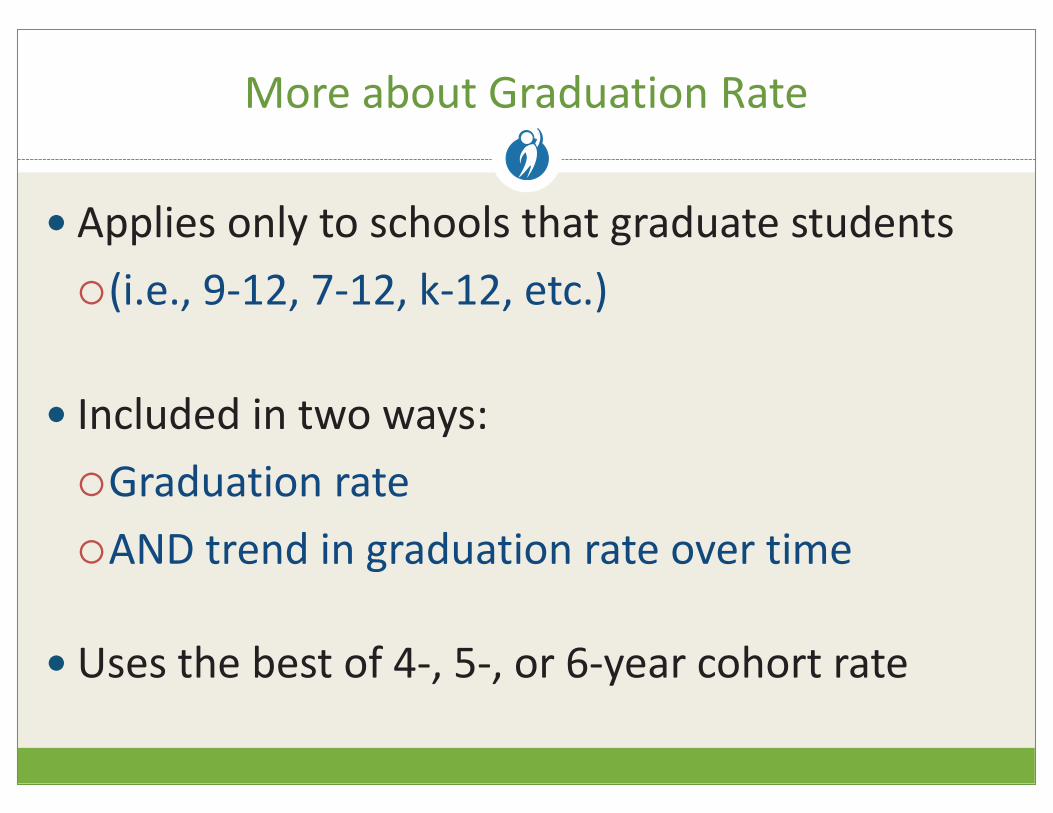
More about Graduation Rate
� Applies only to schools that graduate students
¡(i.e., 9-12, 7-12, k-12, etc.)
� Included in two ways:
¡Graduation rate
¡AND trend in graduation rate over time
� Uses the best of 4-, 5-, or 6-year cohort rate
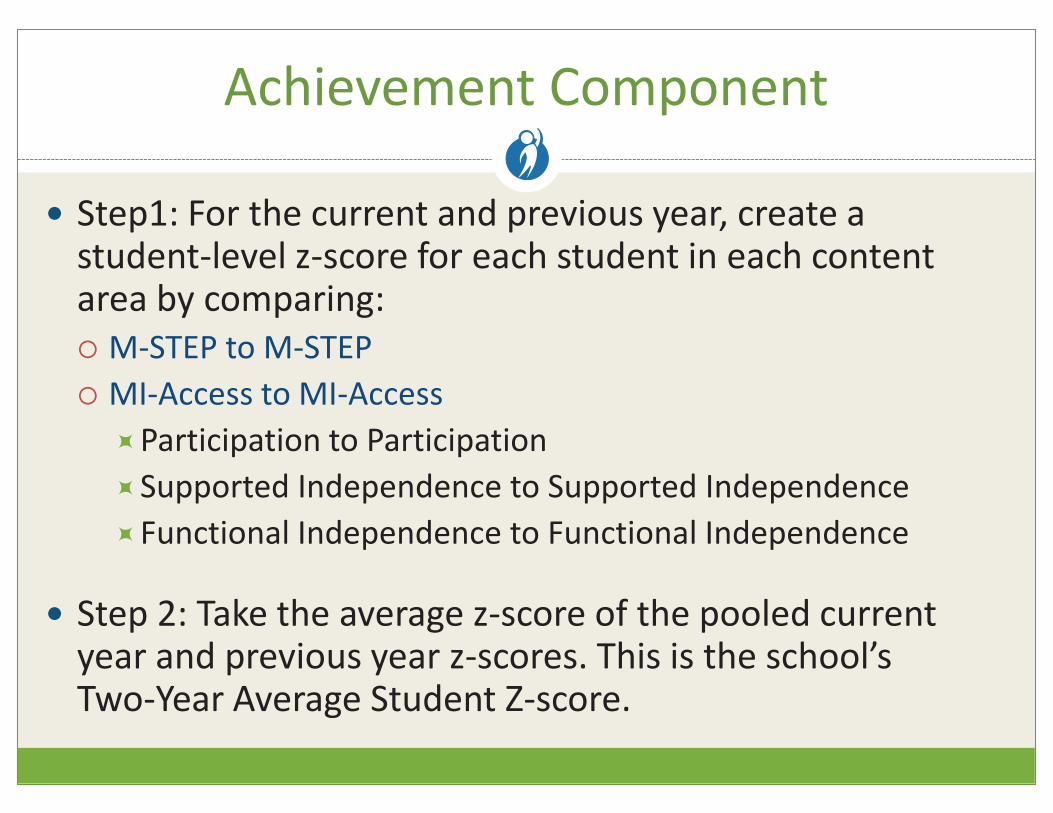
Achievement Component
� Step1: For the current and previous year, create a student-level z-score for each student in each content area by comparing:
¡ M-STEP to M-STEP
¡ MI-Access to MI-Access
÷Participation to Participation
÷Supported Independence to Supported Independence
÷Functional Independence to Functional Independence
� Step 2: Take the average z-score of the pooled current year and previous year z-scores. This is the school’s
Two-Year Average Student Z-score.
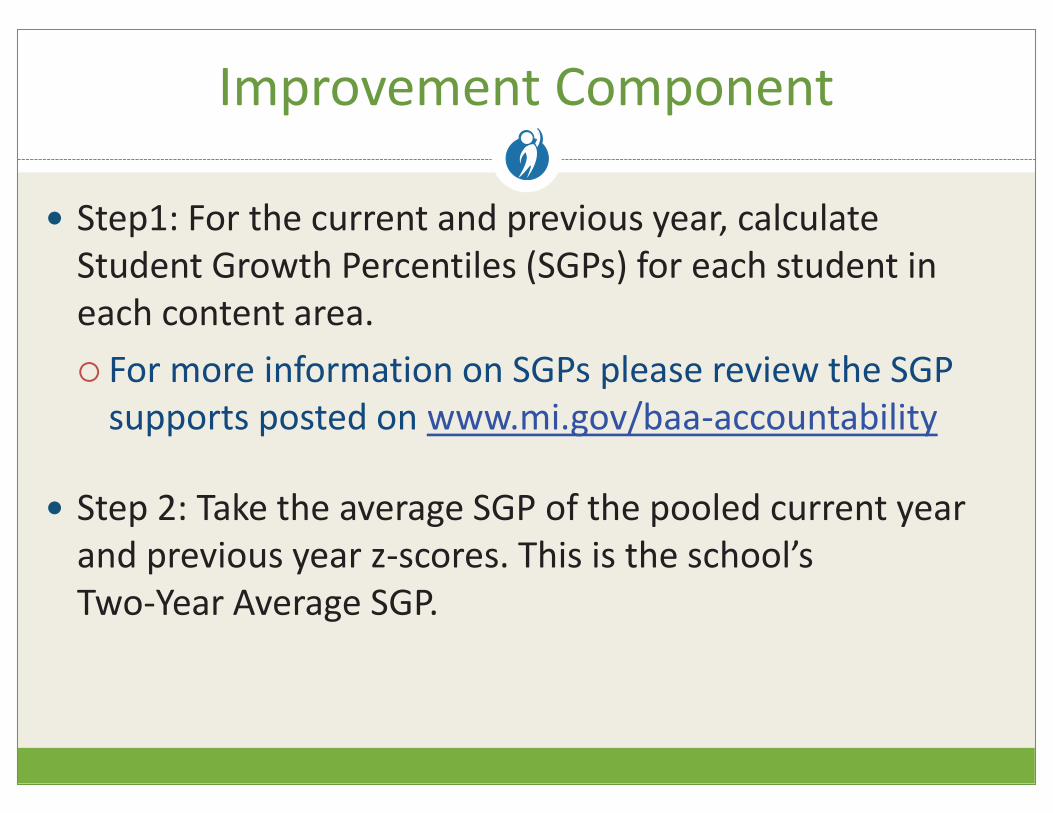
Improvement Component
� Step1: For the current and previous year, calculate
Student Growth Percentiles (SGPs) for each student in
each content area.
¡ For more information on SGPs please review the SGP
supports posted on www.mi.gov/baa-accountability
� Step 2: Take the average SGP of the pooled current year
and previous year z-scores. This is the school’s
Two-Year Average SGP.
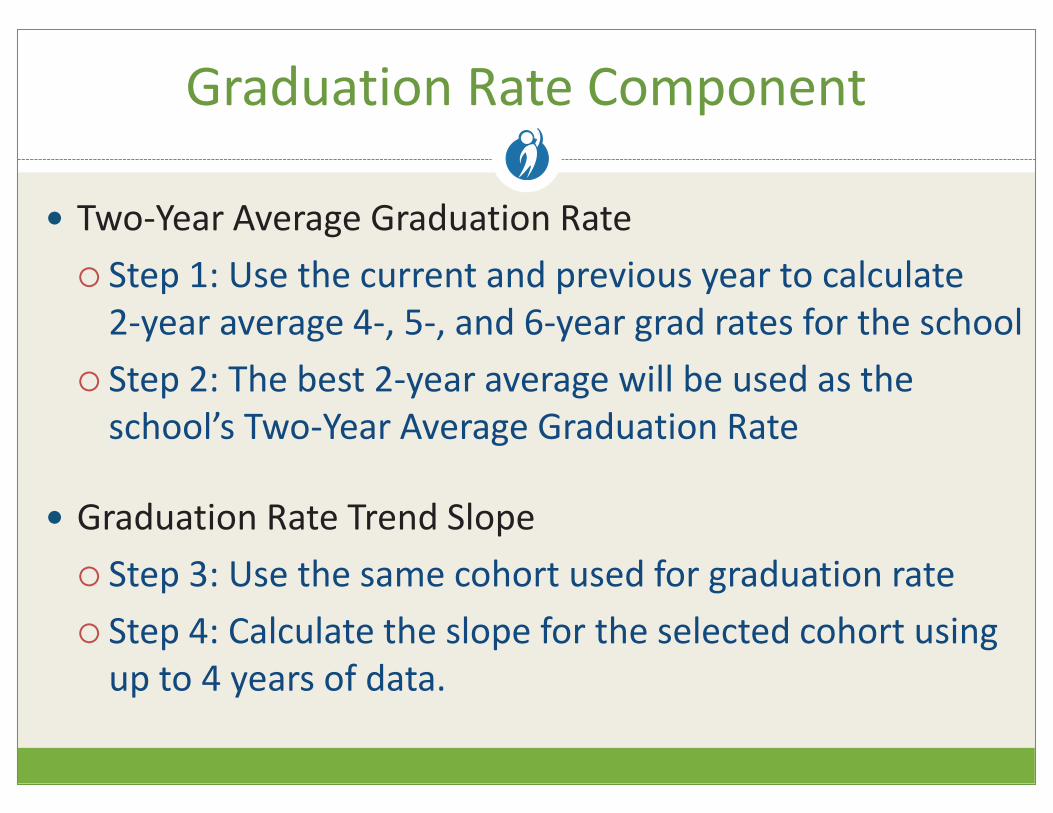
Graduation Rate Component
� Two-Year Average Graduation Rate
¡ Step 1: Use the current and previous year to calculate
2-year average 4-, 5-, and 6-year grad rates for the school
¡ Step 2: The best 2-year average will be used as the
school’s Two-Year Average Graduation Rate
� Graduation Rate Trend Slope
¡ Step 3: Use the same cohort used for graduation rate
¡ Step 4: Calculate the slope for the selected cohort using
up to 4 years of data.
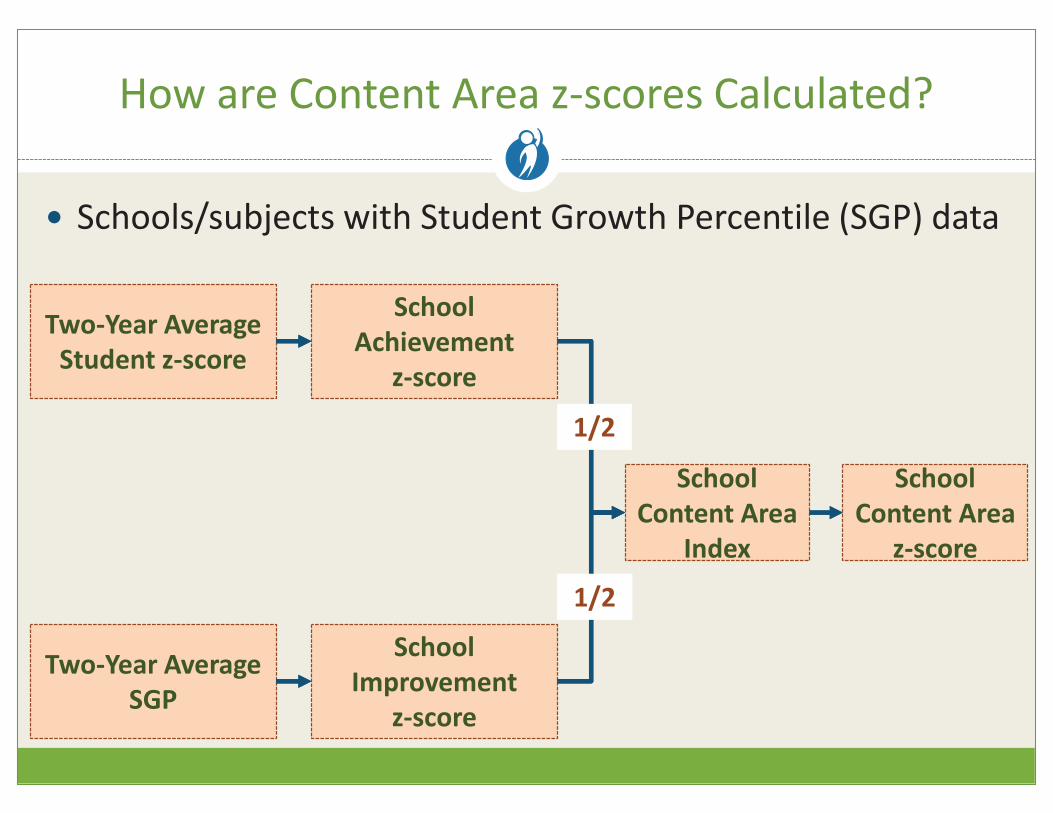
How are Content Area z-scores Calculated?
� Schools/subjects with Student Growth Percentile (SGP) data
Two-Year Average
Student z-score
Two-Year Average
SGP
School
Achievement
z-score
School
Improvement
z-score
School
Content Area
Index
School
Content Area
z-score
1/2
1/2
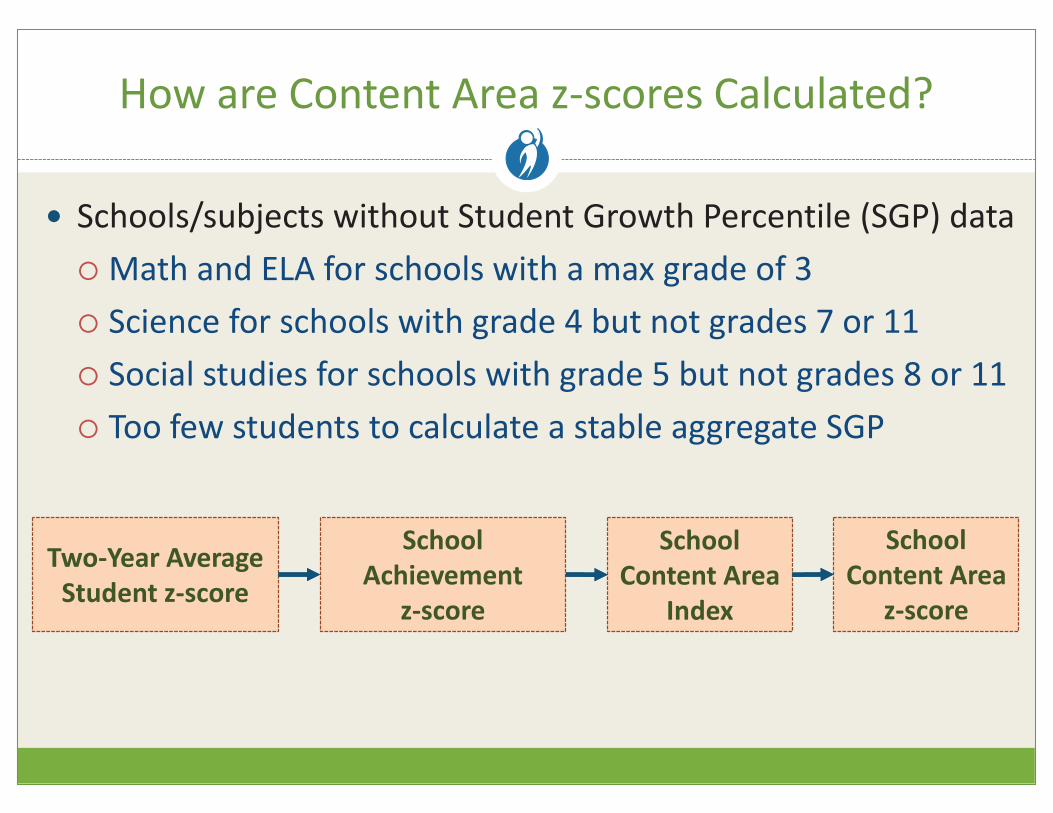
How are Content Area z-scores Calculated?
� Schools/subjects without Student Growth Percentile (SGP) data
¡ Math and ELA for schools with a max grade of 3
¡ Science for schools with grade 4 but not grades 7 or 11
¡ Social studies for schools with grade 5 but not grades 8 or 11
¡ Too few students to calculate a stable aggregate SGP
Two-Year Average
Student z-score
School
Achievement
z-score
School
Content Area
Index
School
Content Area
z-score
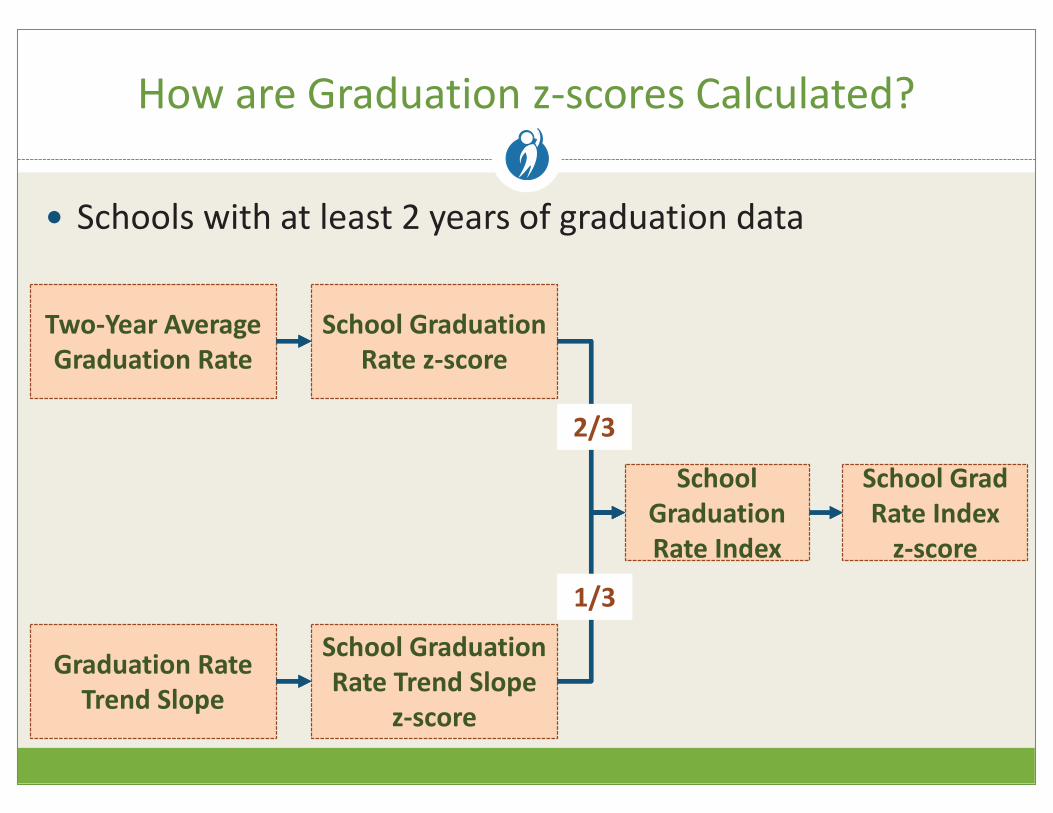
How are Graduation z-scores Calculated?
� Schools with at least 2 years of graduation data
Two-Year Average
Graduation Rate
Graduation Rate
Trend Slope
School Graduation
Rate z-score
School Graduation
Rate Trend Slope
z-score
School
Graduation
Rate Index
School Grad
Rate Index
z-score
1/3
2/3
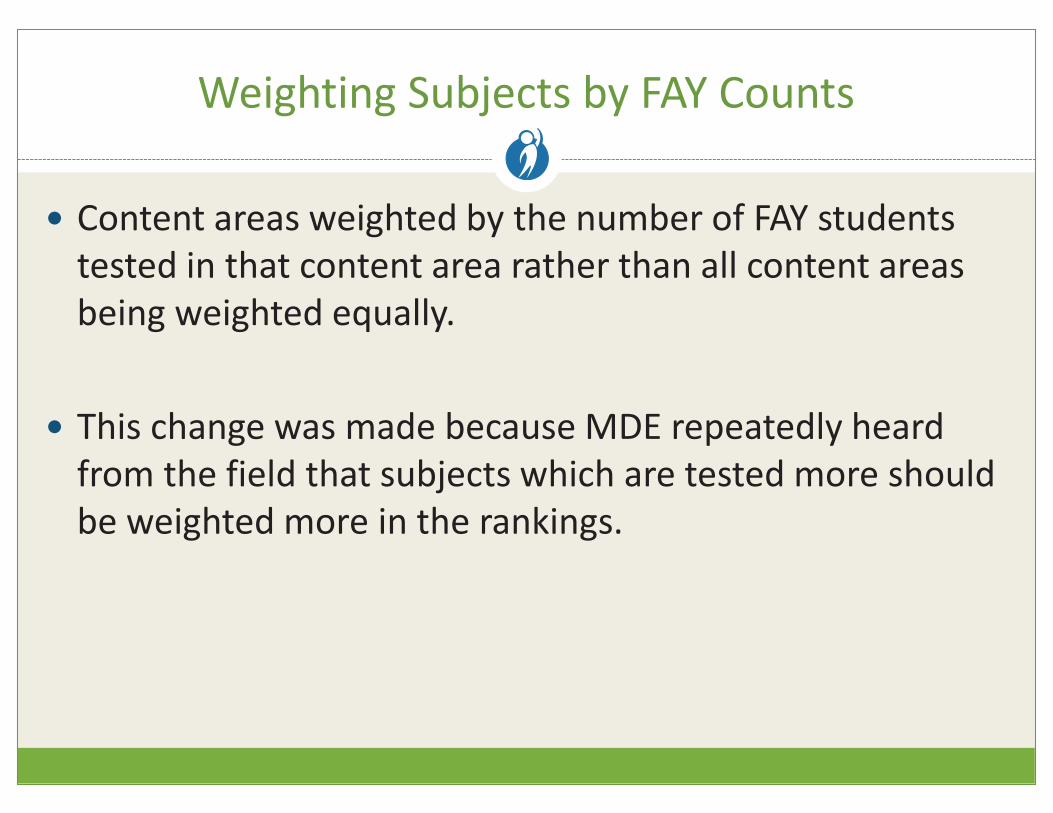
Weighting Subjects by FAY Counts
� Content areas weighted by the number of FAY students
tested in that content area rather than all content areas
being weighted equally.
� This change was made because MDE repeatedly heard
from the field that subjects which are tested more should
be weighted more in the rankings.
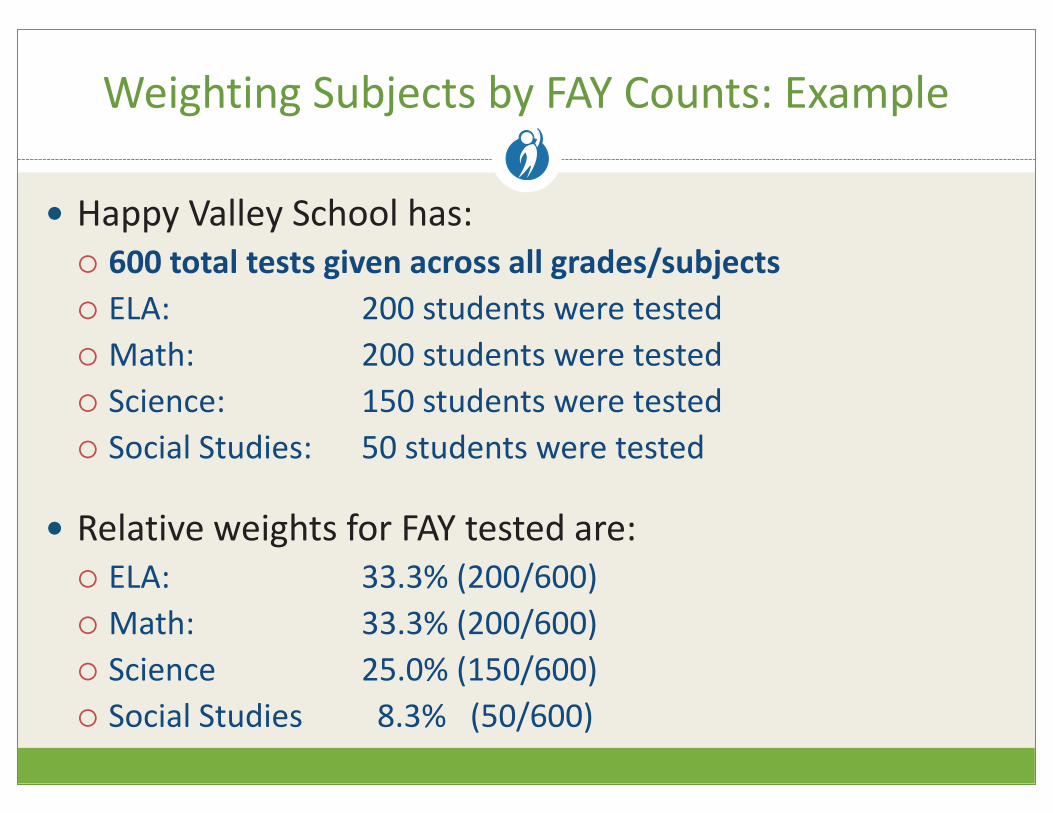
Weighting Subjects by FAY Counts: Example
� Happy Valley School has:
¡ 600 total tests given across all grades/subjects
¡ ELA: 200 students were tested
¡ Math: 200 students were tested
¡ Science: 150 students were tested
¡ Social Studies: 50 students were tested
� Relative weights for FAY tested are:
¡ ELA: 33.3% (200/600)
¡ Math: 33.3% (200/600)
¡ Science 25.0% (150/600)
¡ Social Studies 8.3% (50/600)
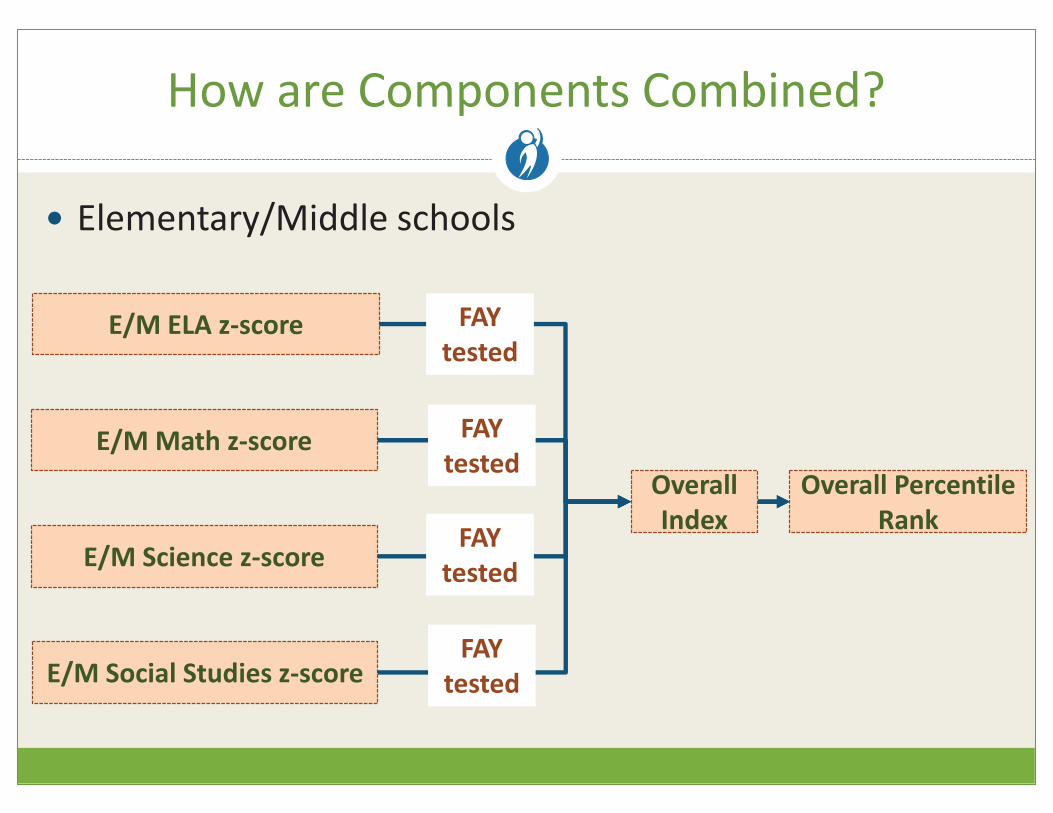
How are Components Combined?
� Elementary/Middle schools
E/M Social Studies z-score
Overall
Index
Overall Percentile
Rank
E/M ELA z-score
E/M Math z-score
E/M Science z-score
FAY
tested
FAY
tested
FAY
tested
FAY
tested
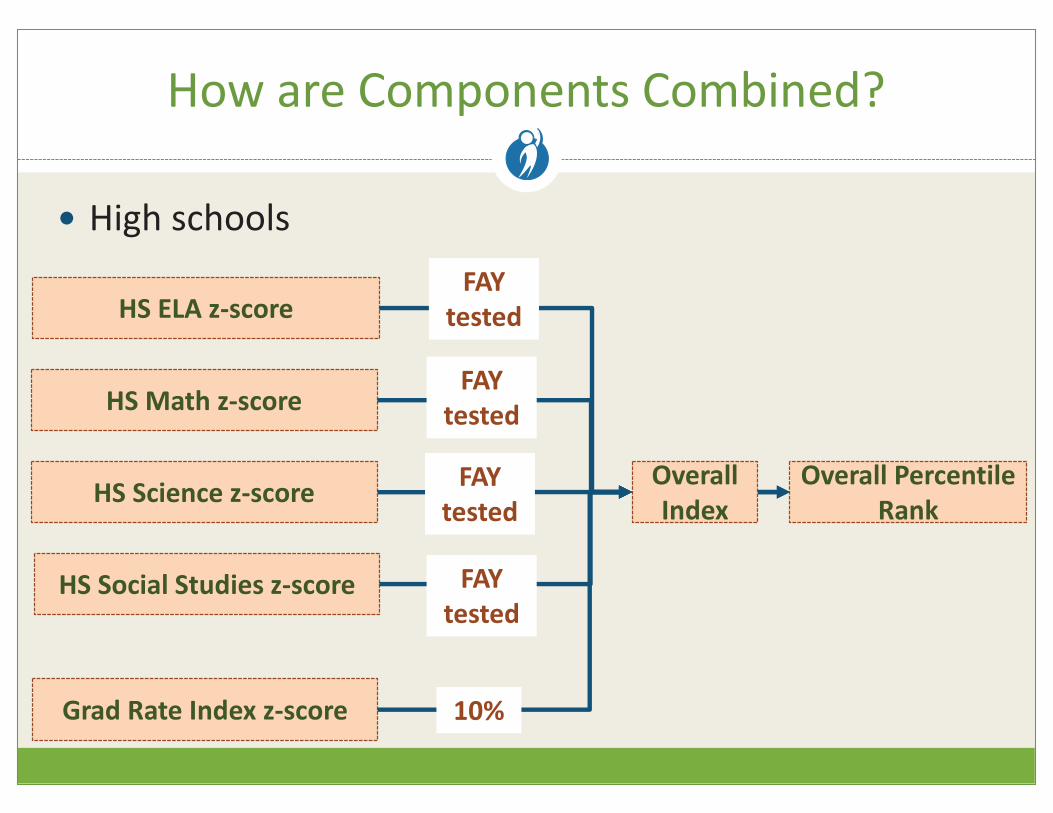
How are Components Combined?
� High schools
HS Social Studies z-score
Overall
Index
Overall Percentile
Rank
HS ELA z-score
HS Math z-score
HS Science z-score
Grad Rate Index z-score 10%
FAY
tested
FAY
tested
FAY
tested
FAY
tested
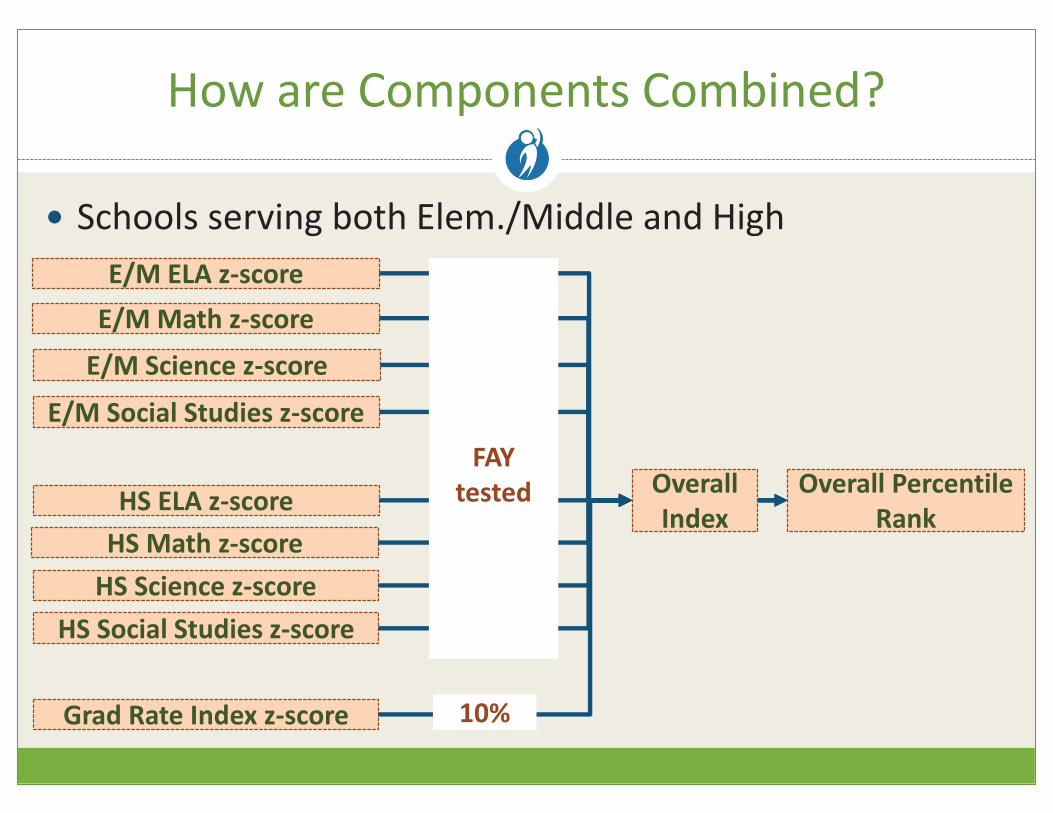
How are Components Combined?
� Schools serving both Elem./Middle and High
HS Science z-score
Overall
Index
Overall Percentile
Rank
E/M ELA z-score
E/M Science z-score
HS ELA z-score
Grad Rate Index z-score
E/M Math z-score
E/M Social Studies z-score
HS Math z-score
HS Social Studies z-score
10%
FAY
tested
Achievement Gap
Ranking
Reasons for A Separate Gap Ranking
� Produces a separate gap ranking by capturing the
composite achievement gap among all tested subjects to
a percentile rank.
� Schools where nearly all students had low achievement
and low improvement were sometimes not identified as
Priority schools because since nearly all students had low
achievement and low improvement their gap was small
and their TTB rank was artificially inflated.
Achievement Gap Ranking Overview
� Statewide percentile ranking of most schools
� Includes content areas of ELA and Math
� Uses only Full Academic Year (FAY) students
� Uses two-year averaging for increased stability

Which schools receive a ranking?
� Schools with 30 or more full academic year (FAY) students
in the two most recent years in at least two state-tested
content areas
� Some schools do not receive a ranking if they have:
¡ Too few FAY students
¡ Only one year of data
Achievement Gap Components
� Achievement Gap ranking has only one component:
Within-School Achievement Gap
� This is a measure of the average gap between the
schools Bottom 30% and Top 30% of students
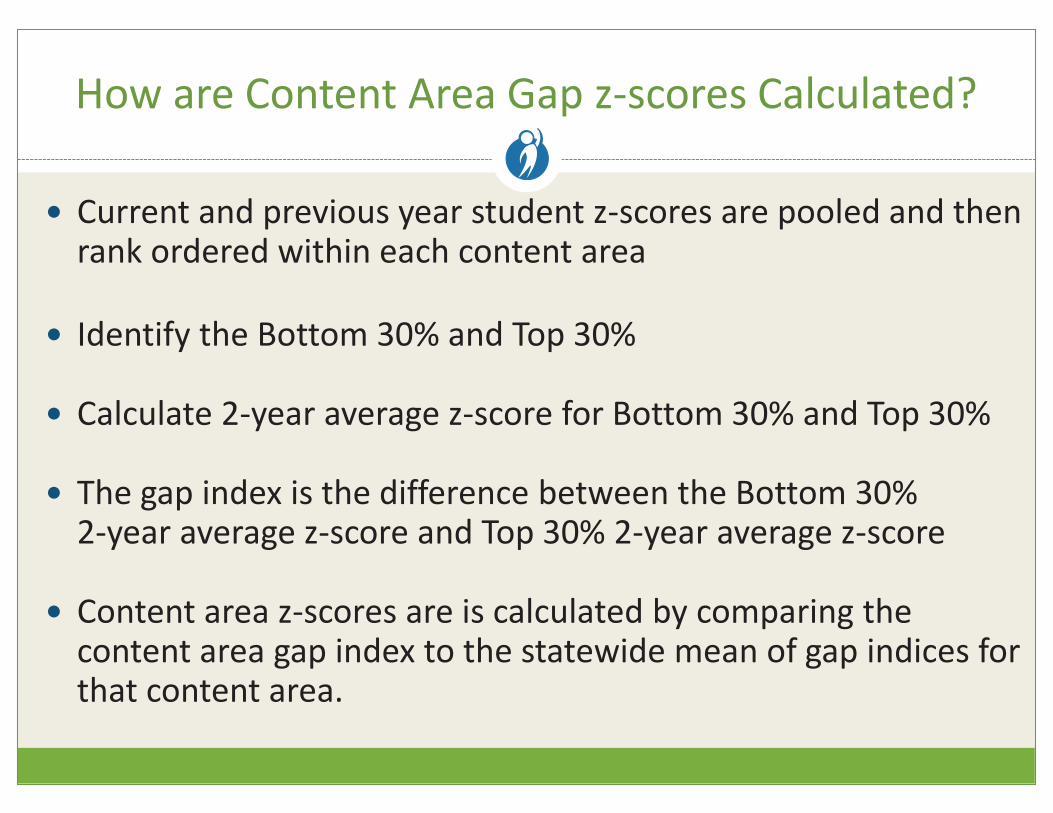
How are Content Area Gap z-scores Calculated?
� Current and previous year student z-scores are pooled and thenrank ordered within each content area
� Identify the Bottom 30% and Top 30%
� Calculate 2-year average z-score for Bottom 30% and Top 30%
� The gap index is the difference between the Bottom 30% 2-year average z-score and Top 30% 2-year average z-score
� Content area z-scores are is calculated by comparing the content area gap index to the statewide mean of gap indices for that content area.
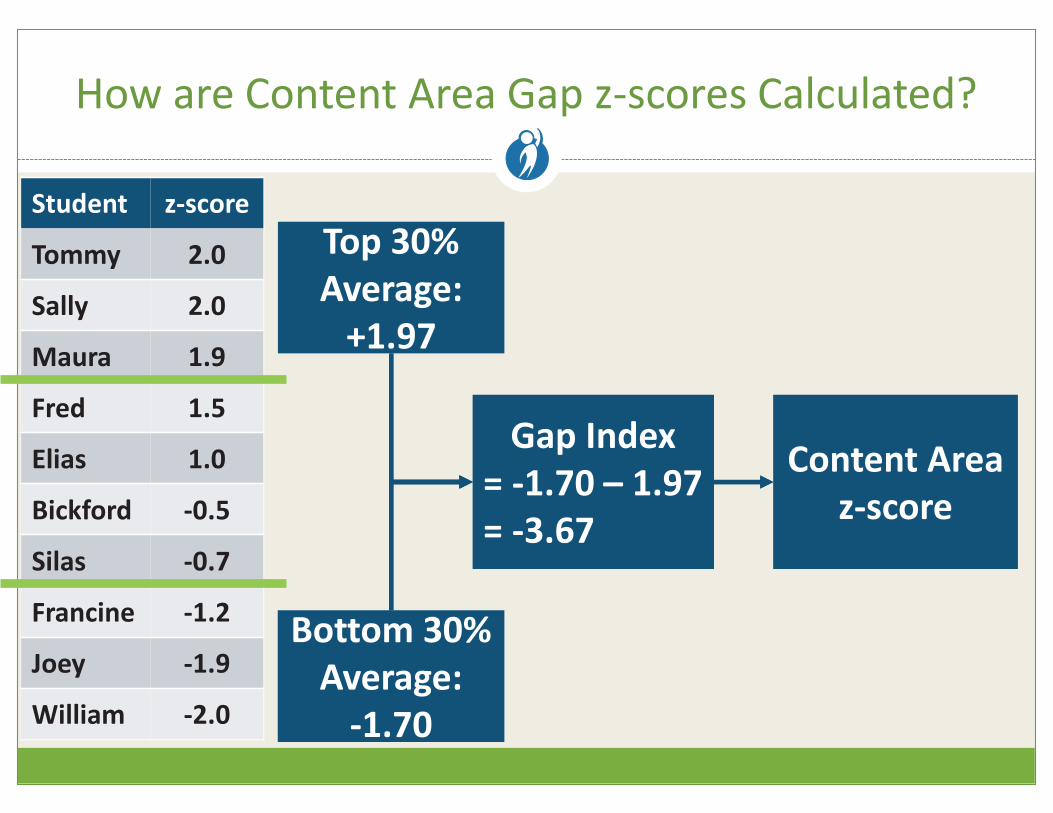
How are Content Area Gap z-scores Calculated?
Top 30%
Average:
+1.97
Bottom 30%
Average:
-1.70
Gap Index
= -1.70 – 1.97
= -3.67
Content Area
z-score
Student z-score
Tommy
Sally
Maura
2.0
2.0
1.9
Fred 1.5
Elias 1.0
Bickford -0.5
Silas -0.7
Francine -1.2
Joey
William
-1.9
-2.0
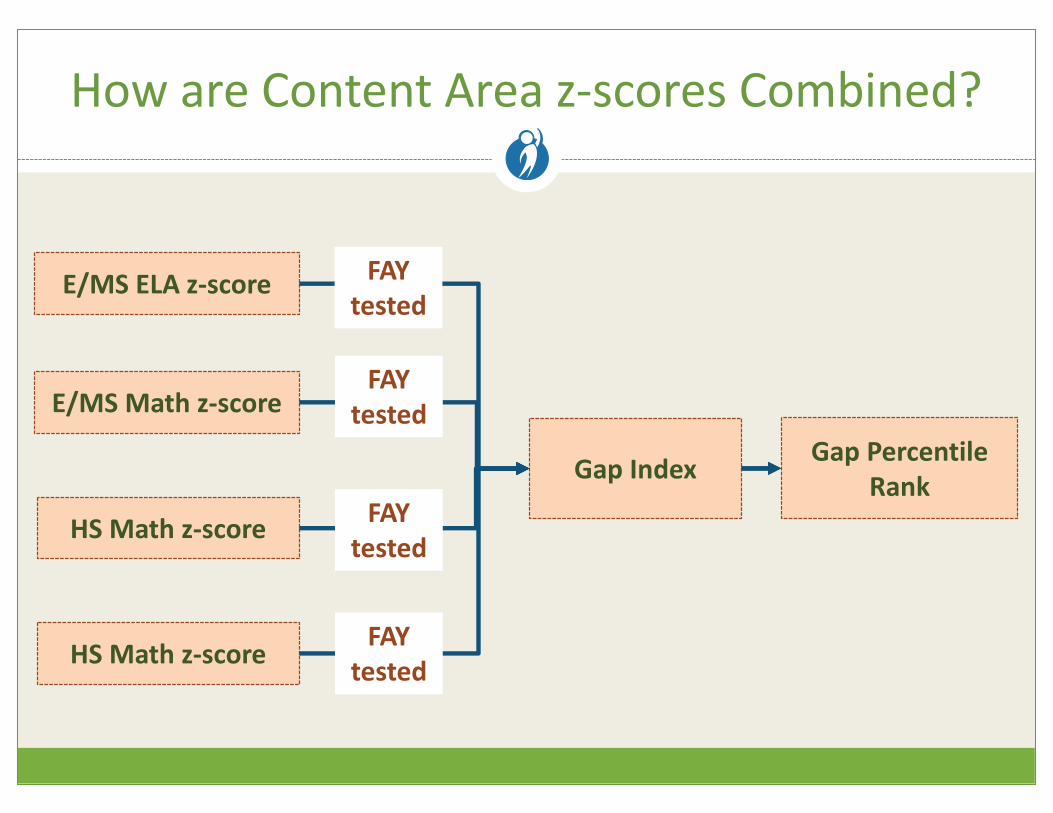
How are Content Area z-scores Combined?
Gap IndexGap Percentile
Rank
E/MS ELA z-score
HS Math z-score
HS Math z-score
E/MS Math z-score
FAY
tested
FAY
tested
FAY
tested
FAY
tested
� www.mi.gov/ttb - Historical lists/data, presentations, and
documentation for TTB, Priority, Focus, Reward.
� www.mi.gov/baa-accountability - Student Growth
Percentile (SGP) and general accountability supports..
� www.mi.gov/schoolscorecard - Scorecard guide, FAQs,
proficiency targets, and historical lists/data.
� http://www.mi.gov/baa-secure - New Secure Site.
Available to authorized users only.
� https://www.mischooldata.org - Public portal.
Helpful Links

Questions? Comments?
We’re here to help!
Ask us today by contacting:
-OR- (877) 560-8378


![[SIGNED] - TTB](https://img.pdfslide.net/doc/110x75/62895d39293cd8020f563c68/signed-ttb.jpg)