Embed Size (px)
Citation preview

Topic 10 - Linear Regression
• Least squares principle - pages 301 – 309• Hypothesis tests/confidence
intervals/prediction intervals for regression - pages 309 - 315

Regression• How much should you pay for a house?• Would you consider the median or mean
sales price in your area over the past year as a reasonable price?
• What factors are important in determining a reasonable price?– Amenities– Location– Square footage
• To determine a price, you might consider a model of the form:
Price = f(square footage) +

Scatter plots• To determine the proper functional relationship
between two variables, construct a scatter plot.• For the home sales data below, what sort of
functional relationship exists between Price and SQFT (square footage)?
Simple linear regression
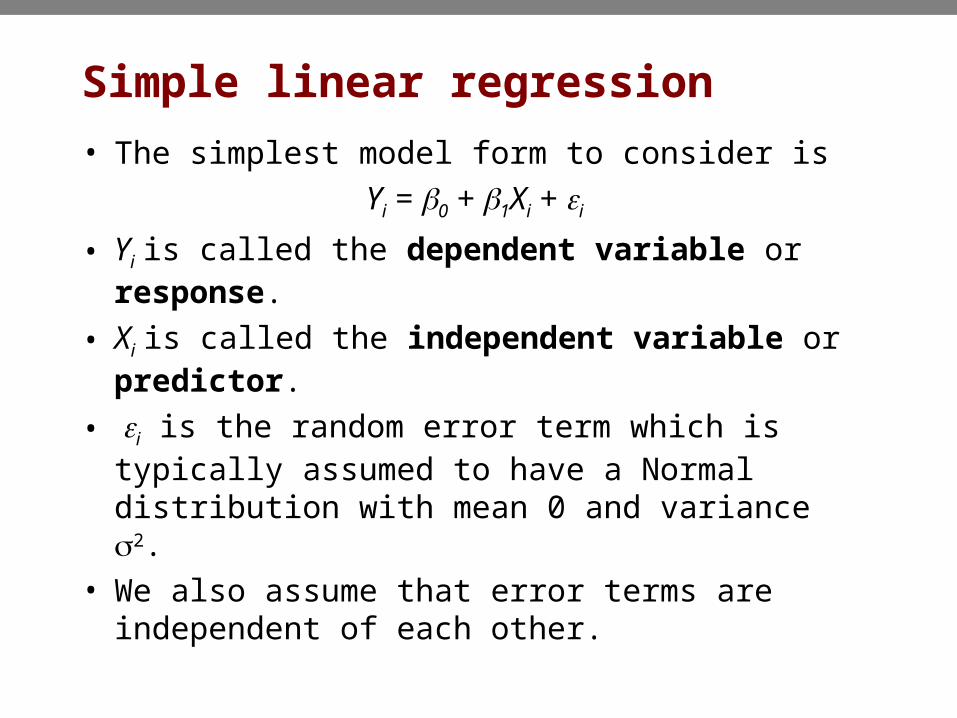
• The simplest model form to consider isYi = 0 + 1Xi + i
• Yi is called the dependent variable or response.
• Xi is called the independent variable or predictor.
• i is the random error term which is typically assumed to have a Normal distribution with mean 0 and variance 2.
• We also assume that error terms are independent of each other.

Least squares criterion
• If the simple linear model is appropriate then we need to estimate the values 0 and 1.
• To determine the line that best fits our data, we choose the line that minimizes the sum of squared vertical deviations from our observed points to the line.
• In other words, we minimize
20 1
1
( )n
i ii
Q Y X

Least squares estimators

Least squares estimators

Home sales example
• For the home sales data, what are least squares estimates for the line of best fit for Price as a function of SQFT?

Inference• Often times, inference for the slope
parameter, 1, is most important.
• 1 tells us the expected change in Y per unit change in X.
• If we conclude that 1 equals 0, then we are concluding that there is no linear relationship between Y and X.
• If we conclude that 1 equals 0, then it makes no sense to use our linear model with X to predict Y.
• has a Normal distribution with a mean of 1 and a variance of .
1̂2 2
1
/ ( )n
ii
X X
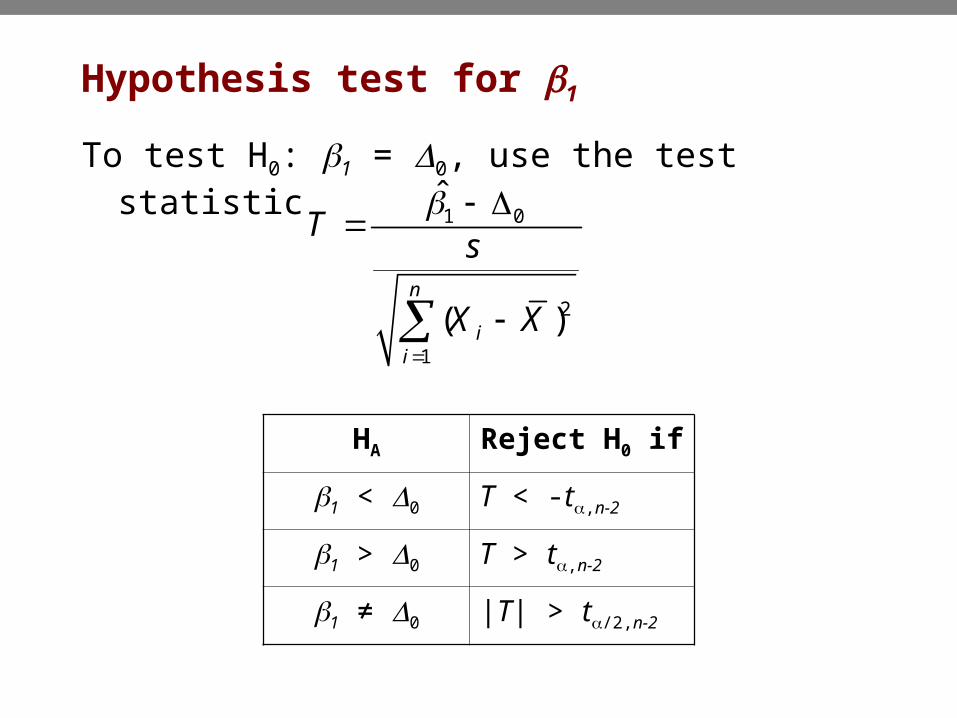
Hypothesis test for 1
To test H0: 1 = 0, use the test statistic
1 0
2
1
ˆ
( )n
ii
Ts
X X
HA Reject H0 if
1 < 0 T < -t,n-2
1 > 0 T > t,n-2
1 ≠ 0 |T| > t/2,n-2
Home sales example
• For the home sales data, is the linear relationship between Price and SQFT significant?

Confidence interval for 1
• A (1-)100% confidence interval for 1 is
• For the home sales data, what is a 95% confidence interval for the expected increase in price for each additional square foot?
21 / 2, 2
1
ˆ / ( )n
n ii
t s X X

Confidence interval for mean response• Sometimes we want a confidence interval for
the average (expected) value of Y at a given value of X = x*.
• With the home sales data, suppose a realtor says the average sales price of a 2000 square foot home is $120,000. Do you believe her?
• has a Normal distribution with a mean of 0 + 1x* and a variance of
*0 1
ˆ ˆx
* 22
2
1
1 ( )
( )n
ii
x Xn X X
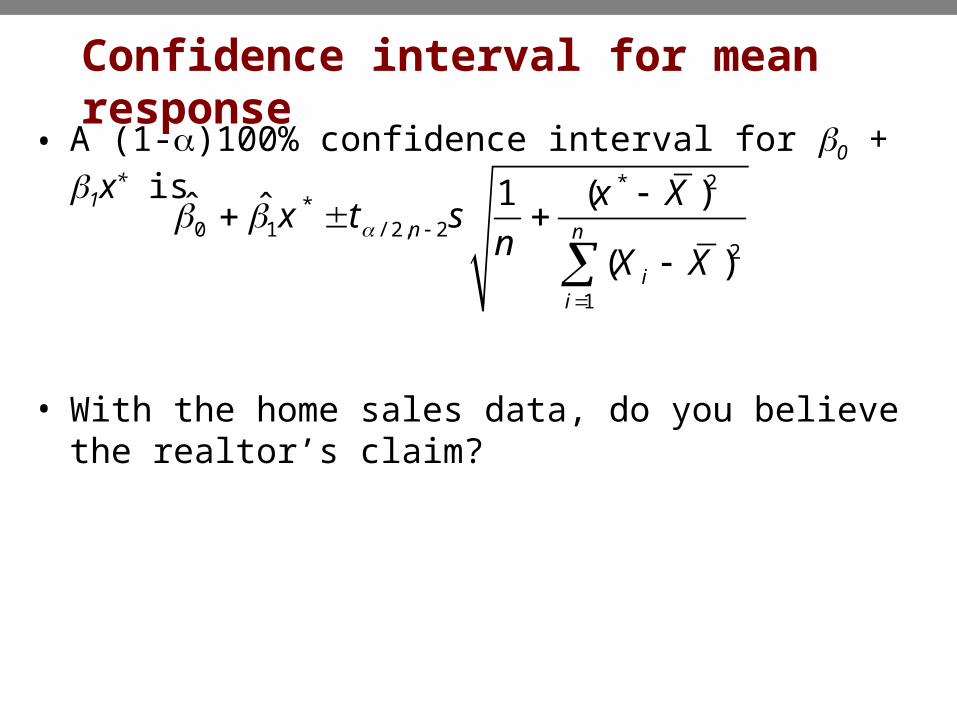
Confidence interval for mean response
• A (1-)100% confidence interval for 0 + 1x* is
• With the home sales data, do you believe the realtor’s claim?
* 2*
0 1 / 2, 22
1
1 ( )ˆ ˆ
( )n n
ii
x Xx t s
n X X

Prediction interval for a new response• Sometimes we want a prediction interval for a new value
of Y at a given value of X = x*.• A (1-)100% prediction interval for Y when X = x* is
• With the home sales data, what is a 95% prediction interval for the amount you will pay for a 2000 square foot home?
* 2*
0 1 / 2, 22
1
1 ( )ˆ ˆ 1( )
n n
ii
x Xx t s
n X X
Extrapolation
• Prediction outside the range of the data is risky and not appropriate as these predictions can be grossly inaccurate. This is called extrapolation.
• For our home sales example, the prediction formula was developed for homes that were less than 3750 square feet, is it appropriate to use the regression model to predict the price of a home that is 5000 square feet?
Correlation• The correlation coefficient, r, describes the direction
and strength of the straight-line association between two variables.
• We will use StatCrunch to calculate r and focus on interpretation.
• If r is negative, then the association is negative. (A car’s value vs. its age)
• If r is positive, then the association is positive. (Height vs. weight)
• r is always between –1 and 1 (-1 < r < 1).– At –1 or 1, there is a perfect straight line relationship.– The closer to –1 or 1, the stronger the relationship.– The closer to 0, the weaker the relationship.
• Understanding Correlation• Correlation by eye

Home sales example• For the home sales data, consider the
correlation between the variables.

Correlation and regression
• The square of the correlation, r2, is the proportion of variation in the value of Y that is explained by the regression model with X.
• 0 r2 1 always. The closer r2 is to 1, the better our model fits the data and the more confident we are in our prediction from the regression model.
• For the home sales example, r2 = 0.7137 between price and square footage, so about 71% of the variation in price is due to square footage. Other factors are responsible for the remaining variation.
Association and causation
• A strong relationship between two variables does not always mean a change in one variable causes changes in the other.
• The relationship between two variables is often due to both variables being influenced by other variables lurking in the background.
• The best evidence for causation comes from properly designed randomized comparative experiments.
Does smoking cause lung cancer?• Unethical to investigate this relationship with a
randomized comparative experiment.• Observational studies show strong association
between smoking and lung cancer.• The evidence from several studies show
consistent association between smoking and lung cancer.
• More and longer cigarettes smoked, the more often lung cancer occurs.
• Smokers with lung cancer usually began smoking before they developed lung cancer.
• It is plausible that smoking causes lung cancer• Serves as evidence that smoking causes lung
cancer, but not as strong as evidence from an experiment.