Embed Size (px)
Citation preview

Topic 2 part 2 page 1
Topic 2 Part II:
Extending the Theory of Consumer Behaviour 1) The Shape of the Consumer’s Demand Function I_____ Effect Substitution Effect Slope of the D_____ Function
2) Consumer Surplus Marginal Value
Topic 2 part 2 page 2
The Shape of the Consumer’s Demand Function Recall, consumers have different __________ demand functions and indifference curves for goods. If the price of a good is increased, some consumers will reduce their ___________ of the good by a large amount, while other consumers will reduce their consumption by a modest amount. This is because consumers have different preferences and income levels.
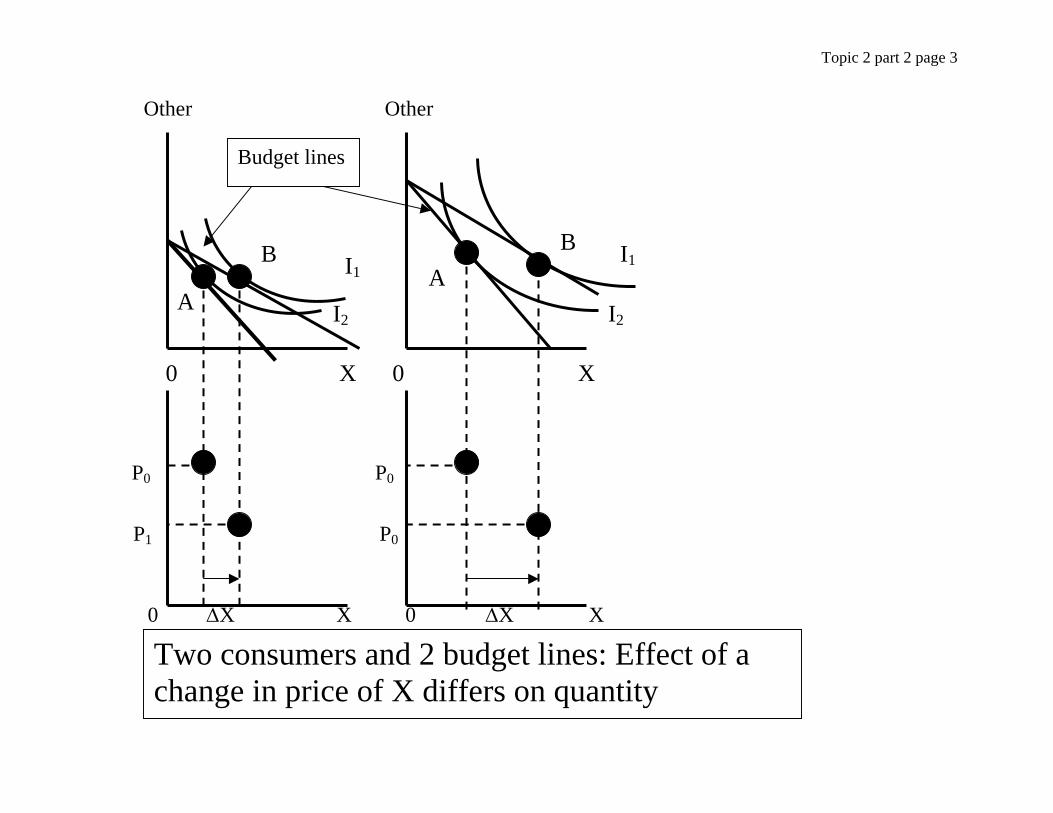
Topic 2 part 2 page 3
Other Other 0 X 0 X P0 P0 P1 P0 0 ΔX X 0 ΔX X
I2A
B BAI1
I1
I2
Budget lines
Two consumers and 2 budget lines: Effect of a change in price of X differs on quantity
Topic 2 part 2 page 4
In order to examine the factors that explain the different responses these differences create, we will decompose the effects into what is referred to as the i_____ effect and the substitution effect. Introduction: Suppose the price a good ‘X’ decreases. How does the consumer respond? A price decrease in X can be viewed as a _______ in income formerly used to purchase units of X. These ‘$’s’ represent an increase in disposable _____that can be used to purchase more of good X or more of other goods.

Topic 2 part 2 page 5
This increase in disposable income can be graphically illustrated as a _____ outward of the budget constraint. As a result of the shifting budget constraint, the consumer can select a new market basket on a higher ____________ curve. So: “The change in quantity demanded of good X due to the change in money
income is the ______ effect.
Topic 2 part 2 page 6
But, a price cut also has a substitution effect that must be considered. With a price cut, good X is now cheaper ________ to other goods than before. The consumer will now demand more units of the cheaper good and fewer units of other goods while remaining at the same level of satisfaction (same indifference curve). The substitution effect measures the change in the quantity demanded due to a change in the relative price of X
holding _____ constant.
Topic 2 part 2 page 7
Hence we assume the consumer separates the ____ change in the quantity demanded of X caused by a price change into these two effects.

Topic 2 part 2 page 8
The Income Effect: ______ Good Other B S1 A S0 X0 X1 Units of X
The diagram illustrates how a consumer’s consumption choice changes when income has _________. The initial budget constraint is labelled BL0.
BL0 I0
I1
BL1
I-C Curve

Topic 2 part 2 page 9
The consumer consumes market basket A where his indifference curve I0 is tangent to the budget line. At this point the MRS = the slope of the budget constraint and the consumer consumes X0 units of good X.
If the consumer’s income increases to BL1, there will be a parallel _____ outward by budget line. The consumer can now purchase market bundle B on the higher indifference curve I1, which is tangent to the higher budget constraint. In this case, more of ____ goods are purchased.
Topic 2 part 2 page 10
When the quantity demanded of a good changes in the ____ direction as the change in income, the good is referred to as a n_____ good. Note: For every level of income there is point of tangency
between the budget constraint and an indifference curve. By connecting these points, we form what is known as the ______-___________ curve.
E____ curve illustrates the relationship between the quantity demanded of good X and the income of the consumer when ______ are held constant. With a normal good, the Engel curve has a ________ slope.

Topic 2 part 2 page 11
Units of X X1 X0 Income M0 M1
Examples: Fruit Fresh meat
Engel Curve

Topic 2 part 2 page 12
The Income Effect: I_______ Good Other S1 B S0 A X1 X0 Units of X
The diagram illustrates how a consumer’s consumption choice changes when income has increased. The initial budget constraint is labelled BL0.
BL0
I0
I1
BL1
I-C Curve
Topic 2 part 2 page 13
The consumer consumes market basket A where his indifference curve I0 is tangent to the budget line.
At this point the MRS = the _____ of the budget constraint and the consumer consumes X0 units of good X. If the consumer’s income increases to BL1, there will be a parallel shift outward by the budget line. The consumer can now purchase market bundle B on the higher indifference curve I1, which is tangent to the higher budget constraint. In this case, l___ of good X and more of other goods are purchased.

Topic 2 part 2 page 14
When the quantity demanded of a good changes in the ________ direction as the change in income, the good is referred to as an I______ good. With an inferior good, the Engel curve has a ________ slope. Units of X X0 X1 Income M0 M1
Engel Curve
Topic 2 part 2 page 15
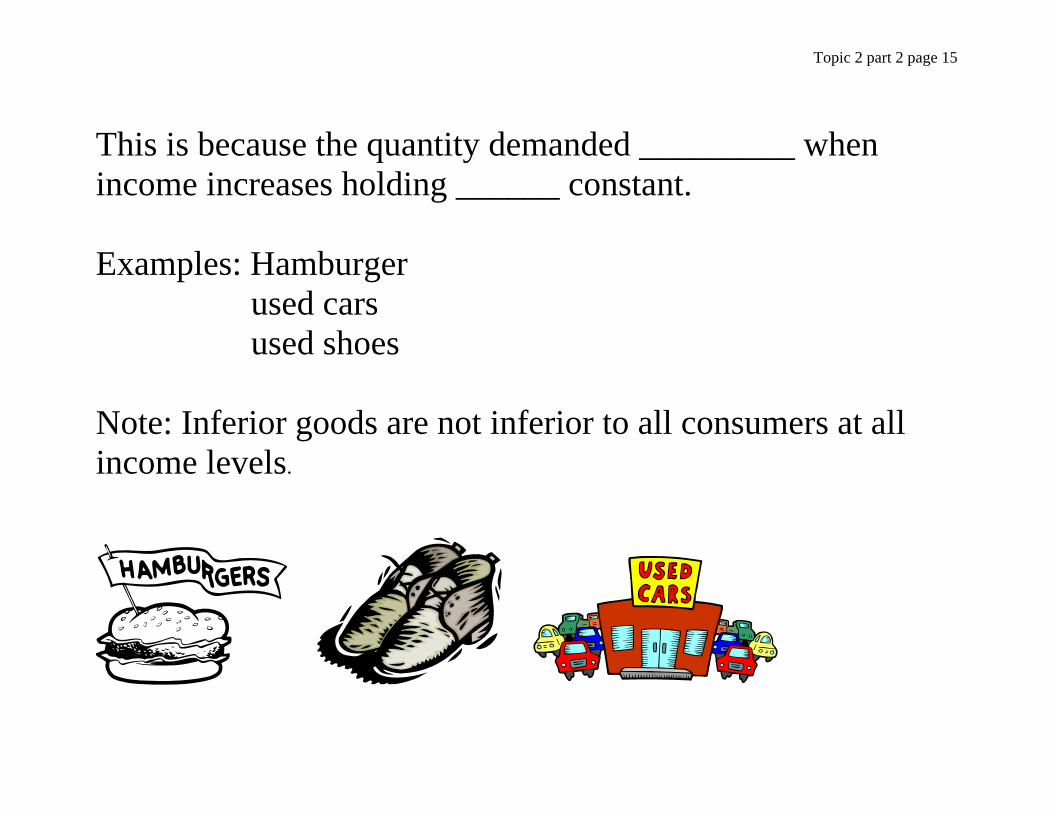
This is because the quantity demanded _________ when income increases holding ______ constant. Examples: Hamburger used cars used shoes Note: Inferior goods are not inferior to all consumers at all income levels.

Topic 2 part 2 page 16
Income Elasticity of Demand Income elasticity of demand measures the response of a percentage change in the quantity ________ due to a percentage change in ______. The point income elasticity of demand:
E
IncomeM
QM
MQM
x
X x
X
= = •
Δ
ΔΔΔ
The point measure of income elasticity is the percentage change in ________ demanded divided by the percentage change in ______.
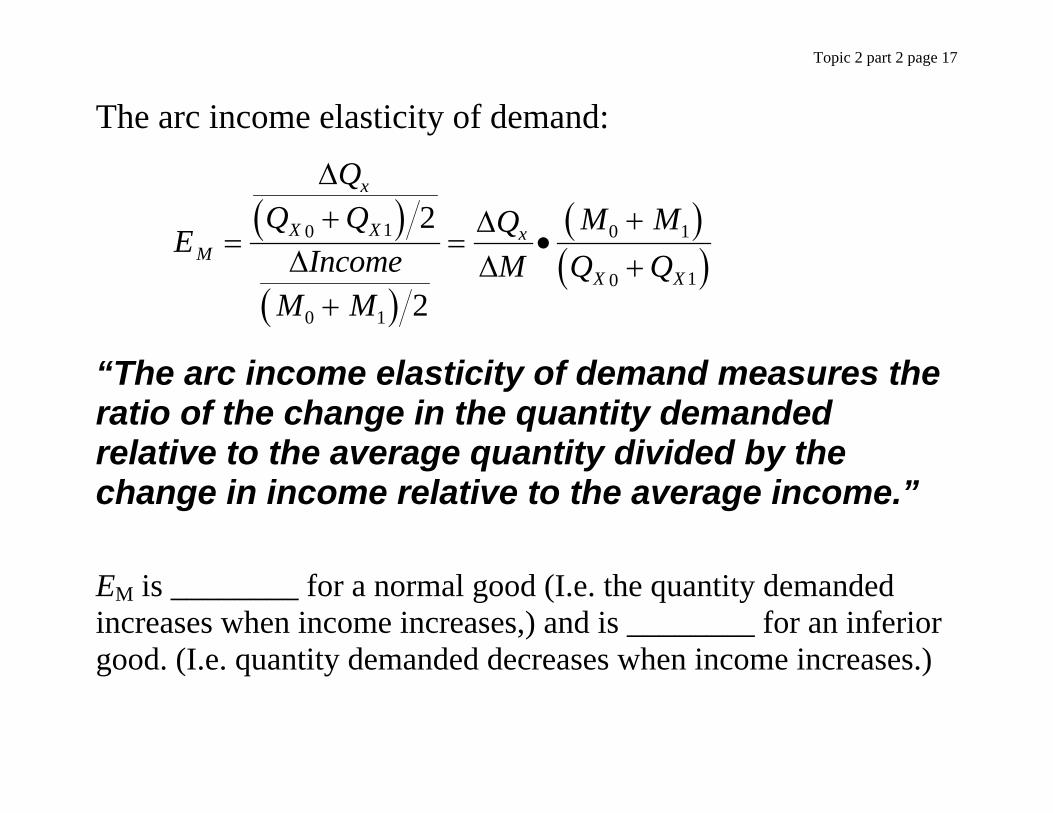
Topic 2 part 2 page 17
The arc income elasticity of demand:
( )
( )
( )( )E
QQ Q
IncomeM M
QM
M MQ QM
x
X X x
X X
=+
+
= •++
Δ
ΔΔΔ
0 1
0 1
0 1
0 1
2
2
“The arc income elasticity of demand measures the ratio of the change in the quantity demanded relative to the average quantity divided by the change in income relative to the average income.” EM is ________ for a normal good (I.e. the quantity demanded increases when income increases,) and is ________ for an inferior good. (I.e. quantity demanded decreases when income increases.)
Topic 2 part 2 page 18
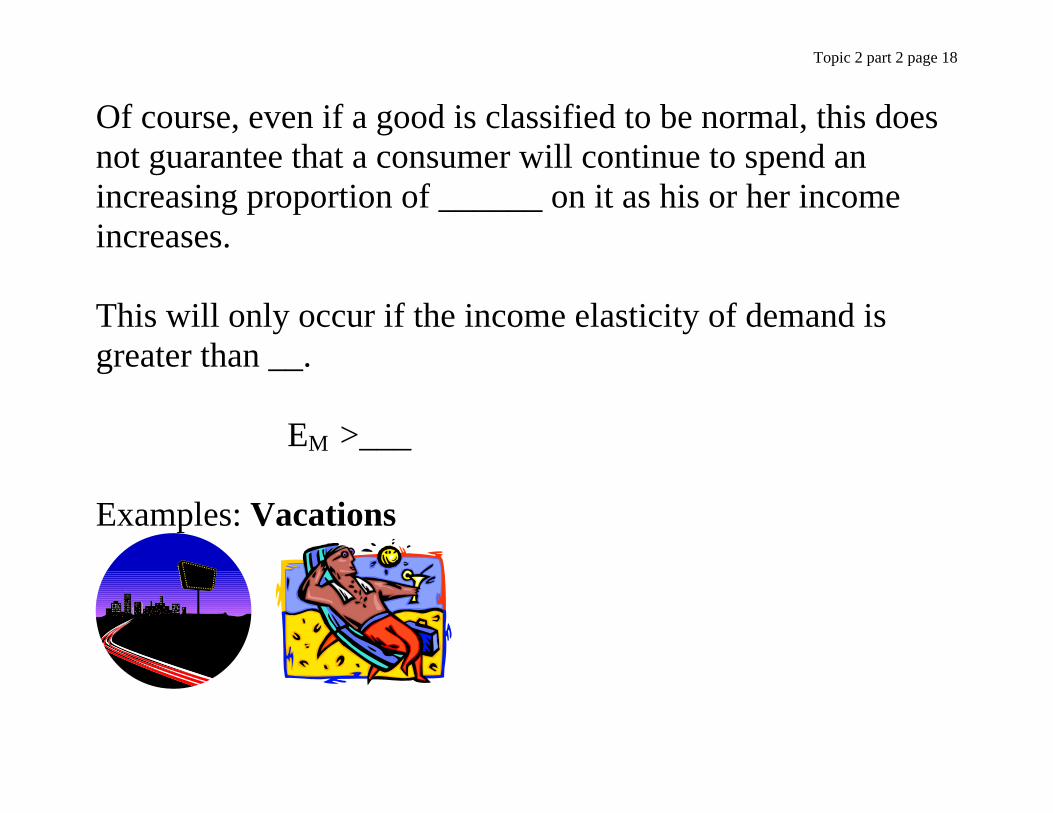
Of course, even if a good is classified to be normal, this does not guarantee that a consumer will continue to spend an increasing proportion of ______ on it as his or her income increases. This will only occur if the income elasticity of demand is greater than __.
EM >___ Examples: Vacations

Topic 2 part 2 page 19
If the income elasticity of demand is between zero and 1, a good is a ______ good but the consumer spends a decreasing proportion of ______ on it as income rises, assuming that price has remained the same. 0 < EM <1 Examples: food Clothing Soap
Topic 2 part 2 page 20
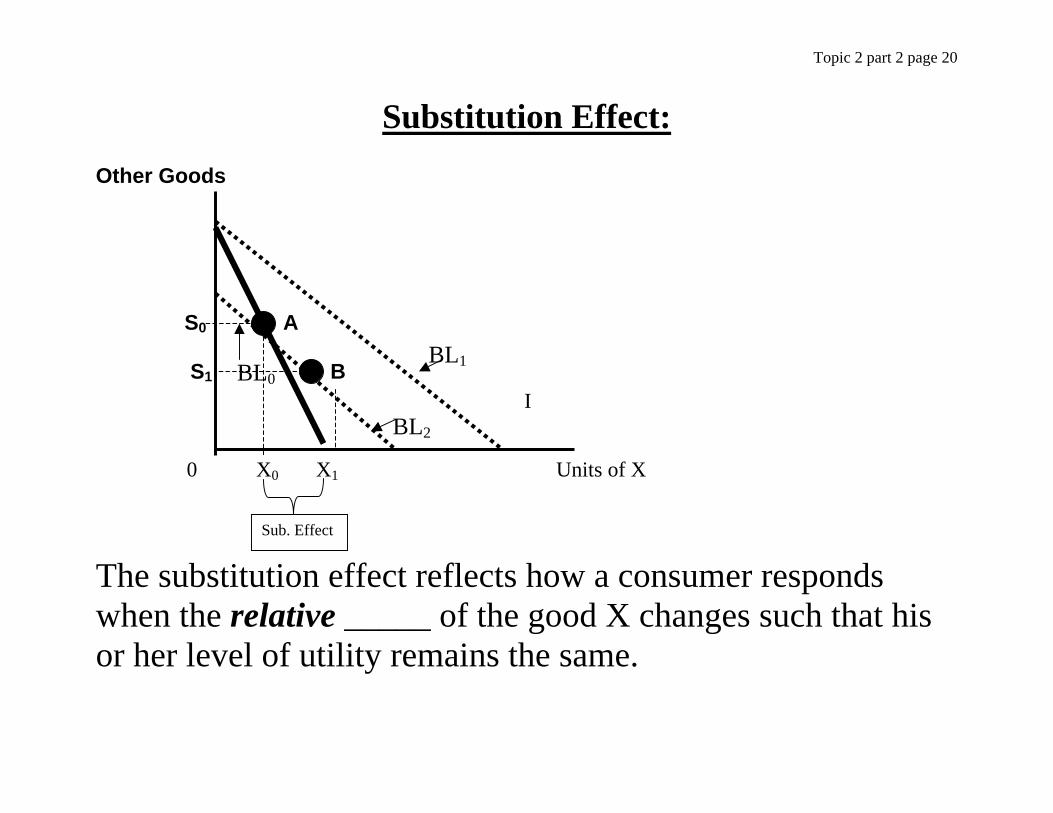
Substitution Effect: Other Goods S0 A S1 B 0 X0 X1 Units of X
The substitution effect reflects how a consumer responds when the relative _____ of the good X changes such that his or her level of utility remains the same.
BL2
BL0 I
BL1
Sub. Effect
Topic 2 part 2 page 21
How to determine the ____ of the substitution effect: If the price of the good X falls, the budget constraint rotates ___ward.
We know that the consumer will purchase a different market basket of goods on a ______ indifference curve. Hence the _______ of the consumer will increase. But, the substitution effect measures the change in the quantity demanded when the relative prices change with utility held ________.
Topic 2 part 2 page 22
In order to keep the consumer on the original indifference curve and maintain the original level of utility, we change money ______ as the price changes by just enough so that the consumer finds a new market basket on the ________ indifference curve where the slope of the new budget constraint equals the slope of the indifference curve. To illustrate, refer to the diagram on the former page. Suppose the initial price of good X is P0. The consumer consumes basket A on indifference curve U0 and purchases X0 units of X.
Topic 2 part 2 page 23
When the price of X falls to P1, the budget line rotates outward and becomes the dashed budget line BL1. If nothing else changes, the consumer will reach a higher level of satisfaction on a higher indifference curve. To stop _______ from increasing, we decrease ______ by just enough to shift the budget line back to ‘I’ until it becomes BL2 where it is tangent to the indifference curve ‘I’ at market basket B. The reduction in the relative price of X causes the consumer to substitute market basket B for market basket A. The quantity of X demanded increases to X1.

Topic 2 part 2 page 24
Since the relative price of X is lower, budget line BL2 is flatter than BL0. The consumer’s response to a relative price decrease in X is to purchase ____ units of good X and spend less on other goods. The sign of the substitution effect is ________ because a change in the relative price of X changes the quantity demanded in the ________ direction.
Topic 2 part 2 page 25
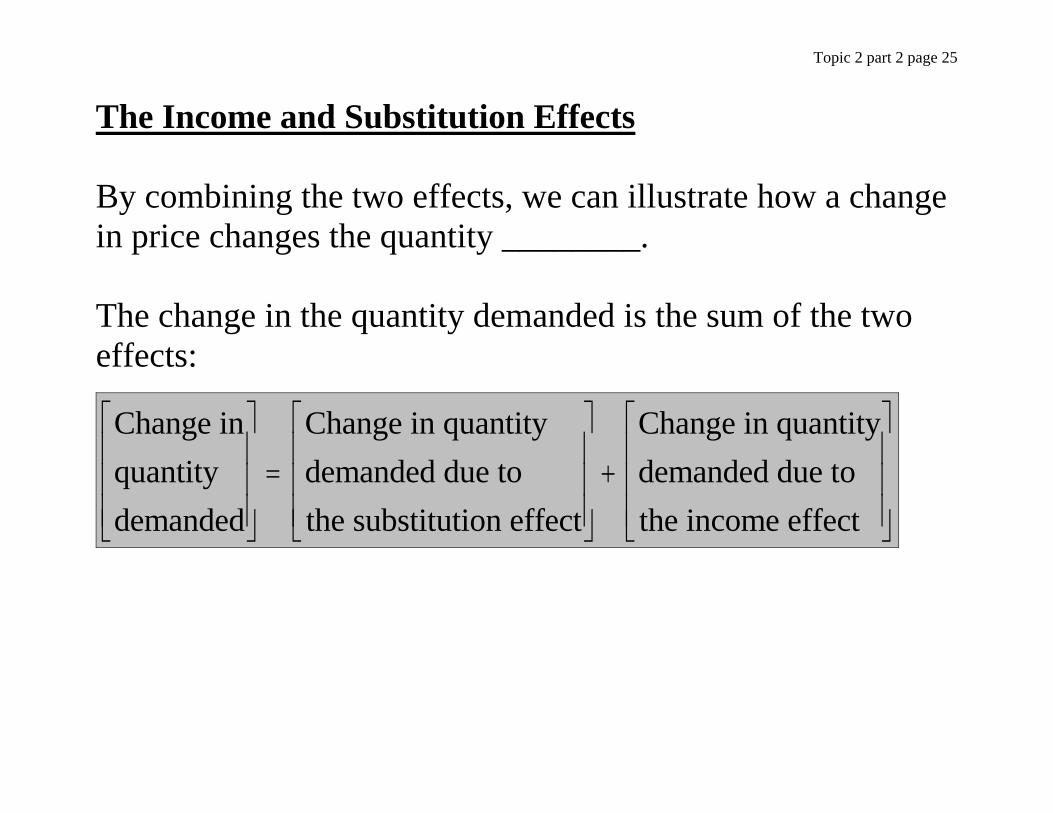
The Income and Substitution Effects By combining the two effects, we can illustrate how a change in price changes the quantity ________. The change in the quantity demanded is the sum of the two effects:
Change inquantitydemanded
Change in quantitydemanded due to the substitution effect
Change in quantitydemanded due to the income effect
⎡
⎣
⎢⎢⎢
⎤
⎦
⎥⎥⎥=
⎡
⎣
⎢⎢⎢
⎤
⎦
⎥⎥⎥+
⎡
⎣
⎢⎢⎢
⎤
⎦
⎥⎥⎥
Topic 2 part 2 page 26
Price Other Goods P2 P1 X1 X2 0 X0 X1 X2 Units of X
BL0
BL2
d
BA
CI1
I0BL1
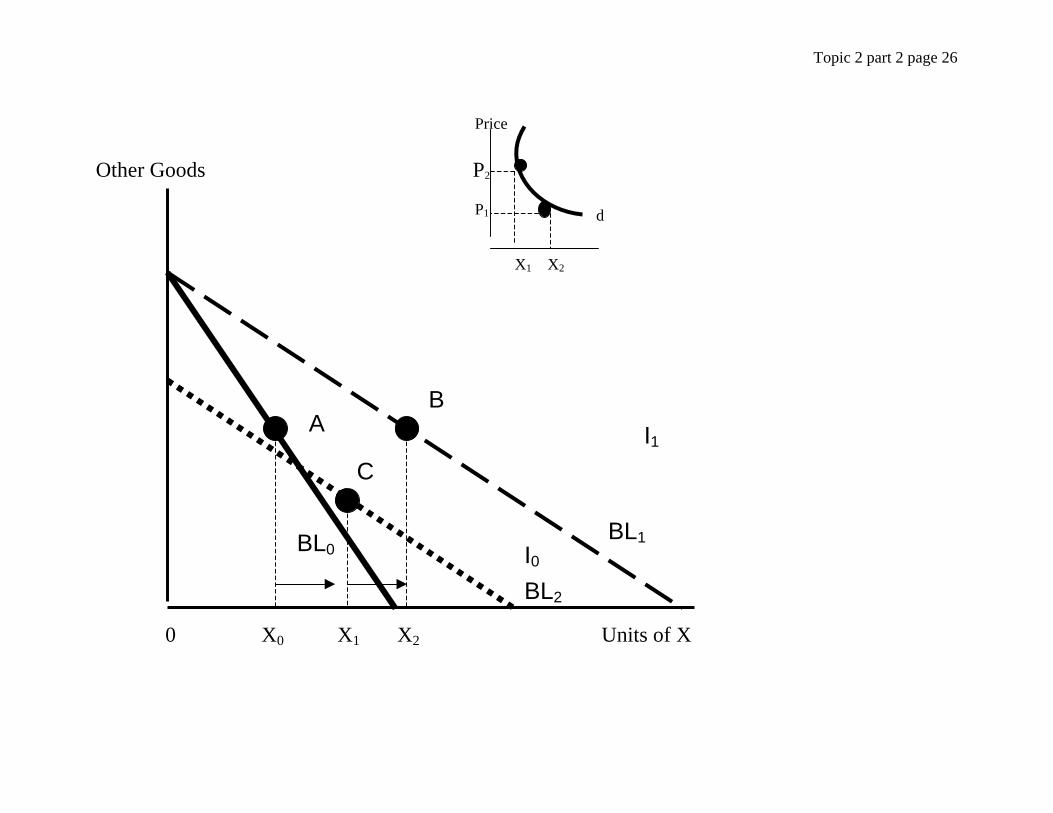
Topic 2 part 2 page 27
The initial budget line is BL0 when income is M0 and the price of X is P0. The consumer maximizes utility by consuming market basket A. X0 units of good X is consumed. When the price of X _________ to P1, the budget line rotates and becomes BL1. The consumer selects market basket B on his highest attainable indifference curve. X2 units of X is consumed. Since the total quantity demanded increases when the price falls, the demand function has a ________ slope. The increase in the quantity demanded is due to the substitution effect and the income effect.
Topic 2 part 2 page 28
To isolate the substitution effect, we decrease the relative price of X and change income so that _______ is unchanged. This is shown as a shift in the budget constraint to BL2. (Parallel shift back that is tangent to the original utility curve I0.) The consumer would consume basket C where the slope of the budget line equals the slope of the indifference curve I0. The substitution effect is the increase in the quantity demanded from X0 to X1 units. The income effect shifts the budget line outward in a parallel fashion from BL2 to BL1. This is because the price reduction frees up additional income to spend.
Topic 2 part 2 page 29
The consumer moves from market basket C to market basket B. The income effect increases the quantity demanded by X2-X1.
Together, the two effects explain why the quantity demanded increases from X0 to X2.
When the good is a normal good, the income effect ________ the substitution effect: when the price falls, the quantity demanded must increase. If the good is a ______ good, a consumer demands more units at a lower price and so the demand function of the consumer has a ________ slope.
Topic 2 part 2 page 30
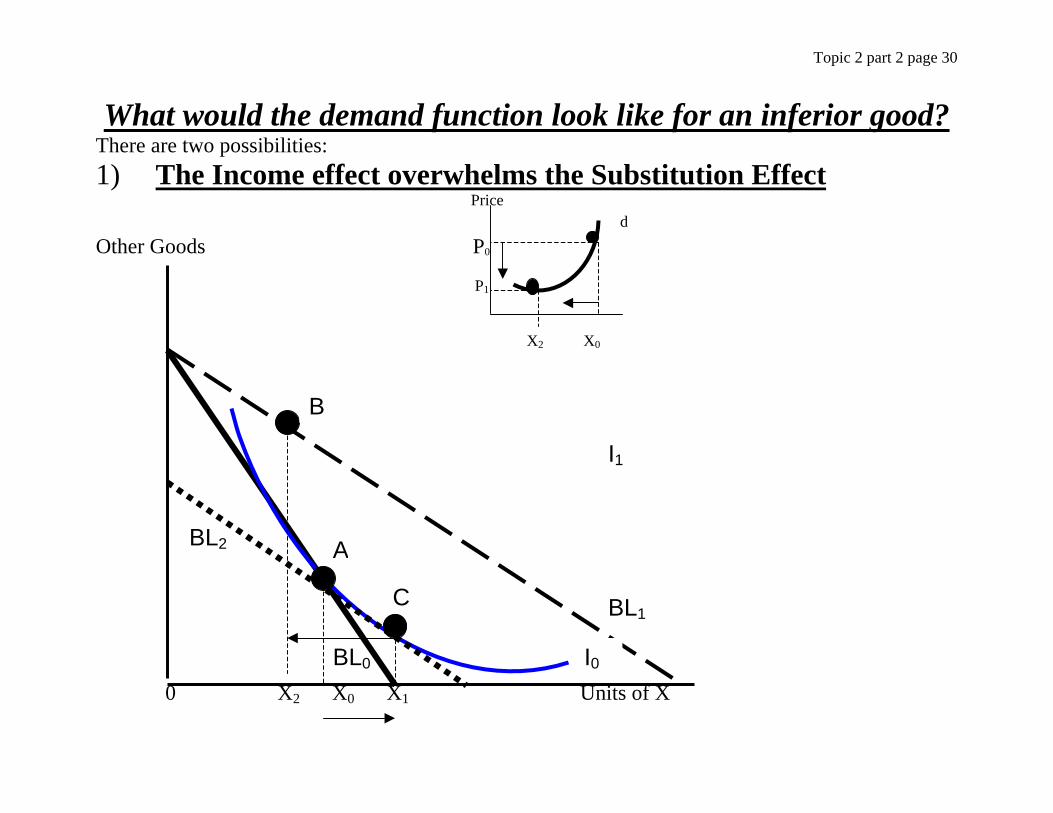
What would the demand function look like for an inferior good? There are two possibilities: 1) The Income effect overwhelms the Substitution Effect Price Other Goods P0 P1 X2 X0 0 X2 X0 X1 Units of X
A
BL0
BL2
d
B
C
I1
I0
BL1
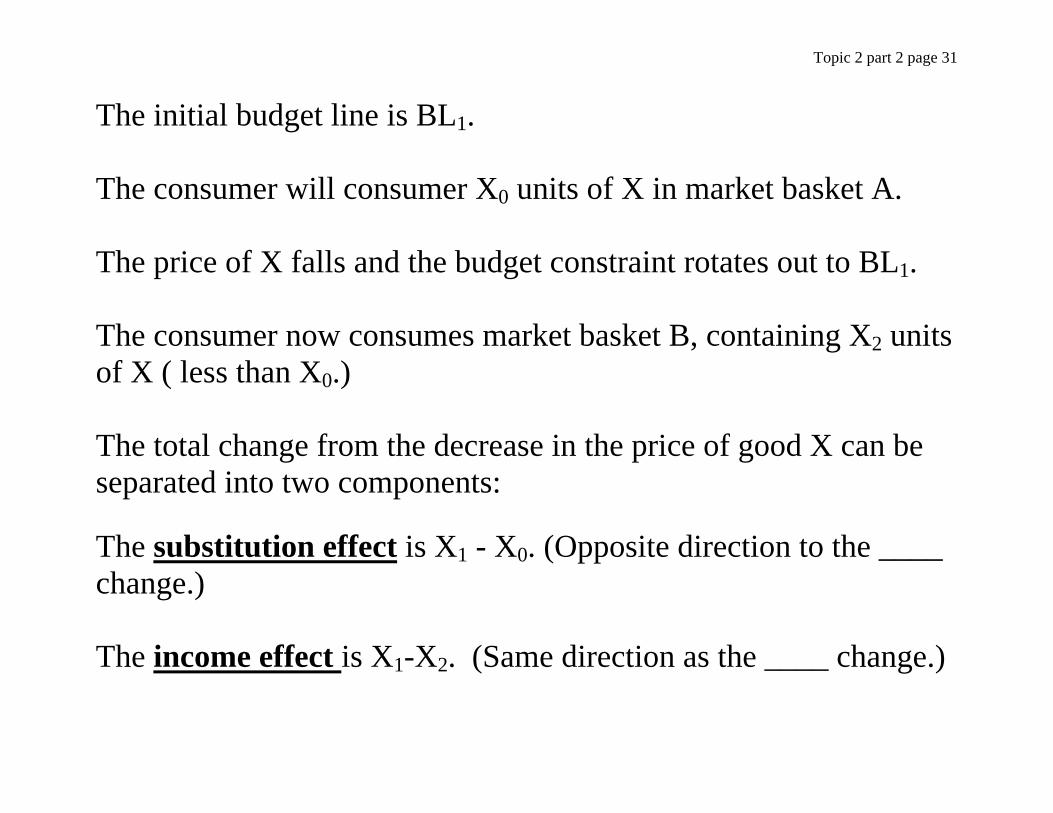
Topic 2 part 2 page 31
The initial budget line is BL1. The consumer will consumer X0 units of X in market basket A. The price of X falls and the budget constraint rotates out to BL1. The consumer now consumes market basket B, containing X2 units of X ( less than X0.) The total change from the decrease in the price of good X can be separated into two components: The substitution effect is X1 - X0. (Opposite direction to the ____ change.) The income effect is X1-X2. (Same direction as the ____ change.)

Topic 2 part 2 page 32
The net effect is a ____ in the quantity demanded due to a fall in price. The consumer’s demand function has a positive slope. This is because the income effect overwhelms the substitution effect. When this occurs, we refer to this good as a G_____ good.
Topic 2 part 2 page 33
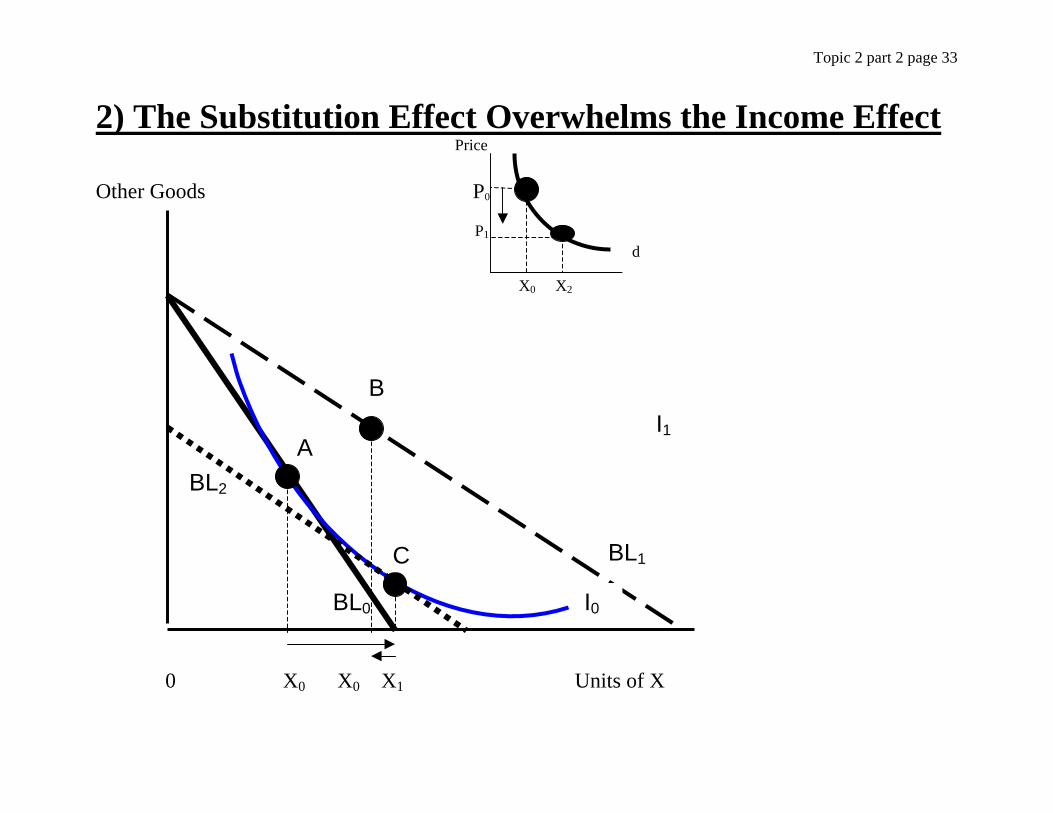
2) The Substitution Effect Overwhelms the Income Effect Price Other Goods P0 P1 X0 X2 0 X0 X0 X1 Units of X
A
BL0
BL2
B
C
I1
I0
BL1
d
Topic 2 part 2 page 34
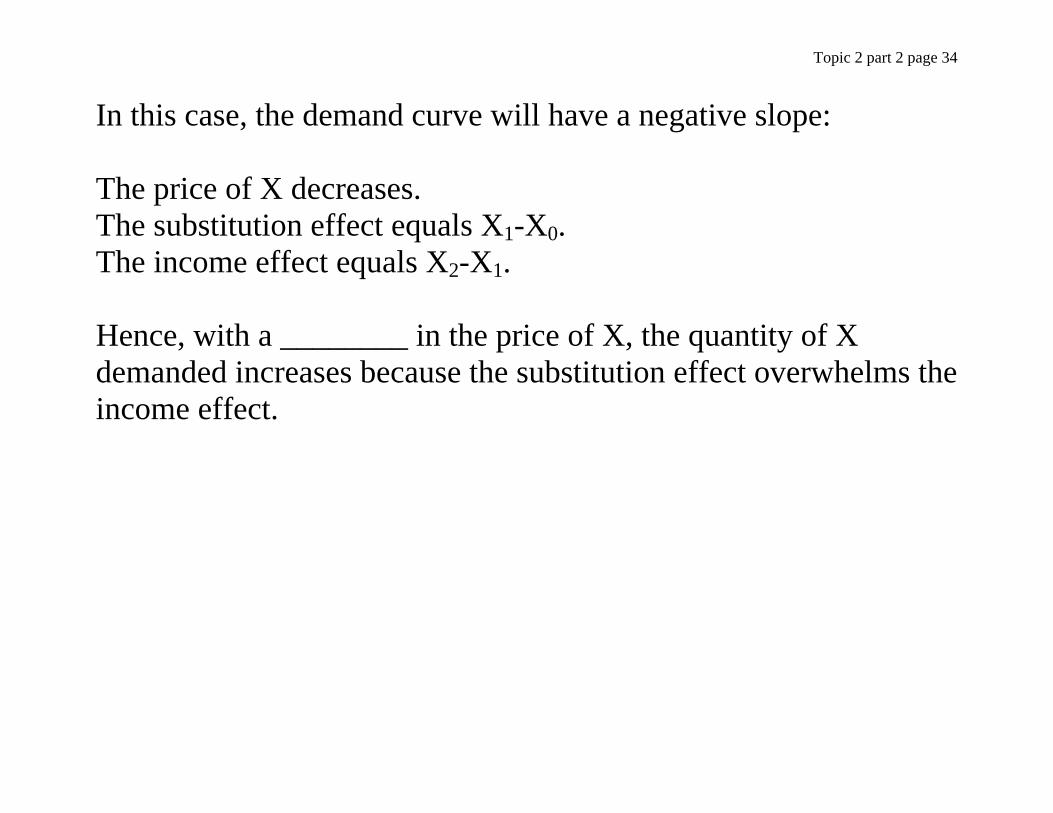
In this case, the demand curve will have a negative slope: The price of X decreases. The substitution effect equals X1-X0. The income effect equals X2-X1. Hence, with a ________ in the price of X, the quantity of X demanded increases because the substitution effect overwhelms the income effect.

Topic 2 part 2 page 35
The Slope of the Demand Function The consumer’s demand function represents the relationship between the quantity demanded and the price of the good with income and other prices held constant; X=d(P) (Individual Demand Function)
The slope of the demand function is ΔΔXP and depends on the
size of the substitution and income effects. So, in order to determine whether a price change will result in a large or small change in the quantity demanded, we need to determine the size of the income or substitution effect.

Topic 2 part 2 page 36
Recall, the substitution effect measures the change in the quantity demanded due to a price change holding utility constant.
This can be expressed as: ΔΔXP U C= .
ΔΔXP can be determined by measuring how the quantity
demanded changes along an indifference curve as the relative price of the good X changes. This quantity will always be negative since the consumer demands more units of a good when its price decreases.
Topic 2 part 2 page 37
The slope of the demand curve also depends on the income effect. So, when will this effect be large? It depends on two factors: 1) The amount of income that is freed up when the price of
the good falls. 2) The number of units the consumer now demands since
income has increased. The income that becomes available per dollar change in price depends on the number of units the consumer is presently consuming.
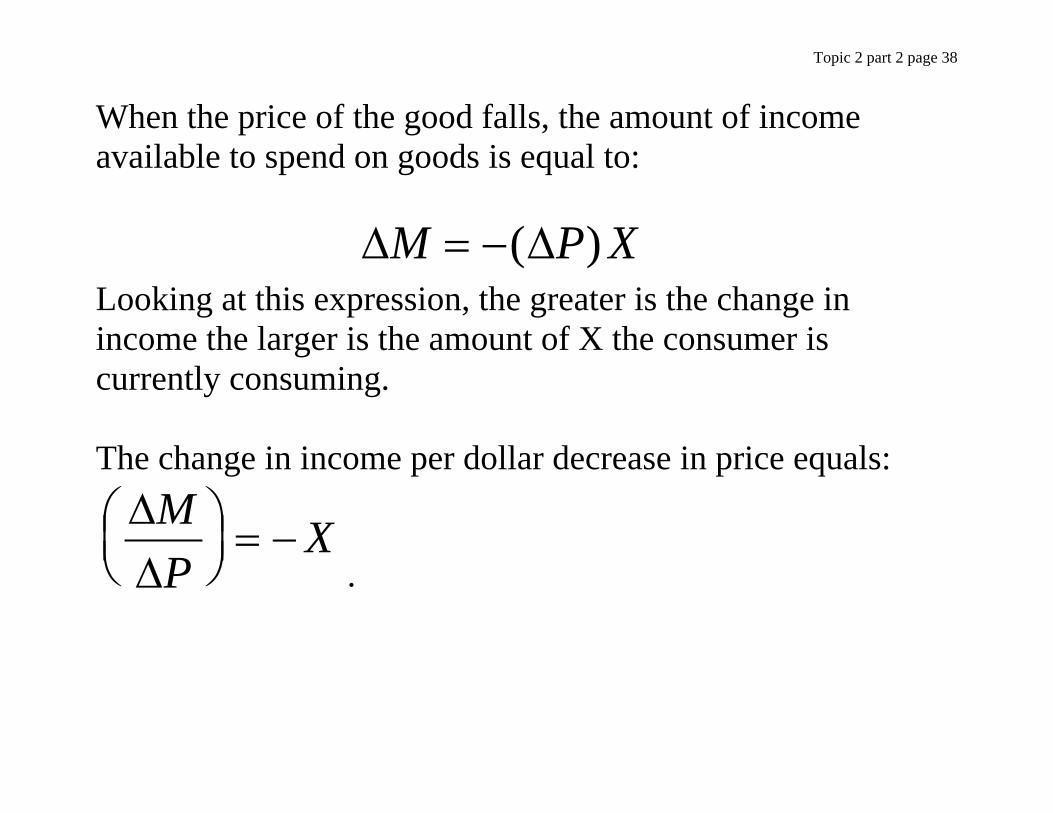
Topic 2 part 2 page 38
When the price of the good falls, the amount of income available to spend on goods is equal to:
Δ ΔM P X= −( ) Looking at this expression, the greater is the change in income the larger is the amount of X the consumer is currently consuming. The change in income per dollar decrease in price equals: ΔΔMP
X⎛⎝⎜
⎞⎠⎟= −
.
Topic 2 part 2 page 39
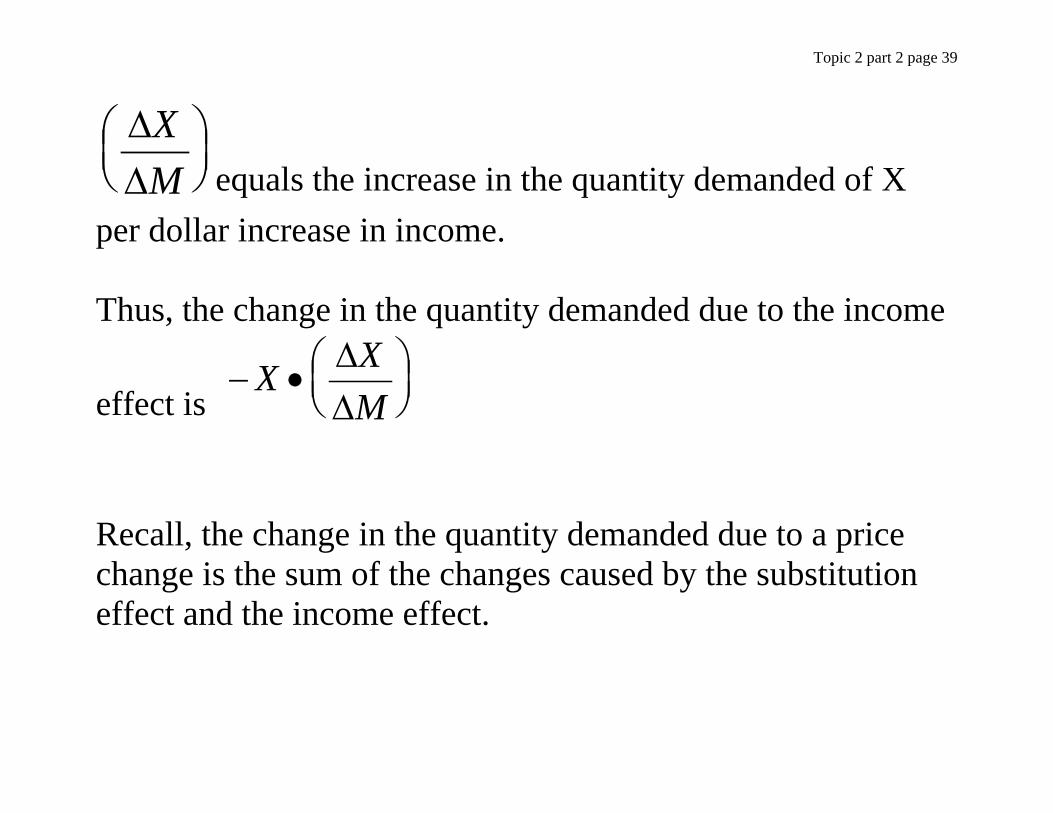
ΔΔ
XM
⎛⎝⎜
⎞⎠⎟ equals the increase in the quantity demanded of X
per dollar increase in income. Thus, the change in the quantity demanded due to the income
effect is − • ⎛
⎝⎜⎞⎠⎟
X XMΔΔ
Recall, the change in the quantity demanded due to a price change is the sum of the changes caused by the substitution effect and the income effect.
Topic 2 part 2 page 40
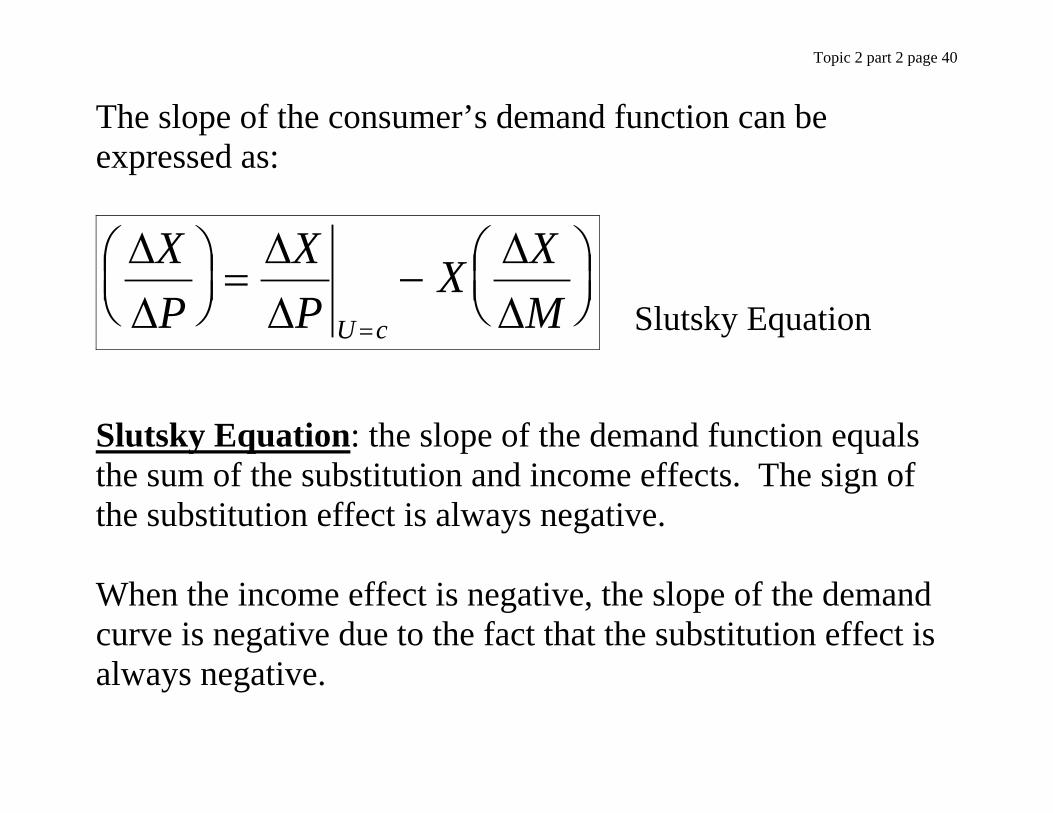
The slope of the consumer’s demand function can be expressed as: ΔΔ
ΔΔ
ΔΔ
XP
XP
X XMU c
⎛⎝⎜
⎞⎠⎟= − ⎛
⎝⎜⎞⎠⎟= Slutsky Equation
Slutsky Equation: the slope of the demand function equals the sum of the substitution and income effects. The sign of the substitution effect is always negative. When the income effect is negative, the slope of the demand curve is negative due to the fact that the substitution effect is always negative.

Topic 2 part 2 page 41
If the good is a normal good, the income effect is also negative.
The demand function will have a negative slope. If the good is an inferior good, the income effect will
be positive and the slope of the demand curve can be either positive or negative.

Topic 2 part 2 page 42
The Size of Each Effect
The Size of the Substitution Effect
The effect is larger when the consumer considers the good to be a close substitute for other products. If the good is considered a close substitute for other goods, the quantity of the good demanded will increase by a larger amount when its price falls, holding the consumer’s utility constant. Close Substitutes Close Complements Y Y X X
A A
B B
I I
BL0 BL0 X0 X1 X1X0

Topic 2 part 2 page 43
Recall, if two goods are close substitutes, the indifference curve is more linear. If two goods are complements the indifference curve is more ‘L’ shaped. The size of the substitution effect depends on whether the two goods are close substitutes or close complements.

Topic 2 part 2 page 44
The Size of the Income Effect Depends on the two components: 1) When the price of X falls, the consumer has − ( )ΔP X dollars now available for consumption on good X and on other goods. If X is currently consumed in a large quantity, as the price of X falls, the more income becomes available. The budget line will shift outward in a parallel manner by a larger amount when the price of X decreases.
Topic 2 part 2 page 45
2) We must also consider the responsiveness of quantity demanded to a change in income: ( )Δ ΔX M . When income increases, a consumer’s demand for various products will differ. I.e. If the income of a consumer increases by 25%, he may choose to consume only 20% more movies. Or a 25% increase in income will induce a 50% increase in housing. It depends on his income elasticity of demand.

Topic 2 part 2 page 46
Consumer Surplus Objective: to demonstrate how consumer surplus is derived from the consumer’s demand function. Consumer surplus is the difference between the maximum amount the purchaser would pay to consume a given quantity of a good and the actual amount paid. It is assumed that the consumer receives a surplus by consuming the good and is willing to pay even more than go without the good. Marginal Value: is the most that a consumer is willing to pay for each additional unit of a good.
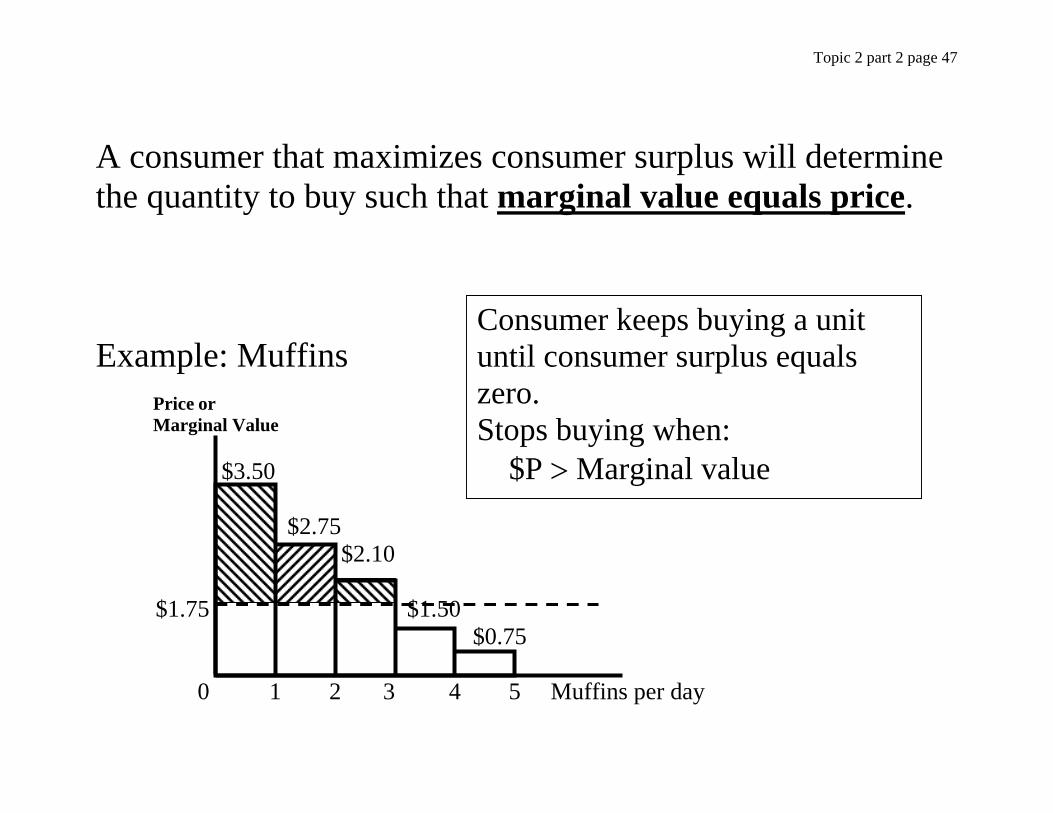
Topic 2 part 2 page 47
A consumer that maximizes consumer surplus will determine the quantity to buy such that marginal value equals price. Example: Muffins
$3.50 $2.75 $2.10 $1.75 $1.50 $0.75 0 1 2 3 4 5 Muffins per day
Price or Marginal Value
Consumer keeps buying a unit until consumer surplus equals zero. Stops buying when: $P > Marginal value

Topic 2 part 2 page 48
Topic 2 part 2 page 49
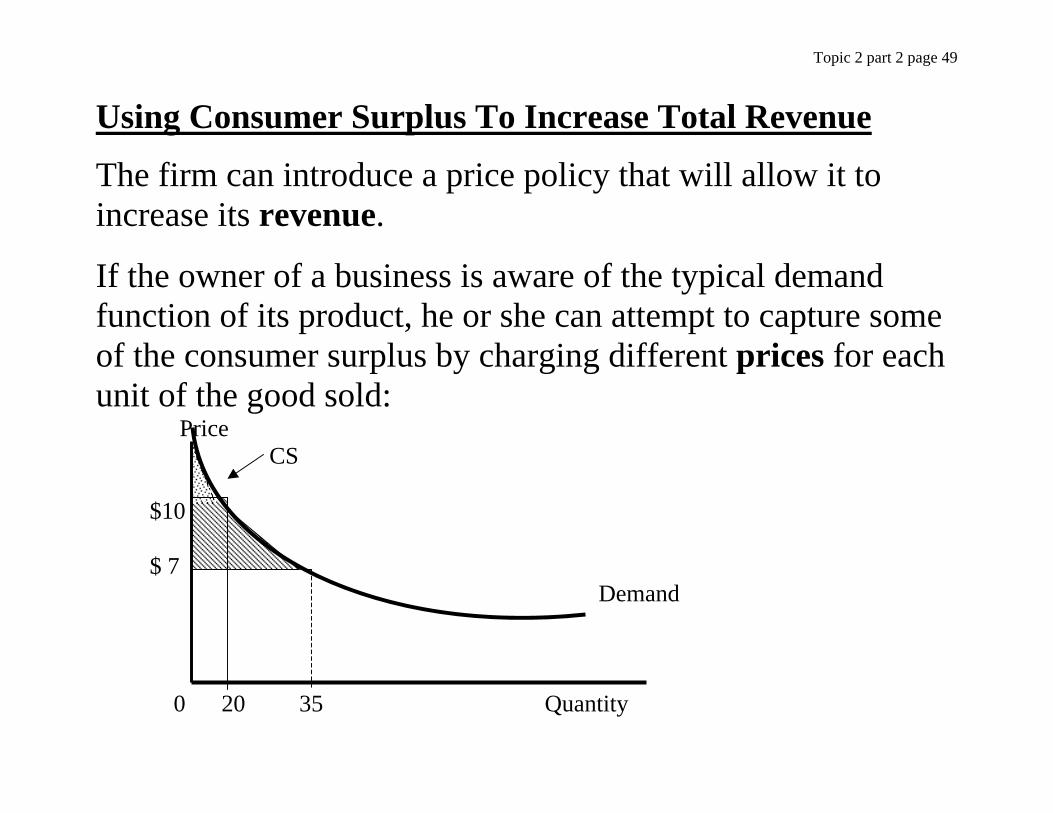
Using Consumer Surplus To Increase Total Revenue
The firm can introduce a price policy that will allow it to increase its revenue.
If the owner of a business is aware of the typical demand function of its product, he or she can attempt to capture some of the consumer surplus by charging different prices for each unit of the good sold: Price CS $10 $ 7 Demand 0 20 35 Quantity
Topic 2 part 2 page 50
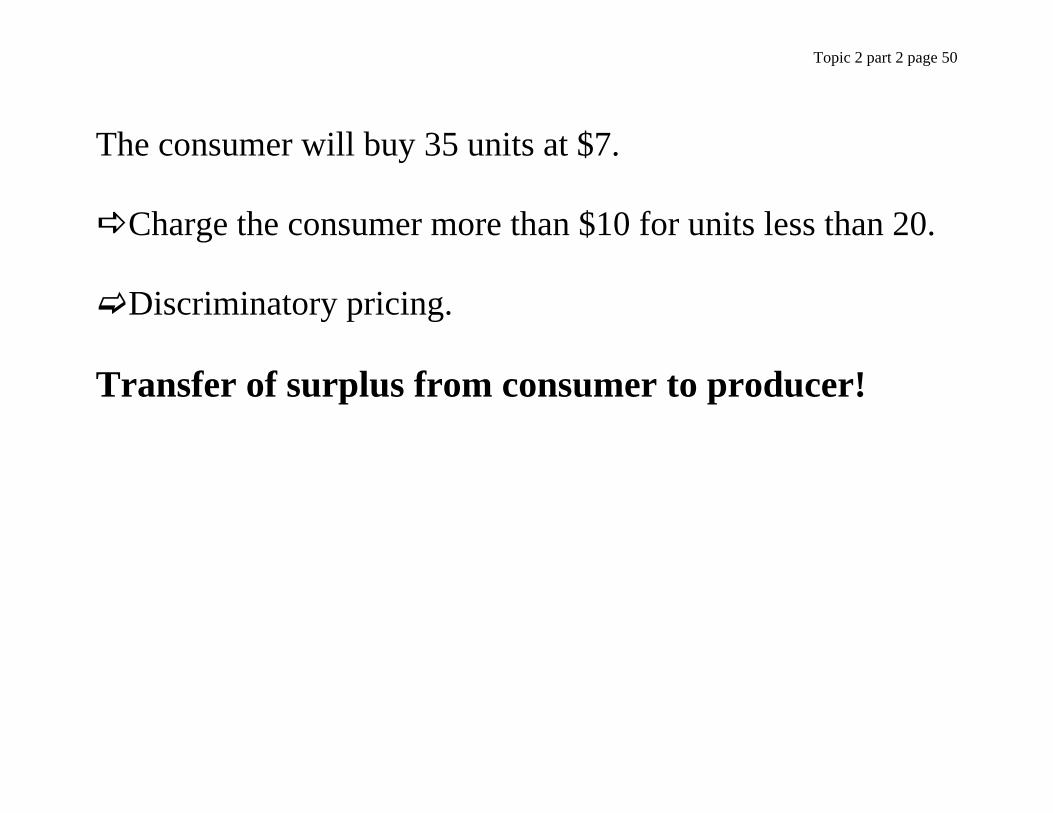
The consumer will buy 35 units at $7.
Charge the consumer more than $10 for units less than 20.
Discriminatory pricing. Transfer of surplus from consumer to producer!
Topic 2 part 2 page 51
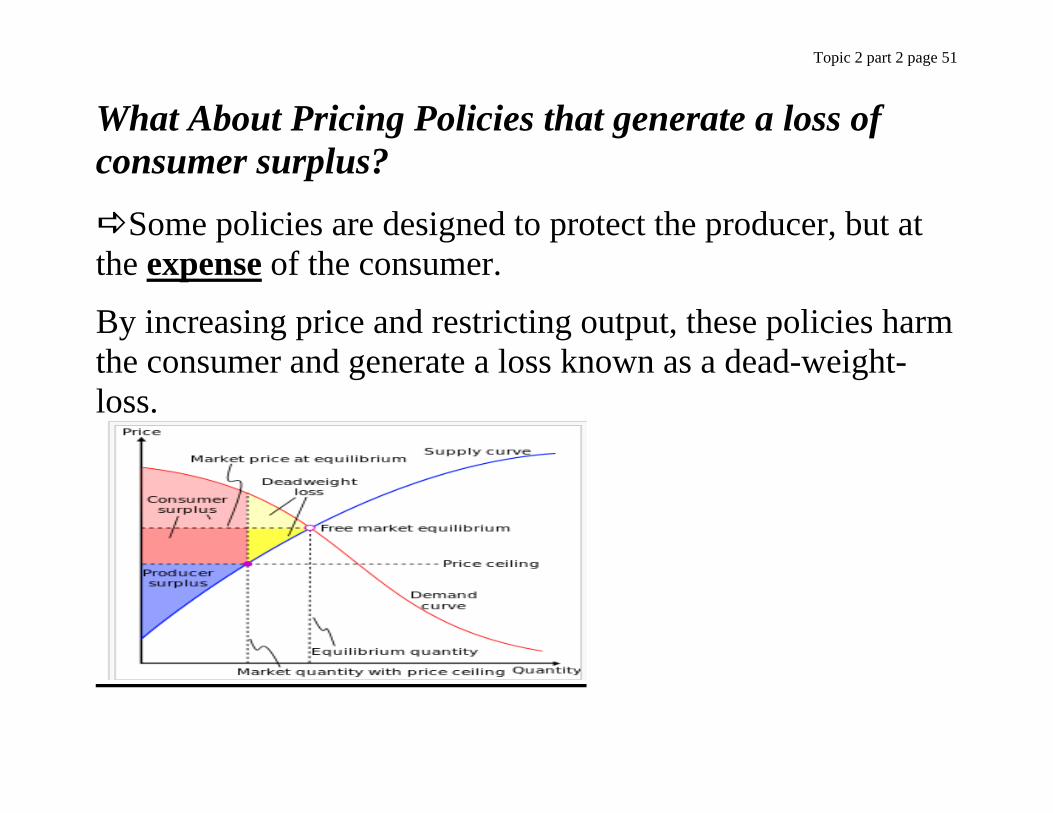
What About Pricing Policies that generate a loss of consumer surplus?
Some policies are designed to protect the producer, but at the expense of the consumer.
By increasing price and restricting output, these policies harm the consumer and generate a loss known as a dead-weight-loss.

Topic 2 part 2 page 52
Dead-weight-loss: represents the decrease in consumer surplus that is not transferred to some other group. Price $11 Dead weight loss $ 7 Demand 0 5 15 Quantity Monopoly: Restrict output and charge higher prices. Not good for the consumer.