Embed Size (px)
Citation preview
Copyright © by ESPEN LLL Programme 2017
1
Nutritional Assessment and Techniques Topic 3 Module 3.1
Nutritional Screening and Assessment
Rémy Meier MD,
University of Basel,
Breinlichenstrasse 14,
4416 Bubendorf, Switzerland
Yitshal Berner MD,
Geriatric Medicine,
Meir Medical Center,
Kfar Saba Sackler Medical School,
Tel Aviv University
Lubos Sobotka MD,
Department of Metabolic Care and Gerontology,
Medical Faculty, Charles University,
Hradec Kralove, Czech Republic
Learning Objectives
To recognise the importance of malnutrition;
To understand the difference between nutritional screening and assessment;
To be able to perform nutritional screening;
To recognize the signs and symptoms of malnutrition;
To understand different methods for nutritional assessment;
To know the benefits and limitations of different methods and tools for nutritional
assessment;
To know how to choose and use nutritional questionnaires and to know the
questionnaires recommended by ESPEN.
Contents
1. The importance of identifying malnutrition
2. Diagnosis of malnutrition
3. Nutritional screening and assessment
3.1. Methods for screening
3.1.1. Community: Malnutrition Universal Screening Tool (MUST)
3.1.2. Hospital: Nutritional Risk Screening (NRS)
3.1.3. Elderly: Mini Nutritional Assessment (MNA)
3.1.4. Nutric-Score for risk screening in the ICU
3.2. Methods for nutritional assessment
3.2.1. History
3.2.2. Physical examination
3.2.3. Measurement of body composition
3.2.3.1. Body mass index (BMI)
3.2.3.2. Bedside anthropometric measurements
3.2.3.2.1. Mid-arm circumference (MAC)
3.2.3.2.2. Triceps skinfold thickness (TSF)
3.2.3.3. Creatinine height index (CHI)
3.2.3.4. New tools for measuring body composition

Copyright © by ESPEN LLL Programme 2017
2
3.2.3.5. Nitrogen balance
3.2.4. Measurement of inflammation
3.2.5. Measurement of function
3.2.5.1. Muscle strength
3.2.5.2. Cognitive function
3.2.5.3. Immune function 3.2.5.4. Quality of life assessment (QoL)
4. Assessment of food intake and nutritional questionnaires
5. Summary
6. References
Key Messages
Patients with nutritional risks are frequently seen in clinical practice;
Nutritional screening and assessment are important parts of patient care;
Nutritional screening and assessment identify patients at nutritional risk and those
requiring nutritional support;
Nutritional screening is a rapid and simple tool and should be done in every patient;
Nutritional assessment is important for detailed diagnosis of acute and chronic
malnutrition;
Food intake should be evaluated in all patients at risk of malnutrition.

Copyright © by ESPEN LLL Programme 2017
3
1. The Importance of Identifying Malnutrition
Nutrition is a basic requirement for life. Accordingly nutrition plays an important role in
promoting health and preventing disease. Many factors can lead to weight change and
malnutrition. Malnutrition is a condition resulting from a combination of varying degrees
of under- or overnutrition and inflammatory activity, leading to an abnormal body
composition and diminished function (1). Several classifications of malnutrition have
been proposed in the past. Even now there is still no universally accepted definition.
Patients with minor nutritional deficiencies and those with overt under- or overnutrition
are common in clinical practice. The prevalence of malnutrition (undernutrition) among
hospitalized adult patients ranges from 30 to 50%, depending on the criteria used, and in
part whether those at high risk as well as those with established malnutrition are
included (2, 3). The EuroOOPS study from 12 European countries, which included data
from 26 hospital departments, found that 32.6% of the patients were at risk for
undernutrition (4). Undernutrition should be seen as an additional disease, as well as an
important component of comorbidity. The underlying condition and inadequate provision
of nutrients (particularly energy and protein) are the main reasons for developing
undernutrition. Many patients are already undernourished before they reach the hospital.
Those at highest risk for undernutrition are older people who are hospitalized or living in
care homes, people on low incomes or who are socially isolated, people with chronic
disorders, and those recovering from a serious illness or condition, particularly a
condition that affects their ability to eat. In addition, hospitalized patients often show
further deterioration in their nutritional status. One large survey showed that four out of
five patients do not consume enough to cover their energy or protein needs (5). There
are many known reasons to explain this. The underlying disease may directly impair
nutrition (as, for example, in the case of an oesophageal stricture) and can induce
metabolic and/or psychological disorders which increase the nutritional needs or decrease
food intake. In addition, the fasting periods before many examinations and interventions
lead to further inadequate food intake. Hospital undernutrition can also become
aggravated because of inappropriate meal services, inadequate quality and flexibility of
the hospital catering, and insufficient aid provided by the care staff.
The consequences of undernutrition are well-known. A poor nutritional status leads to an
increase in complications, a longer length of stay, higher mortality, higher costs and
more re-admissions (4, 6). The EuroOOPS study, for example, found significant increases
in complications, length of stay and mortality in patients at risk for undernutrition (4).
Undernutrition also influences the efficacy or tolerance of several key treatments, such as
antibiotic therapy, chemotherapy, radiotherapy or surgery. Furthermore, it is now clearly
demonstrated that undernutrition significantly increases overall health care costs (7).
Undernutrition is undoubtedly a major burden for patients and health care professionals,
and routinely should be actively sought. When undernutrition is diagnosed, it should be
treated in accordance with an individual nutritional care plan. The best outcomes are
seen when there is supervision by a multidisciplinary nutritional support team.
To improve the overall outcomes from nutritional treatment it is necessary to select
patients with overt undernutrition/malnutrition, and those at most risk of developing
nutritional deficiencies during their hospitalization. An ideal care plan should start by
screening all patients when they are admitted, proceeding to a detailed assessment of
nutritional status in those found to be at increased risk. In patients who are identified to
be malnourished or at high risk, an appropriate nutritional intervention should follow.
Unfortunately, although this process is well-known and forms part of several national and
international guidelines, it is not carried out everywhere. It remains necessary to raise
Copyright © by ESPEN LLL Programme 2017
4
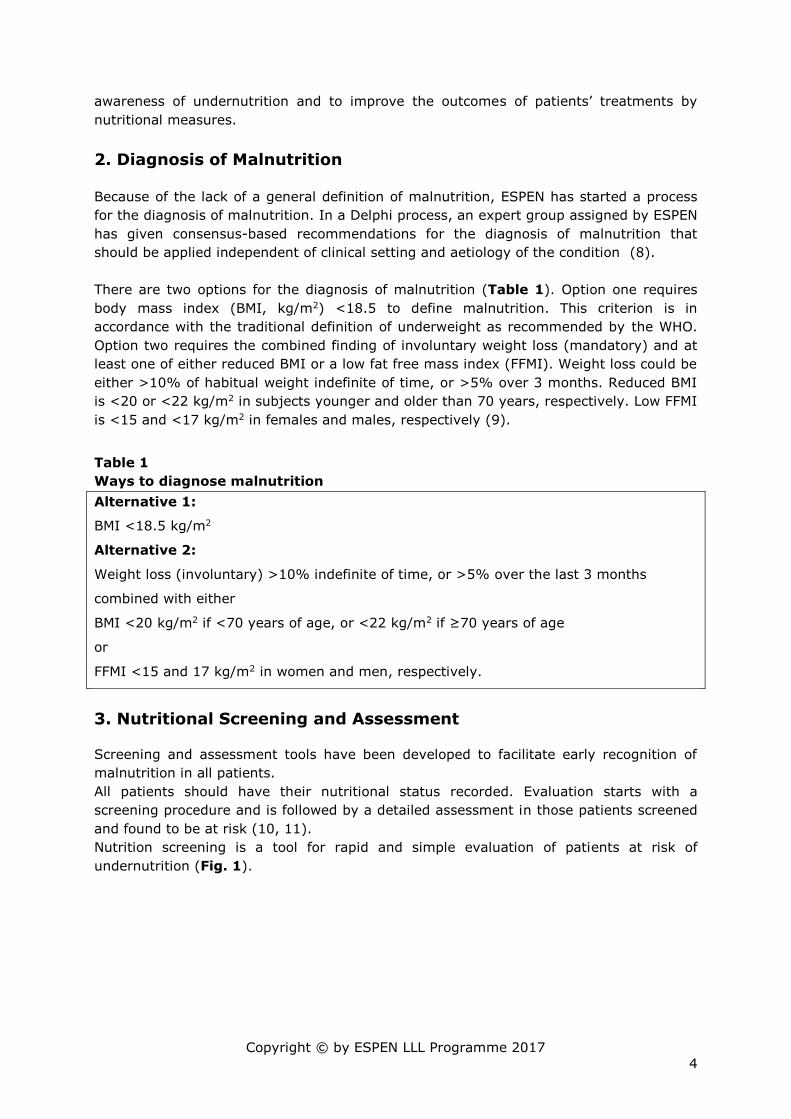
awareness of undernutrition and to improve the outcomes of patients’ treatments by
nutritional measures.
2. Diagnosis of Malnutrition Because of the lack of a general definition of malnutrition, ESPEN has started a process
for the diagnosis of malnutrition. In a Delphi process, an expert group assigned by ESPEN
has given consensus-based recommendations for the diagnosis of malnutrition that
should be applied independent of clinical setting and aetiology of the condition (8).
There are two options for the diagnosis of malnutrition (Table 1). Option one requires
body mass index (BMI, kg/m2) <18.5 to define malnutrition. This criterion is in
accordance with the traditional definition of underweight as recommended by the WHO.
Option two requires the combined finding of involuntary weight loss (mandatory) and at
least one of either reduced BMI or a low fat free mass index (FFMI). Weight loss could be
either >10% of habitual weight indefinite of time, or >5% over 3 months. Reduced BMI
is <20 or <22 kg/m2 in subjects younger and older than 70 years, respectively. Low FFMI
is <15 and <17 kg/m2 in females and males, respectively (9).
Table 1
Ways to diagnose malnutrition
Alternative 1:
BMI <18.5 kg/m2
Alternative 2:
Weight loss (involuntary) >10% indefinite of time, or >5% over the last 3 months
combined with either
BMI <20 kg/m2 if <70 years of age, or <22 kg/m2 if ≥70 years of age
or
FFMI <15 and 17 kg/m2 in women and men, respectively.
3. Nutritional Screening and Assessment Screening and assessment tools have been developed to facilitate early recognition of
malnutrition in all patients. All patients should have their nutritional status recorded. Evaluation starts with a
screening procedure and is followed by a detailed assessment in those patients screened
and found to be at risk (10, 11).
Nutrition screening is a tool for rapid and simple evaluation of patients at risk of
undernutrition (Fig. 1).

Copyright © by ESPEN LLL Programme 2017
5
Diagnosis of malnutrition (undernutrition)
Screening Assessment
Fig. 1 Nutritional Screening and Assessment
Screening should be a simple and rapid process, which can be carried out by busy
admitting nursing and medical staff. It should be sensitive enough to detect all or nearly
all patients at nutritional risk. Methods of nutritional screening should be validated in
clinical trials (12).
Screening should be performed within the first 24-48 h after the first contact and
thereafter at regular intervals. Patients identified as at risk need to undergo nutritional
assessment.
Nutritional assessment should be more detailed and done in those patients found on
screening to be at risk or when metabolic or functional problems prevent a standard plan
being carried out (11). Nutritional assessment also provides the basis for the formal
diagnosis of malnutrition.
3.1 Methods for Screening
Several validated screening tools are available and recommended by the European
Society for Clinical Nutrition and Metabolism (ESPEN) (12).
The screening tools address several basic questions:
Recent weight loss;
Current body mass index;
Recent food intake;
Disease severity.
ESPEN has published guidelines for nutrition screening in the community, in the hospital
and among the elderly in institutions. The usefulness of the screening methods
recommended is based on predictive validity, content validity, reliability and practicability
(12).
Screening tools recommended by ESPEN are:
- Community: Malnutrition Universal Screening Tool (MUST) (13);
- Hospital: Nutritional Risk Screening (NRS) (14);
- Elderly: Mini Nutritional Assessment (MNA) (15, 16).
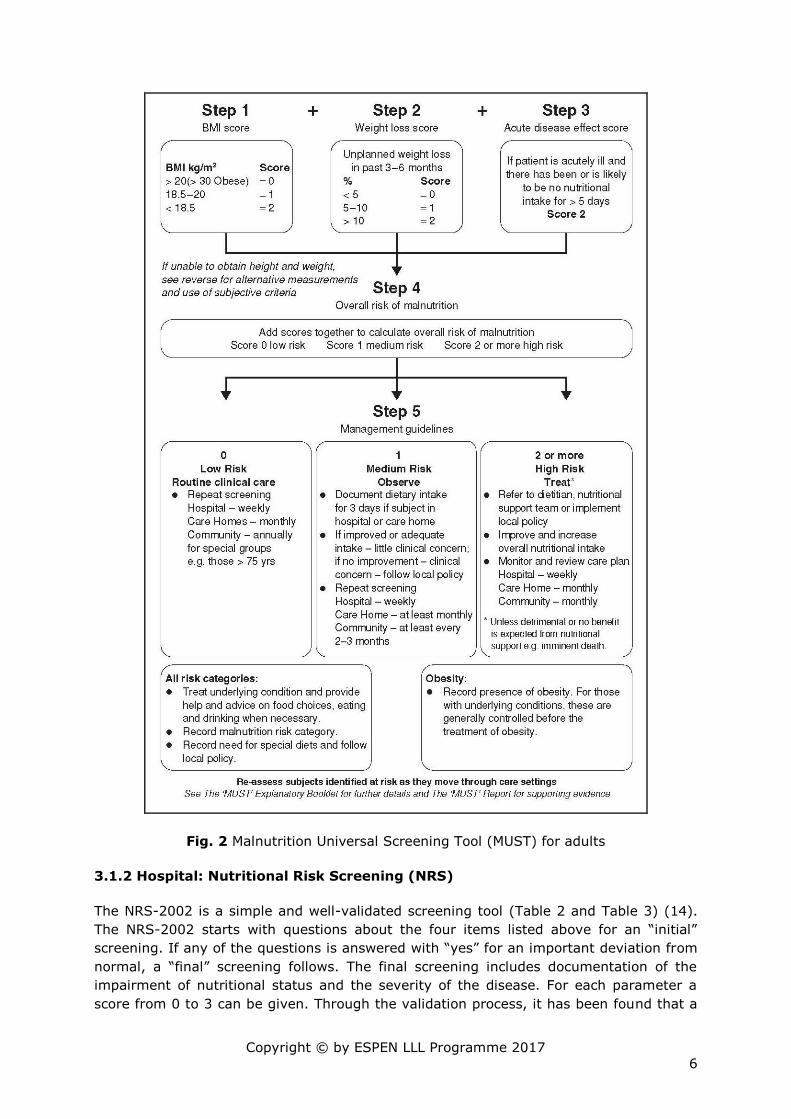
3.1.1 Community: Malnutrition Universal Screening Tool (MUST)
For a general screening of the community, the MUST is a useful tool for a rapid estimate
of the grade of undernutrition (Fig. 2) (13).
Its main disadvantage is that the recent food intake is not included, and calculations of
the percentage weight loss, and of the BMI, have caused problems in some units.
Copyright © by ESPEN LLL Programme 2017
6
Fig. 2 Malnutrition Universal Screening Tool (MUST) for adults
3.1.2 Hospital: Nutritional Risk Screening (NRS)
The NRS-2002 is a simple and well-validated screening tool (Table 2 and Table 3) (14).
The NRS-2002 starts with questions about the four items listed above for an “initial”
screening. If any of the questions is answered with “yes” for an important deviation from
normal, a “final” screening follows. The final screening includes documentation of the
impairment of nutritional status and the severity of the disease. For each parameter a
score from 0 to 3 can be given. Through the validation process, it has been found that a

Copyright © by ESPEN LLL Programme 2017
7
final score of 3 or more indicates that the patient will benefit from a nutritional support
plan.
Table 2
Nutritional Risk Screening (NRS 2002); Initial screening questions
Initial screening I Yes No
1 Is BMI <20.5?
2 Has the patient lost weight within the last 3 months?
3 Has the patient had a reduced dietary intake in the last week?
4 Is the patient severely ill? (e.g. in intensive therapy)
Yes: If the answer is 'Yes' to any question, the screening in Step 2 is performed.
No: If the answer is 'No' to all questions, the patient is re-screened at weekly intervals. If the patient is (e.g.) scheduled for a major operation, a preventative nutritional care plan is considered to try to avoid the associated risk.
Table 3
Nutritional Risk Screening (NRS 2002); Final screening Final screening II
Impaired nutritional status Severity of disease ( increase in requirements)
Absent Score 0
Normal nutritional status Absent Score 0
Normal nutritional requirements
Mild
Score 1
Wt loss >5% in 3 months or Food intake below 50-75% of normal re-quirement in preceding week
Mild Score 1
Hip fracture Chronic patients, in particular with acute compli-cations: cirrhosis, COPD Chronic haemodialysis, diabetes, oncology
Moderate Score 2
Wt loss >5% in 2 months or BMI 18.5 - 20.5 + impaired general condition or Food intake 25-50% of normal requirement in preceding week
Moderate Score 2
Major abdominal surgery Stroke Severe pneumonia, hematological malignancy.
Severe Score 3
Wt loss >5% in 1 months (>15% in 3 months) or BMI <18.5 + impaired general condition or Food intake 0-25% of normal requirement in preceding week
Severe Score 3
Head injury Bone marrow transplantation Intensive care patients (APACHE>10).
Score:
+
Score: = Total score:
Age if 70 years: add 1 to total score above = age-adjusted total score:
Score 3: the patient is nutritionally at-risk and a nutritional care plan is initiated
Score < 3: weekly re-screening of the patient. If the patient is (e.g.) scheduled for a major operation, a preventative nutritional care plan is considered to try to avoid the associated risk.
3.1.3 Elderly: Mini Nutritional Assessment (MNA)
For patients over 65 years of age, two specific and well-validated tools are available (15,
16). The full MNA (15) and the short form (MNA-SF) (16). The MNA is a combination of a
screening and assessment tool.
The full MNA has two parts:
1. Screening
and if the patients is at risk
2. Assessment

Copyright © by ESPEN LLL Programme 2017
8
The full MNA has 18 questions and covers 4 domains. A score of ≥ 24 indicates an
adequate nutritional status. A score between 17 and 23.5 indicates risk of malnutrition
and a score of <17 indicates malnutrition.
Mini Nutritional Assessment (Table 4a and 4b) MNA Société des Produits Nestlé –
Trademark owner - 1994. (Reproduced with permission)
Table 4a
Mini Nutritional Assessment (MNA); Screening
A
Has Food intake declined over the past 3 months, due to loss of appetite, digestive problems chewing or swallowing difficulties?
0 = severe loss of appetite 1 = moderate loss of appetite 2 = no loss of appetite
B
Weight loss during last 3 months? 0 = weight loss greater than 3 kg 1 = does not know 2 = weight loss between 1 and 3 kg 3 = no weight loss
C
Mobility? 0 = bed or chair bound 1 = able to get out of bed/chair but does not go out 2 = goes out
D
Has suffered psychological stress or acute disease in the past 3 months? 0 = yes 2 = no
E
Neuropsychological problems? 0 = severe dementia or depression 1 = mild dementia 2 = no psychological problems
F
Body Mass Index (BMI) [weight in kg] / [height in m]² ? 0 = BMI less than 19 1 = BMI 19 to less than 21 2 = BMI 21 to less than 23 3 = BMI 23 or greater
Screening score (subtotal max. 14 points)
12 points or greater Normal - not at risk -> no need to complete
assessment
11 points or below Possible malnutrition -> continue assessment

Copyright © by ESPEN LLL Programme 2017
9
Table 4b
Mini Nutritional Assessment (MNA); Аssessment
G
Lives independently (not in a nursing home or hospital)? 0 = no 1 = yes
H
Takes more than 3 prescription drugs per day? 0 = yes 1 = no
I
Pressure sores or skin ulcers?
0 = yes 1 = no
J
How many full meals does the patient eat daily? 0 = 1 meals 1 = 2 meals 2 = 3 meals
K
Selected consumption markers for protein intake? At least one serving of dairy products (milk, cheese, yoghurt) per day yes? no? Two or more serving of legumes or egg per week yes? no? Meat, fish or poultry everyday yes? no? 0.0 = if 0 or 1 yes 0.5 = if two yes 1.0 = if 3 yes
L
Consumes two or more servings or fruits or vegetables per day? 0 = No 1 = Yes
M
How much fluid (water, juice, coffee, tea, milk… ) is consumed per day? 0.0 = less than 3 cups 0.5 = 3 to 5 cups 1.0 = more than 5 cups
N
Mode of feeding? 0 = unable to eat without assistance 1 = self–fed with some difficulty 2 = self–fed without any problems
O
Self view of nutritional status? 0 = view self as being malnourished 1 = is uncertain of nutritional status 2 = views self as having no nutritional problem
P
In comparison with other people of the same age, how do they consider their health status? 0.0 = not as good 0.5 = does not know 1.0 = as good 2.0 = better
Q
Mid – arm circumference (MAC) in cm?
0.0 = MAC less than 21 0.5 = MAC 21 to 22 1.0 = MAC 22 or greater
R
Calf circumference (CC) in cm? 0 = CC less than 31 1 = CC 31 or greater

Copyright © by ESPEN LLL Programme 2017
10
Assessment score (max. 16 points)
Screening score (max. 14 points)
Total assessment (max. 30 points)
Malnutrition Indicator Score
17 to 23.5 points -> at risk of malnutrition
Less than 17 points -> malnourished
The initial long version of the mini-nutritional assessment (MNA) was followed by a
simpler one. The MNA-SF is derived from the original MNA and includes only 6 items.
Recently it was revised and the calf circumference was added if the BMI can not be
calculated. The short form of the MNA has turned out to be as good as the long version,
and it is more rapidly done (Table 5). If the score is 11 or less the patients is regarded
as at risk for malnutrition and the full MNA has to be done.
Table 5
Mini Nutritional Assessment Short Form (MNA-SF)
A. Has food intake declined over the past 3 months, due to loss of appetite, digestive
problems, chewing or swallowing difficulties?
0 = severe loss of appetite
1 = moderate loss of appetite
2 = no loss of appetite
B. Weight loss during last 3 months?
0 = weight loss greater than 3 kg
1 = does not know
2 = weight loss between 1 and 3 kg
3 = no weight loss
C. Mobility
0 = bed- or chair-bound
1 = able to get out of bed / chair but does not go out
2 = goes out
D. Has suffered psychological distress or acute disease in the past 3 months?
0 = yes
2 = no
E. Neuropsychological problems?
0 = severe dementia or depression
1 = mild dementia
2 = no psychological problems
F1. BMI
Copyright © by ESPEN LLL Programme 2017
11
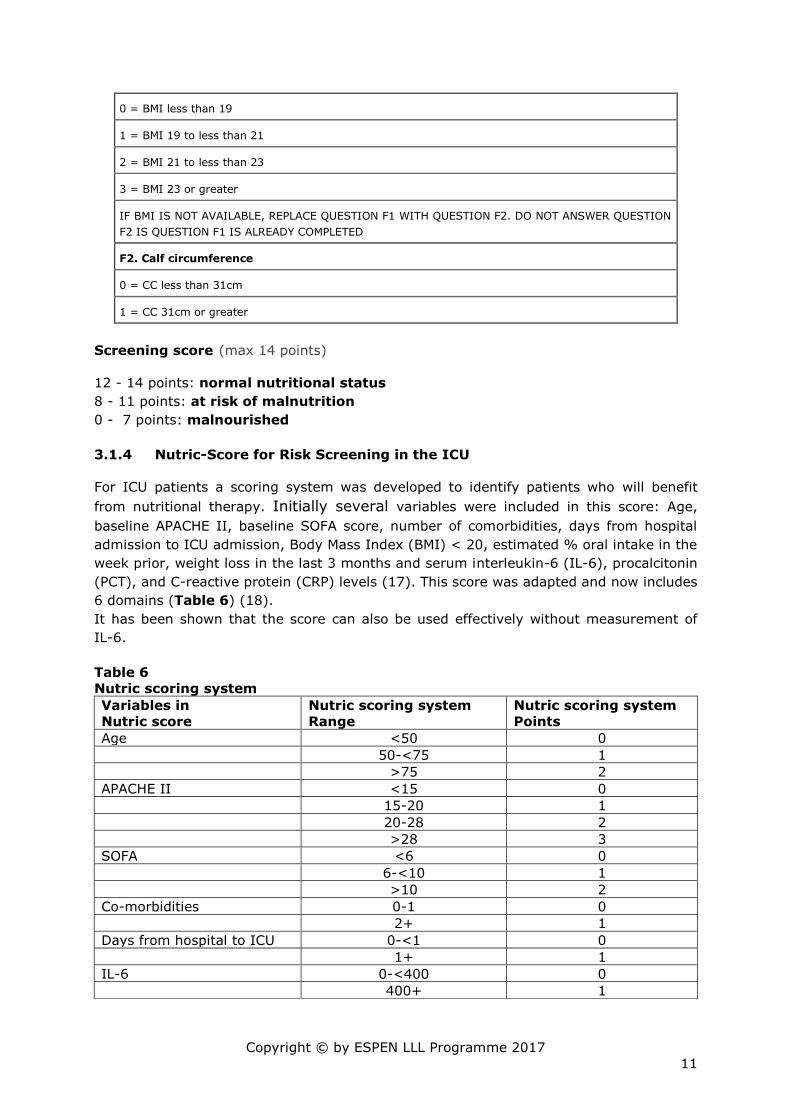
0 = BMI less than 19
1 = BMI 19 to less than 21
2 = BMI 21 to less than 23
3 = BMI 23 or greater
IF BMI IS NOT AVAILABLE, REPLACE QUESTION F1 WITH QUESTION F2. DO NOT ANSWER QUESTION
F2 IS QUESTION F1 IS ALREADY COMPLETED
F2. Calf circumference
0 = CC less than 31cm
1 = CC 31cm or greater
Screening score (max 14 points)
12 - 14 points: normal nutritional status
8 - 11 points: at risk of malnutrition
0 - 7 points: malnourished
3.1.4 Nutric-Score for Risk Screening in the ICU
For ICU patients a scoring system was developed to identify patients who will benefit
from nutritional therapy. Initially several variables were included in this score: Age,
baseline APACHE II, baseline SOFA score, number of comorbidities, days from hospital
admission to ICU admission, Body Mass Index (BMI) < 20, estimated % oral intake in the
week prior, weight loss in the last 3 months and serum interleukin-6 (IL-6), procalcitonin
(PCT), and C-reactive protein (CRP) levels (17). This score was adapted and now includes
6 domains (Table 6) (18).
It has been shown that the score can also be used effectively without measurement of
IL-6.
Table 6
Nutric scoring system
Variables in
Nutric score
Nutric scoring system
Range
Nutric scoring system
Points
Age <50 0
50-<75 1
>75 2
APACHE II <15 0
15-20 1
20-28 2
>28 3
SOFA <6 0
6-<10 1
>10 2
Co-morbidities 0-1 0
2+ 1
Days from hospital to ICU 0-<1 0
1+ 1
IL-6 0-<400 0
400+ 1
Copyright © by ESPEN LLL Programme 2017
12
Patients with a high Nutric-score at admittion to the intensive care have a higher
mortality risk.
The NUTRIC scoring system was externally validated and may be useful in identifying
critically ill patients most likely to benefit from optimal amounts of macronutrients when
considering mortality as an outcome.
3.2. Methods for in Nutritional Assessment
For some patients, screening is not enough, and a more detailed assessment is
necessary. A nutritional assessment should be done in those patients found to be at risk
on screening, and when metabolic or functional problems prevent a standard plan being
carried out.
A complete nutritional assessment consists of a combination of subjective and objective
parameters, but up to now, no single parameter has been shown to be useful in all
patients. Most individual nutritional parameters have limited sensitivity and specificity;
therefore, methods of identifying malnourished patients are not 100% satisfactory and
require the use of several parameters and clinical judgement.
The first widely accepted tool for nutritional assessment was the Subjective Global
assessment (SGA) (19). The SGA includes history of weight and dietary changes,
persistent gastrointestinal symptoms, functional capacity, effects of disease on nutritional
requirements, and physical appearance. The SGA rank is not based on a numerical
weighting scheme but rather on subjective weighting. The difficulty with the SGA is that
it needs great experience in order to obtain reliable and reproducible results. The
screener has to integrate all the information to make an overall judgement on the
patient’s nutritional status - from a normal nutrition status to moderate or severe
malnutrition. For the SGA you have consider that it is more an assessment than a
screening tool.
Another useful tool is the Patient-Generated (PG)-SGA. The PG-SGA is a validated
instrument to assess malnutrition and its risk factors.
The SGA gives a global answer to the problem but it does not describe the patient’s
situation in detail. To characterize the degree of malnutrition, the risk of complications
related to malnutrition and the need for nutritional support, a detailed assessment
process has to be done. Nutritional assessment is more complex than screening and
should include the following principles:
History
- Factors leading to malnutrition;
- Pain;
- Weight loss;
- Appetite;
- Diet history
- Medical and drug history;
- Gastrointestinal symptoms;
(diarrhoea, constipation, nausea, vomiting);
- Fever;
- Symptoms of psychiatric illness (e.g. depression, anorexia nervosa).
Clinical findings
- Temperature;
- Pulse rate;

Copyright © by ESPEN LLL Programme 2017
13
- Blood pressure;
- Nutrient losses from wounds, fistulae etc.
Functional assessment
- Muscle strength;
- Mental and physical dysfunction;
- Mental scoring system;
- Mood status.
Energy expenditure
Laboratory tests
- Haematological screen;
- Biochemical parameters (e.g. urea, creatinine, liver function tests);
- Quantifying inflammation and disease severity;
- Plasma protein levels (e.g. transthyretin, transferrin);
- Plasma changes in minerals (e.g. Sodium, K, Ca, Mg, P, Zn, Fe, plasma levels of
vitamins).
Fluid balance
There are many methods and indices which are based on the above assessment
methods. Their interpretation and correlation, however, can still be problematic.
3.2.1 History
The history or the patient’s subjective description of symptoms is the starting point for
any nutritional assessment. Besides recent weight changes, and dietary intake it also
includes dietary habits, allergies and food intolerances, medications (that may affect
appetite, gastrointestinal functions and symptoms) current functional capacity, including
recent limitations, and previous medical conditions (any chronic or acute disease state).
It must also include the diseases and physiological changes, which can influence needs of
energy and specific nutrients or which can influence body compartments (e.g. loss of
muscle mass in sepsis).
The patients prescribed medication should be examined for potential drug-nutrient
interactions, increased macro- or micronutrient requirements, and nutritionally related
side effects.
3.2.2 Physical Examination
The next step in nutritional assessment is objective physical examination.
The main objective of a physical examination is to detect signs of nutrient deficiencies or
toxicities, and tolerance of current nutritional support using the traditional methods of
inspection, palpation, percussion, and auscultation.
The physical examination should include:
Assessment of muscle mass and subcutaneous fat stores;
Inspection and palpation for water retention (oedema and ascites);
Inspection and evaluation for signs and symptoms of vitamin and mineral deficits,
such as dermatitis, glossitis, cheilosis, neuromuscular irritability, and coarse, easily
pluckable hair.
Copyright © by ESPEN LLL Programme 2017
14
3.2.3 Measurement of Body Composition
Body composition describes the body compartments, such as fat mass, fat-free mass,
muscle mass and bone mineral mass, in percentage terms depending on the body
composition model used. Body composition changes due to starvation, underlying disease
and mobility/exercise. Several simple methods to measure body composition are
available.
3.2.3.1 Body Mass Index (BMI)
The body mass index (kg/m2) is calculated by measuring height and body weight. Low
and high BMI values are associated with increased morbidity and mortality.
Weight (Wt) for height (Ht) is usually expressed in this form and allows comparison of
both sexes and most age groups against a narrow normal range (Table 7).
The BMI does not describe body composition. A high BMI can be seen in fat individuals
and also in very musclular athletes.
Table 7
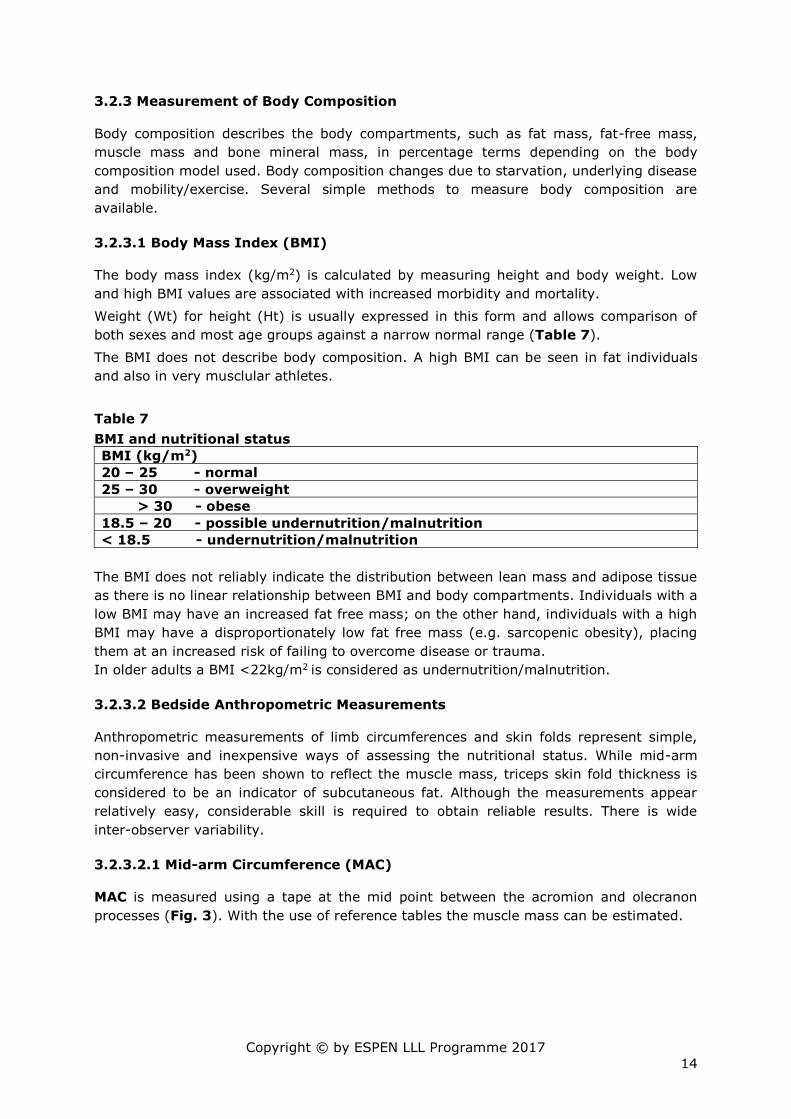
BMI and nutritional status
BMI (kg/m2)
20 – 25 - normal
25 – 30 - overweight
> 30 - obese
18.5 – 20 - possible undernutrition/malnutrition
< 18.5 - undernutrition/malnutrition
The BMI does not reliably indicate the distribution between lean mass and adipose tissue
as there is no linear relationship between BMI and body compartments. Individuals with a
low BMI may have an increased fat free mass; on the other hand, individuals with a high
BMI may have a disproportionately low fat free mass (e.g. sarcopenic obesity), placing
them at an increased risk of failing to overcome disease or trauma.
In older adults a BMI <22kg/m2 is considered as undernutrition/malnutrition.
3.2.3.2 Bedside Anthropometric Measurements
Anthropometric measurements of limb circumferences and skin folds represent simple,
non-invasive and inexpensive ways of assessing the nutritional status. While mid-arm
circumference has been shown to reflect the muscle mass, triceps skin fold thickness is
considered to be an indicator of subcutaneous fat. Although the measurements appear
relatively easy, considerable skill is required to obtain reliable results. There is wide
inter-observer variability.
3.2.3.2.1 Mid-arm Circumference (MAC)
MAC is measured using a tape at the mid point between the acromion and olecranon
processes (Fig. 3). With the use of reference tables the muscle mass can be estimated.

Copyright © by ESPEN LLL Programme 2017
15
Fig. 3 Measurement of mid-arm circumference
3.2.3.2.2 Triceps Skinfold Thickness (TSF)
Skinfold measurement by calipers at different sites of the body requires considerable
skill, and there can be as much as a 20% inter-observer error (Fig. 4).
Fig. 4 Measurement of triceps skinfold with a caliper
In the past the muscle mass was assessed by the creatinine height index. This
measurement is only seldom used today.
3.2.3.3 Creatinine Height Index (CHI)
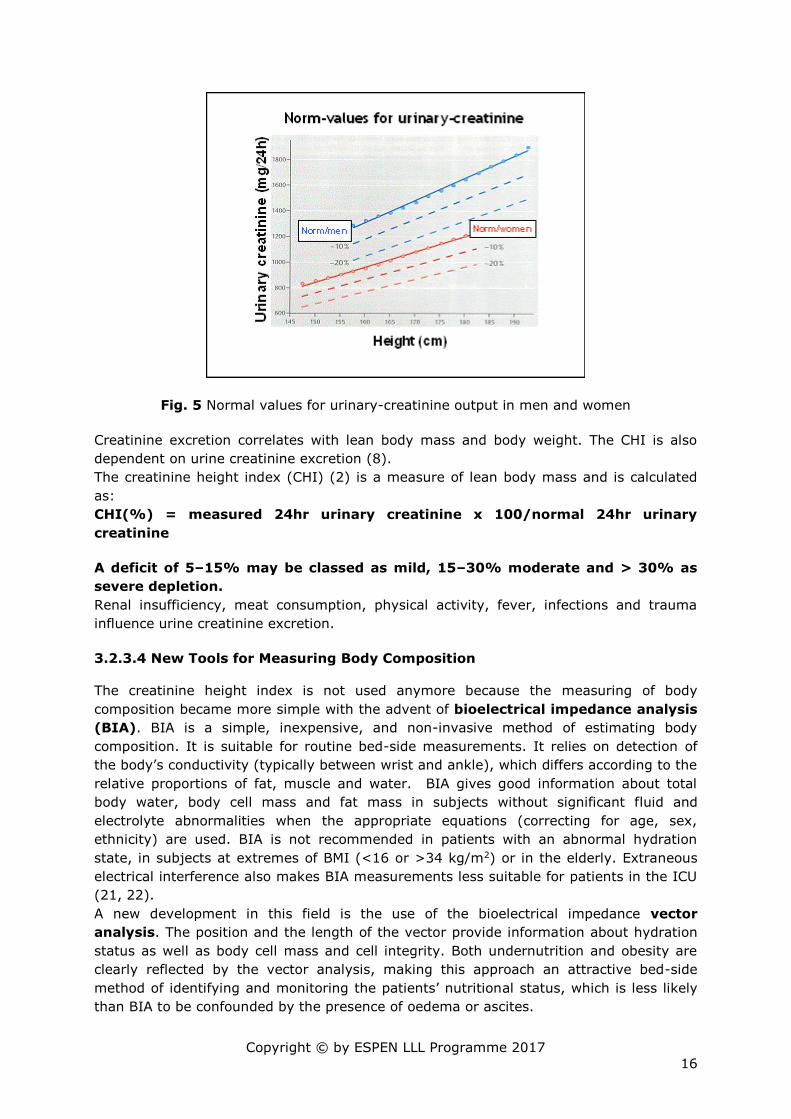
Creatine is metabolised to creatinine at a more or less stable rate, and reflects the
amount of muscle (20). It is different in man and woman according to their different
muscle masses (Fig. 5).
Copyright © by ESPEN LLL Programme 2017
16
Fig. 5 Normal values for urinary-creatinine output in men and women
Creatinine excretion correlates with lean body mass and body weight. The CHI is also
dependent on urine creatinine excretion (8).
The creatinine height index (CHI) (2) is a measure of lean body mass and is calculated
as:
CHI(%) = measured 24hr urinary creatinine x 100/normal 24hr urinary
creatinine
A deficit of 5–15% may be classed as mild, 15–30% moderate and > 30% as
severe depletion.
Renal insufficiency, meat consumption, physical activity, fever, infections and trauma
influence urine creatinine excretion.
3.2.3.4 New Tools for Measuring Body Composition
The creatinine height index is not used anymore because the measuring of body
composition became more simple with the advent of bioelectrical impedance analysis
(BIA). BIA is a simple, inexpensive, and non-invasive method of estimating body
composition. It is suitable for routine bed-side measurements. It relies on detection of
the body’s conductivity (typically between wrist and ankle), which differs according to the
relative proportions of fat, muscle and water. BIA gives good information about total
body water, body cell mass and fat mass in subjects without significant fluid and
electrolyte abnormalities when the appropriate equations (correcting for age, sex,
ethnicity) are used. BIA is not recommended in patients with an abnormal hydration
state, in subjects at extremes of BMI (<16 or >34 kg/m2) or in the elderly. Extraneous
electrical interference also makes BIA measurements less suitable for patients in the ICU
(21, 22).
A new development in this field is the use of the bioelectrical impedance vector
analysis. The position and the length of the vector provide information about hydration
status as well as body cell mass and cell integrity. Both undernutrition and obesity are
clearly reflected by the vector analysis, making this approach an attractive bed-side
method of identifying and monitoring the patients’ nutritional status, which is less likely
than BIA to be confounded by the presence of oedema or ascites.

Copyright © by ESPEN LLL Programme 2017
17
More sophisticated methods for the study of body composition are dual-energy X-ray
absorptiometry (DEXA), magnetic resonance imaging (MRI) and computerized
tomography (CT).
DEXA depends on analysis of radiological density (usually in the hip and spine) and is a
useful, indirect method of measuring the volume of fat mass, fat-free mass and bone
mineral mass (density). DEXA is relatively inexpensive and increasingly used in clinical
practice and research. The only drawback is a small radiation exposure. It is currently
regarded as a gold standard by many authors.
MRI and CT imaging can also be used for the assessment of body composition. MRI and
CT allow not only the quantification of fat mass and fat-free mass, but also give
information about the regional fat distribution and enable an estimate of the amount of
skeletal muscle. The advantage of MRI over CT is that in MRI no ionizing radiation is
used. These two methods are mainly used in research, because their higher costs, the
amount of time needed and their more limited availability preclude routine use (23).
However, it is often possible to obtain nutritional information from scans taken for
general diagnostic purposes, and “single slice” techniques reduce the time and cost for
review scans. It is probable that MRI will soon be established as the new gold standard
for measurement of body composition.
For research, several other sophisticated methods are available. These include dilution
methods, the measurement of total body potassium and in vivo neutron activation
analysis. These techniques are demanding and expensive. Therefore, they are not used
in clinical practice. More information on body composition measurements can be found in
Module 3.2.
3.2.3.5 Nitrogen Balance
Body composition can change due to a postive or a negative nitrogen balance. A negative
nitrogen balance is often seen in critically ill patients. Over time this has a negative effect
on outcome mainly through loss of lean body mass. In this situation it is very helpful to
assess the nitrogen balance (Fig. 6). The nitrogen balance summarizes the overall
metabolism of protein in the body. This represents the difference between N intake and N
output, the difference being either positive (N retention, as in active growth), negative (N
loss) or zero (N equilibrium [normal conditions]). The determination of N balance (NB)
requires a careful estimate of intake (I) and of all routes of N loss, namely urine (U),
faeces (F), and dermal losses (S).
NB = I – (U + F + S)
Nitrogen balance is an apparently simple concept for expressing the relationship between
the overall nitrogen intake of the body and its nitrogen losses. Yet it has been widely
criticized as it may be subject to a number of errors. It has repeatedly been found that
the higher the protein intake, the greater is the apparent retention of N per unit gram in
weight. The possible explanation for this discrepancy may due to the following factors:
- Losses of nitrogen by routes other than urine and faeces are not considered (10–20 mg
N/kg/day or about 0.7–1.4 g N/day in a 70 kg man).
- Nitrogen retention as non-protein nitrogen may cause erroneous evaluation.
- The nitrogen balance should always be corrected for changes in the total body pool of
urea.
- Difficulties in collecting and handling urine and faeces are well-known problems in
clinical trials.

Copyright © by ESPEN LLL Programme 2017
18
- Errors in the measurement of N-retention are cumulative since intakes tend to be
overestimated and outputs underestimated.
Fig. 6 Calculation of nitrogen balance
The validity of nitrogen balance is affected by severe nitrogen retention disorders,
accuracy of the 24-hour-urine collection and completeness of protein or amino-acid
intake data.
3.2.4 Measurement of Inflammation
The grade of inflammation correlates with the disease activity and changes in body
composition. Therefore, some laboratory parameters have to be included in detailed
assessment. Extensive laboratory testing is not recommended for the assessment of the
nutritional status but these parameters gives information about the disease severity.
General laboratory parameters
Several laboratory parameters are influenced by the underlying disease. The more ill a
patient is the more these parameters can change. Laboratory testing is more useful for
the assessment of the disease severity than for the nutritional status. The most
measured parameters are:
- Full Haematological screen
Inflammation can go along with a drop of haemoglobin. The total lymphocyte counts
are influenced by hypoalbuminaemia, metabolic stress, infections, cancer, and chronic
diseases
- Liver parameters
Liver parameters can be abnormal if a liver disesase is present, but also in SIRS and
sepsis
- Electrolytes, urea and creatinine
Eletrolytes are changed in many diseases (oedema, dehydration). Serum urea may be
low in the presence of protein depletion and low protein turnover. Serum creatinine falls
as lean mass is lost. It is elevated in renal failure or when muscle mass is abnormally
high (e.g. body builders)
- Vitamins and minerals
The clinical evaluation provides the background for evaluating patients for potential
vitamin and mineral deficits. Laboratory testing is required to confirm clinically suspicious
Nitrogen-balance
g/d 2-4 g/d * specialized enteral or parenteral formulations have often a different conversion coefficient (** urinary urea nitrogen)

Copyright © by ESPEN LLL Programme 2017
19
signs and symptoms. Patients with malnutrition often exhibit symptoms associated with
multiple micronutrient deficiencies.
The serum proteins (albumin, transthyretin [TTR], formerly prealbumin,
transferrin)
The serum proteins are involved in the acute phase response and are inflammtory
parameters reflecting disease activity.
Inflammation affects both body composition, mainly the muscle mass, and function.
Inflammation is characterized by the production, and release into the circulation, of
proinflammatory cytokines which are catabolic for muscle. C-reactive protein (CRP) levels
correlate closely with the release of interleukin-6, and can be used as an inflammatory
marker. In addition, inflammation reduces albumin levels. Therefore, low albumin levels
are not a good indicator for the nutritional status. Serum albumin levels more closely
reflect disease severity, and can be used as an outcome predictor (24). Low serum
albumin levels are associated with a higher rate of complications and mortality (25, 26).
Serum proteins have different half lifes. Transthyretin (TTR) has a much shorter half-life
(2 days) and may reflect change in nutritional status, although this can be affected by
volume distribution and dilution in the same way as serum albumin. Hence, it is
recommended to measure plasma levels of TTR together with protein markers of
inflammatory status (such as C-reactive protein). If TTR plasma concentrations decrease
when CRP remains stable, it may be due to an improvement in nutrition status; if the two
parameters are decreasing in parallel, TTR decrease may be related to the resolution of
the inflammatory episode as well (Table 8).
Table 8
Interpretation of TTR and CRP plasma level changes (7)
Protein C-reactive (CRP) Transthyretin (TTR) Interpretation
- impairment of nutritional status
- improvement of nutritional status
decrease in inflammation (with or without improved nutritional status)
inflammatory response
Serum transferrin (half life 7 days) is influenced by iron status.
In conclusion the serum proteins reflect the acute phase response and are
connected with the severity of the disease and prognosis.
They can be usful for monitoring nutritional interventions. For short-term
outcomes, transferrin, transthyretin (prealbumin) or retinol binding protein can
be used because of their short half-lives. Albumin is more suitable for long-term
outcomes because of its longer half-life.
Copyright © by ESPEN LLL Programme 2017
20
3.2.5 Measurement of Function
Testing of function is increasingly regarded as important in nutritional assessment, and
indeed muscle strength, and cognitive and immune functions all influence the quality of
life.
3.2.5.1 Muscle Strength
Muscle strength is a good functional parameter with which to predict the outcome in both
acute and chronic situations. Both muscle size and muscle inflammation are independent
predictors, first of muscle strength and secondly of outcomes. Among possible
measurements of muscle strength, hand grip strength, knee extension or hip flexion
strength or peak expiratory flow are typically used. Impaired hand grip strength has been
shown to be a good predictor of increased postoperative complications, increased length
of hospitalization, higher re-hospitalization rates and decreased physical status. In
addition, it is an excellent predictor not only of short- but also of long-term mortality
(27). For the interpretation of single values, adequate reference values have to be used.
Walking distance in a given time period (eg 3 minutes) can also provide an objective
measure of global function.
3.2.5.2 Cognitive Function
It is important to include a measurement of cognitive function (mood, concentration,
memory etc.) in a detailed assessment. There is however no established consensus on
the tests which can most optimally be used. Only in the elderly and in some patients with
liver disease are there simple practicable methods. For the moment, we necessarily rely
on the clinical impression in most patient groups.
3.2.5.3 Immune Function
Total lymphocyte counts (TLC) and delayed hypersensitivity reactivity (DHR) have been
used in the past to detect malnutrition-related immunosuppression. In most patients TLC
and DHR are not useful components of a nutritional assessment profile. Immune function
can be tested by the skin reactivity to an array of antigens. The results of this largely
reflect the severity of the disease and, as such, give a crude “yes” or “no” answer to the
question as to whether the immune function is compromised. It does not furnish a
quantitative measure of immune function. DHR is affected by hepatic failure, electrolyte
imbalance, infections, renal insufficiency, and immunosuppressive drugs. Lymphocyte
counts generally indicate also the degree of illness and do not reflect malnutrition
properly. TLC are influenced by hypoalbuminaemia, metabolic stress, infections, cancer,
and chronic diseases.
For the moment, the routine measurement of immune function is not recommended
because of the very controversial current data in respect of its nutritional significance.
3.2.5.4 Quality of Life Assessment (QoL)
In clinical assessment more and more, the overall quality of life assessment is used.
This can reflect the current overall health status and can be used as an outcome
parameter to monitor the effects of nutritional treatment. Several well-defined
instruments for different patient populations are available. QoL measurement is time
consuming.

Copyright © by ESPEN LLL Programme 2017
21
Qol is based on the perception of well-being in different domains:
- Physical (mobility, muscle strength)
- Symptoms (pain, weight loss, appetite, loss, nausea, constipation,
diarrhoea)
- Psychological (anxiety, depression)
- Social (isolation)
4. Assessment of Food Intake and Nutritional Questionnaires
Quantification of food intake and its comparison with energy expenditure may not only
describe current status but may also predict whether the patient’s nutritional status is
likely to improve or deteriorate.
[Nutrient balance = intake (e.g. food intake charts) - expenditure]
Food intake measurement is one of the main tools for assessing nutritional risk in
individuals and is also useful in population and epidemiological studies.
Food intake can be measured using either 3 or 7 day food diaries kept by the patient, or
by food intake charts kept by nursing staff and used by the dietician to calculate energy
and protein intake.
A simple method of measuring food intake is the “quarter plate technique”, used during
the ESPEN “nutritionDay” project. This method gives mainly quantitative and not
qualitative results.
Accurate assessment of dietary intake is difficult and prone to significant error and bias.
Food balance sheets and household budget surveys are indirect methods of food
consumption studies. Food records and dietary recalls measure food intake during
specified periods, usually 1-7 days. Because of day to day variability, several days of
records may be required to estimate usual food intake. Food frequency questionnaires
have been developed to obtain standardized data concerning usual long-term diet.
The determination of the consumption of nutrients can be achieved either by analyzing
the foods consumed directly or by using food composition tables. Most food composition
tables are organized according to the classification of foods into food groups. Dietary
reference intakes (DRI) provide standards to serve as a goal for good nutrition.
Questionnaires are in common use in medical practice and in nutrition assessment as
well as in the decision making process.
A questionnaire is a working instrument for measurement (the exact measurement of
quantity of different parameters dealing with the nutritional parameters), evaluation (to
get an impression of nutritional status in order to make correct clinical decisions),
survey, decision on treatment or diagnosis and research. A good questionnaire has
to be valid (as near as posible to the truth) and reliable (the results have to be
repeatable and the results for the same questions have to be very near to each other).
Furthermore it has to be as short as possible, structured in a friendly manner and easily
recorded.
Different types of data can be recorded:
- Demographic data (age, gender, race, marital status, socio-economic parameters)
- Nutritional intake (evaluation of the consumption of different nutrients using 24-hour
recall questionnaire, food frequency questionnaire or direct observation)
- Clinical data
A questionnaire can be completed by the patient himself, the physician, the dietician,
care-giver members of the team or family care-givers.

Copyright © by ESPEN LLL Programme 2017
22
It is important to be aware of the objective of each type of questionnaire. Many
questionnaires are designed for epidemiological surveys; others as clinical tools for
specific purposes; some are designed for every person and some for specific populations;
some are for the detection of malnutrition, while other concentrate on risk evaluation due
to metabolic diseases such as diabetes, hyperlipidaemia and obesity.
5. Summary All patients should have their nutritional status recorded at admission to hospital.
Nutritional screening is a tool for rapid and simple evaluation of patients at risk of
undernutrition.
ESPEN recently published guidelines for screening and recommends MUST for the
community the MUST, the NRS-2002 for the general hospital and the MNA for the elderly.
The NRS-2002 and the MNA are well validated.
Nutritional assessment is a more detailed approach and has to be done in those patients
screened at risk or when metabolic or functional problems prevent a standard plan being
carried out.
A complete nutritional assessment consists of a combination of subjective and objective
parameters. Patient history, physical examination, disease status, functional assessment
and laboratory tests are used.
The main goal is to identify patients at risk and to start adequate nutritional intervention
in all patients at risk.
6. References
1. Jensen GL, Mirtallo J, Compher C, et al. Adult starvation and disease-related
malnutrition: a proposal for etiology-based diagnosis in the clinical practice setting
from the International Consensus Guideline Committee. JPEN J Parenter Enteral
Nutr. 2010;34(2):156-9.
2. Stratton R, Green C, Elia M. Disease-related malnutrition: an evidence based
approach to treatment. Wallingford: CABI Publishing:. 2003.
3. Norman K, Pichard C, Lochs H, et al. Prognostic impact of disease-related
malnutrition. Clin Nutr. 2008;27(1):5-15.
4. Sorensen J, Kondrup J, Prokopowicz J, et al. EuroOOPS: an international,
multicentre study to implement nutritional risk screening and evaluate clinical
outcome. Clin Nutr. 2008;27(3):340-9.
5. Dupertuis YM, Kossovsky MP, Kyle UG, et al. Food intake in 1707 hospitalised
patients: a prospective comprehensive hospital survey. Clin Nutr. 2003;22(2):115-
23.
6. Lim SL, Ong KC, Chan YH, et al. Malnutrition and its impact on cost of
hospitalization, length of stay, readmission and 3-year mortality. Clin Nutr.
2012;31(3):345-50.
7. Freijer K, Tan SS, Koopmanschap MA, et al. The economic costs of disease related
malnutrition. Clin Nutr. 2013;32(1):136-41.
8. Cederholm T, Bosaeus I, Barazzoni R, Bauer J, Van Gossum A, Klek S, et al.
Diagnostic criteria for malnutrition - an ESPEN Consensus Statement. Clinical
Nutrition 2015;34(3):335-340.
9. Cederholm T, Barazzoni R, Austin P et al. ESPEN guidelines on definitions and
terminology of clinical nutrition. Clin Nutr 2017;36(1):49-64.

Copyright © by ESPEN LLL Programme 2017
23
10. David E et al. Current concepts in nutritional assessment. Archives of Surgery
2002;37:42-49.
11. Barendregt K et al. Diagnosis of malnutrition – Screening and Assessment. In:
Sobotka L, editor. Basics in Clinical Nutrition. 3rd edition. Prag: Galen; 2004, 11-
18.
12. Kondrup J et al. ESPEN guidelines for nutrtion screening 2002. Clin Nutr 2003;22:
415-421.
13. Weekes CE et al. The development, validation and reliability of a nutrition screening
tool based on the recommendations of BAPEN. Clin Nutr 2004;23:1104-1112.
14. Kondrup J, Rasmussen H, Hamberg O, Stanga O. Nutritional risk screening
(NR2002): A new method based on analysis of controlled clinical trials. Clin Nutr
2003;22(3):321-336.
15. Guigoz Y et al, Assessing the nutritional status of the elderly: The mini nutritional
assessment as part of the geriatric assessment (MNA). Nutr Rev 1996;54:S59-65.
16. Rubenstein LZ, Harker JO, Salva A, Guigoz Y, Vellas B. Screening for undernutrition
in geriatric practice: developing the short-form mini-nutritional assessment (MNA-
SF). J Gerontol A Biol Sci Med Sci 2001 06;56(6):M366-M372.
17. Heyland DK, Dhaliwal R, Jiang X, Day AG. Identifying critically ill patients who
benefit the most from nutrition therapy: the development and initial validation of a
novel risk assessment tool. Crit Care. 2011;15:R268-R275.
18 Rahman A, Hasan RM, Agarwala R et al. Identifying critically-ill patients who will
benefit most from nutritional therapy: Further validation of the "modified NUTRIC"
nutritional risk assessment tool. Clin Nutr. 2016;35:158-62.
19. Detsky AS et al. What is subjective global assessment of nutritional status? J
Parenter Enteral Nutr (JPEN) 1987;11:8-13.
20. Forbes GB, Bruining GJ. Urinary creatinine excretion and lean body mass. Am J Clin
Nutr 1976;29:1359-1365.
21. Kyle UG, Bosaeus I, De Lorenzo AD, et al. Bioelectrical impedance analysis--part I:
review of principles and methods. Clin Nutr. 2004;23(5):1226-43.
22. Kyle UG, Bosaeus I, De Lorenzo AD, et al. Bioelectrical impedance analysis-part II:
utilization in clinical practice. Clin Nutr. 2004;23(6):1430-53.
23. MacDonald AJ, Greig CA, Baracos V. The advantages and limitations of cross-
sectional body composition analysis. Curr Opin Support Palliat Care.
2011;5(4):342-9.
24. Bokhorst-de van der Schueren M, Soeters P, Reijven P, et al. Diagnosis of
malnutrition - Screening and assessment. In: Basics in Clinical Nutrition, 4th
Edition; Allison S.P., Forbes A., Ljungqvist, Meier R.F., Pertkiewicz M, Soeters PB.
Galén, Prague. 2011.
25. Kudsk KA, Tolley EA, DeWitt RC, et al. Preoperative albumin and surgical site
identify surgical risk for major postoperative complications. JPEN J Parenter Enteral
Nutr. 2003;27(1):1-9.
26. Reinhardt GF, Myscofski JW, Wilkens DB, et al. Incidence and mortality of
hypoalbuminemic patients in hospitalized veterans. JPEN J Parenter Enteral Nutr.
1980;4(4):357-9.
27. Norman K, Stobaus N, Gonzalez MC, et al. Hand grip strength: outcome predictor
and marker of nutritional status. Clin Nutr. 2011;30(2):135-42.