Embed Size (px)
Citation preview

Topic #4
Soil Compaction

What is Compaction?
A simple ground improvement technique, where the
soil is densified through external compactive effort.
+ Water =
Compactive
Effort
2

Phase diagrams showing the changes in soil as it moves from its
natural location to a compacted fill.
Note that the volume of solids does not change during the process.
3
Compaction and Phase Diagram

Changes in volume as soil is excavated, transported, and
compacted. The numerical values are examples and would be
different for each soil.
4
Volumetric Change During Excavation and Compaction

Soil compaction is defined as the method of mechanically
increasing the density of soil by reducing volume of air.
Solids
Water
Air
Solids
Water
Air
Compressed
soil
Load
Soil
Matrix
gsoil (1) = WT1
VT1
gsoil (2) = WT1
VT2
gsoil (2) > gsoil (1)
Definition
5

Compaction of Soils in the Laboratory
6

Compaction in the Laboratory
Compaction test is performed on graded aggregate soils in the
laboratory to obtain the compaction curve. The compaction curve is
used to determine the optimum water content (wopt) and the maximum
dry density (gdry) of the soil sample for a specific compactive effort.
Standard Proctor Modified Proctor
3 layers
25 blows per layer
5 layers
25 blows per layer
2.49 kg (5.5 lb.) hammer
305 mm (12 in.) drop
4.54 kg (10 lb.) hammer
457 mm (18 in.) drop
7
In the standard test we compact the soil in
three layers, (as shown), while in the modified
test we compact the soil in five layers.
Mold and Hammer for a Proctor Compaction Test
8

Compaction Curve
Water content (w%)
Dry
Den
sity
(g d
)
Optimum Moisture
Content (OMC)
- Soil grains densely packed
- Good strength and stiffness
- Low permeabilitygd (max)
9

The water content-density relationship indicating the increased density resulting from the addition of water and
applied compaction effort.
Soil is a silty clay, LL = 37, PI = 14, standard Proctor compaction (after Johnson and Sallberg, 1960).
Beyond OMC,
excess water results
in lower density.
Water acts as a
lubricating agent
and replaces the
air in the void
structure,
therefore results
in higher density
Dry Side:
10
Role of the Water at the Two Sides of the MD Curve


Soil Compaction in the Laboratory
Standard Proctor Test
wc1 wc2 wc3wc4 wc5
gd1 gd2 gd3gd4 gd5
Optimum
Moisture
Content
Water
Content
Dry Density
gd max
Zero Air Void Curve
Sr =100%
Compaction
Curve
1
2
3
4
5
OMC
4 inch diameter compaction mold
(V = 1/30 cubic foot)
5.5 pound hammer
25 blows
per layer
H = 12 in
Wet to
OptimumDry to
Optimum
Increasing Water Content
S
wG
G
s
wsZAV
1
gg
w
wetdry
1
gg
e
G wsdry
1
gg
12

Zero Air Void (ZAV) Curve
All compaction points should
lie to the left of ZAV curve
corresponds to 100% saturation
Water Content (w)
Dry
Density (
d)
Zero air void curve (S=100%)
s
wsd
wG
G
1
S<100%
S>100% (impossible)
13

Methods:
1- Standard Proctor Test
2- Modified Proctor Test
Standard Proctor Test Modified Proctor TestModified Proctor Test
Compaction Energy:12,400 ft.- Ib/ft3
Compaction Energy:56,200 ft.- Ib/ft3
Summary of Proctor Compaction Test
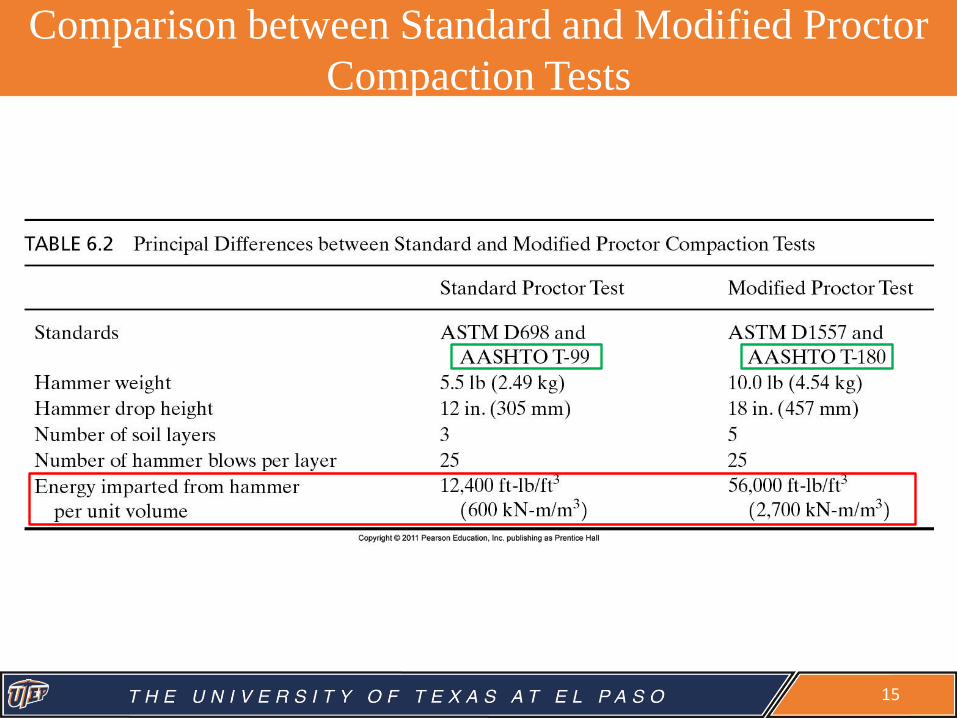
Comparison between Standard and Modified Proctor
Compaction Tests
15

Effect of Compaction Energy
on Moisture-Density Curve
Increasing compactive
effort results in:
E1
E2 (>E1)Lower optimum
water content
Higher maximum dry density
Water content
Dry
den
sity
(
d)
16

Compaction Energy Proctor Tests
1- Standard Proctor Test
ASTM D-698 or AASHTO T-99
2- Modified Proctor Test
ASTM D-1557 or AASHTO T-180
Energy = 12,375 foot-pounds per cubic foot
Energy = 56,520 foot-pounds per cubic foot
Number of blows per layer x Number of layers x Weight of hammer x Height of drop hammer
Volume of moldEnergy =
Moisture
Content
Dry Density
gd max
Compaction Curve for
Standard Proctor test
gd max
Zero Air Void (ZAV) Curve
Sr = 100%
Line of optimum (LOO)
wp ws
Compaction Curve for
Modified Proctor test
17

Water Content
Dry
Den
sit
y
Effect of Energy on Soil Compaction
Higher
Energy
Increasing compaction energy Lower OMC and higher dry density
In the field increasing compaction
energy = increasing number of
passes or reducing the thickness
of the lift.In the lab increasing
compaction energy =
increasing number of
blows (assuming weight
of the hammer and the
drop height stays the
same) or by dividing the
soil in thinner lifts.
18

Comparison of Standard Proctor Test and
Modified Proctor Test Results for the Same Soil
19

20

Compaction and Clay Fabric
Higher water content
or higher compactive
effort results in more
oriented fabric.
more dispersed fabric
more
dis
pers
ed f
abric
Dry
density (
d)
Moisture Content
Dry
Density
21

Standard and Modified Proctor Compaction Curves
(Summary)
w
wetdry
1
gg
S
wG
G
s
wsZAV
1
gg
22

Improvements in Particle Contacts by
Mechanical Compaction
23
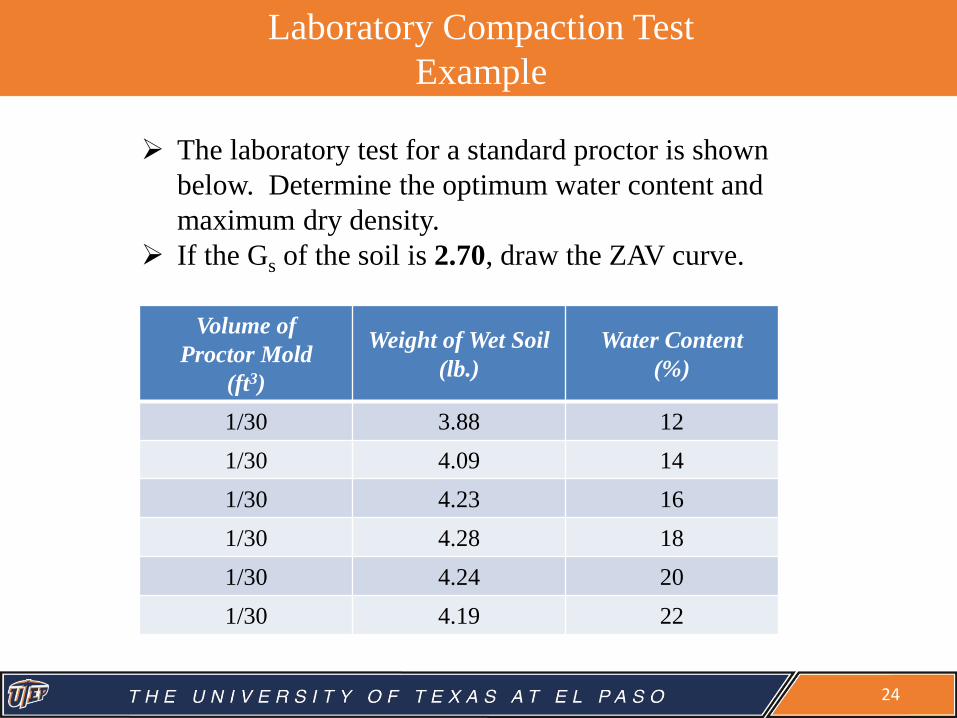
The laboratory test for a standard proctor is shown
below. Determine the optimum water content and
maximum dry density.
If the Gs of the soil is 2.70, draw the ZAV curve.
Volume of
Proctor Mold
(ft3)
Weight of Wet Soil
(lb.)
Water Content
(%)
1/30 3.88 12
1/30 4.09 14
1/30 4.23 16
1/30 4.28 18
1/30 4.24 20
1/30 4.19 22
Laboratory Compaction Test
Example
24

Volume of
Proctor Mold
(ft3)
Weight of Wet
Soil
(lb.)
Wet Unit
Weight
(lb/ft3)
Water Content
(%)
Dry Unit
Weight
(lb/ft3)
1/30 3.88 116.4 12 103.9
1/30 4.09 122.7 14 107.6
1/30 4.23 126.9 16 109.4
1/30 4.28 128.4 18 108.8
1/30 4.24 127.2 20 106.0
1/30 4.19 125.7 22 103.0
Laboratory Compaction Test
Solution
w
wetdry
1
gg
mold
wetwet
V
Wg
25

100
101
102
103
104
105
106
107
108
109
110
111
112
113
114
115
10 11 12 13 14 15 16 17 18 19 20 21 22 23
gdry max
Optimum Water Content (%)
Dry
De
ns
ity (
lb/f
t3)
S
wG
G
s
wsZAV
1
gg
w
wetdry
1
gg
26

Typical Compaction Specifications
100)(
)(
Labd
FielddRC
g
gRelative Compaction (RC) in percent:
27

Field Compaction Curvess
Because of the differences between lab and field
compaction methods, the maximum dry density in
the field may reach 90% to 95%.
The most efficient
or economical water
content is between
wopt and b.
28

minmax
max
ee
eeDr
(min)(max)
(min)
dd
dd
dIgg
gg
Relative Density or Index Density based on Void Ratio (e)
Relative Density or Index Density based on Dry Density (gd)
Relative Density-Definitions
In practice, its often useful to know how dense or how loose the
soil is with respect to its densest and loosest conditions. That’s
when we use the relative density concept.
e max : Void ratio of the soil in its loosest condition
e min : Void ratio of the soil in its densest condition
e : Current void ratio of the soil in the field
gd (max) : Dry unit weight of the soil in its densest condition
gd (min) : Dry unit weight of the soil in its loosest condition
gd : Current unit weight of the soil in the field
29

Filed Compaction
- Pneumatic rubber tired roller
Different types of rollers (clockwise from top right):
- Vibratory plate
• - Smooth-wheel roller
- Sheepsfoot roller
30

Field Compaction
Compacts effectively only to 200-300 mm;
therefore, place the soil in shallow layers (lifts)
Smooth Wheeled Roller
31

Field Compaction
Commonly used for compacting
relatively small areas, effective for
granular soils.
Vibrating Plates
32

Field Compaction
Provides kneading action;
“walks out” after compaction,
very effective on clays.
Sheepsfoot Roller
33

Field Compaction
Provides deeper (2-3 m) compaction. e.g., airfield
Impact Roller
34

Recent Modifications to the Impact Rollers

36
Grid Roller

Soil types best suited for various kinds of compaction equipment.
(Adapted from Caterpillar, 1993.)
37
Selection of Rollers Based on Soil Type

Compaction Control
A quality control measure where you check
at regular intervals whether the compaction
was done according to specifications.
e.g. one core per 1000 m2 of
compacted soil in the field
Minimum dry density
Range of water content
Field measurements of d obtained using:
Non-Destructive Testing, such as Nuclear Density Gauge
Destructive Testing, such as Sand Cone Test
38

Sand Cone Test
39

Determination of the Soil Density in the Field
Sand Cone Test
A small hole (6" x 6" deep) is dug in the compacted
material to be tested. The soil is removed and
weighed, then dried and weighed again to determine
its moisture content. The specific volume of the
hole is determined by filling it with calibrated dry
sand from a jar and cone device. The dry weight of
the soil removed is divided by the volume of sand
needed to fill the hole. This gives us the density of
the compacted soil in lb. per cubic foot. This density
is compared to the maximum Proctor density
obtained in the lab, which gives us the relative
density of the compacted soil in the field.
1- Sand Cone (ASTM D1556)
40

Performing Sand Cone Test in the Field
41

Performing a Nuclear Density Test in the Field
42

Dense soil absorbs more radiation than
loose soil and the readings reflect overall
density. Water content (ASTM D3017)
can also be read, all within a few minutes.
2- Nuclear Density (ASTM D2292)
43
Determination of the Soil Density in the Field
Nuclear Density Gauge
Nuclear Density meters are a quick way of determining density
and moisture content. The meter uses a radioactive isotope
source (Cesium 137) at the soil surface (backscatter) or from a
probe placed into the soil (direct transmission). The isotope
source gives off photons (usually Gamma rays) which radiate
back to the detectors at the bottom of the unit.

Intelligent Compaction
Intelligent Compaction (IC) measures stiffness (the ability of
a material to resist deformation under a load) rather than
density of the compacted soil. A strong correlation exists
between stiffness and bearing capacity of foundations.
A machine equipped with an intelligent compaction system
provides four basic functions:
1) Measures the stiffness of the soil.
2) Controls or guides the compaction effort in response to the
measured stiffness.
3) Displays the stiffness measurement to the operator.
4) Maps and records the compaction results.
Such a system would enable the user to produce detailed
plots of the soil stiffness levels, the number of roller passes,
as well as the location and time of the application.
44

Dynamic Compaction
Pounding the ground by a heavy weight
Suitable for granular soils, land fills
and karst terrain with sink holes.
Crater created by the impact
Pounder (Tamper)
solution cavities in
limestone
(to be backfilled)
45

Dynamic (or Impact) Compaction
46

Dynamic Compaction
Pounder
(Tamper)
Mass = 5-30 ton
Drop = 10-30 m
𝐷 = 𝑛 (𝑊 × 𝐻)0.5
D: Influence depth (improvement)in meters
W: Mass of tamper in mega grams
H: Drop height in meters
n: model parameter, typically less than 1
47

Construction Equipment
Large Dump Truck
48

Grader for spreading soil
49
Construction Equipment

Bulldozer for evenly spreading soil
50
Construction Equipment

Loader
51
Construction Equipment
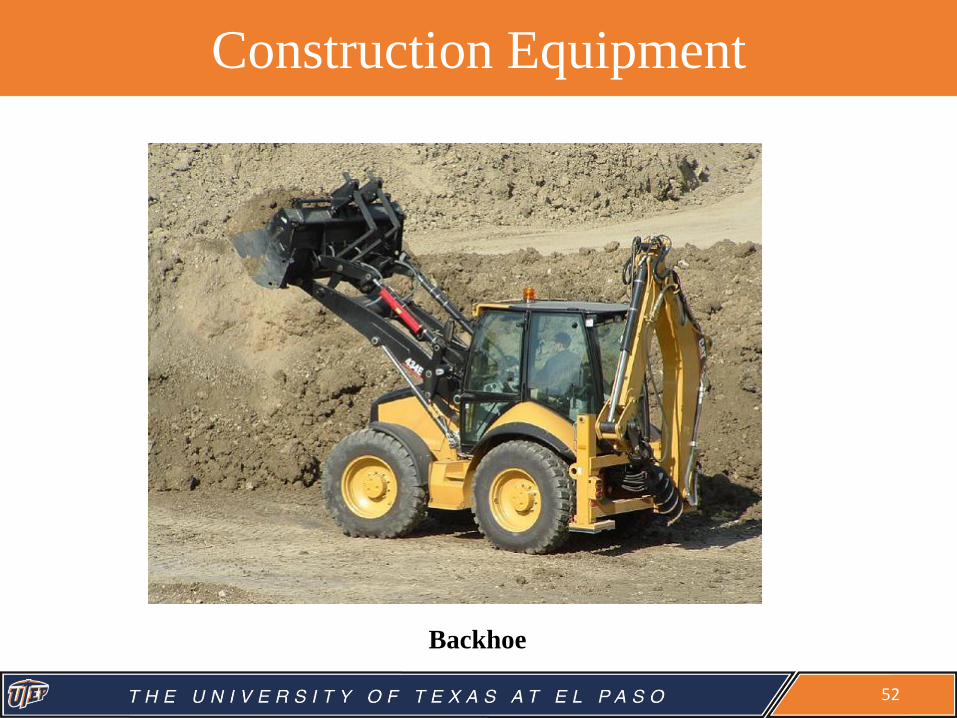
Backhoe
52
Construction Equipment

Crawler mounted Hydraulic Excavator
53
Construction Equipment

Rock Breaker
54
Construction Equipment

Water Truck
55
Construction Equipment