Embed Size (px)
Citation preview
1
Group project in the construction industry
In this topic guide you will learn about the methods for evaluating group performance, and presenting records of project development and group activity to interested audiences.
This topic guide covers: • evaluating the project and making recommendations for improvement • the format and content of project data • project presentation techniques • making presentations.
LinkHNC in Construction and the Built Environment: Unit 5 Group project in the construction industry, learning outcome 3, assessment criterion 3.1; learning outcome 4, assessment criteria 4.1–4.2.
Evaluation and presentation techniques3
2
Group project in the construction industry
3 Evaluation and presentation techniques
1 Evaluating the project and making recommendations for improvement
The purpose of project evaluation The main aim of project evaluation is to identify and take on board lessons learned during the completion of the project, so that similar work in the future can be completed in a better and more effective way. The actual process for completing project evaluation involves collecting, recording and organising information about project results. It is important that the evaluation process is followed for all projects that are completed, regardless of the size of the contract. This is because each project that is undertaken will have its own unique circumstances and learning points that can be used to help strengthen performance on future projects.
So, what does the project evaluation process actually entail? Typically, the points covered during an evaluation will centre on:
• the progress that has been made • whether the desired outcomes were achieved (was the client satisfied?) • the presence of any defects at time of handover • the timeliness of project completion/handover • the correlation between what has been achieved and what has been inputted
(i.e. time, money, resources) • the performance of the project team, including sub-contractors • the effectiveness of initial design solutions • performance against programme • performance against budget • health and safety performance (were there any incidents?).
The completion of this process may also be termed a project evaluation review (PER), although a PER document is typically produced on behalf of a client to show how successful a project was. A PER will identify and document the project’s performance against its critical success factors and key performance indicators (KPIs).
Case study: KPIs in the construction industryThe UK construction industry has a national data set of KPIs against which project or company performance can be benchmarked. BRE has also, in conjunction with the University of Salford, developed a ‘KPI engine’ which can be used to help with the collection, reporting and analysis of KPI-related evaluation data. For a demonstration of how the engine works, access www.bre.co.uk/page.jsp?id=1478.
Where relevant, PER documents should reference any initial project feasibility or cost–benefit analysis made during the project planning and start-up phases to confirm the validity of information.
3
Group project in the construction industry
3 Evaluation and presentation techniques
General methods for evaluating performance and improving future performanceUse of a site diary
As a rule, the site diary does not need to be completed in an immensely detailed way, but it is important to record all significant factors and developments relating to the project. This is especially important if there is any post-project argument about what actually happened during the construction phase. This being the case, the site diary should include details such as:
• the dates of certain site activities (when they were started and completed) • the dates of materials’ deliveries • the dates when sub-contractors began on site • details of any delays (duration of delay plus the cause), etc.
Photographic records may also be kept with the site diary to reinforce important or innovative site developments (although good pictures from successful projects will probably be commandeered by the marketing department!). In terms of the evaluative benefit of the site diary, this relies on recording the details of both successful and less successful site activities.
Design elements/proposals
Consideration should be given to the benefits of retaining designs that were proposed and/or used for a project – just in case they come in useful for any future projects of a similar scope and nature. If past designs are kept, it is important that they are indexed properly and logically so that they can be accessed easily.
However, note that, although the practice of saving previous designs for future use is particularly useful in manufacturing processes, its relevance to construction projects is limited by the fact that every construction project is unique in terms of the exact circumstances and constraints that apply to the build.
Network and planning elements
Network diagrams and shared planning documentation are usually developed during the early stages of a construction project. Although it is unlikely that a network diagram that is developed for one project could ever apply exactly to another, it is likely that elements within a network will be repeated on other projects. Given that the majority of network programming and project planning is now done electronically using IT software (Microsoft® Project or Oracle® Primavera®, etc.), it is relatively easy to transfer data from one project to another.
The use of previous project planning documentation can be extremely useful as it allows those involved in planning to:
• build on past experience • eliminate bugs/problems that have already come to light on previous projects • reduce the amount of time and money that is spent on the development of
project plans • ensure that project plans are made available more quickly than if they are
being developed from new.
4
Group project in the construction industry
3 Evaluation and presentation techniques
Sub-contractors and suppliers
At the end of every project it is worth evaluating the level of service and support that has been provided by sub-contractors. Factors that should be considered in the evaluation of sub-contractor performance include:
• whether their performance met the required standards of quality and work • whether the service provided represented value for money • how well the sub-contractor(s) integrated with site/main contractor working
practices and processes • whether the sub-contractor(s) completed the work that was allocated in a
timely fashion.
Evaluation of supplier performance may also be undertaken along similar lines by considering factors such as:
• whether the suppliers delivered on time • whether goods supplied were as specified on purchase orders (POs) – correct
type and quantity • the flexibility of the suppliers in terms of PO amendments and delivery of
emergency ‘one-off’ items • provision of all appropriate documentation with supplied goods (e.g.
materials’ certificates of conformity, (Control of Substances Hazardous to Health) COSHH data sheets, and appliance or component operating and maintenance instructions).
The outcome of such evaluations will produce an overall rating of each external sub-contractor or supplier, which can then be used to determine whether they are considered for future projects.
Evaluation of the group projectIn addition to the standard evaluation techniques that may be used to assess the quality or otherwise of initial and final project proposals (i.e. assessing them against the requirements of the project brief, whether they meet client expectations, etc.) and the final conclusions, a key evaluative technique for the group project will be to assess how well the group has worked together as a team.
One way of achieving this is to develop a questionnaire or survey to be completed by each member of the group. There are a number of ways that this can be done, and a number of different types and styles of survey/questionnaire that can be used.
The simplest types of questionnaire tend to have a series of statements or questions that the respondent answers by ticking an appropriate box to indicate their level of agreement.
Other questionnaires are designed to ascertain more qualitative feedback and to encourage respondents to write more detailed answers.
One of the easiest and quickest ways of developing a questionnaire is to use a bespoke software programme such as SurveyMonkey®, which allows for easy development and online distribution of any type of questionnaire.
5
Group project in the construction industry
3 Evaluation and presentation techniques
Portfolio activity (HNC Unit 5: 3.1)Set up an account on SurveyMonkey® and develop your own questionnaire for other members of the group with whom you have worked on the project. Use appropriate questions in order to give the survey a qualitative focus, which will allow you to evaluate how well the group project has been delivered.
2 Format and content of project dataQualitative project dataBy definition, the qualitative data that relates to construction projects that are different in nature is very variable. However, the general strands of data that apply to all projects can be broadly ordered into different themes (e.g. data relating to finance or programming, design modelling/representative techniques).
In simple terms, as construction projects and construction project data is mainly descriptive and relates directly to facts (when? where? how? how much?) – these are the questions and areas that may be taken as ‘themes’ for the presentation of data.
Coding of dataAgain, in simple terms, the coding of data relates to the cataloguing and categorising of information so that data relating to a given theme or area can be easily summarised and presented.
For example, the first stage of the process might be to list the different themes, labelling them appropriately (A, B, C, etc.). Usually between three and five themes is sufficient but there may only be two main themes which need subdivision. Having too many themes may mean that some of them have insufficient data.
Techniques for the completion of data coding include: • generation of a simple table of data that can be coded against • use of an electronic file directory structure.
Summarising qualitative dataThere are a number of recognised methods that can be used to summarise data that has been collected. The nature of the data will usually suggest the most appropriate method to use. The more common methods for presenting data are summarised below.
Spider diagrams
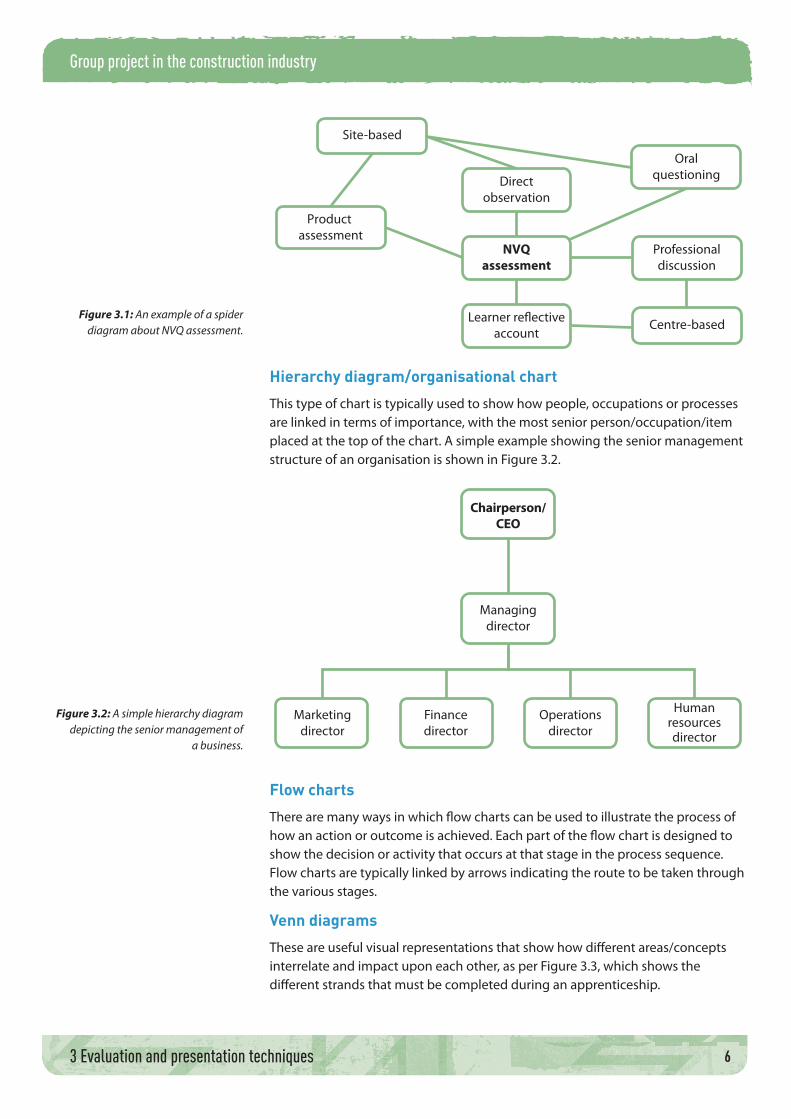
The term ‘spider diagram’ is pretty self-explanatory when you look at how the diagram is presented. The various themes and points that relate to a central idea are shown in boxes which are then interlinked by a series of connectors or arrows to show how they interrelate. Figure 3.1 shows the different assessment methods that can be used for ascertaining vocational competence at operative level.
6
Group project in the construction industry
3 Evaluation and presentation techniques
Directobservation
Productassessment
Oralquestioning
NVQassessment
Professionaldiscussion
Learner reflectiveaccount
Site-based
Centre-basedFigure 3.1: An example of a spider
diagram about NVQ assessment.
Hierarchy diagram/organisational chart
This type of chart is typically used to show how people, occupations or processes are linked in terms of importance, with the most senior person/occupation/item placed at the top of the chart. A simple example showing the senior management structure of an organisation is shown in Figure 3.2.
Managingdirector
Chairperson/CEO
Marketingdirector
Financedirector
Operationsdirector
Humanresourcesdirector
Figure 3.2: A simple hierarchy diagram depicting the senior management of
a business.
Flow charts
There are many ways in which flow charts can be used to illustrate the process of how an action or outcome is achieved. Each part of the flow chart is designed to show the decision or activity that occurs at that stage in the process sequence. Flow charts are typically linked by arrows indicating the route to be taken through the various stages.
Venn diagrams
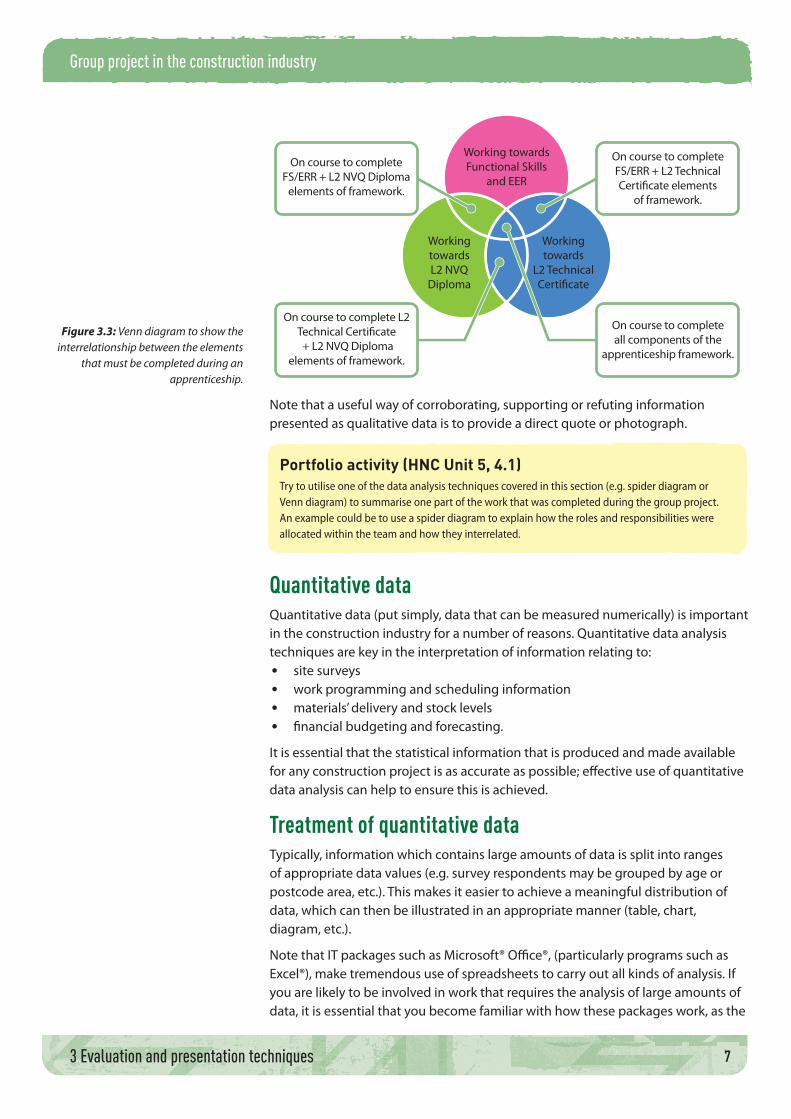
These are useful visual representations that show how different areas/concepts interrelate and impact upon each other, as per Figure 3.3, which shows the different strands that must be completed during an apprenticeship.
7
Group project in the construction industry
3 Evaluation and presentation techniques
Working towardsFunctional Skills
and EER
WorkingtowardsL2 NVQ
Diploma
Workingtowards
L2 TechnicalCertificate
On course to completeFS/ERR + L2 NVQ Diploma
elements of framework.
On course to complete L2Technical Certificate + L2 NVQ Diploma
elements of framework.
On course to completeall components of the
apprenticeship framework.
On course to completeFS/ERR + L2 TechnicalCertificate elements
of framework.
Figure 3.3: Venn diagram to show the interrelationship between the elements
that must be completed during an apprenticeship.
Note that a useful way of corroborating, supporting or refuting information presented as qualitative data is to provide a direct quote or photograph.
Portfolio activity (HNC Unit 5, 4.1)Try to utilise one of the data analysis techniques covered in this section (e.g. spider diagram or Venn diagram) to summarise one part of the work that was completed during the group project. An example could be to use a spider diagram to explain how the roles and responsibilities were allocated within the team and how they interrelated.
Quantitative dataQuantitative data (put simply, data that can be measured numerically) is important in the construction industry for a number of reasons. Quantitative data analysis techniques are key in the interpretation of information relating to:
• site surveys • work programming and scheduling information • materials’ delivery and stock levels • financial budgeting and forecasting.
It is essential that the statistical information that is produced and made available for any construction project is as accurate as possible; effective use of quantitative data analysis can help to ensure this is achieved.
Treatment of quantitative data Typically, information which contains large amounts of data is split into ranges of appropriate data values (e.g. survey respondents may be grouped by age or postcode area, etc.). This makes it easier to achieve a meaningful distribution of data, which can then be illustrated in an appropriate manner (table, chart, diagram, etc.).
Note that IT packages such as Microsoft® Office®, (particularly programs such as Excel®), make tremendous use of spreadsheets to carry out all kinds of analysis. If you are likely to be involved in work that requires the analysis of large amounts of data, it is essential that you become familiar with how these packages work, as the
8
Group project in the construction industry
3 Evaluation and presentation techniques
software does all the work once the data has been entered and calculations are carried out automatically.
The following sections provide more information on the main types of data that are typically collected during quantitative research: location, dispersion and distribution.
Location Location statistics refer to the relative ‘position’ of data in relation to other values and are therefore chiefly concerned with mean, median and mode.
• Mean – the average of a number of values; calculated by totalling the values and then dividing by the number of items which have been totalled.
• Median – the value (or values) which sit in the middle of a set of data (i.e. 50 per cent of the data values will be above the median; 50 per cent will be below).
• Mode – the term that represents the items of data within a range that appear most frequently.
The following points should be noted when considering location data. • Mean values are best suited to data which is continuous, and which can have
any value (e.g. outside temperature levels). • The values of the mean and the median should normally be close; where this
is not the case the data is likely to be ‘skewed’.
Dispersion Information that covers how data is spread, or how data is clustered around a particular location value, is known as dispersion. The items that apply to dispersion can be summarised as:
• range – the difference between the highest and the lowest values in a range of given data
• inter-quartile range – reflects the spread of the middle 50 per cent of items within a data range
• variance and standard deviation – the variance and standard deviation figures represent the amount by which items of data deviate from the mean.
The variance is calculated in the following way. • Subtract values from the mean. • Square the individual differences from the mean. • Find the mean of the squared differences.
To calculate the standard deviation, it is necessary to find the square root of the variance.
The advantage of completing this additional exercise is that it can help to identify anomalies and items that are departures from the ‘norm’ more accurately. This is usually the first step in the process of investigation to explain why the value in question is different.
DistributionData distribution relates to the frequencies at which different values appear. Typical data distribution of naturally occurring data (e.g. outside temperatures/people’s shoe sizes) will exhibit ‘normal’ distribution characteristics whereby the mean, median and mode are in the middle of the data set.
9
Group project in the construction industry
3 Evaluation and presentation techniques
3 Project presentation techniquesThe nature of the group project means that the presentation of information relating to it is likely to assume a number of forms (e.g. written reports, minutes of meetings, specifications, plans, graphic representations of building models, etc.). However, all of this information will have to be presented verbally and visually at some stage. We will now look at the basic characterisitcs of written, visual and verbal communication.
Written communicationIn general terms, the advantages of written communications/documents are that they provide:
• a permanent record, which can be copied (as required) or filed and stored for future reference
• an ‘easy-to-read’ format for complex documents or technical information.
The disadvantages of written communications/documents are that: • producing detailed written information is a time-consuming process, which
means that feedback or response times can be delayed • it is an impersonal method of communication and can also, depending on
how a document is written, be open to interpretation by the reader.
Poor reports can: • be long-winded and difficult to understand • be poorly structured • have insufficient headings or subheadings so it is difficult to find your way
around them • be hard to read, with large chunks of text and long paragraphs • be pitched at the wrong level.
Verbal communicationIn the main, the secret of project presentation techniques, particularly the techniques that will be required during the presentation of the group project, will depend on the personal contact between the presenter and an audience. The characteristics of this interaction will relate to the quality of the communication between whoever is presenting and the audience.
Effective verbal communication is based on two factors. They are: • speaking • listening.
Obviously, these are crucial elements in group presentations/discussions. The following checklist includes some dos and don’ts to help you get the most out of direct communication.
LinksNVQ Engineering Environmental Technologies: Unit 2 Manage the development of self and others, learning outcome 2, assessment criteria 2.1–2.4.
NVQ Engineering Environmental Technologies: Unit 19 Managing the effectiveness of a building services engineering workforce, learning outcome 2, assessment criteria 2.1–2.2.
NVQ Engineering Environmental Technologies: Unit 36 Developing working relationships, learning outcome 2, assessment criteria 2.1–2.4.

10
Group project in the construction industry
3 Evaluation and presentation techniques
Dos and don’ts when making group presentations or holding discussions
Do: try to make relevant contributions to discussions – don’t just say
something for the sake of being involved allow others to contribute to discussions speak clearly and not too quickly, using appropriate language at an
audible volume try to summarise the main points of the conversation, particularly as the
discussion is drawing towards a close try to use different tones of voice to keep the listeners interested in what
you are saying when speaking face to face, try to use body language and facial
expressions to emphasise positive elements.
Don’t: use inappropriate or offensive language speak incoherently or incomprehensibly (mumble, use garbled language
or speak too quickly) speak in one tone or in a manner which may suggest to others that you
are not really interested in what you are saying be overly loud and brash in order to dominate the conversation – it is
essential that others are allowed to contribute use technical jargon and difficult trade-based terms that others would
find difficult to understand look uninterested or exhibit characteristics which suggest you don’t care
and would rather be somewhere else.
Listening skills
Dos and don’ts of listening
Do: pay attention to what is being said use body language at appropriate times (e.g. smile, nod your head) to let
the speaker know that they have your full attention take notes to preserve a record of any important points that are made, if
required ask questions if you don’t understand (depending on the nature of
the situation). For example, during a one-to-one discussion it may be fine to ask questions as and when the need arises but during a formal presentation it may not be appropriate to disturb the presenter with questions while they are in ‘full flow’! (Usually, formal presentations will conclude with a question and answer session, which will provide the opportunity to ask presenters about things that have been covered.)
11
Group project in the construction industry
3 Evaluation and presentation techniques
Don’t: allow yourself to be distracted (this may be a result of daydreaming,
interruption by a mobile phone or outside noise). It is important and polite to ensure that your attention remains focused on the speaker
interrupt the speaker – it may be necessary at times to do so (for example, if someone else unexpectedly enters the room) but it should be done in a courteous manner, and in a way that minimises disruption to the speaker
pretend that you understand what the speaker is saying if you don’t – if there is any doubt in your mind about what is being said, wait for an appropriate time, or break, and ask a question to seek clarification.
ActivityThink about the last time you gave a presentation or attended one. How many of the ‘dos and don’ts’ did you notice? Were you guilty of any of the ‘don’ts’? What would you do differently now?
4 Making presentationsIt is inevitable that, at certain points during your career (including your studies), you will have to deliver presentations. Unless you are lucky enough not to be fazed by public speaking, this will usually entail a degree of trepidation and nervousness. The purpose of this section is to try to give you a few useful tips that will help you when you have to prepare for a presentation.
Types of presentationThere are two main types of presentation, formal and informal. A formal presentation involves relaying information to an audience and will usually happen at a suitable venue (i.e. a meeting room, conference suite or classroom, etc.) with access to appropriate presentation aids and equipment. An informal presentation will also involve relaying information but the type of venue is not restricted to a classroom or auditorium.
An informal presentation can be delivered in any location, as long as the audience can hear what the presenter is saying. Informal presentations frequently happen on construction sites in the guise of site briefings and toolbox talks. Sometimes the audience members may be given notes to take away or (in the case of toolbox talks) be given a demonstration of how to use or wear something correctly.
The majority of the presentation guidance that is provided here will apply to both types of presentation, although the items dealing specifically with the effective use of presentation software (for example, Microsoft® PowerPoint®) may not apply to informal presentations.
12
Group project in the construction industry
3 Evaluation and presentation techniques
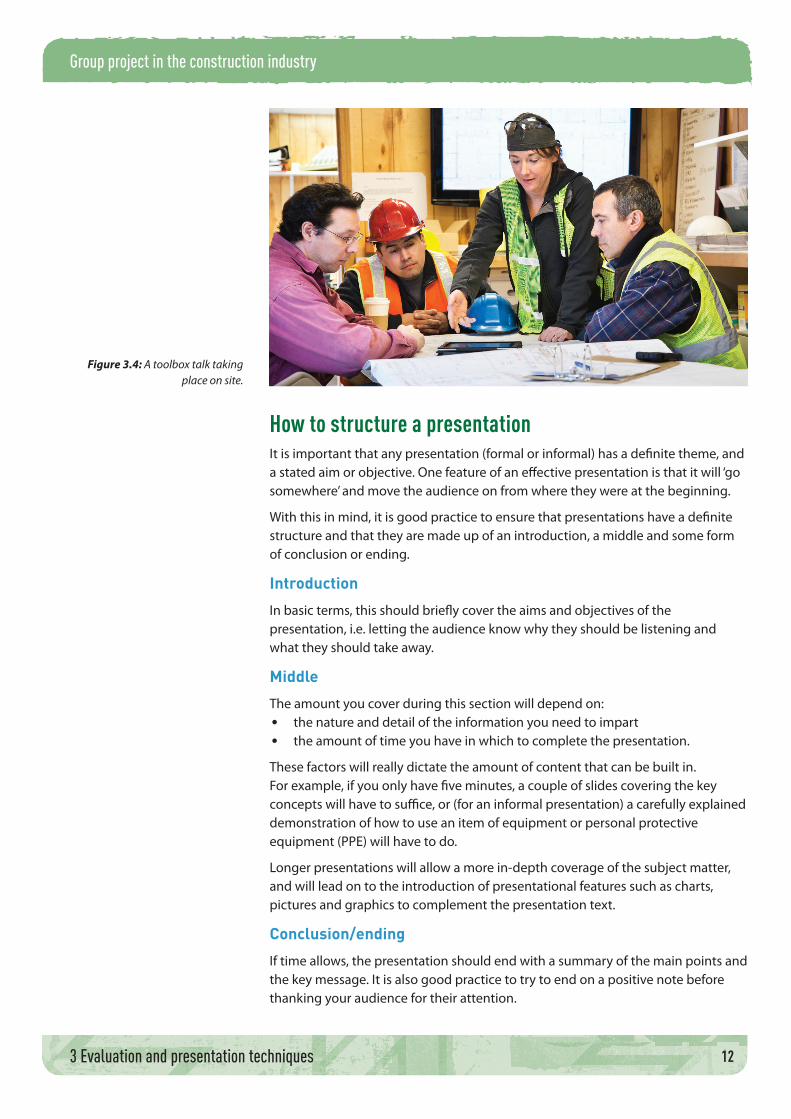
Figure 3.4: A toolbox talk taking place on site.
How to structure a presentationIt is important that any presentation (formal or informal) has a definite theme, and a stated aim or objective. One feature of an effective presentation is that it will ‘go somewhere’ and move the audience on from where they were at the beginning.
With this in mind, it is good practice to ensure that presentations have a definite structure and that they are made up of an introduction, a middle and some form of conclusion or ending.
Introduction
In basic terms, this should briefly cover the aims and objectives of the presentation, i.e. letting the audience know why they should be listening and what they should take away.
Middle
The amount you cover during this section will depend on: • the nature and detail of the information you need to impart • the amount of time you have in which to complete the presentation.
These factors will really dictate the amount of content that can be built in. For example, if you only have five minutes, a couple of slides covering the key concepts will have to suffice, or (for an informal presentation) a carefully explained demonstration of how to use an item of equipment or personal protective equipment (PPE) will have to do.
Longer presentations will allow a more in-depth coverage of the subject matter, and will lead on to the introduction of presentational features such as charts, pictures and graphics to complement the presentation text.
Conclusion/ending
If time allows, the presentation should end with a summary of the main points and the key message. It is also good practice to try to end on a positive note before thanking your audience for their attention.
13
Group project in the construction industry
3 Evaluation and presentation techniques
Presentation preparationOne of the most important elements of being able to deliver a successful presentation is preparation. This does not just mean ensuring that you are on top of your subject matter (although that is an important factor): there are a number of other factors that must be planned and considered before you give your presentation.
Technology/equipment
If you are planning to use information technology, it is essential that you test the equipment before you use it. There is nothing worse than technology letting you down in the moments before you are due to start your presentation. In situations where you are using a projector with a laptop computer, check beforehand that:
• the projector works with the laptop you are planning to use • the resolution of the projected slides is such that the audience members can
easily read the information that is displayed • the features of the presentation actually work as they should (this is especially
important if you are planning to use custom animations, slide transitions or media (video/audio) content)
• you have left yourself enough time to complete these checks!
Props/equipment for demonstrations
Make sure that any kind of visual aid or item of equipment that you are planning to use during the presentation works correctly and that you know how to use it correctly. For example, it is of no use holding an informal presentation on the correct way to wear a safety harness if you cannot demonstrate how to put one on yourself!
Likely questions
If the presentation allows for audience participation and questions, try to anticipate the questions that you are likely to be asked and have your answers prepared.
The curve ball
Even with the most thorough preparation, it is likely that you will be asked a question that you cannot answer at that exact moment in time. It is good practice to have a stock answer ready in case this situation arises – this may be a standard statement such as: ‘That’s an interesting point. I don’t actually have that information to hand, but I will get back to you with a response.’ If you use this, it is imperative that you follow it up and do what you say you are going to do. Your credibility will be damaged if you do not offer a response.
General tips on presentingThe following list provides some general good practice points which apply to formal or informal presentations.
• Try to establish a rapport with your audience – the easiest way to do this is to make your introductions and smile. In most cases you will get a smile back and you are already off to a positive start.
14
Group project in the construction industry
3 Evaluation and presentation techniques
• Deliver the spoken element of the presentation in a steady and firm manner. This will help to persuade your audience that you are confident in what you are saying and in control of the presentation. This sense of being in control can be accentuated by intelligent and pre-meditated use of pauses. Don’t be afraid to pause for effect or to allow delegates to digest what has been said.
• Try to avoid rambling and going back over items which have already been mentioned. Producing a presentation with a clear well-rehearsed structure will help with this.
• Maintain eye contact with your audience as much as you can, and try to look at everyone in the audience from time to time.
• Try to use the slides or notes as a prompt only. Don’t just read from them verbatim as this will make for a very dull presentation.
• Try to build in elements of humour, if possible – but don’t get carried away or try to be too ‘jokey’, as this will have a negative impact on the professionalism you are trying to convey.
• Practise – as already stated, it is natural to be a little apprehensive before making a presentation, especially if it is in front of an unfamiliar group, so allow yourself some time to practise and to develop your delivery style – this could be done in front of a mirror, or in front of a trusted friend or colleague.
•
ActivityPresent to your team the progress you have made on the group project so far.
Tips for using Microsoft® PowerPoint®
Microsoft® PowerPoint® is probably the most common type of presentation software that is used in the business world, although other packages such as Keynote® (primarily MAC-based) are available. The following tips apply to either.
Do not rush through too many slides
It is usually recommended that covering one PowerPoint® slide every three minutes will reflect a well-paced and explained presentation. Although PowerPoint® has a number of bright and interesting interactive features, don’t get too carried away with the ‘bells and whistles’. You, as the presenter, should be the main focus of the presentation, not the sophistication of the software – slides should be used to reinforce the main points of what you say.
Do not make slides too ‘wordy’
Despite the fact that PowerPoint® slides can be printed off as handouts, they are not really intended to be a ‘take away’ resource. This is why the information contained on the slides (ideally three or four bullet points per slide; four to eight words per bullet) should not be excessive and should only reinforce the key messages from the presentation. As a general rule, if the printed-off presentation can be used as an information source, you have probably put too much information on the slides.
15
Group project in the construction industry
3 Evaluation and presentation techniques
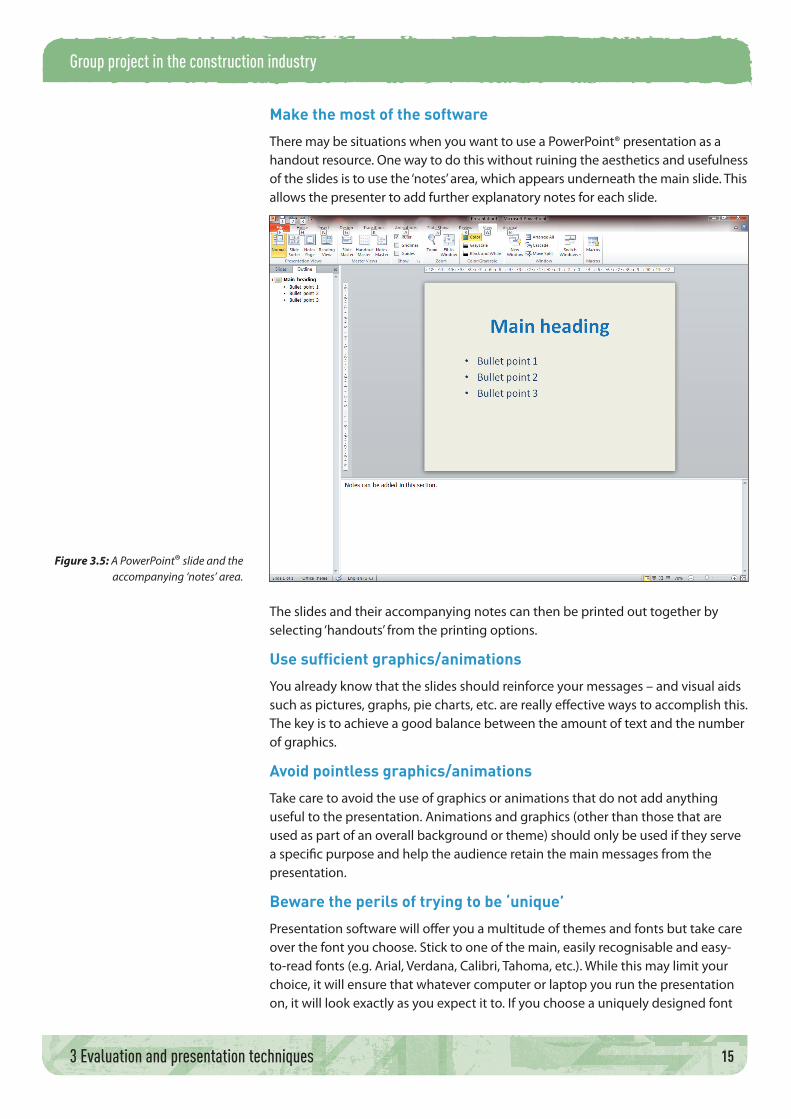
Make the most of the software
There may be situations when you want to use a PowerPoint® presentation as a handout resource. One way to do this without ruining the aesthetics and usefulness of the slides is to use the ‘notes’ area, which appears underneath the main slide. This allows the presenter to add further explanatory notes for each slide.
Figure 3.5: A PowerPoint® slide and the accompanying ‘notes’ area.
The slides and their accompanying notes can then be printed out together by selecting ‘handouts’ from the printing options.
Use sufficient graphics/animations
You already know that the slides should reinforce your messages – and visual aids such as pictures, graphs, pie charts, etc. are really effective ways to accomplish this. The key is to achieve a good balance between the amount of text and the number of graphics.
Avoid pointless graphics/animations
Take care to avoid the use of graphics or animations that do not add anything useful to the presentation. Animations and graphics (other than those that are used as part of an overall background or theme) should only be used if they serve a specific purpose and help the audience retain the main messages from the presentation.
Beware the perils of trying to be ‘unique’
Presentation software will offer you a multitude of themes and fonts but take care over the font you choose. Stick to one of the main, easily recognisable and easy-to-read fonts (e.g. Arial, Verdana, Calibri, Tahoma, etc.). While this may limit your choice, it will ensure that whatever computer or laptop you run the presentation on, it will look exactly as you expect it to. If you choose a uniquely designed font
16
Group project in the construction industry
3 Evaluation and presentation techniques
it may work on your own laptop or within your company, but if you try to run it on an externally owned laptop (for example, at a conference venue) the font may not be recognised, and this could affect the layout of your slides.
Take it furtherFurther details on tips for good and effective presenting techniques can be sourced from the Association of Speakers Clubs at:
www.the-asc.org.uk
There is also a very useful BBC article about how a well-constructed speech should be put together (using President Kennedy’s inaugural address as an example) at:
www.bbc.co.uk/news/world-us-canada-12215248
Portfolio activity (HNC Unit 5, 4.2)It is a requirement of the group project for those involved to present a report to groups of their peers on how the project has been approached. Try to use some of the techniques outlined in this section to plan your presentation. Use any notes that you produce and any handouts you provide for your audience as evidence of what you have done to meet the above criteria.
ChecklistAt the end of this topic guide you should be familiar with:
ways to evaluate a project and make recommendations for improvement
evaluating records of project development and group activity
methods for presenting data that is produced during the completion of project activities
methods for completing the presentation of project documentation (preparation, documentation, suitable format, media produced to an appropriate format, target audience, delivery).
Further reading and resourcesvan Emden, J. and Becker, L. Presentation Skills for Students (Palgrave, Macmillan, 2010) ISBN 9780230243040
Key performance indicators for the construction industry: www.bre.co.uk/page.jsp?id=1478
AcknowledgementsThe publisher would like to thank the following for their kind permission to reproduce their photographs:
Getty Images: Iconica / Jetta Productions (12). Shutterstock.com: j.wootthisak (1)
All other images © Pearson Education
We are grateful to the following for permission to reproduce copyright material:
The BRE Group for the inclusion of the links, http://www.bre.co.uk/page.jsp?id=706 and http://www.bre.co.uk/page.jsp?id=1478. Reproduced with permission. BREEAM® is a registered trademark of the BRE Group; Microsoft® for a screenshot from Microsoft® PowerPoint®. Microsoft® product screenshots reprinted with permission from Microsoft® Corporation.
Every effort has been made to trace the copyright holders and we apologise in advance for any unintentional omissions. We would be pleased to insert the appropriate acknowledgement in any subsequent edition of this publication.

17
Group project in the construction industry
3 Evaluation and presentation techniques
About the authorOriginally from an education and civil engineering background (railways infrastructure), Kevan Holmes has spent the past 12 years working within the building services engineering (BSE) sector. During this time he has worked on numerous projects and initiatives relating to the development of National Occupational Standards (NOS), qualifications, training and learning materials across all of the BSE disciplines (including BSE-related environmental technology systems). Through the completion of this work, Kevan has developed close links to key industry bodies including SummitSkills (the Sector Skills Council for Building Services Engineering), the Association of Plumbing and Heating Contractors (APHC), the Building and Engineering Services Association (B&ES) and the British Plumbing Employers Council (BPEC).
In addition to the completion of project development work, Kevan has also provided bespoke consultancy support to the Joint Industry Board for Plumbing and Mechanical Engineering Services (JIB-PMES) and employers including Morrison Facilities Services and the Mears Group.
Kevan’s key educational experience includes major involvement at director level in the establishment of a construction/building services training centre, which has involved the development and implementation of a number of courses and programmes of learning.
Previous publications with which Kevan has an association include Plumbing by Steve Muscroft (Elsevier Ltd). As a friend and long-term colleague of the author, Kevan was heavily involved in the editing and proofreading of the book, which supports Level 2 plumbing qualifications.