Embed Size (px)
Citation preview

Copyright © TATA Interactive Systems GmbH D-72070 Tübingen
TOPSIM – General Management II
Instructor’s Manual
Appendix II Miscellaneous Instructions - Hotline
Version 12.0

Copyright © TATA Interactive Systems GmbH D-72070 Tübingen

TOPSIM - General Management II Instructor's Manual - Appendix II
Table of Contents Page
1. Seminar Preparation and Facilitation ..................................................................1 1.1 Overview................................................................................................................1 1.2 Flow of Instructor's and Teams' Activities ...............................................................2 1.3 Seminar Agendas...................................................................................................2 1.3 Seminar Agendas...................................................................................................3 1.4 Special Events During the Game ............................................................................6 1.5 Group Projects .......................................................................................................7 1.5.1 Teams of Experts ...................................................................................................7 1.5.2 Branding Concepts.................................................................................................8 1.5.3 Professional Stock Broker ......................................................................................8 1.5.4 Management Board Changes .................................................................................9 1.5.5 Holistic Thinking...................................................................................................10 1.6 Playing Games in Parallel ....................................................................................10 1.7 Management Simulation Preparation Checklist .....................................................12 2. Simplification of the Game; Playing with Reduced Complexity .......................13 3. Strategic/Educational Possibilities and Content Emphasized in the 8 Period
Simulation Scenario ...........................................................................................16 4. Evaluation of Market Results .............................................................................20 5. Understanding Failure .......................................................................................22 6. Notes on Data Security ......................................................................................23 7. "Hotline Questions" ...........................................................................................24 7.1 Inventory/Production ............................................................................................24 7.2 Product Development, Research & Development ..................................................24 7.3 Sales ...................................................................................................................25 7.4 Reports ................................................................................................................25 7.5 Frequently Asked Questions.................................................................................26 7.6 Miscellaneous ......................................................................................................26 7.7 More Technical Information ..................................................................................26

TOPSIM - General Management II Instructor's Manual - Appendix II
TOPSIM - General Management II Instructor's Manual - Appendix II Page 1
1. Seminar Preparation and Facilitation
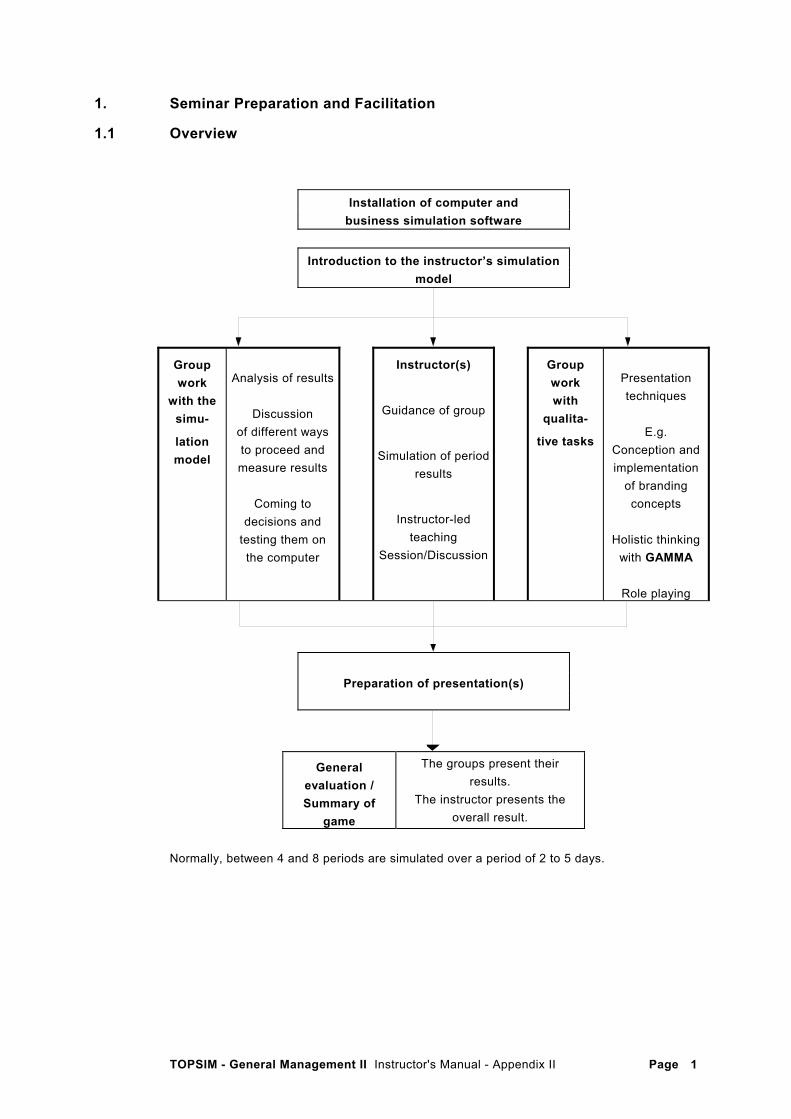
1.1 Overview
Installation of computer and business simulation software
Introduction to the instructor’s simulation
model
Group work
with the simu-
lation model
Analysis of results
Discussion
of different ways to proceed and measure results
Coming to
decisions and testing them on the computer
Instructor(s)
Guidance of group
Simulation of period results
Instructor-led teaching
Session/Discussion
Group work with
qualita-
tive tasks
Presentation techniques
E.g.
Conception and implementation
of branding concepts
Holistic thinking
with GAMMA
Role playing
Preparation of presentation(s)
General evaluation / Summary of
game
The groups present their results.
The instructor presents the overall result.
Normally, between 4 and 8 periods are simulated over a period of 2 to 5 days.

TOPSIM - General Management II Instructor's Manual - Appendix II Page 2
1.2 Flow of Instructor's and Teams' Activities
The instructor introduces the planning game using the introductory transparencies.
Decision sheets and economic predictions for the 1st period are provided to teams.
1st period
Become acquainted with their company and the rules of the game by using the participants' manual.
Different ways to proceed and to measure results are discussed. Teams come to decisions and complete the decision sheets .
Teams' decisions are entered, the period is simulated, and results (reports) are edited.
Decision sheets for the next period are provided to teams. Diskettes or a network can be used to transfer data. Economic predictions for the next period are also provided to teams.
Next period
Different ways to proceed and to measure results are discussed. Teams
come to decisions and complete decision sheets (or enter decisions
using the participants’ system). Teams' decisions are entered, the period is simulated, and results (reports) are edited.
Instructor-led discussion of the results, (teaching session)
Decisions (sheets or diskette) are given to the instructor.
Teams: Instructor
Instructor-led discussion of the results (teaching session)

TOPSIM - General Management II Instructor's Manual - Appendix II Page 3
1.3 Seminar Agendas
Duration of seminar: 3 days (normal) Seminar: (Corporate) Business Management Cost-Orientated Economic Thinking
Day 1 Day 2 Day 3
08:00 Welcome Lecture/discussion Lecture/discussion on
and Introduction Product costing Financial accounting. P/L
Discussion Contribution costing Balance Sheets, Financial
The company as a and opportunity costs Statements, and Cash flow
holistic system (with practical examples)
09:30 (Plenary session) (Plenary session) (Plenary session)
Break
09:45 Introduction to the Analysis of results Analysis of results
planning game Period 2 (Plenary session) Period 4 (Plenary session)
model.
Decisions Decisions
Organization of group work Period 3 Period 5
and decisions for Period 1 (Group work) (Group work)
(Group work)
12:30
Lunch
14:00 Lecture/discussion: Lecture/discussion: Analysis of results
Principles of accounting Method of holistic Period 5 (Plenary session)
Cost-type accounting thinking applied to
Cost-center accounting, cost effects of decisions Decisions
Unit-of-output costing Period 6
15:30 (Plenary session) (Plenary session) (Group work)
Break
15:45 Analysis of results Analysis of results Preparation of
Period 1 (Plenary session) Period 3 (Plenary session) stockholders' meeting
(Group work)
Decisions Decisions Stockholders' meeting
Period 2 Period 4 (Plenary session)
Determining goals (Group work) The groups present their
and strategies for results
future periods General analysis of game
18:00 (Group work)
TOPSIM - General Management II Instructor's manual - Appendix II Page 4
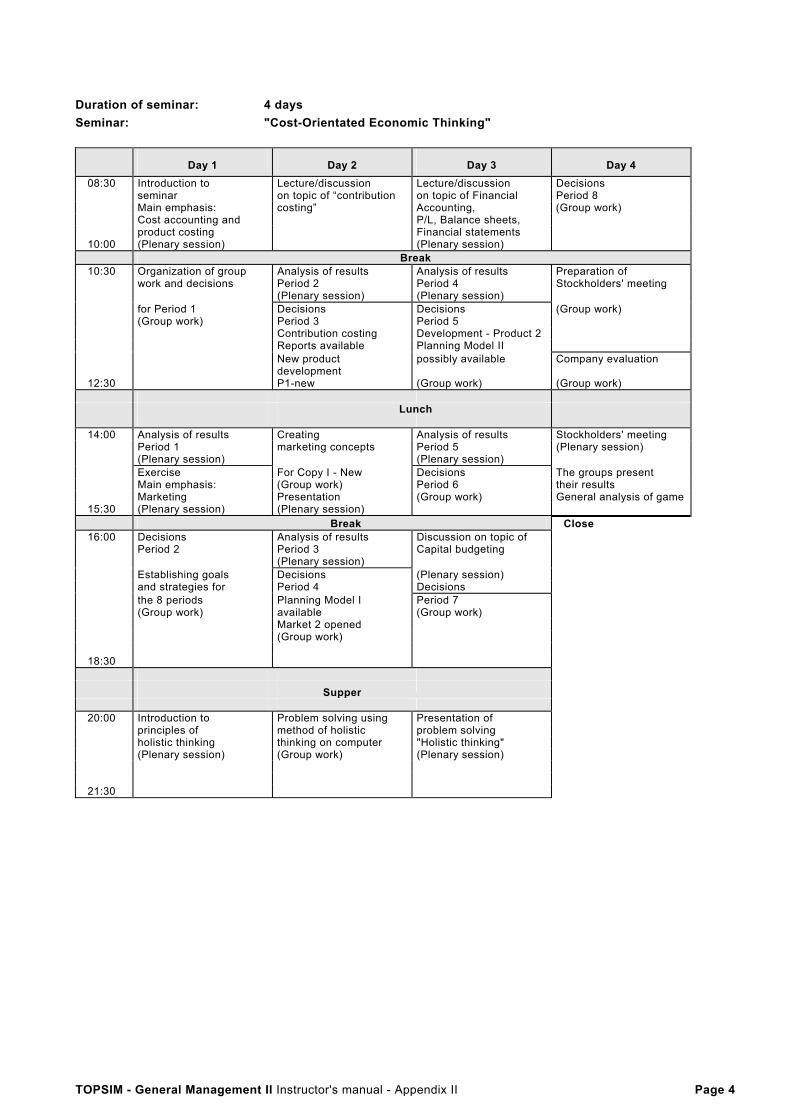
Duration of seminar: 4 days Seminar: "Cost-Orientated Economic Thinking"
Day 1 Day 2 Day 3 Day 4 08:30 Introduction to Lecture/discussion Lecture/discussion Decisions seminar on topic of “contribution on topic of Financial Period 8 Main emphasis: costing” Accounting, (Group work) Cost accounting and P/L, Balance sheets, product costing Financial statements 10:00 (Plenary session) (Plenary session) Break 10:30 Organization of group Analysis of results Analysis of results Preparation of work and decisions Period 2
(Plenary session) Period 4 (Plenary session)
Stockholders' meeting
for Period 1 Decisions Decisions (Group work) (Group work) Period 3 Period 5 Contribution costing Development - Product 2 Reports available Planning Model II New product
development possibly available Company evaluation
12:30 P1-new (Group work) (Group work) Lunch 14:00 Analysis of results Creating Analysis of results Stockholders' meeting Period 1
(Plenary session) marketing concepts Period 5
(Plenary session) (Plenary session)
Exercise For Copy I - New Decisions The groups present Main emphasis: (Group work) Period 6 their results Marketing Presentation (Group work) General analysis of game 15:30 (Plenary session) (Plenary session) Break Close 16:00 Decisions Analysis of results Discussion on topic of Period 2 Period 3
(Plenary session) Capital budgeting
Establishing goals Decisions (Plenary session) and strategies for Period 4 Decisions the 8 periods Planning Model I Period 7 (Group work) available (Group work) Market 2 opened (Group work) 18:30 Supper
20:00 Introduction to Problem solving using Presentation of principles of method of holistic problem solving holistic thinking thinking on computer "Holistic thinking" (Plenary session) (Group work) (Plenary session) 21:30
TOPSIM - General Management II Instructor's Manual - Appendix II Page 5
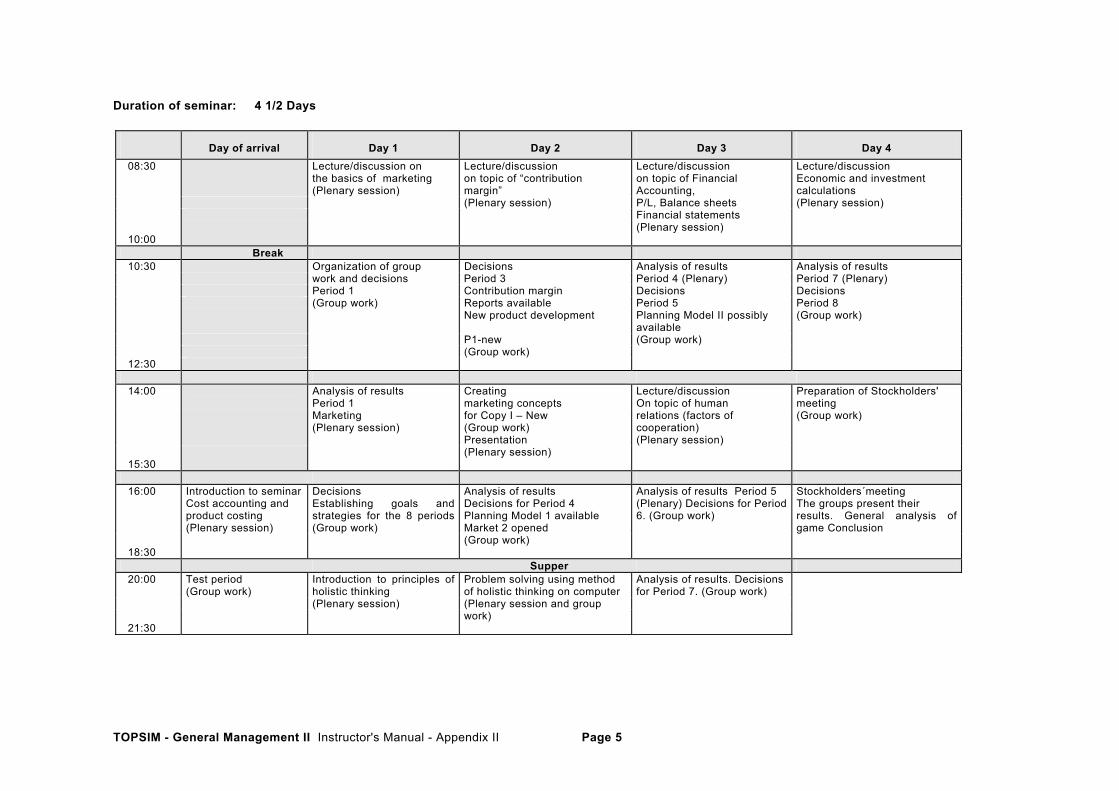
Duration of seminar: 4 1/2 Days
Day of arrival Day 1 Day 2 Day 3 Day 4 08:30 Lecture/discussion on Lecture/discussion Lecture/discussion Lecture/discussion the basics of marketing
(Plenary session) on topic of “contribution margin”
on topic of Financial Accounting,
Economic and investment calculations
(Plenary session) P/L, Balance sheets (Plenary session) Financial statements 10:00
(Plenary session)
Break 10:30 Organization of group Decisions Analysis of results Analysis of results work and decisions Period 3 Period 4 (Plenary) Period 7 (Plenary) Period 1 Contribution margin Decisions Decisions (Group work) Reports available Period 5 Period 8 New product development Planning Model II possibly
available (Group work)
P1-new (Group work) (Group work) 12:30 14:00 Analysis of results
Period 1 Creating marketing concepts
Lecture/discussion On topic of human
Preparation of Stockholders' meeting
Marketing (Plenary session)
for Copy I – New (Group work) Presentation
relations (factors of cooperation) (Plenary session)
(Group work)
(Plenary session) 15:30 16:00 Introduction to seminar
Cost accounting and product costing (Plenary session)
Decisions Establishing goals and strategies for the 8 periods (Group work)
Analysis of results Decisions for Period 4 Planning Model 1 available Market 2 opened
Analysis of results Period 5 (Plenary) Decisions for Period 6. (Group work)
Stockholders´meeting The groups present their results. General analysis of game Conclusion
18:30
(Group work)
Supper 20:00 Test period
(Group work) Introduction to principles of holistic thinking
(Plenary session) 21:30
Problem solving using method of holistic thinking on computer (Plenary session and group work)
Analysis of results. Decisions for Period 7. (Group work)
TOPSIM - General Management II Instructor's Manual - Appendix II Page 6
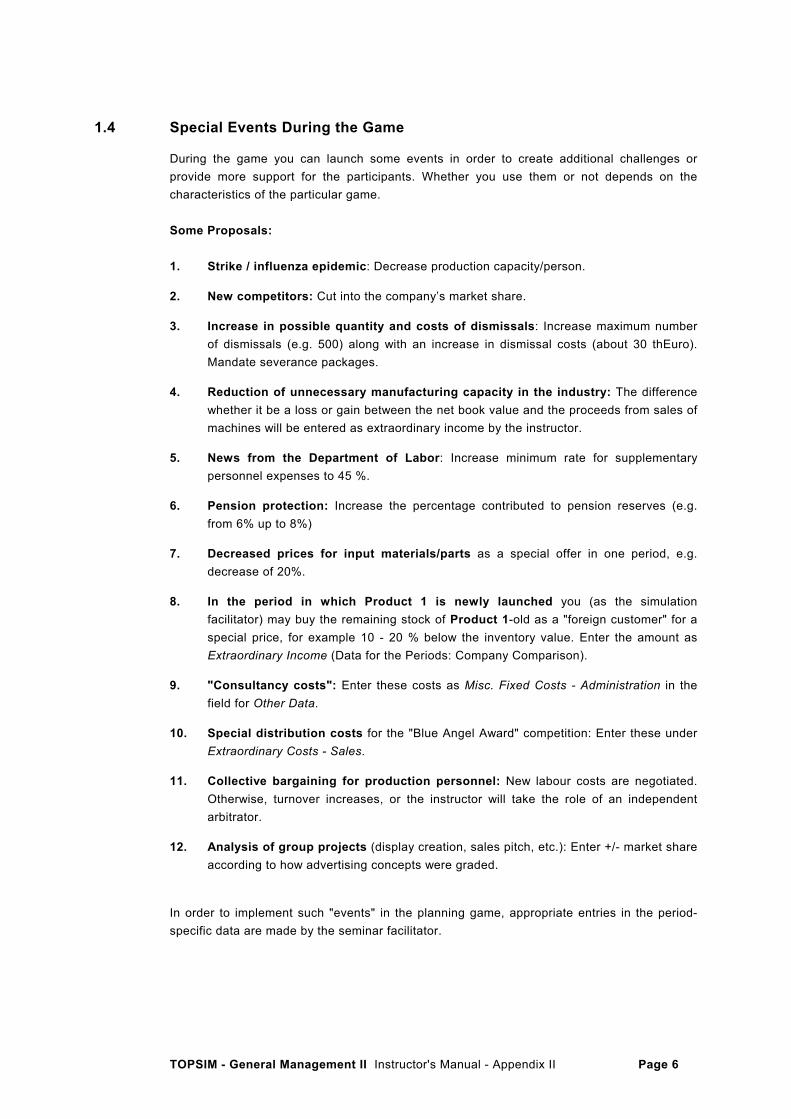
1.4 Special Events During the Game
During the game you can launch some events in order to create additional challenges or provide more support for the participants. Whether you use them or not depends on the characteristics of the particular game. Some Proposals: 1. Strike / influenza epidemic: Decrease production capacity/person.
2. New competitors: Cut into the company’s market share.
3. Increase in possible quantity and costs of dismissals: Increase maximum number of dismissals (e.g. 500) along with an increase in dismissal costs (about 30 thEuro). Mandate severance packages.
4. Reduction of unnecessary manufacturing capacity in the industry: The difference whether it be a loss or gain between the net book value and the proceeds from sales of machines will be entered as extraordinary income by the instructor.
5. News from the Department of Labor: Increase minimum rate for supplementary personnel expenses to 45 %.
6. Pension protection: Increase the percentage contributed to pension reserves (e.g. from 6% up to 8%)
7. Decreased prices for input materials/parts as a special offer in one period, e.g. decrease of 20%.
8. In the period in which Product 1 is newly launched you (as the simulation facilitator) may buy the remaining stock of Product 1-old as a "foreign customer" for a special price, for example 10 - 20 % below the inventory value. Enter the amount as Extraordinary Income (Data for the Periods: Company Comparison).
9. "Consultancy costs": Enter these costs as Misc. Fixed Costs - Administration in the field for Other Data.
10. Special distribution costs for the "Blue Angel Award" competition: Enter these under Extraordinary Costs - Sales.
11. Collective bargaining for production personnel: New labour costs are negotiated. Otherwise, turnover increases, or the instructor will take the role of an independent arbitrator.
12. Analysis of group projects (display creation, sales pitch, etc.): Enter +/- market share according to how advertising concepts were graded.
In order to implement such "events" in the planning game, appropriate entries in the period-specific data are made by the seminar facilitator.

TOPSIM - General Management II Instructor's Manual - Appendix II Page 7
1.5 Group Projects
The participants may carry out different group projects between decision periods. These projects are defined as special tasks, which must be accomplished in a specific time frame (e.g. 0.5-2 hours). Such projects are intended to enhance the knowledge and experience gained through the game.
They provide - depending on the types of projects selected - the possibility to integrate qualitative factors into the planning process that influence results in the planning game. Suggestions for group projects: • Teams of Experts • Branding Concepts • Professional Stock Broker • Management Board Changes • Holistic Thinking These group projects were developed and tested in practice. In section 10 of this manual you will find handouts that can be used to introduce these projects.
1.5.1 Teams of Experts Purpose To create the same knowledge base about the company within all
teams at the beginning of the game. Starting Situation Not all participants have read the user manual due to lack of time. Execution The instructor briefly introduces the planning game and the simulated
company (COPYFIX Inc.). (30 min.) Teams of experts are formed. Each team studies one special topic in the manual. (30 min.) Plenary session: Each team presents its special topic. The seminar instructor evaluates how well contents were understood and explained. The expert team members return to their company teams.
Results All participants gain, within a short time, a good understanding of the
simulated company. Each team has an expert for each department.
Notes Later, job rotation can also occur.
TOPSIM - General Management II Instructor's Manual - Appendix II Page 8
1.5.2 Branding Concepts Purpose Integration of qualitative factors in the simulation.
Taking into account that not only monetary, but also qualitative factors have an impact on the success of a company.
Execution Plenary session: Presentation of the task. Group work: Each team has 60 minutes to create the company’s brand. Plenary session: Presentation of the concepts developed. Branding concepts are evaluated by the participants. Each participant has his/her own grading sheet to evaluate all teams except for his/her own. The seminar facilitator collects the results and enters market share corrections (+/-) for the next period.
Notes Afterwards, the instructor evaluates the groups’ results and if possible, the evaluation is conducted by an external expert.
1.5.3 Professional Stock Broker Purpose Each participant is encouraged to examine the situation, as well as the
scope of their own company and that of their competitors. This approach forces them to make a detailed analysis.
Execution Once Period 4 has been completed:
a) Presentation of the task: Each participant receives 5mEuro (imaginary) to be invested in shares
of any companies in the game. The company that is the most attractive to investors wins the
"Company of the Year" award, and receives 2 mEuro in Extraordinary Income. A tangible prize might also be awarded: e.g. 20 bottles wine. In any case the prize must be attractive (another example: everyone can put cash into a pot, which is then granted to the winner).
b) Each participant is provided with reports on each company: Participants can make use of reports that inform on the overall results,
market research reports, and reports on the industry. 15 minutes is the allotted time for examining reports.
Participants must try to detect trends. Central issues: In whom do I have confidence? What information do I still need?
c) Plenary session: Press release on each company: (5 minute presentation)
What goals are they pursuing? What is there intent? What share price can be expected? The audience may formulate their own questions (also in order to get relevant information about competitors). “How do you intend to develop the color copier?”

TOPSIM - General Management II Instructor's Manual - Appendix II Page 9
“Do you want to enter foreign markets?“ d) Participants determine how they will invest the money.
The investment can be divided among all participating companies. e) Analysis:
The analysis often reveals that few participants invest in their own companies. Moreover, the “Company of the Year” often does not fulfil expectations.
Results Participants learn:
Before deciding on his/her investments: How to examine data in company reports How to present his/her own company How to hide company secrets How to get relevant information about competitors In the course of the game: Timely analysis of all companies.
1.5.4 Management Board Changes Purpose Make clear the success or failure of teams' group dynamics so far. Enable participants to find new courses of action by integrating new
members. Encourage participants to think about the development of the company
up to this point. Execution Two members of each team are put on the "transfer list". Everyone on
the “transfer list” will be transferred to another team (company). Team members to be transferred are determined randomly. The new
company of these participants is also determined randomly, however participants will not return to their current company.
The companies must write a report in order to give the new members of the board insight into the overall situation of the company.
Results The new team members ask a lot of questions to the "old" members.
Who is able to convince whom? Strategies up to now are questioned. Participants gain a new understanding of the company’s situation. New ideas emerge.
Strategies change, as board members are lost to competitors. If members come from a better company to a worse company
their job is to spruce their new company up. Notes First the announcement of executive board member changes leads to
protest. Then as the game progresses agreement usually results. By the end of the seminar the participants consider the exercise to have been a positive experience.

TOPSIM - General Management II Instructor's Manual - Appendix II Page 10
1.5.5 Holistic Thinking Purpose Create awareness about how decision-making processes of
enterprises are connected and interlaced. Discuss - conflicting goals and - long-term thinking. Not only learn about direct effects, but also identify subsequent effects to take note of and measure that should be considered in decision-making.
Execution Own group projects/tasks:
- Goals / strategies at the end of the Period 2 reflect the interlaced system. - Assignments on topics about the business, university, or private sector in general. - Discussions and tasks in groups following the introduction of a topic by the instructor.
1.6 Playing Games in Parallel
TOPSIM - General Management II is designed for a maximum of 5 groups. One group/team normally has 3 to 5 members, so there are usually 25 participants in total. In exceptional cases the number of participants can be as high as 30. If you have more than 25 participants, you are advised to play the games in parallel. In order to do this, you install the instructor's system repeatedly on your computer. The games must be installed in different directories. You must rename the files right after the installation is complete. Game 1: Game n:
Team 1
Team 2
Team 3Team 4
Team 5
...
Team 1
Team 2
Team 3Team 4
Team 5
Enter the names for the games when defining the seminar’s characteristics. A practical suggestion would be to use colors as names. For example: Game 1 Red Game 2 Blue Game 3 Green Game 4 Yellow It also helps if you distinguish between the participants' disks for the individual games by marking them with felt pens or using different colored labels. You may even use colored folders for the reports of the specific games. Evaluation measures for ranking participants or groups: a) Cumulative gain

TOPSIM - General Management II Instructor's Manual - Appendix II Page 11
Disadvantage: It is influenced not only by the participants’ own abilities, but also by the behavior of competitors. With games running parallel to one another, the current situations in the other games play a large role. It can be that a group in a game made substantial errors, from which the others profit. In another market it can be that the groups engage in a "merciless" price war, which dilutes all gains.
b) Success value: a term used specifically in the game to demonstrate the
degree of the company’s success, measured by the company’s profitability and planning accuracy A high degree of planning accuracy (a minimum number of out-of-line situations) shows an understanding of how decisions are related, how to plan for the long-term, how to anticipate the actions of competitors, and how to use the reports available. Taking planning accuracy into account as a measure of success tempers the emphasis on profits.
c) The share price of the company is significant as it reflects the value of the
company and encompasses several important factors.

TOPSIM - General Management II Instructor's Manual - Appendix II Page 12
1.7 Management Simulation Preparation Checklist
This checklist applies particularly to the facilitation of management simulations executed in special conference spaces (e.g. seminars run in hotels), possibly in a network, and not in an environment in which the planning game has been permanently installed.
1. Laser printer 2. Minimum of 500 pages paper 3. Back-up toner 4. Cable to connect computer to printer 5. Transparencies for laser printer 6. Power bar 7. Seminar facilitator’s computer with planning game already installed 8. Backup computer 9. Seminar facilitator system installation diskette (2 backup copies) 10. User system installation diskette and backup copy 11. Transfer diskettes, if the seminars are taking place in different rooms
without computers networks. (Ensure that the period in which the planning model should be available was correctly identified during initialization.)
12. Blank diskettes 13. LCD Display/Projector 14. Laser pointer 15. Overhead projector and back-up lamps 16. Reports for the users describing the initial situation 17. Copies of handouts describing the scenario for the seminar 18. Copies of decision sheets 19. Copies of instruction materials 20. Instruction materials/documents 21. Materials/documents to introduce the seminar 22. Copies: Checklist for first periods / goals/strategies / shareholders
meeting / group projects 23. Felt-tip pens 24. Overhead projector transparencies 25. Flipchart 26. Colored note cards (to write on, or post on the board) 27. Office materials: folder fasteners, hole-punch, etc. 28. Blackboard / White-board 29. Camera and film 30. Video camera and videocassettes 31. Seminar facilitator’s manual 32. Calculator 33. Aspirin

TOPSIM - General Management II Instructor's Manual - Appendix II Page 13
2. Simplification of the Game; Playing with Reduced Complexity
The planning game can also be played with reduced complexity in the base scenario, especially at the start of the game. • The participants do not make any purchasing decisions for input materials/parts • The participants do not make any decisions on raising loans. Thus there is no need for
financial planning. By removing these areas of decision-making, participants can fully concentrate on the areas of marketing, R&D, and production. You should play with decision sheets and not with transfer diskettes. These simplifications can be maintained throughout the remainder of the game, depending on the participants’ progress. Removal of Purchasing Decisions: If participants do not purchase enough input materials/parts, the shortage amount is bought automatically, although normally there is a penalty cost for “stock outs” (shortages). The amount of this penalty is specified in the instructor's data. For the periods in which you wish to remove the purchasing decisions, you may set this penalty at 0. In addition, you may set the decision values for Purchasing in the decision forms (on the computer) at 0. If participants do not make any purchasing decisions, they automatically receive as many input materials and parts as are needed in production at the existing volume-based price. Removal of Loan Raising Decisions: If participants have insufficient liquid funds, they are automatically allocated an overdraft loan for the required amount. This type of loan is generally more expensive than normal loans. The interest rate is specified in the instructor's data. You may enter the same interest rate for all types of loans and, if required, you can lower it in comparison to the preset interest rate at the start of the game. Enter 0 for the decision on raising loans in the groups' decision forms. Once you have done this, the model allocates the necessary liquid funds to the groups in the form of overdraft loans. If the loans are not to be considered overdraft loans, but normal loans, then transfer simulated overdraft loan amounts to the participants' decision forms: Simulate the period (this lasts only a few seconds). Look at the participants' Financial Statement report on the screen. Enter the overdraft loan amounts as the normal loan amounts in the groups' decision forms. Re-simulate the period. (NOTE: Do not simulate the next period!) If no decisions are made on raising loans, you should not allow any decisions on securities and dividends. If no decisions are made on dividends, TOPSIM - General Management automatically uses the minimum dividend percentage (20%) that is specified in the instructor's file.

TOPSIM - General Management II Instructor's Manual - Appendix II Page 14
Making Features Active at a Later Time: In order to facilitate the decision-making process at the start of the game, you are advised to activate the various features in later periods of the game, e.g. from Period 3 onwards. (Instructor’s Data – Activation of Features)
As long as the modules are not activated, no “out-of-line situations” report is issued. Changing the instructor's data (the "Data for the Periods"):
Reduce the interest rate on loans from 13.0 % to 8 %, and the RMS penalty from 20 % to 0%.
Interest on loans is set at 13 %
The RMS penalty is set at 20%
TOPSIM - General Management II Instructor's Manual - Appendix II Page 15
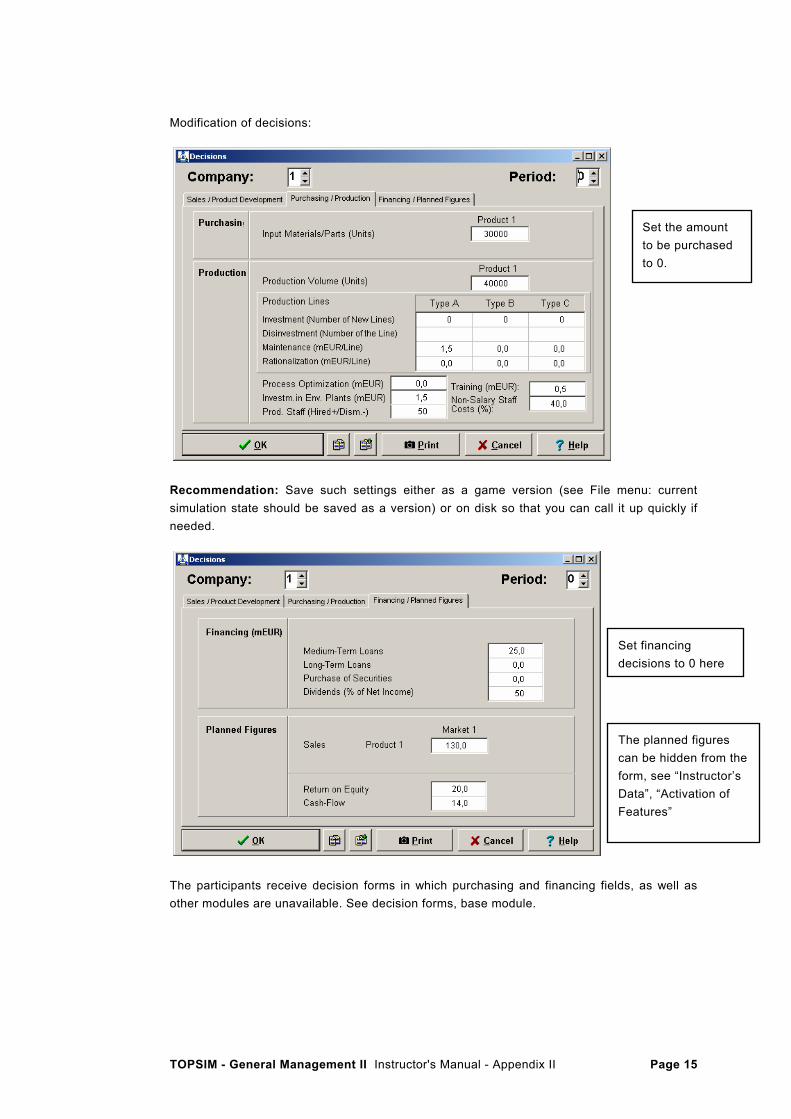
Modification of decisions:
Recommendation: Save such settings either as a game version (see File menu: current simulation state should be saved as a version) or on disk so that you can call it up quickly if needed.
The participants receive decision forms in which purchasing and financing fields, as well as other modules are unavailable. See decision forms, base module.
Set financing decisions to 0 here
The planned figures can be hidden from the form, see “Instructor’s Data”, “Activation of Features”
Set the amount to be purchased to 0.

TOPSIM - General Management II Instructor's Manual - Appendix II Page 16
3. Strategic/Educational Possibilities and Content Emphasized in the 8 Period Simulation Scenario
(Data/Game Version B) General learning objectives:
- Determining and setting goals for the team, and developing strategies - Gaining insight into the how economic aspects are connected and interlaced - Reacting early to changing market situations: Observing the competition,
Benchmarking - Handling crisis situations constructively - Optimizing operational processes - Upgrading manufacturing plants - Understanding the necessity for permanent increases in productivity and
manufacturing cost reductions - Learning and applying the Shareholder VALUE concept
The Company’s Potential for Growth Forecast for the Next 8 Periods
Period 1 Period 2
Business as usual
Period 3 Development of a successor for Copy I (i.e. Product 1-old) can begin.
Period 4 Re-launching Product 1-old is possible.
Depending on how the development of the advanced copier, Copy I (i.e. Product 1-new) is progressing, this new copier may be produced and marketed.
Market 2 can be supplied now. (FCU = Foreign Currency Unit).
Period 5 The development of a color copier (Product 2) can begin.
Period 6 Depending on Product 2’s attributes, launching the color copier on Market 1 is possible.
Period 7 From this point onward, the color copier can be sold on Market 2.
Period 8 Business as usual
TOPSIM - General Management II Instructor's Manual - Appendix II Page 17
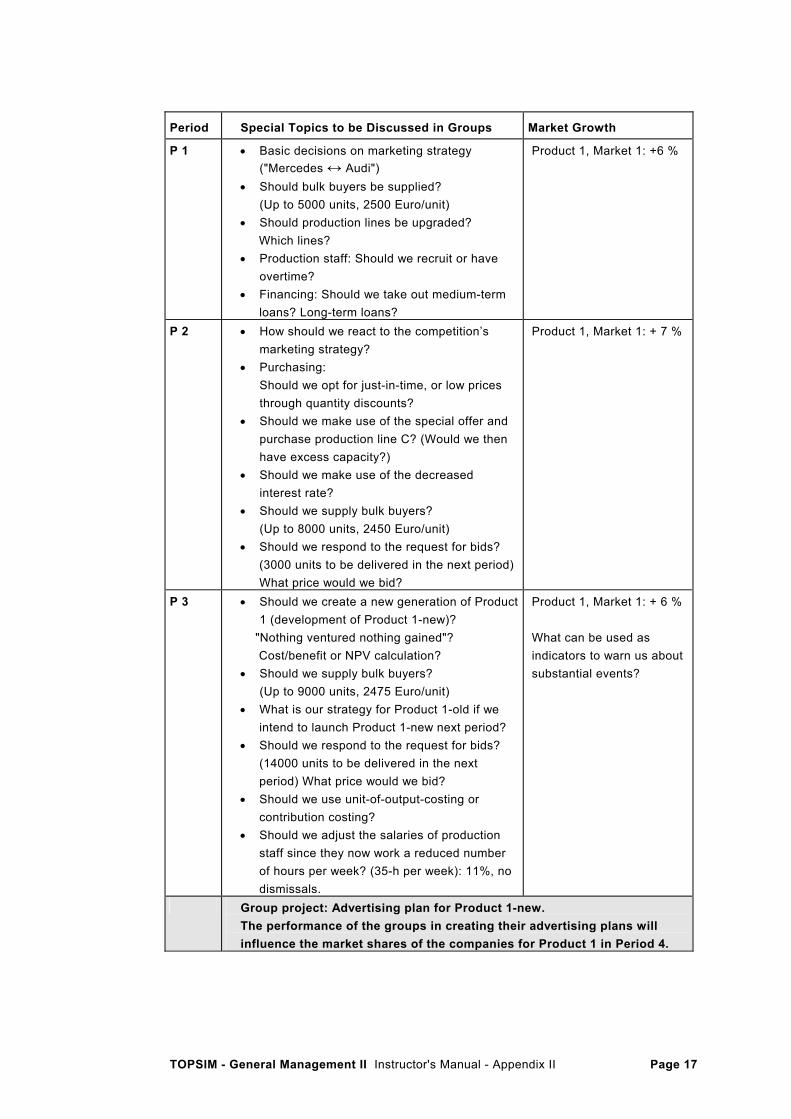
Period Special Topics to be Discussed in Groups Market Growth
P 1 • Basic decisions on marketing strategy ("Mercedes ↔ Audi")
• Should bulk buyers be supplied? (Up to 5000 units, 2500 Euro/unit)
• Should production lines be upgraded? Which lines? • Production staff: Should we recruit or have
overtime? • Financing: Should we take out medium-term
loans? Long-term loans?
Product 1, Market 1: +6 %
P 2 • How should we react to the competition’s marketing strategy?
• Purchasing: Should we opt for just-in-time, or low prices through quantity discounts?
• Should we make use of the special offer and purchase production line C? (Would we then have excess capacity?)
• Should we make use of the decreased interest rate?
• Should we supply bulk buyers? (Up to 8000 units, 2450 Euro/unit)
• Should we respond to the request for bids? (3000 units to be delivered in the next period) What price would we bid?
Product 1, Market 1: + 7 %
P 3 • Should we create a new generation of Product 1 (development of Product 1-new)?
"Nothing ventured nothing gained"? Cost/benefit or NPV calculation? • Should we supply bulk buyers?
(Up to 9000 units, 2475 Euro/unit) • What is our strategy for Product 1-old if we
intend to launch Product 1-new next period? • Should we respond to the request for bids?
(14000 units to be delivered in the next period) What price would we bid?
• Should we use unit-of-output-costing or contribution costing?
• Should we adjust the salaries of production staff since they now work a reduced number of hours per week? (35-h per week): 11%, no dismissals.
Product 1, Market 1: + 6 % What can be used as indicators to warn us about substantial events?
Group project: Advertising plan for Product 1-new. The performance of the groups in creating their advertising plans will influence the market shares of the companies for Product 1 in Period 4.

TOPSIM - General Management II Instructor's Manual - Appendix II Page 18
P 4 • Product 1-old / 1-new
Should we re-launch Product 1-old or launch the new generation? Have we taken into consideration how much stock we have left of Product 1-old? Should we pass along the cost savings of Product 1-new to our customers?
• Should we supply bulk buyers? (Up to 7000 units, 2650 Euro/unit) Are we experiencing the usual fluctuations in the market or is it actually shrinking?
• How should we respond to the request for bids (for 9000 units)? Should we wait until Period 5? Are we able to? Do we want to? How many competitors do we have?
• Should we enter a foreign market? Should we use unit-of-output costing or contribution costing?
• What is our marketing strategy? "Nothing ventured nothing gained"?
• How much should we produce? • Wages, salaries, and the interest rate have
increased! • How should we manage the decrease of 10-
15% in market volume (strategies, synchronizing team members)
Product 1, Market 1: -11% Exchange rate: 1.50 Taxes: 45% Received from customers in the current period: 80.0%
Group project: "Professional Stock Broker" P5 • Should we develop Product 2 (color copier)?
Will we re-allocate R&D personnel? What are the chances of Product 2 succeeding? What are our assumptions (about market volume, the number of competitors, prices)? What is the product’s life cycle? Cost/benefit, or NPV calculation?
• Drastic increase of transportation costs: Should these be passed along to customers?
• No bulk buyers present this period! • How should we respond to the request for
bids? 50 units • No dismissals permitted this period! • Should we increase our stock of finished
products? • How should we manage our excess capacity
of production staff? • What are the effects of downsizing on cost
structures?
Product 1, Market 1: -14%Product 1, Market 2: +25% Exchange rate: 1.50 Taxes: 45% Received from customers in the current period: 80%
Group project: "Executive Board Changes": Who has left/joined the board and how do the new members influence the other executive board members concerning the firm’s strategies?

TOPSIM - General Management II Instructor's Manual - Appendix II Page 19
P6 • Will we launch the color copier?
What is our pricing strategy? Should we make or buy? What quantity? What is our marketing-mix strategy? What do we realistically assume about the sales volume?
• Wages and salaries have increased! • There is a freeze on overtime! • Should we supply bulk buyers? (Up to 5000
units at 2500 Euro) • How should we respond to the request for
bids? (9000 units) • How will the new environmental ratings of the
production lines affect the company and the market? Should investments in new plants be made?
• The percentage allocated to the pension reserve increased by 1%!
• How do interest expenditures compare to the operating income?
Product 1, Market 1: + 3% Product 1, Market 2:+50% Exchange rate: 1.40 Taxes: 55% Received from customers in the current period: 75%
P7 • How should we manage excess capacity of staff? (Reallocation of R&D-personnel? Dismissals? Severance packages?)
• Should we launch Product 2 on the foreign market?
• Should we supply bulk buyers? (Up to 7000 units at 2700 Euro)
• How should we respond to the request for bids? (4000 units)
• A purification plant needs to be repaired at a cost of 6.0 mEuro! Should this cost be passed along to customers?
• The exchange rate has decreased! Should the effects be passed along to customers?
Product 1, Market 1: + 5% Product 1, Market 2: +33% Product 2, Market 1: +60% Exchange rate: 1,35 Taxes: 55% Received from customers in the current period: 85%
P8 • Increases in: The costs of input materials/parts + 3%
Wages and salaries + 5% Other variable costs of production (because
the company is now obliged to take back old copiers) (Product 1: now 100 Euro/unit;
Product 2: now 250 Euro/unit) • Renovating the administration building costs
the company 3.0 mEuro! • Should bulk buyers be supplied? (4000 units
at 2975 Euro)
Product 1, Market 1: -2.0% Product 1, Market 2: -17.5% Product 2, Market 1:+50.0% Product 2,Market 2: +75% Exchange rate: 1.30 Taxes: 55% Received from customers in the current period: 85%
Ratios: • Increase of wages and salaries over 8 periods: 16% • (Wages and salaries)/ total costs in Period 0 49% • (Wages and salaries of production staff)/ total costs in Period 0 34% • Decrease in the exchange rate -13%

TOPSIM - General Management II Instructor's Manual - Appendix II Page 20
4. Evaluation of Market Results
Please use Instructor's Reports I and II. Examples: ╔══════════════════════════════════════════════════════════════════════════════════════════════════════════╗ ║ INSTRUCTOR'S REPORT I: MARKET RESULTS ║ ╚══════════════════════════════════════════════════════════════════════════════════════════════════════════╝ ╔═══════════╤═════╤═════╤═══════╤═══════════════════════╤════════════════╤════════════════╤════════════════╗ ║ MARKET │ Old │ │ │ ADVERTISING │ SALES │ REVENUES │ POTENTIAL SALES║ ║ RESULTS │ New │ CO. │ PRICE ├───────┬───────┬───────┼────────┬───────┼────────┬───────┼────────┬───────╢ ║ │ Rel.│ │EUR/FCU│ mEUR │ % │Factor │ Units │ % │ mEUR │ % │ Units │ % ║ ╟───────────┼─────┼─────┼───────┼───────┼───────┼───────┼────────┼───────┼────────┼───────┼────────┼───────╢ ║ │ │ │ │ │ │ │ │ │ │ │ │ ║ ║ PRODUCT 1 │ N │ 1 │ 3050 │ 4.0 │ 12.5 │ 3.3 │ 30598 │ 12.4 │ 93.32 │ 13.1 │ 28815 │ 11.5 ║ ║ MARKET 1 │ N │ 2 │ 2798 │ 7.0 │ 21.9 │ 5.1 │ 62402 │ 25.2 │ 174.60 │ 24.5 │ 62402 │ 24.8 ║ ║ │ N │ 3 │ 2730 │ 9.0 │ 28.1 │ 5.2 │ 65178 │ 26.3 │ 177.94 │ 24.9 │ 75978 │ 30.2 ║ ║ │ O │ 4 │ 3000 │ 6.0 │ 18.8 │ 4.5 │ 45146 │ 18.2 │ 135.44 │ 19.0 │ 42555 │ 16.9 ║ ║ │ O │ 5 │ 3000 │ 6.0 │ 18.8 │ 4.5 │ 44208 │ 17.9 │ 132.62 │ 18.6 │ 41671 │ 16.6 ║ ║ ├─────┼─────┼───────┼───────┼───────┼───────┼────────┼───────┼────────┼───────┼────────┼───────╢ ║ │ │ φ/S │ 2884 │ 32.0 │ 100.0 │ 4.5 │ 247532 │ 100.0 │ 713.92 │ 100.0 │ 251421 │ 100.0 ║ ╟───────────┼─────┼─────┼───────┼───────┼───────┼───────┼────────┼───────┼────────┼───────┼────────┼───────╢ ║ │ │ │ │ │ │ │ │ │ │ │ │ ║ ║ PRODUCT 1 │ N │ 1 │ 2300 │ 1.0 │ 22.2 │ 3.2 │ 16912 │ 77.7 │ 52.51 │ 79.2 │ 3810 │ 6.1 ║ ║ MARKET 2 │ N │ 2 │ 2098 │ 2.5 │ 55.6 │ 6.5 │ 4860 │ 22.3 │ 13.76 │ 20.8 │ 35101 │ 56.0 ║ ║ │ N │ 3 │ 2030 │ 1.0 │ 22.2 │ 2.9 │ 0 │ 0.0 │ 0.00 │ 0.0 │ 23799 │ 38.0 ║ ║ │ O │ 4 │ 0 │ 0.0 │ 0.0 │ 5.0 │ 0 │ 0.0 │ 0.00 │ 0.0 │ 0 │ 0.0 ║ ║ │ O │ 5 │ 0 │ 0.0 │ 0.0 │ 5.0 │ 0 │ 0.0 │ 0.00 │ 0.0 │ 0 │ 0.0 ║ ║ ├─────┼─────┼───────┼───────┼───────┼───────┼────────┼───────┼────────┼───────┼────────┼───────╢ ║ │ │ φ/S │ 2255 │ 4.5 │ 100.0 │ 7.5 │ 21772 │ 100.0 │ 66.28 │ 100.0 │ 62710 │ 100.0 ║ ╟───────────┼─────┼─────┼───────┼───────┼───────┼───────┼────────┼───────┼────────┼───────┼────────┼───────╢ ║ │ │ │ │ │ │ │ │ │ │ │ │ ║ ║ PRODUCT 2 │ │ 1 │ 9900 │ 2.0 │ 57.1 │ 4.5 │ 3500 │ 31.8 │ 34.65 │ 33.3 │ 6140 │ 27.8 ║ ║ MARKET 1 │ │ 2 │ 9000 │ 0.5 │ 14.3 │ 2.5 │ 2500 │ 22.7 │ 22.50 │ 21.6 │ 8387 │ 38.0 ║ ║ │ │ 3 │ 9360 │ 1.0 │ 28.6 │ 3.1 │ 5000 │ 45.5 │ 46.80 │ 45.0 │ 7555 │ 34.2 ║ ║ │ │ 4 │ 0 │ 0.0 │ 0.0 │ 5.0 │ 0 │ 0.0 │ 0.00 │ 0.0 │ 0 │ 0.0 ║ ║ │ │ 5 │ 0 │ 0.0 │ 0.0 │ 5.0 │ 0 │ 0.0 │ 0.00 │ 0.0 │ 0 │ 0.0 ║ ║ ├─────┼─────┼───────┼───────┼───────┼───────┼────────┼───────┼────────┼───────┼────────┼───────╢ ║ │ │ φ/S │ 9450 │ 3.5 │ 100.0 │ 6.7 │ 11000 │ 100.0 │ 103.95 │ 100.0 │ 22082 │ 100.0 ║ ╟───────────┼─────┼─────┼───────┼───────┼───────┼───────┼────────┼───────┼────────┼───────┼────────┼───────╢ ║ │ │ │ │ │ │ │ │ │ │ │ │ ║ ║ PRODUCT 2 │ │ 1 │ 7300 │ 2.0 │ 66.7 │ 5.5 │ 0 │ 0.0 │ 0.00 │ 0.0 │ 6020 │ 40.2 ║ ║ MARKET 2 │ │ 2 │ 6850 │ 0.5 │ 16.7 │ 2.7 │ 0 │ 0.0 │ 0.00 │ 0.0 │ 7733 │ 51.7 ║ ║ │ │ 3 │ 7200 │ 0.5 │ 16.7 │ 2.8 │ 0 │ 0.0 │ 0.00 │ 0.0 │ 1218 │ 8.1 ║ ║ │ │ 4 │ 0 │ 0.0 │ 0.0 │ 5.0 │ 0 │ 0.0 │ 0.00 │ 0.0 │ 0 │ 0.0 ║ ║ │ │ 5 │ 0 │ 0.0 │ 0.0 │ 5.0 │ 0 │ 0.0 │ 0.00 │ 0.0 │ 0 │ 0.0 ║ ║ ├─────┼─────┼───────┼───────┼───────┼───────┼────────┼───────┼────────┼───────┼────────┼───────╢ ║ │ │ φ/S │ 0 │ 3.0 │ 100.0 │ 7.0 │ 0 │ 0.0 │ 0.00 │ 0.0 │ 14971 │ 100.0 ║ ╚═══════════╧═════╧═════╧═══════╧═══════╧═══════╧═══════╧════════╧═══════╧════════╧═══════╧════════╧═══════╝ ╔══════════════════════════╤═══════════════╤═══════════════╤═══════════════╤═══════════════╤═══════════════╗ ║ CUSTOMER SATISFACTION │ Company 1 │ Company 2 │ Company 3 │ Company 4 │ Company 5 ║ ╟──────────────────────────┼───────────────┼───────────────┼───────────────┼───────────────┼───────────────╢ ║ Product 1 Market 1 │ 106 │ 107 │ 116 │ 97 │ 90 ║ ║ Product 1 Market 2 │ 61 │ 85 │ 92 │ │ ║ ║ Product 2 Market 1 │ 82 │ 112 │ 106 │ │ ║ ║ Product 2 Market 2 │ 108 │ 111 │ 103 │ │ ║ ╚══════════════════════════╧═══════════════╧═══════════════╧═══════════════╧═══════════════╧═══════════════╝ ╔══════════════════════════╤═══════════════╤═══════════════╤═══════════════╤═══════════════╤═══════════════╗ ║ CI / IMAGE │ Company 1 │ Company 2 │ Company 3 │ Company 4 │ Company 5 ║ ╟──────────────────────────┼───────────────┼───────────────┼───────────────┼───────────────┼───────────────╢ ║ Expenditure for CI (mEUR)│ 2.0 │ 2.0 │ 3.0 │ 2.0 │ 2.0 ║ ║ Functional factor CI │ 5.2 │ 5.6 │ 5.9 │ 4.0 │ 4.0 ║ ╟──────────────────────────┼───────────────┼───────────────┼───────────────┼───────────────┼───────────────╢ ║ Corporate image (Index) │ 104.5 │ 105.7 │ 105.0 │ 99.7 │ 99.7 ║ ╚══════════════════════════╧═══════════════╧═══════════════╧═══════════════╧═══════════════╧═══════════════╝ ╔════════╤═════════════════╤═══════════════╤═══════════════╤═══════════════╤═══════════════╤═══════════════╗ ║ BULK │ Sales (Units) │ Co. 1: 5000 │ Co. 2: 7000 │ Co. 3: 7000 │ Co.4: 0 │ Co. 5: 0 ║ ║ BUYERS │ Revenue (mEUR) │ Co. 1: 13.50 │ Co. 2: 18.90 │ Co. 3: 18.90 │ Co.4: 0.00 │ Co. 5: 0.00 ║ ╚════════╧═════════════════╧═══════════════╧═══════════════╧═══════════════╧═══════════════╧═══════════════╝ ╔════════╤═════════════════════════════════════════════════════════════════════════════════════════════════╗ ║ TENDER │ Prod.1 for tender bid: Company 1; Price (EUR) 1999; Sales (Units) 9000; Revenue (mEUR) 17.99 ║ ╚════════╧═════════════════════════════════════════════════════════════════════════════════════════════════╝
This report shows differences concerning: • Prices, • Advertising, and the effectiveness of advertising including after-effects (the impact of
advertising on sales revenue) • CI, and • Corporate image. All variables can possibly influence sales volume. The actual sales volume is based on: • The company’s capacity to supply, and • In some cases, by competitors’ insufficient capacity to supply.

TOPSIM - General Management II Instructor's Manual - Appendix II Page 21
╔════════════════════════════════════════════════════════════════════════════════════════════════════════════╗ ║ INSTRUCTOR'S REPORT II: R & D / SALES / PRODUCTION ║ ╚════════════════════════════════════════════════════════════════════════════════════════════════════════════╝ ╔═══════════════════════╤═══╤══════════════════════════╤══════════════════════════╤══════════════════════════╗ ║ PRODUCT- │ │ TECHNOLOGY │ ECOLOGY │ VALUE ANALYSIS ║ ║ DEVELOPMENT │ ├─────────────────┬────────┼─────────────────┬────────┼─────────────────┬────────╢ ║ │CO.│ (mEUR) │ │ (mEUR) │ │ (mEUR) │ ║ ║ │ │ Period │ Cumul. │ Index │ Period │ Cumul. │ Index │ Period │ Cumul. │ Index ║ ╠═══════════════════════╪═══╪════════╪════════╪════════╪════════╪════════╪════════╪════════╪════════╪════════╣ ║ │ │ │ │ │ │ │ │ │ │ ║ ║ PRODUCT 1 - old │ 1 │ 0.0 │ 13.2 │ 105.6 │ 0.0 │ 10.5 │ 109.2 │ 0.0 │ 9.0 │ 105.4 ║ ║ │ 2 │ 1.6 │ 16.2 │ 111.2 │ 0.0 │ 9.5 │ 107.7 │ 1.0 │ 6.0 │ 104.2 ║ ║ │ 3 │ 1.1 │ 16.6 │ 111.6 │ 0.0 │ 10.0 │ 108.5 │ 0.5 │ 4.5 │ 103.6 ║ ║ │ 4 │ 1.8 │ 19.7 │ 112.2 │ 2.5 │ 22.5 │ 117.0 │ 1.0 │ 8.0 │ 107.1 ║ ║ │ 5 │ 1.8 │ 19.7 │ 112.2 │ 2.5 │ 22.5 │ 117.0 │ 1.0 │ 8.0 │ 107.1 ║ ║ ├───┼────────┼────────┼────────┼────────┼────────┼────────┼────────┼────────┼────────╢ ║ │φ/S│ 6.3 │ 85.3 │ 110.6 │ 5.0 │ 75.0 │ 111.9 │ 3.5 │ 35.5 │ 105.5 ║ ╟───────────────────────┼───┼────────┼────────┼────────┼────────┼────────┼────────┼────────┼────────┼────────╢ ║ │ │ │ │ │ │ │ │ │ │ ║ ║ PRODUCT 1 - new │ 1 │ 0.0 │ 13.2 │ 105.6 │ 0.0 │ 10.5 │ 109.2 │ 0.0 │ 9.0 │ 105.4 ║ ║ │ 2 │ 1.6 │ 16.2 │ 111.2 │ 0.0 │ 9.5 │ 107.7 │ 1.0 │ 6.0 │ 104.2 ║ ║ │ 3 │ 1.1 │ 16.6 │ 111.6 │ 0.0 │ 10.0 │ 108.5 │ 0.5 │ 4.5 │ 103.6 ║ ║ │ 4 │ 0.0 │ 6.0 │ 85.0 │ 0.0 │ 1.5 │ 45.0 │ 0.0 │ 0.0 │ 90.0 ║ ║ │ 5 │ 0.0 │ 6.0 │ 85.0 │ 0.0 │ 1.5 │ 45.0 │ 0.0 │ 0.0 │ 90.0 ║ ║ ├───┼────────┼────────┼────────┼────────┼────────┼────────┼────────┼────────┼────────╢ ║ │φ/S│ 2.6 │ 58.0 │ 99.7 │ 0.0 │ 33.0 │ 83.1 │ 1.5 │ 19.5 │ 98.6 ║ ╟───────────────────────┼───┼────────┼────────┼────────┼────────┼────────┼────────┼────────┼────────┼────────╢ ║ │ │ │ │ │ │ │ │ │ │ ║ ║ PRODUCT 2 │ 1 │ 4.8 │ 22.1 │ 105.8 │ 0.5 │ 9.5 │ 102.7 │ 0.5 │ 4.5 │ 102.3 ║ ║ │ 2 │ 2.7 │ 18.0 │ 101.2 │ 3.0 │ 9.0 │ 101.8 │ 1.0 │ 3.0 │ 100.0 ║ ║ │ 3 │ 3.7 │ 17.8 │ 101.0 │ 3.0 │ 9.0 │ 101.8 │ 0.0 │ 0.0 │ 90.0 ║ ║ │ 4 │ 0.0 │ 8.0 │ 80.0 │ 0.0 │ 3.0 │ 45.0 │ 0.0 │ 0.0 │ 90.0 ║ ║ │ 5 │ 0.0 │ 8.0 │ 80.0 │ 0.0 │ 3.0 │ 45.0 │ 0.0 │ 0.0 │ 90.0 ║ ║ ├───┼────────┼────────┼────────┼────────┼────────┼────────┼────────┼────────┼────────╢ ║ │φ/S│ 11.2 │ 74.0 │ 93.6 │ 6.5 │ 33.5 │ 79.2 │ 1.5 │ 7.5 │ 94.5 ║ ╚═══════════════════════╧═══╧════════╧════════╧════════╧════════╧════════╧════════╧════════╧════════╧════════╝ ╔══════════════╤═══╤════════════════════════════════════════════╤════════════════════════════════════════════╗ ║ SALES │ │ MARKET 1 │ MARKET 2 ║ ║ │CO.│ Number of people │ Functional factor │ Number of people │ Functional factor ║ ║ ├───┼─────────────────────┼──────────────────────┼─────────────────────┼──────────────────────╢ ║ │ 1 │ 112 │ 2.7 │ 20 │ 1.5 ║ ║ │ 2 │ 120 │ 2.8 │ 37 │ 1.7 ║ ║ │ 3 │ 135 │ 3.1 │ 15 │ 1.0 ║ ║ │ 4 │ 100 │ 3.1 │ 0 │ 3.5 ║ ║ │ 5 │ 100 │ 3.1 │ 0 │ 3.5 ║ ║ ├───┼─────────────────────┼──────────────────────┼─────────────────────┼──────────────────────╢ ║ │φ/S│ 567 │ 3.0 │ 72 │ 2.3 ║ ╚══════════════╧═══╧═════════════════════╧══════════════════════╧═════════════════════╧══════════════════════╝ ╔═══════════╤═══╤═══════╤════════════════════╤═══════╤═══════╤═══════╤═══════╤═══════╤═══════╤═══════════════╗ ║ PRODUCTION│ │Ration.│ Production lines │Env.ind│ Cumul.│ Envir.│Damage │Env.Tax│ Avail.│ Utilization ║ ║ /ENVIRONM.│CO.│ Cumul.│Type A│Type B│Type C│of line│expend.│reduct.│indica.│ n.per.│ capac.│ Lines Staff ║ ║ PLANTS ├───┼───────┼──────┼──────┼──────┼───────┼───────┼───────┼───────┼───────┼───────┼───────┼───────╢ ║ │ 1 │ 9.0 │ 1 │ 0 │ 2 │ 91.7 │ 4.5 │ 2.4 │ 94.1 │ 1.2 │ 59389 │ 99.9 │ 97.2 ║ ║ │ 2 │ 6.0 │ 0 │ 0 │ 3 │ 95.0 │ 1.5 │ 1.0 │ 96.0 │ 0.8 │ 66880 │ 99.9 │ 98.5 ║ ║ │ 3 │ 1.0 │ 2 │ 0 │ 2 │ 88.2 │ 5.0 │ 2.5 │ 90.7 │ 2.2 │ 66386 │ 97.9 │ 100.0 ║ ║ │ 4 │ 0.0 │ 4 │ 0 │ 0 │ 76.5 │ 12.0 │ 4.5 │ 81.0 │ 9.0 │ 40180 │ 99.6 │ 99.2 ║ ║ │ 5 │ 0.0 │ 4 │ 0 │ 0 │ 76.5 │ 12.0 │ 4.5 │ 81.0 │ 9.0 │ 40180 │ 99.6 │ 99.2 ║ ╚═══════════╧═══╧═══════╧══════╧══════╧══════╧═══════╧═══════╧═══════╧═══════╧═══════╧═══════╧═══════╧═══════╝ ╔══════════════╤═══╤══════════════════════════╤══════════════════════════╤══════════════════════════╤════════╗ ║ PRODUCTION │ │ Production staff │ Training │ Process optimazation │Produc- ║ ║ STAFF │ │ Final │ Absence │ Period │ Cumul. │ Quality│ Period │ Cumul. │ │tivity ║ ║ │CO.│ workfo.│ persons│ % │ mEUR │ mEUR │ index │ mEUR │ mEUR │ Index │index I ║ ║ ├───┼────────┼────────┼────────┼────────┼────────┼────────┼────────┼────────┼────────┼────────╢ ║ │ 1 │ 1272 │ 69 │ 5.4 │ 1.5 │ 16.5 │ 1.04 │ 1.5 │ 12.0 │ 1.00 │ 1.04 ║ ║ │ 2 │ 1415 │ 87 │ 6.1 │ 3.0 │ 15.5 │ 1.04 │ 1.0 │ 12.0 │ 1.00 │ 1.03 ║ ║ │ 3 │ 1397 │ 107 │ 7.7 │ 1.0 │ 13.5 │ 1.03 │ 2.0 │ 17.0 │ 1.02 │ 1.02 ║ ║ │ 4 │ 886 │ 40 │ 4.5 │ 0.5 │ 4.0 │ 0.98 │ 0.0 │ 0.0 │ 1.00 │ 0.99 ║ ║ │ 5 │ 884 │ 39 │ 4.4 │ 0.5 │ 4.0 │ 0.98 │ 0.0 │ 0.0 │ 1.00 │ 1.00 ║ ╚══════════════╧═══╧════════╧════════╧════════╧════════╧════════╧════════╧════════╧════════╧════════╧════════╝ ╔══════════════╤═══╤═══════════════════════╤═════════════════════╤═════════════════════╤═════════════════════╗ ║ EXPERIENCE │CO.│ Cumul.prod.prev.period│Productivity index 2 │Total product. index │ Capacity per person ║ ║ AND │ │ Product 1 │ Product 2 │Product 1 │Product 2 │Product 1│ Product 2 │Product 1 │Product 2 ║ ║ PRODUCTION ├───┼───────────┼───────────┼──────────┼──────────┼─────────┼───────────┼──────────┼──────────╢ ║ │ 1 │ 406792 │ 3500 │ 1.10 │ 1.08 │ 1.15 │ 1.13 │ 57 │ 20 ║ ║ │ 2 │ 437195 │ 0 │ 1.11 │ 1.00 │ 1.14 │ 1.03 │ 57 │ 18 ║ ║ │ 3 │ 401487 │ 0 │ 1.10 │ 1.00 │ 1.12 │ 1.02 │ 56 │ 18 ║ ║ │ 4 │ 280000 │ 0 │ 1.07 │ 1.00 │ 1.06 │ 0.99 │ 48 │ 18 ║ ║ │ 5 │ 279788 │ 0 │ 1.07 │ 1.00 │ 1.06 │ 1.00 │ 48 │ 18 ║ ╚══════════════╧═══╧═══════════╧═══════════╧══════════╧══════════╧═════════╧═══════════╧══════════╧══════════╝
Other factors of market share: • Technology • Ecology • Sales force • Environmental damage indicator of the company
TOPSIM - General Management II Instructor's Manual - Appendix II Page 22
5. Understanding Failure
Please use Instructor's Reports I to IV. Points to consider: • Prices (too high, too low?)
• Sales volume / Stock (costs for financing stock?)
• Loans / Overdraft / Cash balance
• Interest (Loans)
• Marketing-mix / Marketing expenditures
• Extraordinary depreciation: stock of Product 1-old?
• Utilization of production lines and production staff (Was the utilization of manufacturing workers well under 100 %?)
• Purchase of new lines? Increased depreciation?
• Extraordinary depreciation: scrapped production lines?
• Planned production versus actual production For example:
• Planned: High sales volume and high production volume, therefore, high marketing-mix expenses.
• Reality: There is insufficient production staff and therefore, insufficient capacity to supply.

TOPSIM - General Management II Instructor's Manual - Appendix II Page 23
6. Notes on Data Security
You are advised to copy the data from the period onto a disk after each period and always back-up the data from the instructor's system. To do this you must put a formatted disk into the disk drive. Select the File menu and click on: Save actual score on data medium
Do not forget to write the period number
on the disk!
If your computer malfunctions during the seminar, then you can resume the game on another computer, by installing the planning game there and using the data from the backup diskette. For this, select the command “Read External Data Version” from the File menu. The data from the data version diskette will take precedence. Also participants' transfer diskettes save the position of the game completely and may also be used as backup diskettes.

TOPSIM - General Management II Instructor's Manual - Appendix II Page 24
7. "Hotline Questions"
7.1 Inventory/Production
Inventory of input materials: The amount of input materials/parts used in production does not correspond to the number of manufactured units: Units of input materials used in production =
Production Volume (units) Value Analysis Index
*100
Production lines: Despite that production lines may be of the same type, they are different with respect to their capacities and the amount of environmental damage they cause. Maintenance: If maintenance of the production lines is at the normal level in one period, the capacity of the production lines is also at the normal level, despite that the maintenance level may have been lowered in a previous period. Therefore, lowering the level of maintenance has no after-effect. Overtime: For overtime (of production lines and/or production staff) additional costs of 2.5 mEuro per period to cover supervision and operations are incurred (step-fixed costs on overtime). In addition, there is an overtime premium of 25% due to additional wages and salary costs that arise in the periods in which overtime occurs. These costs are entered in the cost accounts. Environmental technology: By investing in environmental technology the total damage caused by a company can be reduced. The environment ratings of the production lines themselves can only be improved by replacing lines. Guidelines: 1.5 mEUR 1 point improvement 2.5 mEUR 2 points 10 mEUR 3.5 points 15 mEUR 6 points
Environmental tax:
Guidelines: Index: 98 Tax 0.5 mEUR Index: 95 Tax 1 mEUR Index: 90 Tax 2.5 mEUR Index: 85 Tax 5 mEUR
7.2 Product Development, Research & Development
Note on the technology and ecology indices at the launch of Product 2: The initial technology and ecology ratings for Product 2 are based on its development (see the initial values specified that determine the impact of these factors). R&D personnel: R&D personnel may be re-allocated without incurring costs for recruitment or dismissals.

TOPSIM - General Management II Instructor's Manual - Appendix II Page 25
7.3 Sales
Important note on Product 1: Supplying bulk buyers and fulfilling contracts won by submitting bids take priority over supplying Market 1. For example, a company can easily get itself into the position of not being able to supply Market 1 as a result of not producing enough, and being obligated to supply bulk buyers and fulfil contract obligations first. Note on requests for bids (tenders): Contracts won involve supplying Product 1-new, if it has already been launched on the market. (It is not possible to simply clear out Product 1-old from the company’s inventory). The bid price may not be higher than the price for Product 1 in Market 1. By chance two companies have comparable prices, advertising expenses, sales forces, CI, and product attributes in a period and neither of these companies is incapable of supplying its markets. Nevertheless, one company will sell more than the other. Reason: Different environmental ratings of production lines also have an effect on market share. Planning values: The planned sales of Product 1, Market 1, are never exactly the same as the actual sales. Plans to sell Product 1 in Market 1 do not take bulk buyers and requests for bids into account.
7.4 Reports
Personnel, R&D: R&D personnel may be reallocated – e.g. instead of working on Product 1-old, they will be assigned to Product 1-new – without incurring recruitment or dismissal costs. Only a modification of the total number of workers results in costs to the company. Sales force: The same applies to sales personnel for development of market 1 or 2. Cost centre accounting: Staffing costs/Wages and Salaries (Production): If this value is > 0, then the production employees are not being fully utilized (cf. Report "Production Plants - Environmental Technology"). The cost of employing these workers is stated as overhead. P/L – Extraordinary income: • Proceeds from the sale of disinvested machinery = x % of net book value • Income from the sale of Product 1-old to a foreign buyer when Product 1-new is launched • Other amounts entered by the instructor P/L – Extraordinary expenses: • Depreciation of net book value of scrapped machinery • Depreciation of Product 1-old stock that is scrapped (at CGM), if Product 1-new is
launched • Other amounts entered by the instructor Externally produced units of Product 2 purchased by the company are included in the changes (increases/decreases) to the company’s inventory stated in the reports. The model assumes that these products are purchased at the start of the period (as is the case with other purchases), placed in inventory, and subsequently removed from inventory by the distribution/sales department.

TOPSIM - General Management II Instructor's Manual - Appendix II Page 26
7.5 Frequently Asked Questions
• The long-term loans increase every period, but we only entered something in Period 1.
The decisions from the previous period automatically apply to the current period unless you change them. If a value is entered in the long-term loans field and the loan is not required then it must be deleted.
• The computer has caused our company to purchase a production line that we did
not want. See above. This is the same problem as that of taking out unnecessary loans.
• Why are our maintenance costs from the period so incredibly high? In the decision form you must enter the maintenance costs per production line and not the
total value for all lines. • We are investing in environmental technology, yet the index ratings of our machines
are not increasing. These investments change neither the machines nor their ratings. It is the entire company
that is affected by these investments. These so-called end-of-pipe investments are for dust filters, purification plants etc. The result of investing in environmental technology is an improvement in the company’s “environmental damage indicator”, which is presented in the lower part of the report entitled "Production Lines - Environmental Technology".
The ratings of the machines themselves can only be improved by purchasing new production lines with better ratings to replace the ones with poor ratings.
• Our production volume of Product 1 was equal to the capacity of our production lines, but the utilization of the lines was only at 90%. This question typically arises when Product 1-new is launched. Product 1-new only needs 90% of the capacity units required for Product 1-old.
7.6 Miscellaneous
A firm has practically failed and continues to compete against the others in order to spoil the market for the others. Possible solution: A member from the team with the top company can be assigned as the new "chairman of the board" of the failing company. This can result in a high learning curve for participants. Or: The company can be declared bankrupt and the instructor can switch the company off so that it is no longer active in the simulation.
7.7 More Technical Information
Transfer of the participants’ decisions: The decisions of the participants are read by the instructor ‘s system (from a floppy disk or from the network) but are not shown in the instructor‘s decisions form. Most probable reason: The instructor’s system already simulated the period before the decisions were read (refer to the information line). The program does this by reading the user system’s preset decision data for the following period.

TOPSIM - General Management II Instructor's Manual - Appendix II Page 27
Example: Period 4 is simulated and the results are provided to the participants. The participants make decisions for Period 5. Before reading the decisions, the instructor’s system inadvertently simulates Period 5. In this case the program reads the preset decisions for Period 6. Remedy: Reset the period count to 0 and re-simulate periods 1 through 4 (File menu, Restart command). Now read the decisions for Period 5 again from the users’ systems or from the diskettes. Printer settings: The printer works too slowly: Reset to a maximum of 300 dpi. Minimize the memory required by the printer. The wrong font is being printed: Please adjust the settings in the base code files, AUTOEXEC.BAT and CONFIG.SYS. Program SYSEDIT call. You can modify the base code for the system, including the files AUTO+Cexec-asked and CONFIG.SYS
Example (the code used for a specific computer is shown below): The “code page” number is usually 850, but at times 437 must replace it. AUTOEXEC.BAT: mode con code page prepare=((850) C:\WINDOWS\COMMAND\ega.cpi) mode con code page select=850 CONFIG.SYS: Country=049,850,C:\WINDOWS\COMMAND\country.sys