Embed Size (px)
Citation preview
TORQUAY–JAN JUC RETAIL & EMPLOYMENT LAND STRATEGY BACKGROUND REPORT
SURF COAST SHIRE | AUGUST 2020

AUTHORS Paul Shipp
Brett Hannah
Tayler Neale
FILE Torquay Jan Juc RELS - Final Background Report 240820.docx
VERSION 1
DISCLAIMER Neither Urban Enterprise Pty. Ltd. nor any member or employee of Urban Enterprise Pty. Ltd. takes responsibility in any way whatsoever to any person or organisation (other than that for which this report has been prepared) in respect of the information set out in this report, including any errors or omissions therein. In the course of our preparation of this report, projections have been prepared on the basis of assumptions and methodology which have been described in the report. It is possible that some of the assumptions underlying the projections may change. Nevertheless, the professional judgement of the members and employees of Urban Enterprise Pty. Ltd. have been applied in making these assumptions, such that they constitute an understandable basis for estimates and projections. Beyond this, to the extent that the assumptions do not materialise, the estimates and projections of achievable results may vary.
COPYRIGHT © Copyright, Urban Enterprise Pty Ltd, 2020
This work is copyright. Apart from any uses permitted under Copyright Act 1963, no part may be reproduced without written permission of Urban Enterprise Pty Ltd.
L1 302-304 Barkly St, Brunswick VIC 3056
urbanenterprise.com.au
CONTENTS 1. INTRODUCTION 7 1.1. ENGAGEMENT 7 1.2. BACKGROUND REPORT 7 1.3. STUDY AREA 7 1.4. PLANNING PERIOD 8 2. STRATEGY AND POLICY CONTEXT 9 2.1. INTRODUCTION 9 2.2. STATE AND REGIONAL POLICY 9 2.3. LOCAL POLICY 10 2.4. EXISTING RETAIL STRATEGY 13 2.5. OTHER RELEVANT STRATEGIES AND REPORTS 13 2.6. IMPLICATIONS FOR STRATEGY 15 3. RETAIL AND EMPLOYMENT LAND 16 3.1. INTRODUCTION 16 3.2. ACTIVITY CENTRES AND EMPLOYMENT LAND 16 3.3. LAND SUPPLY AND FLOORSPACE 17 3.4. PLANNING CONTROLS 18 3.5. TRENDS AND DEVELOPMENT ACTIVITY 21 3.6. FUTURE GROWTH OPPORTUNITIES AND PROPOSALS 22 3.7. IMPLICATIONS 25 4. POPULATION, EMPLOYMENT AND ECONOMY 26 4.1. INTRODUCTION 26 4.2. POPULATION 26 4.3. DEMOGRAPHICS 27 4.4. EMPLOYMENT PROFILE OF TORQUAY RESIDENTS 30 4.5. LOCAL ECONOMY 33 4.6. LOCAL EMPLOYMENT 34 4.7. IMPLICATIONS FOR STRATEGY 39 5. DEMAND DRIVERS 40 5.1. INTRODUCTION 40 5.2. CONSULTATION 40 5.3. RETAIL TRENDS 42 5.4. RESIDENTIAL DEVELOPMENT AND POPULATION GROWTH 43 5.5. VISITOR ECONOMY 45 5.6. IMPLICATIONS 46 6. RETAIL AND EMPLOYMENT PROJECTIONS 48 6.1. INTRODUCTION 48 6.2. COMPETING CENTRES 48 6.3. RETAIL CATCHMENT AND POPULATION 50 6.4. EXPENDITURE 51 6.5. EXISTING TURNOVER AND MARKET SHARES 52
6.6. SUPPORTABLE FLOORSPACE GROWTH 53 6.7. IMPLICATIONS 54 6.8. EMPLOYMENT LAND NEEDS 54 7. KEY EMPLOYMENT PRECINCTS 58 7.1. INTRODUCTION 58 7.2. WEST COAST BUSINESS PARK 58 7.3. SURF CITY 64 8. MAIN EMPLOYMENT SECTOR REQUIREMENTS 67 8.1. INTRODUCTION 67 8.2. OFFICE 67 8.3. HEALTH AND MEDICAL 68 8.4. INDUSTRIAL LAND 68 9. ISSUES AND OPPORTUNITIES SUMMARY 70 9.1. INTRODUCTION 70 9.2. RETAIL 70 9.3. OFFICE 70 9.4. INDUSTRIAL 71 9.5. HEALTH 71 9.6. MAIN PRECINCTS 71 APPENDICES 74 APPENDIX A DATA AREA MAPS 74 APPENDIX B SUPPLY ASSESSMENT 78 APPENDIX C SUZ5 AMENDMENTS 81 APPENDIX D INDUSTRIAL LAND SUPPLY DEFINITIONS 82 APPENDIX E EMPLOYMENT PROJECTIONS DETAIL 83
FIGURES
F1. STUDY AREA ........................................................................................................................................................................ 7 F2. REGIONAL CONTEXT ........................................................................................................................................................... 8 F3. FEATURES OF A 20-MINUTE NEIGHBOURHOOD ................................................................................................................ 9 F4. ACTIVITY CENTRE HIERARCHY, SURF COAST SHIRE PLANNING SCHEME ..................................................................... 12 F5. LOCATION OF EXISTING RETAIL AND EMPLOYMENT LAND, TOQUAY-JAN JUC ............................................................. 16 F6. FLOORSPACE BY LAND USE CATEGORY AND PRECINCT ................................................................................................ 18 F7. ESTIMATED COST OF APPROVED BUILDING PERMITS, 2011-2019 ................................................................................. 22 F8. LOCATION OF STRATEGIC SITES AND PROPOSALS ........................................................................................................ 24 F9. POPULATION PROJECTIONS GRAPH: 2016, 2021 AND 2036 ........................................................................................... 27 F10. AGE PROFILE. TORQUAY, SURF COAST & GREATER GEELONG, 2016 ........................................................................... 28 F11. POPULATION AGE PROFILE CHANGE 2016 TO 2036 ...................................................................................................... 28 F12. HOUSEHOLD COMPOSITION, 2016 ................................................................................................................................. 29 F13. MEDIAN HOUSEHOLD INCOME, 2016 ............................................................................................................................. 29 F14. INDUSTRY OF EMPLOYMENT, TORQUAY RESIDENTS, 2011 & 2016 ............................................................................. 30 F15. TORQUAY EMPLOYMED RESIDENTS PLACE OF WORK, 2016 ........................................................................................ 31 F16. LOCATION QUOTIENT, TORQUAY & REGIONAL VICTORIA .............................................................................................. 36 F17. TORQUAY WORKERS’ PLACE OF RESIDENCE, 2016 ....................................................................................................... 37 F18. RESIDENTIAL LOT CONSTRUCTION, 2007-2018 ............................................................................................................. 44
F19. FUTURE RESIDENTIAL DEVELOPMENT AREAS .............................................................................................................. 44 F20. COMPETING CENTRES .................................................................................................................................................... 48 F21. RETAIL CATCHMENT AREAS ........................................................................................................................................... 51 F22. VACANT LAND, WEST COAST BUSINESS PARK 2020 .................................................................................................... 60 F23. LAND CONSUMPTION ..................................................................................................................................................... 62 F24. VACANT LAND SUPPLY, SURF CITY CLUSTER ............................................................................................................... 65 F25. TORQUAY SA2 ................................................................................................................................................................. 74 F26. SURF COAST SHIRE ........................................................................................................................................................ 74 F27. GREATER GEELONG ........................................................................................................................................................ 75 F28. GEELONG SA4 ................................................................................................................................................................. 75 F29. TORQUAY, FORECAST ID ................................................................................................................................................. 76 F30. TORQUAY DESTINATION ZONES ..................................................................................................................................... 76 F31. BESPOKE REGIONS OF GEELONG AND BELLARINE PENINSULA ................................................................................... 77
TABLES
T1. LAND SUPPLY BY ZONE, TORQUAY-JAN JUC .................................................................................................................. 17 T2. FLOORSPACE BY LAND USE ............................................................................................................................................. 17 T3. ZONING IN TORQUAY ........................................................................................................................................................ 18 T4. PURPOSE OF THE MAIN EMPLOYMENT ZONES IN TORQUAY JAN JUC ......................................................................... 19 T5. SUMMARY OF DESIGN AND DEVELOPMENT OVERLAYS IN ACTIVITY CENTRES ............................................................ 20 T6. CHANGE IN RETAIL FLOORSPACE, 2011 – 2020 .............................................................................................................. 21 T7. SUMMARY OF STRATEGIC SITES AND DEVELOPMENT PROPOSALS .............................................................................. 23 T8. HISTORICAL ERP, 2010 TO 2019 ....................................................................................................................................... 26 T9. POPULATION PROJECTIONS TABLE: 2016, 2021 AND 2036 ............................................................................................ 27 T10. EMPLOYMENT STATUS, TORQUAY, SURF COAST & GREATER GEELONG, 2016 ........................................................... 30 T11. WORKING FROM HOME, 2016 ......................................................................................................................................... 31 T12. WORKING FROM HOME BY INDUSTRY, TORQUAY, 2016 ............................................................................................... 32 T13. JOBS LEAVING TORQUAY, 2016 ..................................................................................................................................... 32 T14. OUTPUT BY INDUSTRY, TORQUAY, 2018 ........................................................................................................................ 33 T15. EMPLOYMENT NUMBER AND CHANGE, 2011 - 2016 ..................................................................................................... 34 T16. TORQUAY SA2 WORKERS’ INDUSTRY OF EMPLOYMENT, 2011 & 2016 ....................................................................... 34 T17. TORQUAY RETAIL TRADE & ACCOMMODATION AND FOOD SERVICES EMPLOYMENT, 2011 & 2016 .......................... 35 T18. EMPLOYMENT BY INDUSTRY, TORQUAY DESTINATION ZONES, 2016 .......................................................................... 35 T19. PROJECTED EMPLOYMENT GROWTH GEELONG 2019 TO 2024 .................................................................................... 38 T20. VISITATION AND SPEND IN TORQUAY (SA2), 2019 ....................................................................................................... 45 T21. TREND IN VISITATION TO TORQUAY SA2, 2015-2019 .................................................................................................... 45 T22. LOCATION OF TORQUAY VISITOR ORIGIN, 2019 ............................................................................................................ 46 T23. UNOCCUPIED DWELLINGS TORQUAY SA2, 2011 & 2016 ............................................................................................... 46 T24. TORQUAY COMPETING RETAIL CENTRES ...................................................................................................................... 49 T25. POPULATION PROJECTIONS, 2019-2036 ....................................................................................................................... 51 T26. RETAIL EXPENDITURE PER PERSON, 2019 DOLLARS .................................................................................................... 52 T27. TOTAL RETAIL EXPENDITURE, 2019 DOLLARS ............................................................................................................... 52 T28. RETAIL FLOORSPACE AND TURNOVER, TORQUAY-JAN JUC ......................................................................................... 52 T29. VISITOR RETAIL EXPENDITURE, TORQUAY (SA2).......................................................................................................... 53 T30. RETAIL MARKET SHARES ............................................................................................................................................... 53 T31. SUPPORTABLE RETAIL FLOORSPACE PROJECTIONS (2020 VALUES) ......................................................................... 54 T32. EMPLOYMENT BY INDUSTRY GROUP, 2016 ................................................................................................................... 55 T33. EMPLOYMENT PROJECTIONS ........................................................................................................................................ 55 T34. EMPLOYMENT PROJECTIONS BY SECTOR ..................................................................................................................... 56 T35. JOB DEMAND AND FLOORSPACE REQUIREMENT SCENARIOS ..................................................................................... 56 T36. LAND AREA NEEDS .......................................................................................................................................................... 57
T37. WEST COAST BUSINESS PARK BUSINESS PROFILE ...................................................................................................... 58 T38. SUBDIVISION PERMITS APPROVED, WEST COAST BUSINESS PARK 2011-2020.......................................................... 60 T39. CURRENT ADVERTISED LOT SALES ................................................................................................................................ 63 T40. CURRENT ADVERTISED LOT LEASES .............................................................................................................................. 63 T41. SURF CITY BUSINESS PROFILE ...................................................................................................................................... 64 T42. LAND CONSUMPTION, SURF CITY CLUSTER .................................................................................................................. 66 T43. TORQUAY INDUSTRIAL LAND SUPPLY ........................................................................................................................... 68 T44. IN3Z REMAINING YEARS SUPPLY .................................................................................................................................. 69 T45. EMPLOYMENT SCENARIO ASSUMPTIONS AND INDUSTRY SHIFTS .............................................................................. 83 T46. LAND AREA RATIOS ........................................................................................................................................................ 83
ABBREVIATIONS, DEFINITIONS, TERMS AND DATA AREAS
Term Description
Torquay Data for Torquay is generally presented for the Torquay SA2, which encompasses both Torquay and Jan Juc.
RELS Retail and Employment Land Strategy FLG Food, Liquor and Groceries (retail category) SA2 Statistical Area 2 – ABS geographic area for certain datasets.
Torquay – Jan Juc Retail & Employment Land Strategy – Background Report
7
1. INTRODUCTION
1.1. ENGAGEMENT
Surf Coast Shire engaged Urban Enterprise to undertake a Retail and Employment Land Strategy for Torquay-Jan Juc (the RELS) which serves as an update to the Torquay-Jan Juc Retail Strategy prepared in 2011.
The RELS takes a broad strategic approach to planning for activity centres and employment land in the towns in the context of strong population growth and changing economic conditions and will ultimately provide direction on how Council can manage land supply and planning policy to optimise how activity centres and employment land contributes to economic, social and environmental objectives and outcomes.
1.2. BACKGROUND REPORT
This report is the Background Report for the RELS. The report includes:
• A review of existing planning policy and strategies; • Analysis of the existing land, floorspace, activity centre and business mix; • A profile of the population, employment and local economy; • Demand analysis and projections for retail and employment; • A detailed profile of the major employment areas at West Coast Business Park and Surf City; and • Issues and opportunities for the Strategy to respond to.
The Background Report provides the evidence base and analysis which will inform preparation of the Strategy.
1.3. STUDY AREA
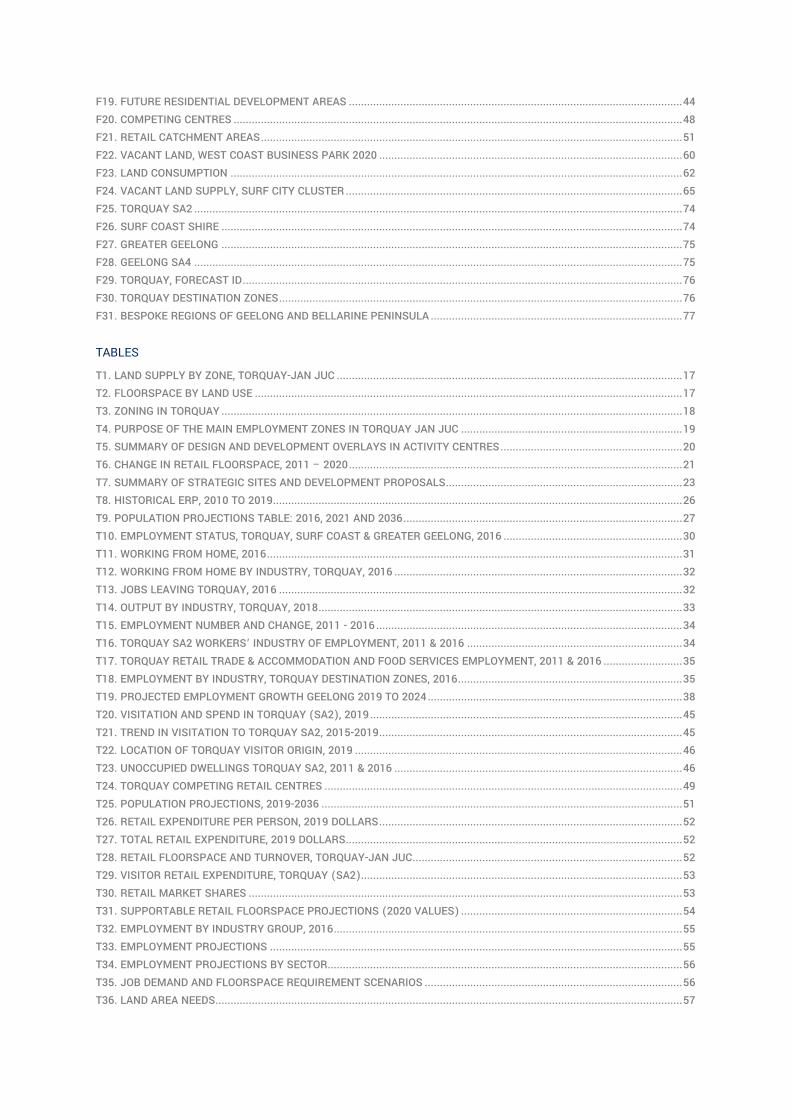
The Study Area for the RELS includes all land in the settlement boundary of Torquay Jan Juc as shown in Figure 1. The study focuses on the existing urban area and existing employment and activity centre land, while also considering land at the periphery of the settlement boundary.
F1. STUDY AREA
Source: Surf Coast Shire.
Torquay – Jan Juc Retail & Employment Land Strategy – Background Report 8
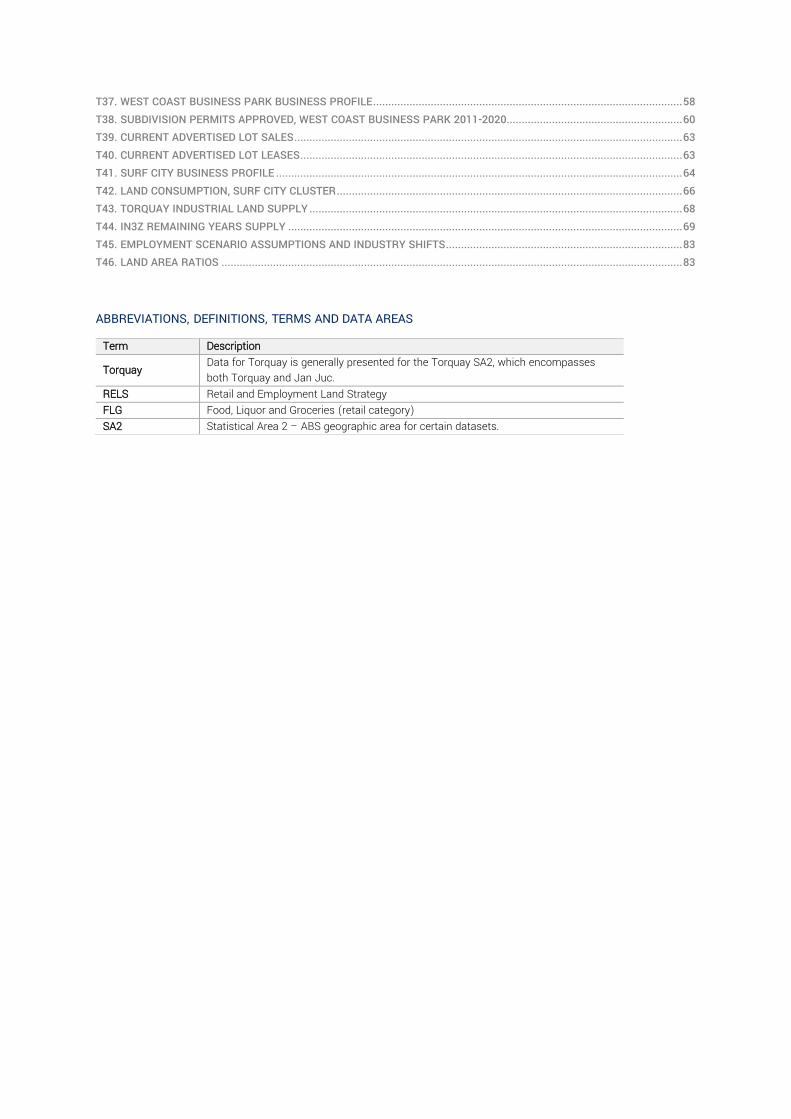
LOCATION
The township of Torquay is located in the Surf Coast Shire and is the largest settlement in the municipality. The nearest regional city is Geelong, which is less than 30 minutes drive north of Torquay along the Surf Coast Highway. Melbourne CBD is approximately 1 hour 20 minutes from Torquay, which has reduced in recent years due to the construction of the Geelong Ring Road, enabling a bypass of the Geelong town centre. All towns on the Bellarine Peninsula are accessible within an hour and the Mornington Peninsula is accessible via the ferry from Queenscliff to Sorrento.
There are six other significant townships located in Surf Coast Shire, all with a far smaller population and commercial offering than Torquay. Three of these towns, being Anglesea, Aireys Inlet and Lorne are also located along the coastline, while Winchelsea, Moriac and Deans Marsh are located inland. The towns located along the coast experience significant tourism visitation from both local and overseas visitors.
There has recently been significant growth to the south of Geelong, primarily in the Armstrong Creek Growth Area. This has expanded the southern extent of Geelong closer to Torquay. Additionally, Torquay has expanded to the north with development of a significant new residential area. Figure 2 shows Torquay in relation to these key towns, cities and regions described above.
F2. REGIONAL CONTEXT
Source: Urban Enterprise, 2020.
1.4. PLANNING PERIOD
The planning period for this study is 15-20 years, commencing in 2020 and planning for a horizon of 2035-2040.
This timeframe enables Council to respond to the requirements of the Victorian Planning Provisions which are for employment land to be provided to meet needs over a 15 year period, and for a long term strategic approach to position the town to capitalise on trends that are expected to influence the town over many years.
The Strategy should be reviewed and updated every 10 years.

Torquay – Jan Juc Retail & Employment Land Strategy – Background Report
9
2. STRATEGY AND POLICY CONTEXT
2.1. INTRODUCTION
This section provides an overview of the key strategies and policies that guide development and growth and identify opportunities for the study area.
2.2. STATE AND REGIONAL POLICY
PLAN MELBOURNE 2017-2050
Plan Melbourne is the long-term strategic planning document to guide Melbourne’s growth to 2050. It includes consideration of Melbourne’s peri-urban areas and regional Victoria. Torquay is considered a ‘peri-urban town’ in Plan Melbourne.
Policy 7.1.2 of Plan Melbourne is to “Support planning for growing towns in peri-urban areas”. The plan notes that a number of towns located in peri-urban areas that have capacity to accommodate more housing and employment-generating development without having a negative impact on the economic and environmental role of surrounding non-urban areas. Torquay is identified as one of these peri-urban towns.
The plan also notes that development in peri-urban areas must be in keeping with the local character, attractiveness and amenity of the area. Additionally, growth boundaries should be defined to prevent urban sprawl and protect agricultural and environmental assets that exist.
Plan Melbourne also introduces the concept of the 20 minute neighbourhood. This concept builds on the Strategy to encourage jobs, services and transport close to homes, with the features of the neighbourhood shown in Figure 3. Although the concept primarily applies to metropolitan Melbourne, the principles are also relevant to larger urban centres such as Torquay.
F3. FEATURES OF A 20-MINUTE NEIGHBOURHOOD
Source; DELWP, planning.vic.gov.au.

Torquay – Jan Juc Retail & Employment Land Strategy – Background Report
10
G21 REGIONAL GROWTH PLAN
The G21 Regional Growth Plan was developed in 2013 and covers five municipalities of Queenscliff, Greater Geelong, Colac Otway, Golden Plains and Surf Coast. The purpose is to guide sustainable growth in housing choices, employment opportunities, health and wellbeing initiatives and efficient utilisation and provision of infrastructure. The regional economy is diverse, with traditional strengths in agriculture, manufacturing, construction and tourism.
Torquay/Jan Juc is the largest coastal centre in the region, and acts as the gateway to the Great Ocean Road, which has implications on peak holiday populations and related infrastructure. The economic strengths of Surf Coast Shire include coastal tourism (surf culture), agriculture including niche markets in pork production, beef, wool, poultry and stock feed crops. The future directions for Torquay/ Jan Juc are residential growth, the relationship with and the future role of other settlements, key current and future employment nodes/sectors, key infrastructure projects and key project work.
STATE PLANNING POLICY
Torquay Jan Juc is identified as a district town in the Geelong region where growth will be supported by building on existing and planned infrastructure and focussing growth along key road and rail networks. (Clause 11.01-R) Torquay is identified in this policy as a location to “strengthen and protect the identified existing and planned employment areas.”
Other main state and regional policies relevant to retail and employment planning in Torquay include:
• Clause 11.03-1 encourages the “concentration of major retail, residential, commercial, administrative, entertainment and cultural developments into activity centres that are highly accessible to the community.”
• Clauses 17.02-1S and Clauses 17.03-1S state the need to provide adequate land supply in appropriate areas for both commercial and industrial land.
• Clause 17.03-1R identifies the need to plan for “the expansion of industrial employment areas at Colac and Winchelsea”. Torquay is not mentioned in this clause.
DISTINCTIVE AREAS AND LANDSCAPES
The Department of Environment, Land, Water and Planning (DELWP) are undertaking a Distinctive Areas and Landscapes program for a number of municipalities and towns throughout Victoria, of which Surf Coast and the Bellarine have been designated for the program.
Currently, DELWP are preparing a Statement of Planning Policy (SPP) for Torquay-Jan Juc, which will include a 50-year vision and land use strategies. This may include directions relating to the urban growth role of the town, settlement boundaries and future growth areas, and consequently the location and scale of population growth in the town.
At the time this report was prepared, no policy statement was available.
2.3. LOCAL POLICY
SURF COAST SHIRE PLANNING SCHEME
Local Planning Policy (Clause 21.01) identifies Torquay-Jan Juc as one of two Urban Growth Centres in the municipality, with the other being Winchelsea. The Municipal Profile notes that the Surf Coast has a significant reliance on the tourism economy, with the majority of employment being in the retail, tourism and hospitality, construction, and health and community services industries.
Clause 21.02-2 sets out a series of objectives and strategies for activity centres as follows:
Objectives:

Torquay – Jan Juc Retail & Employment Land Strategy – Background Report
11
• To support a strong hierarchy of multi-functional, attractive, accessible activity centres across the municipality that can deliver the best possible facilities to residents and visitors and that maintains a vibrant and sustainable local economy.
• To encourage a variety of entertainment and recreational opportunities across the municipality which are compatible with the social, economic and cultural characteristics of the local community
Strategies:
• Activity Centre Planning Ensure activity centres are designed and scaled to embrace the local character of the township or neighbourhood in which they are located.
• Facilitate a diversity of uses and activities within activity centres to support local employment opportunities which will make towns more self-contained and thus reduce motor vehicle dependency.
• Encourage the provision of a horizontal and vertical mix of uses within activity centres, including active uses at ground floor level and offices and apartments at upper floors, where appropriate.
• Provide a flexible built form, complementary to the local character, that can evolve over time to meet current and future requirements.
• Facilitate diverse residential opportunities including medium density housing, affordable housing and housing for the aged close to activity centres in appropriate locations.
• Where appropriate, facilitate the establishment of neighbourhood activity centres in new growth areas, providing a range of retail, commercial and community facilities to service local residents.
• Ensure the built form of large format retail premises are integrated into the surrounding area by being ‘sleeved’ by smaller retail units (e.g. shops, cafes) that are consistent with the prevailing rhythm and scale of the street and have active frontages.
• Limit the visual impact of large at-grade car parks from main roads by placing them to the side or rear of buildings and breaking up large areas of parking with landscaping and shade trees.
• Ensure landscaping, including the provision of shade trees, is integrated with the design of car parking areas, open space and streets.
• Require the provision of car parking spaces in all centres to meet the projected usual demand, not peak (seasonal) demand.
• Optimise the efficient use of land through maximising opportunities for basement and roof top parking, on-street parking and the sharing of car parking areas between uses within a centre.
• Ensure activity centres are easily accessible by pedestrians, cyclists and public transport from surrounding residential areas.
• Facilitate a high level of pedestrian permeability and amenity within activity centres. • Provide bicycle storage facilities in easily identifiable locations. • Ensure that advertising signage is consistent with the surrounding urban context in terms of scale, format,
materials, colours and illumination and is designed to minimise visual clutter through integrating into the overall building form of the development.
• Ensure electronic gaming machines are located so as not to be detrimental to the social, economic and cultural wellbeing of the community.
Clause 21.08 – Torquay-Jan Juc Strategy identifies that the areas is the major Urban Growth Centre of the municipality being a popular destination for visitors and an increasingly popular location for permanent residents. The Economic Development section identifies a series of issues, including the increasing pressure to develop a discount department store (DDS) in Torquay to support the growing population and reduce the risk of increasing escape expenditure.
Objectives identified in Clause 21.08-4 Economic Development seek to support a strong hierarchy of activity centres within Torquay-Jan Juc and provide sufficient retail and commercial facilities to support the growing population and visitors. Further, land within employment precincts are to be protected as an industrial land resource to maximise employment growth. The last objective is to grow a vibrant and sustainable local tourism industry.

Torquay – Jan Juc Retail & Employment Land Strategy – Background Report
12
Clause 21.08 includes a map showing the current activity centre hierarchy – this is reproduced in Figure 4.
F4. ACTIVITY CENTRE HIERARCHY, SURF COAST SHIRE PLANNING SCHEME
Source: Clause 21.08.
SUSTAINABLE FUTURES PLAN TORQUAY – JAN JUC 2040
The Sustainable Futures Plan for Torquay – Jan Juc was adopted in 2014, to provide an indication of the scale, timing and location of growth over the next 30 years and is a core input to the G21 Regional Growth Plan.
The Plan identified Torquay North, Central Torquay and Jan Juc as three distinct neighbourhoods that provide a range of services to support existing and new communities and that the provision of local employment opportunities is key to providing the foundations of a sound local economy.
The Plan recognises the majority of future growth will be located in Torquay North, with more than 10,000 people living there by 2040. In terms of retail and employment opportunities, the Plan identified land for employment growth between Armstrong Creek and Torquay North, and supports a retail hierarchy with Gilbert Street as the major centre and two new retail areas in Torquay North (neighbourhood activity centre) and South Spring Creek (neighbourhood/local activity centre).
The Plan identified the surf industry, new local industries in the business park, tourism and retail industry and collaboration between local business as the main local employment drivers, while potential growth industries may include urban agriculture and local food production, local construction, outdoor recreation, services for young people and aged services.
Torquay – Jan Juc Retail & Employment Land Strategy – Background Report
13
2.4. EXISTING RETAIL STRATEGY
TORQUAY-JAN JUC RETAIL STRATEGY 2011
The Torquay-Jan Juc Retail Strategy 2011 was prepared to inform the 2040 Sustainable Futures project. The Strategy identifies several key issues that the retail industry was facing in Torquay-Jan Juc including the following:
• The town was constrained for available land to accommodate growth, including for a potential DDS. • The growth of Armstrong Creek and the significant future retail offering at the Armstrong Creek Town Centre
(sub-regional centre) is expected to have a major impact of retailing for Torquay. • The role of West Coast Business Park and Baines Crescent as industrial and employment precincts is
important despite some demand for bulky goods retailers to locate in these precincts. • Growing population in Geelong and Melbourne will likely contribute to an increasing tourist demand,
particularly for food and recreational retail, which may be accommodated on the Esplanade. • The retail industry is the major employer in Torquay, with 700 jobs (20% of all jobs). • The amount of floorspace in the Torquay’s Main Trade Area increased significantly between 2005 and 2011,
with growth form 34,000 sqm to 46,000 sqm. Torquay-Jan Juc represents 67% of retail floorspace provision in the Shire (with 40% being in Torquay Town Centre).
• It is estimated that the town has a retail turnover of approximately $247.6 million per annum, of which $105.4 million (43%) is generated from visitors to the area. The report estimated that Torquay captures 52% of retail expenditure from local residents.
At the time of preparation, the Strategy identified that there were four key proposals for retail and commercial development in Torquay. These included the Torquay North Activity Centre, Bunnings Warehouse (in West Coast Business Park), DDS proposal and a Surf City Redevelopment. This would lead to a significant increase in retail and commercial floorspace in Torquay.
The Strategy estimated that by 2021, the strategy estimates that Torquay could support retail floorspace of between 61,100 and 64,700 sqm. Based on the analysis in the report and outcomes of modelling, the following actions were proposed:
• Encourage discount department store facilities to locate in the appropriate centre; • Encourage development of a neighbourhood activity centre in Torquay North; • Encourage development of non‐retail activity within centres; • Encourage a vibrant and sustainable tourism sector; • Encourage bulky goods operators to invest in appropriate locations; • Allow for the development of local activity centres; and • Maintain the retail hierarchy.
2.5. OTHER RELEVANT STRATEGIES AND REPORTS
COUNCIL PLAN – INCORPORATING THE HEALTH & WELLBEING PLAN 2017 – 2021
The Council Plan 2017-2021 is a key document that drives the strategic direction of Council for the next four years and beyond. Council has developed themes in order to achieve the vision “An engaged, innovative and sustainable community”. The Plan sets out five key themes:
• Community Wellbeing; • Environmental Leadership; • Balancing Growth; • Vibrant Economy; and

Torquay – Jan Juc Retail & Employment Land Strategy – Background Report
14
• High Performing Council.
The theme ‘Vibrant Economy’ recognises future community needs to create jobs and support initiatives that build the job market. The Plan highlights the strength of the local economy to support more than 3,000 businesses, which provide more than 7,000 local jobs. As at 2017, the Plan identified that the local economy is worth more than $1 billion annually, and currently growing at a rate of more than 4% p.a. The Plan identifies the role of Council to support continued population growth, and demand for jobs through 2036. The core focus of this theme lies in building on the following relevant economic areas:
• Support the creation and retention of jobs in existing and new businesses to meet the needs of a growing community;
• Facilitate high quality events throughout the year; • Strengthen the vitality of town centres; and • Support key industry sectors, such as surfing, tourism, home-based, construction and rural businesses.
TORQUAY TOWN CENTRE URBAN DESIGN FRAMEWORK
The Torquay Town Centre Urban Design Framework (UDF) was developed for Council in 2017, as a guiding document designed to shape the future development of the commercial core of Torquay over a period of up to 20 years. There is an emphasis on creating opportunities to grow employment through the continued development of the Town Centre. The Town Centre provides an opportunity for development and job creation as it enables people to live, work and socialise in one place.
As part of the UDF, Council also prepared the Torquay CBD Commercial Market Sounding Report and the Torquay Town Centre Small Business Office Space Assessment.
The UDF identifies a number of issues and opportunities that informed the Urban Design Framework along with proposed strategies and actions. Selected issues and actions most relevant to this study are summarised as follows:
• The Town Centre plays a high level retail and service role through the dominance of small businesses and the provision of three supermarkets. A wider tourism role is also served to the regional catchment;
• A growing population that is able to support additional retail and other commercial development and a regional role that can support jobs;
• Opportunities to ‘complement’ other growth area centres rather than ‘compete’; • Significant areas are available within the Town Centre that provide opportunity for infill development or
redevelopment of large sites; • There are three existing supermarkets which draw people into the Town Centre; • Uses which might be suitable for the town centre might establish elsewhere; • Constrained land parcels and fragmented ownership within parts of the Town Centre; • Current low vacancy rates could stifle the ability of new businesses to establish in the Town Centre; • Discourage development of a Discount Department Store or Cinema outside the Town Centre; • Facilitate an increase in office development; • Establish a core ‘entertainment area’ in the centre which should include considerations on night life; • Seek to establish more accommodation and residential uses on upper levels; •
SKILLS & EMERGING INDUSTRIES AUDIT & STRATEGY REPORT
Council are currently undertaking a Skills and Emerging Industries Audit and Strategy Report as part of the Prosperous Places Project.
Torquay – Jan Juc Retail & Employment Land Strategy – Background Report
15
2.6. IMPLICATIONS FOR STRATEGY
The following implications are identified for the RELS:
• State planning policy to co-locate retail, employment and entertainment uses in activity centres will continue to influence the spatial distribution of employment uses in Torquay. The new concept of the 20 minute neighbourhood will also need to be considered.
• There is strong policy support for urban growth and associated population growth in Torquay over the planning period. This will lead to demand for retail services and an ongoing growth in the local labour force and employment opportunities. Suitable and sufficient land will be needed to support this growth.
• The need for a Discount Department Store in Torquay has been an ongoing recommendation for a number of years, however the lack of available land is identified as a constraint to it being delivered in the town centre. The Strategy will need to provide updated guidance on this opportunity.
• A number of strategic and policy documents support the creation of local jobs to support the growing community and key industries of surfing, tourism, construction and rural businesses. This includes new local, niche industry jobs located in business parks, which may include urban agriculture and local food production.
• Existing documents acknowledge or contribute to a relative lack of land available for development in the town for commercial purposes, particularly in Torquay Town Centre. When this issue is considered alongside the changing nature of the local economy, planning controls in key employment areas will need to be reviewed to ensure that they remain relevant to the demand for retail and employment space in the town.
• The land uses within precincts is evolving and there is a need to ensure that future uses complement and accommodate the changing nature of Torquay and its key growth sectors, such as the increase in home-based businesses and the creative industries.
Torquay – Jan Juc Retail & Employment Land Strategy – Background Report
16
3. RETAIL AND EMPLOYMENT LAND
3.1. INTRODUCTION
This section includes details of the existing retail and employment land in the study area.
3.2. ACTIVITY CENTRES AND EMPLOYMENT LAND
There are twelve locations of employment land in Torquay and Jan Juc, including activity centres, industrial areas, a specialised employment precinct and small clusters of commercial land.
Figure 5 shows the location of all identified retail and employment centres within Torquay-Jan Juc. The majority of employment land is concentrated within or near the Torquay town centre, while several specialised commercial precincts front or are accessed from the Surf Coast Highway, the main arterial road connecting Torquay to Geelong and the Great Ocean Road.
F5. LOCATION OF EXISTING RETAIL AND EMPLOYMENT LAND, TOQUAY-JAN JUC
Source: Urban Enterprise, 2020

Torquay – Jan Juc Retail & Employment Land Strategy – Background Report
17
3.3. LAND SUPPLY AND FLOORSPACE
There is a total area of approximately 49 hectares of land zoned for employment purposes in the Study Area comprised of 11.3 ha of C1Z land, 30.7 ha of IN3Z land and 7.16 ha of SUZ5 land as shown in Table 1. A detailed breakdown of land supply by precinct is provided in Appendix B.
T1. LAND SUPPLY BY ZONE, TORQUAY-JAN JUC
Zone Total Occupied Vacant
Commercial 1 Zone (CIZ) 11.29 10.78 0.51 Industrial 3 Zone (IN3Z) 30.66 19.46 11.2 Special Use Zone 5 (SUZ5) 7.16 4.18 2.98 Sub-total zoned land 49.11 34.42 14.69 Other zoned land identified for future employment * 16.66 0 16.66 Total 65.77 34.42 32.28
Source: Council Rates Database, 2020. *Land in the Farming Zone identified for future expansion of the West Coast Business Park.
The key findings derived from the detailed land supply assessment include:
• Approximately half the zoned C1Z land is located in the Torquay Town Centre; • There is minimal vacant C1Z land in the town, meaning that immediate opportunities for retail commercial
development is primarily limited to redevelopment of existing premises. • The majority of zoned and vacant IN3Z land is located in the West Coast Business Park, with Baines Crescent
being almost entirely occupied; • Almost all vacant land in the SUZ5 is located in a single site (known as the Horse Paddocks site – note this
site has a current planning application for multi-use development that includes a cinema).
FLOORSPACE SUPPLY
Table 2 shows a summary of land supply by land use. Torquay-Jan Juc has more than 57,000 sqm of retail floorspace, approximately 50,000 sqm of industrial and approximately 20,500 sqm of commercial & office floorspace.
T2. FLOORSPACE BY LAND USE
Land use Floorspace (approximate sqm) Includes
Retail 57,000 Supermarkets, cafes and restaurants, clothing, bulky goods, retail services
Commercial/office 20,500 Office, medical, banks, post office, etc. Industrial 50,000 Factories, warehouses, etc.
Source: Council property database, 2020.
Figure 6 shows the breakdown of land use by category and precinct – a detailed supply breakdown is provided in Appendix B. For the purposes of analysis, the precincts are combined into six groups: Torquay Town Centre, Surf City, Bell Street, Torquay North, West Coast Business Park and Jan Juc.
The following findings and implications are noted:
• Torquay Town Centre contains the greatest concentration of retail floorspace (15,900 sqm); • Retail floorspace is dispersed across all six precincts, resulting in a fragmented retail offer to residents. • There is approximately 4,000 sqm of vacant floorspace across the study area. Precincts with the highest
vacancies are the Torquay Town Centre (1,500sqm, vacancy rate of 7%) and Jan Juc town centre (225sqm, 9% vacancy rate). Consultation indicated that some the COVID-19 pandemic has contributed to some of the shopfront tenancies in the town centre remaining vacant in 2020.
Torquay – Jan Juc Retail & Employment Land Strategy – Background Report
18
• The largest provision of commercial and office space is in the Surf Coast Highway precincts (7,900 sqm). Other office space is distributed through the retail precincts, provide a small amount of floorspace contained in mixed use developments in the town centre.
• West Coast Business Park contains 36,100 sqm of industrial floorspace, the main location of industrial land use in the towns. The business park also contains a considerable supply of retail floorspace, including Bunnings and Aldi.
• The data shown in this section includes the head office of surf retailer Quiksilver which is soon to be relocated from Torquay to Queensland. This will alter the floorspace mix in the Surf City precinct. It is noted that a planning permit has been issued for the site which would see the retention of a significant supply of office space as well as other smaller ancillary uses.
F6. FLOORSPACE BY LAND USE CATEGORY AND PRECINCT
Source: Council Rates Database; Urban Enterprise, 2020.
3.4. PLANNING CONTROLS
3.4.1. ZONES
Table 3 summarises the planning zones which apply in the study area which allow retail and employment uses. At present, only 3 zones are applied (Commercial 1, Special Use and Industrial 3). Other zones such as Commercial 2 Zone, Commercial 3 Zone, Mixed Use Zone and Industrial 1 Zone are not applied in the study area.
T3. ZONING IN TORQUAY
Commercial Study area Other commercial Study area Industrial Study area Commercial 1 Zone ✓ Mixed Use Zone x Industrial 1 Zone X Commercial 2 Zone x Special Use Zone ✓ Industrial 2 Zone X Commercial 3 Zone X Industrial 3 Zone ✓
Source: Surf Coast Planning Scheme, 2018.
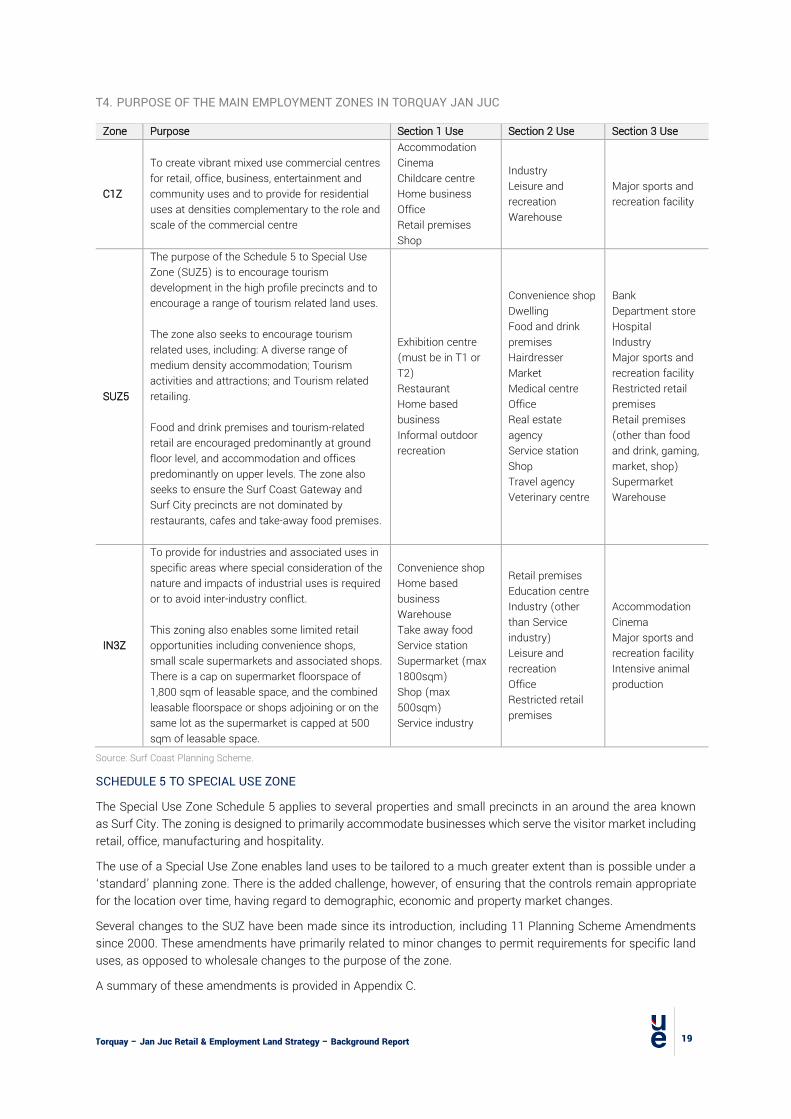
A summary of the purpose of the zones which do currently apply is provided in Table 4.
Torquay – Jan Juc Retail & Employment Land Strategy – Background Report
19
T4. PURPOSE OF THE MAIN EMPLOYMENT ZONES IN TORQUAY JAN JUC
Zone Purpose Section 1 Use Section 2 Use Section 3 Use
C1Z
To create vibrant mixed use commercial centres for retail, office, business, entertainment and community uses and to provide for residential uses at densities complementary to the role and scale of the commercial centre
Accommodation Cinema Childcare centre Home business Office Retail premises Shop
Industry Leisure and recreation Warehouse
Major sports and recreation facility
SUZ5
The purpose of the Schedule 5 to Special Use Zone (SUZ5) is to encourage tourism development in the high profile precincts and to encourage a range of tourism related land uses. The zone also seeks to encourage tourism related uses, including: A diverse range of medium density accommodation; Tourism activities and attractions; and Tourism related retailing. Food and drink premises and tourism-related retail are encouraged predominantly at ground floor level, and accommodation and offices predominantly on upper levels. The zone also seeks to ensure the Surf Coast Gateway and Surf City precincts are not dominated by restaurants, cafes and take-away food premises.
Exhibition centre (must be in T1 or T2) Restaurant Home based business Informal outdoor recreation
Convenience shop Dwelling Food and drink premises Hairdresser Market Medical centre Office Real estate agency Service station Shop Travel agency Veterinary centre
Bank Department store Hospital Industry Major sports and recreation facility Restricted retail premises Retail premises (other than food and drink, gaming, market, shop) Supermarket Warehouse
IN3Z
To provide for industries and associated uses in specific areas where special consideration of the nature and impacts of industrial uses is required or to avoid inter-industry conflict. This zoning also enables some limited retail opportunities including convenience shops, small scale supermarkets and associated shops. There is a cap on supermarket floorspace of 1,800 sqm of leasable space, and the combined leasable floorspace or shops adjoining or on the same lot as the supermarket is capped at 500 sqm of leasable space.
Convenience shop Home based business Warehouse Take away food Service station Supermarket (max 1800sqm) Shop (max 500sqm) Service industry
Retail premises Education centre Industry (other than Service industry) Leisure and recreation Office Restricted retail premises
Accommodation Cinema Major sports and recreation facility Intensive animal production
Source: Surf Coast Planning Scheme.
SCHEDULE 5 TO SPECIAL USE ZONE
The Special Use Zone Schedule 5 applies to several properties and small precincts in an around the area known as Surf City. The zoning is designed to primarily accommodate businesses which serve the visitor market including retail, office, manufacturing and hospitality.
The use of a Special Use Zone enables land uses to be tailored to a much greater extent than is possible under a ‘standard’ planning zone. There is the added challenge, however, of ensuring that the controls remain appropriate for the location over time, having regard to demographic, economic and property market changes.
Several changes to the SUZ have been made since its introduction, including 11 Planning Scheme Amendments since 2000. These amendments have primarily related to minor changes to permit requirements for specific land uses, as opposed to wholesale changes to the purpose of the zone.
A summary of these amendments is provided in Appendix C.

Torquay – Jan Juc Retail & Employment Land Strategy – Background Report
20
GEELONG ROAD MEDICAL PRECINCT
It is noted that the Geelong Road Medical Precinct does not have zoning to encourage a cluster of medical uses but has experienced ‘ad-hoc’ clustering in the GRZ. Given the increasing trend in health care employment, applying appropriate zoning and provisions for future growth of a medical precinct should be considered, either here or elsewhere if major health services / development is proposed.
THE ROLE OF RESIDENTIAL LAND
Residential zones also play a role in supporting businesses, although to a far lesser extent. The General Residential Zone applies to the vast majority of residential land in Torquay and allows the following:
• Business uses allowed without a permit (subject to conditions): home based business; residential aged care; medical centre; bed and breakfast.
• Business uses allowed with a permit: accommodation, convenience restaurant, convenience shop, food and drink premises, market, take away food premises and others.
Examples of employment uses prohibited in the General Residential Zone include industry, office (other than medical centre) and retail premises.
Residential land can play an important role in supporting small scale businesses where amenity conflicts can be appropriately managed.
3.4.2. OVERLAYS
Several Design and Development Overlays (DDO) apply to activity centres in the Study area as summarised in Table 5. These serve to control the type and scale of development and are a key factor driving the type of development that is possible in the centres and subsequently the nature and scale of employment and business space that is available in the town.
T5. SUMMARY OF DESIGN AND DEVELOPMENT OVERLAYS IN ACTIVITY CENTRES
Overlay and Schedule
Summary (key points only)
DDO2 – Bell Street Activity Centre
• Design objective: To strengthen the identity of Bell Street activity node as an entertainment precinct, emphasising its links with adjacent tourist accommodation places and the surf beaches.
• Building heights must be consistent with the surrounding streetscape character.
DDO6 – Torquay Town Centre
• Design objective: To facilitate the development of a vibrant mixed use activity centre that is designed to cater for active uses at ground level and offices, community facilities and apartments at upper levels.
• Height restrictions apply to Central Retail Core Precinct (8m/2 storeys); Bristol Road Precinct (9m); Foreshore Precinct (10.5m/3 storeys).
DDO7 – Surf Coast Boulevard
• Design objective: To recognise the regional tourism importance of the Surf Coast Highway as the gateway to the Surf Coast and a prelude to the Great Ocean Road. To create an integrated landscaped boulevard along the Surf Coast Highway between the public and private realm.
• Maximum height of 12 metres above natural ground level, and a portion of a building located on the corner of Surf Coast Highway and Grossmans Road may be up to a maximum of 16m.
DDO13 – Jan Juc • Design objective: To encourage building design that complements the coastal landscape
setting and the scenic and landscape values of the foreshore environs. • Building height limit of 7.5 metres.
Torquay – Jan Juc Retail & Employment Land Strategy – Background Report
21
Overlay and Schedule Summary (key points only)
DDO23 – Torquay North
• Design objective: To facilitate the development of a ‘main street’ type activity centre with shops fronting directly onto Merrijig Drive and Fischer Street to provide an active and pedestrian focused interface.
• Buildings should have a height of 2 storeys, with the exception of larger format retail premises (e.g. supermarket) but no higher than 8 metres.
• A feature ‘gateway’ building is to be located at the north-east intersection of Fischer Street and Merrijig Drive that incorporates a 3 storey element with a maximum height of 10.5m.
Source: Surf Coast Planning Scheme.
3.5. TRENDS AND DEVELOPMENT ACTIVITY
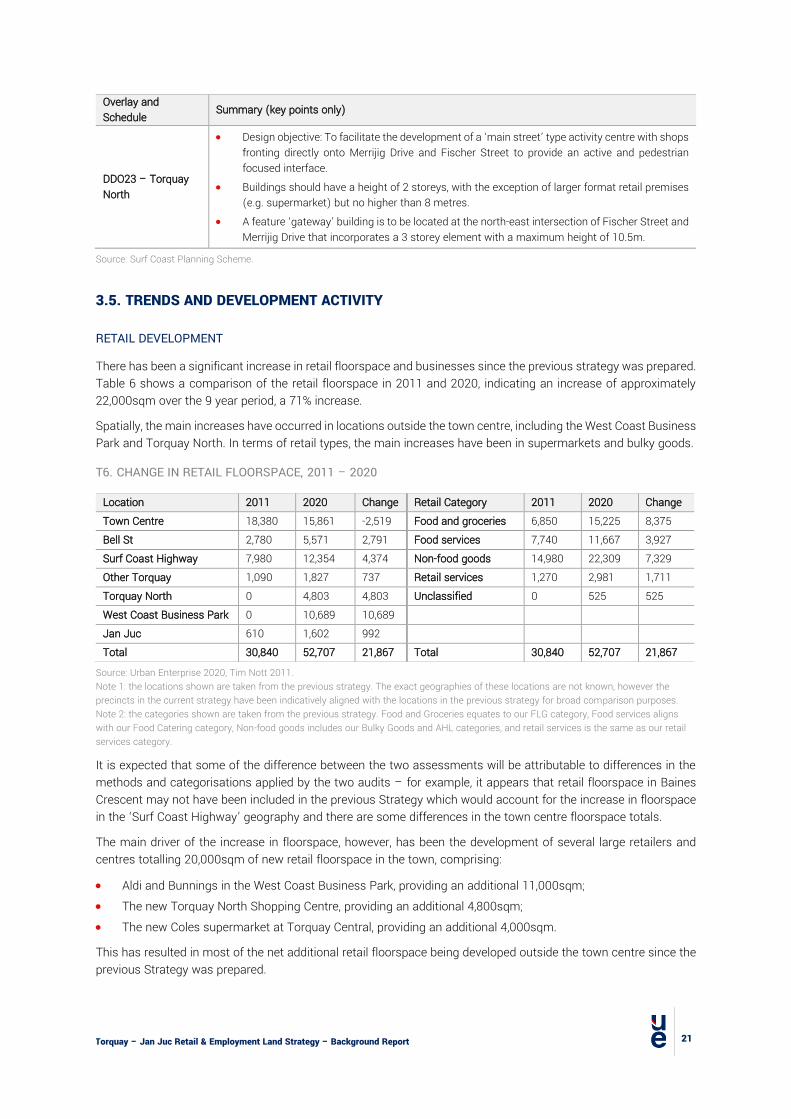
RETAIL DEVELOPMENT
There has been a significant increase in retail floorspace and businesses since the previous strategy was prepared. Table 6 shows a comparison of the retail floorspace in 2011 and 2020, indicating an increase of approximately 22,000sqm over the 9 year period, a 71% increase.
Spatially, the main increases have occurred in locations outside the town centre, including the West Coast Business Park and Torquay North. In terms of retail types, the main increases have been in supermarkets and bulky goods.
T6. CHANGE IN RETAIL FLOORSPACE, 2011 – 2020
Location 2011 2020 Change Retail Category 2011 2020 Change Town Centre 18,380 15,861 -2,519 Food and groceries 6,850 15,225 8,375 Bell St 2,780 5,571 2,791 Food services 7,740 11,667 3,927 Surf Coast Highway 7,980 12,354 4,374 Non-food goods 14,980 22,309 7,329 Other Torquay 1,090 1,827 737 Retail services 1,270 2,981 1,711 Torquay North 0 4,803 4,803 Unclassified 0 525 525 West Coast Business Park 0 10,689 10,689 Jan Juc 610 1,602 992 Total 30,840 52,707 21,867 Total 30,840 52,707 21,867
Source: Urban Enterprise 2020, Tim Nott 2011. Note 1: the locations shown are taken from the previous strategy. The exact geographies of these locations are not known, however the precincts in the current strategy have been indicatively aligned with the locations in the previous strategy for broad comparison purposes. Note 2: the categories shown are taken from the previous strategy. Food and Groceries equates to our FLG category, Food services aligns with our Food Catering category, Non-food goods includes our Bulky Goods and AHL categories, and retail services is the same as our retail services category.
It is expected that some of the difference between the two assessments will be attributable to differences in the methods and categorisations applied by the two audits – for example, it appears that retail floorspace in Baines Crescent may not have been included in the previous Strategy which would account for the increase in floorspace in the ‘Surf Coast Highway’ geography and there are some differences in the town centre floorspace totals.
The main driver of the increase in floorspace, however, has been the development of several large retailers and centres totalling 20,000sqm of new retail floorspace in the town, comprising:
• Aldi and Bunnings in the West Coast Business Park, providing an additional 11,000sqm; • The new Torquay North Shopping Centre, providing an additional 4,800sqm; • The new Coles supermarket at Torquay Central, providing an additional 4,000sqm.
This has resulted in most of the net additional retail floorspace being developed outside the town centre since the previous Strategy was prepared.
Torquay – Jan Juc Retail & Employment Land Strategy – Background Report
22
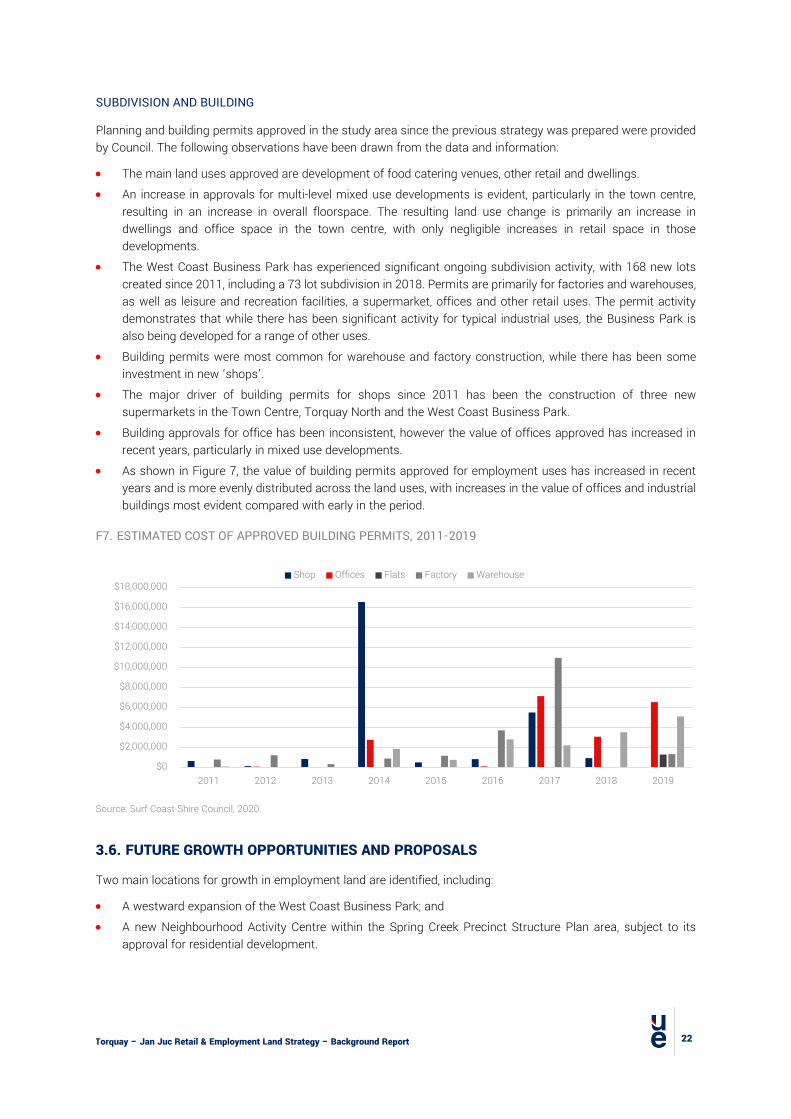
SUBDIVISION AND BUILDING
Planning and building permits approved in the study area since the previous strategy was prepared were provided by Council. The following observations have been drawn from the data and information:
• The main land uses approved are development of food catering venues, other retail and dwellings. • An increase in approvals for multi-level mixed use developments is evident, particularly in the town centre,
resulting in an increase in overall floorspace. The resulting land use change is primarily an increase in dwellings and office space in the town centre, with only negligible increases in retail space in those developments.
• The West Coast Business Park has experienced significant ongoing subdivision activity, with 168 new lots created since 2011, including a 73 lot subdivision in 2018. Permits are primarily for factories and warehouses, as well as leisure and recreation facilities, a supermarket, offices and other retail uses. The permit activity demonstrates that while there has been significant activity for typical industrial uses, the Business Park is also being developed for a range of other uses.
• Building permits were most common for warehouse and factory construction, while there has been some investment in new ‘shops’.
• The major driver of building permits for shops since 2011 has been the construction of three new supermarkets in the Town Centre, Torquay North and the West Coast Business Park.
• Building approvals for office has been inconsistent, however the value of offices approved has increased in recent years, particularly in mixed use developments.
• As shown in Figure 7, the value of building permits approved for employment uses has increased in recent years and is more evenly distributed across the land uses, with increases in the value of offices and industrial buildings most evident compared with early in the period.
F7. ESTIMATED COST OF APPROVED BUILDING PERMITS, 2011-2019
Source: Surf Coast Shire Council, 2020.
3.6. FUTURE GROWTH OPPORTUNITIES AND PROPOSALS
Two main locations for growth in employment land are identified, including:
• A westward expansion of the West Coast Business Park; and • A new Neighbourhood Activity Centre within the Spring Creek Precinct Structure Plan area, subject to its
approval for residential development.
$0
$2,000,000
$4,000,000
$6,000,000
$8,000,000
$10,000,000
$12,000,000
$14,000,000
$16,000,000
$18,000,000
2011 2012 2013 2014 2015 2016 2017 2018 2019
Shop Offices Flats Factory Warehouse
Torquay – Jan Juc Retail & Employment Land Strategy – Background Report
23
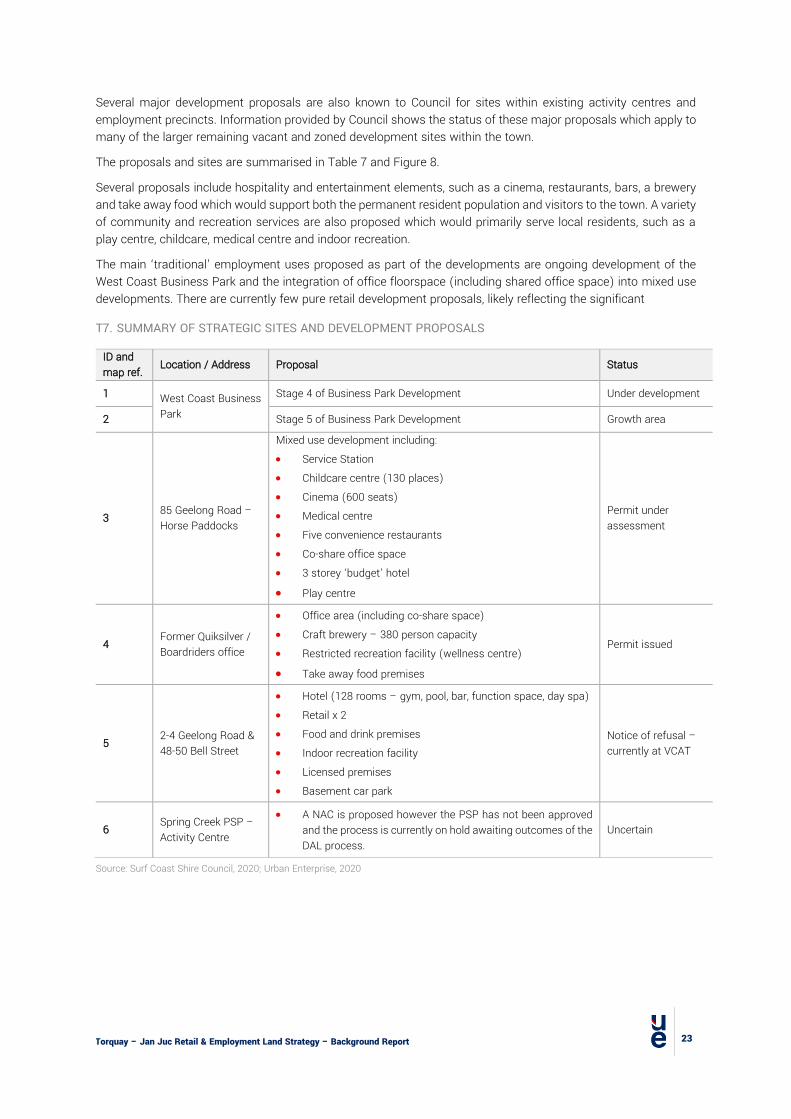
Several major development proposals are also known to Council for sites within existing activity centres and employment precincts. Information provided by Council shows the status of these major proposals which apply to many of the larger remaining vacant and zoned development sites within the town.
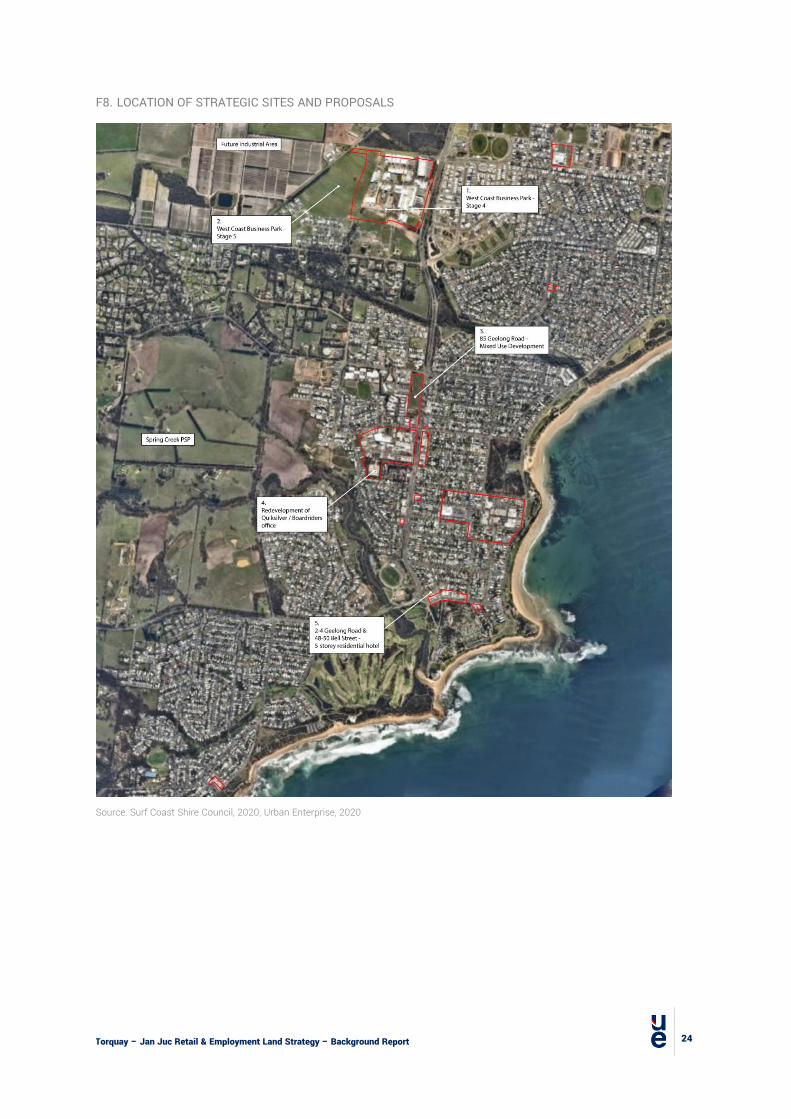
The proposals and sites are summarised in Table 7 and Figure 8.
Several proposals include hospitality and entertainment elements, such as a cinema, restaurants, bars, a brewery and take away food which would support both the permanent resident population and visitors to the town. A variety of community and recreation services are also proposed which would primarily serve local residents, such as a play centre, childcare, medical centre and indoor recreation.
The main ‘traditional’ employment uses proposed as part of the developments are ongoing development of the West Coast Business Park and the integration of office floorspace (including shared office space) into mixed use developments. There are currently few pure retail development proposals, likely reflecting the significant
T7. SUMMARY OF STRATEGIC SITES AND DEVELOPMENT PROPOSALS
ID and map ref. Location / Address Proposal Status
1 West Coast Business Park
Stage 4 of Business Park Development Under development
2 Stage 5 of Business Park Development Growth area
3 85 Geelong Road – Horse Paddocks
Mixed use development including: • Service Station • Childcare centre (130 places) • Cinema (600 seats) • Medical centre • Five convenience restaurants • Co-share office space • 3 storey ‘budget’ hotel
• Play centre
Permit under assessment
4 Former Quiksilver / Boardriders office
• Office area (including co-share space) • Craft brewery – 380 person capacity • Restricted recreation facility (wellness centre)
• Take away food premises
Permit issued
5 2-4 Geelong Road & 48-50 Bell Street
• Hotel (128 rooms – gym, pool, bar, function space, day spa) • Retail x 2 • Food and drink premises • Indoor recreation facility • Licensed premises • Basement car park
Notice of refusal – currently at VCAT
6 Spring Creek PSP – Activity Centre
• A NAC is proposed however the PSP has not been approved and the process is currently on hold awaiting outcomes of the DAL process.
Uncertain
Source: Surf Coast Shire Council, 2020; Urban Enterprise, 2020
Torquay – Jan Juc Retail & Employment Land Strategy – Background Report
24
F8. LOCATION OF STRATEGIC SITES AND PROPOSALS
Source: Surf Coast Shire Council, 2020; Urban Enterprise, 2020
Torquay – Jan Juc Retail & Employment Land Strategy – Background Report
25
3.7. IMPLICATIONS
The following implications for the strategy are drawn from the analysis in this section:
• The retail and employment land is highly fragmented across the study area, however only three of the main employment land zones are applied in the town, meaning that there is a lack of differentiation between the role and function of each precinct.
• There is lack of vacant retail and employment land in the towns, especially in the Commercial 1 Zone. Opportunities for retail and commercial development are limited to redevelopment of existing sites and the strategically located ‘Horse Paddocks’ site which is limited in potential land uses by the Special Use Zone. Opportunities for new retail development to support projected population growth over the planning period will need to be identified to avoid the prospect of under-provision.
• Several Design and Development Overlays (DDO) apply to activity centres, many of which limit development heights to 2 or 3 storeys. When these controls are considered alongside the fragmented landownership in the town centre and other commercial areas, opportunities to develop additional retail and employment space in the town centre and other Commercial 1 Zone precincts are likely to remain limited, slow to realise and less desirable for developers than larger sites in other precincts and zones.
• Although the use of the Special Use Zone enables land uses around Surf City to be tailored, there is the added challenge of ensuring that the controls remain appropriate for the location over time. Several factors are contributing to the need to consider the ongoing relevance of the zone, including the relocation of the Quiksilver headquarters, challenges facing the surf retail sector, strong local population growth driving demand for a new mix of employment and services and a relative lack of readily developable employment land elsewhere in the town. Land in the Special Use Zone should respond to the need for colocation of industries and the growing creatives sector.
• There are currently several vacant tenancies in the town centres of Torquay and Jan Juc. Although vacancy rates naturally fluctuate, this indicates town centres that are not performing to their economic potential.
• There has been a significant increase in retail floorspace and businesses since the previous strategy was prepared, with 3 new supermarkets and a Bunnings store added to the town. Spatially, most of the additional floorspace has been developed in locations outside the town centre, including the West Coast Business Park and Torquay North. This has further fragmented the retail offering across the town. A number of future development opportunities are located outside existing centre boundaries and will likely contribute to this fragmented nature.
• Several major developments are proposed in the town which signal a transition in focus from pure retail developments and towards hospitality, entertainment, community services and recreation. Although some visitor focused elements are proposed, many of the developments would equally meet the needs of the growing permanent population.
• Incremental growth in industrial land and office floorspace is occurring and proposed to continue, however these employment uses are increasingly competing with retail, recreation and other non-traditional employment uses for land and space. Planning will need to better differentiate between the land use vision for different precincts and ensure that overall, sufficient land is available for a variety of non-residential uses.
Torquay – Jan Juc Retail & Employment Land Strategy – Background Report
26
4. POPULATION, EMPLOYMENT AND ECONOMY
4.1. INTRODUCTION
This section provides a profile of the existing and projected population, demographics, employment and local economy. Data areas for these profiles include the Torquay SA2 (Torquay), Surf Coast Shire, City of Greater Geelong and the Geelong SA4. Maps for these areas are provided in Appendix A.
4.2. POPULATION
Torquay’s population experienced significant growth between 2010 and 2019. The Estimated Residential Population (ERP) of the SA2 was 21,766 people in 2019, growing at an average annual rate of 4.4%, or 780 people per year since 2010.
Population growth in Torquay (+7,000 people) over the period accounted for more than 90% of all population growth in the Surf Coast Shire. The rate of population growth in Torquay and Surf Coast has been higher than that of Greater Geelong, which experienced an average annual increase of 2.2% between 2010 and 2019.
T8. HISTORICAL ERP, 2010 TO 2019
Region 2010 2016 2019 CHANGE 2010-2019
No. AAG % change AAGR Torquay 14,743 19,131 21,766 7,023 780 48% 4.4% Surf Coast 25,861 30,465 33,456 7,595 844 29% 2.9% Greater Geelong 212,585 239,529 258,934 46,349 5,150 22% 2.2%
Source: ABS Regional Population Growth, 2020.
PROJECTIONS
Table 9 and Figure 9 show population projections prepared by Forecast ID (for Council) and Victoria in Future 2019 (VIF), the official State government projections.
Torquay is expected to continue to experience strong population growth of between 2.3% and 2.5% per annum over the next 15 years, ultimately reaching approximately 32,000 persons by 2036. This represents an increase in population of approximately 650 residents per year over the period, and an overall increase of between 9,000 and 10,000 additional residents in Torquay. The ongoing strong population growth will generate additional demand for housing, employment, infrastructure and services.
Spatially, more than half of the population growth for Torquay (56%) is expected to occur in the northern part of town (see Forecast id map in Appendix A). A closer analysis of the locations of population growth and implications for retail floorspace and employment land is included in Section 5.
The population growth to 2036 adopted for Torquay from Forecast ID include 1,065 dwellings in the Spring Creek PSP. There remains some uncertainty as to when or if this area will occur. If Spring Creek is not developed within the projection period and sufficient residential land is not provided elsewhere to accommodate land, it may result in significantly lower population growth in Torquay.

Torquay – Jan Juc Retail & Employment Land Strategy – Background Report
27
T9. POPULATION PROJECTIONS TABLE: 2016, 2021 AND 2036
Region 2016 2021 2036 CHANGE 2021-2036
# Average % AAGR
Victoria in Future
Torquay 19,131 22,905 32,068 9,163 611 40% 2.3%
Surf Coast 30,465 34,831 45,438 10,608 707 30% 1.8%
Greater Geelong 239,529 271,254 360,245 88,991 5,933 33% 1.9%
Forecast ID
Torquay* 18,627 21,808 31,577 9,769** 651 45% 2.5%
Surf Coast 30,445 34,230 45,717 11,487 766 34% 1.9%
Greater Geelong 239,531 268,984 361,014 92,030 6,135 34% 2.0%
Source: Victoria in Future, 2019; Forecast id, 2020. * Note: Estimates of Forecast ID small areas for Torquay North, ‘Old Torquay’ and Jan Juc have been combined to form an area which closely aligns, however is not identical, to the Torquay SA2 (see Appendix A for maps).
**Forecast ID projections include 1,065 dwellings in Spring Creek.
F9. POPULATION PROJECTIONS GRAPH: 2016, 2021 AND 2036
Source: Source: Forecast id, 2020; Victoria in Future, 2019. Note: ‘Torquay’ in Forecast ID is different to the SA2 in VIF projections.
4.3. DEMOGRAPHICS
AGE PROFILE
As shown in Figure 10, Torquay’s population is comparatively young, with a median age of 39 years, making it younger than Surf Coast (42 years), Greater Geelong (40) and Regional Victoria (43).
This is reflected in the age distribution, with a larger proportion of Torquay residents aged between 25 and 50 years and children aged 0 to 9 years compared to Surf Coast, while having a lower share of residents aged above 50 years. This age structure has been influenced in recent years by the strong presence of young families located in Torquay North in recently developed estates.
When compared to Greater Geelong, Torquay and Surf Coast have a significantly lower share of residents in the 20 to 29 years cohort, an important age bracket for retail, hospitality and trades labour.
Torquay – Jan Juc Retail & Employment Land Strategy – Background Report
28
F10. AGE PROFILE. TORQUAY, SURF COAST & GREATER GEELONG, 2016
Source: ABS Census of Population & Housing, 2016.
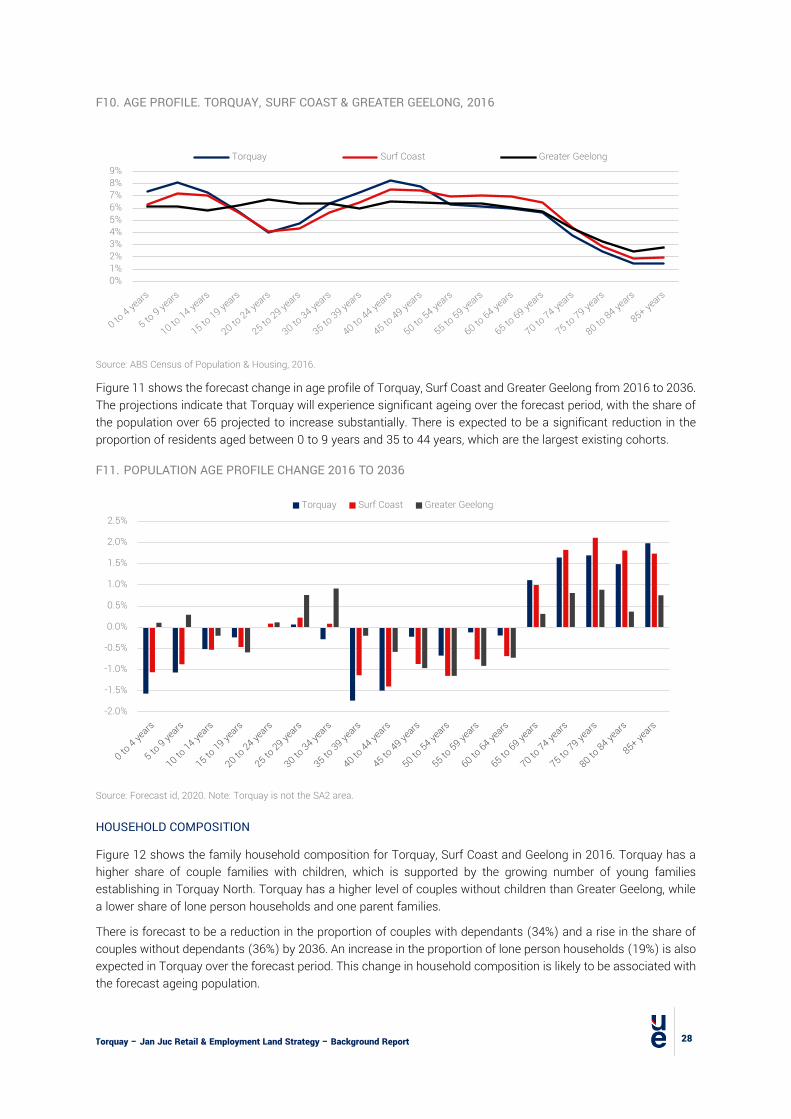
Figure 11 shows the forecast change in age profile of Torquay, Surf Coast and Greater Geelong from 2016 to 2036. The projections indicate that Torquay will experience significant ageing over the forecast period, with the share of the population over 65 projected to increase substantially. There is expected to be a significant reduction in the proportion of residents aged between 0 to 9 years and 35 to 44 years, which are the largest existing cohorts.
F11. POPULATION AGE PROFILE CHANGE 2016 TO 2036
Source: Forecast id, 2020. Note: Torquay is not the SA2 area.
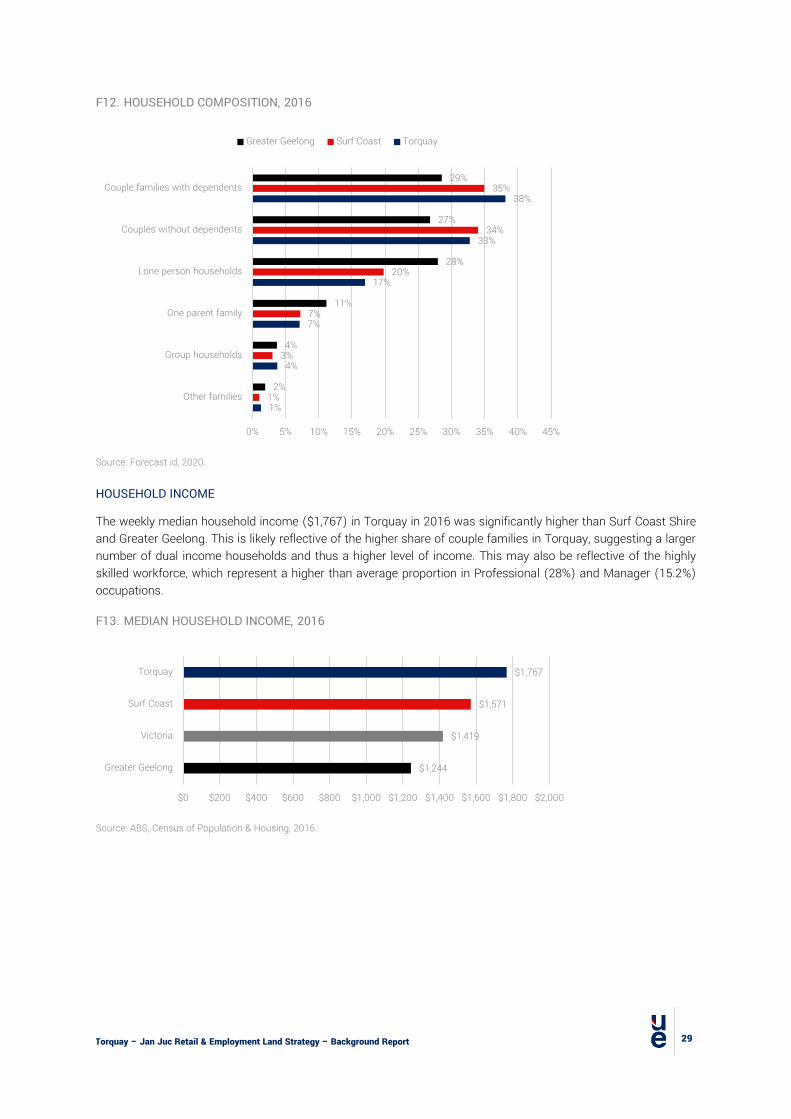
HOUSEHOLD COMPOSITION
Figure 12 shows the family household composition for Torquay, Surf Coast and Geelong in 2016. Torquay has a higher share of couple families with children, which is supported by the growing number of young families establishing in Torquay North. Torquay has a higher level of couples without children than Greater Geelong, while a lower share of lone person households and one parent families.
There is forecast to be a reduction in the proportion of couples with dependants (34%) and a rise in the share of couples without dependants (36%) by 2036. An increase in the proportion of lone person households (19%) is also expected in Torquay over the forecast period. This change in household composition is likely to be associated with the forecast ageing population.
0%1%2%3%4%5%6%7%8%9%
Torquay Surf Coast Greater Geelong
-2.0%
-1.5%
-1.0%
-0.5%
0.0%
0.5%
1.0%
1.5%
2.0%
2.5%Torquay Surf Coast Greater Geelong
Torquay – Jan Juc Retail & Employment Land Strategy – Background Report
29
F12. HOUSEHOLD COMPOSITION, 2016
Source: Forecast id, 2020.
HOUSEHOLD INCOME
The weekly median household income ($1,767) in Torquay in 2016 was significantly higher than Surf Coast Shire and Greater Geelong. This is likely reflective of the higher share of couple families in Torquay, suggesting a larger number of dual income households and thus a higher level of income. This may also be reflective of the highly skilled workforce, which represent a higher than average proportion in Professional (28%) and Manager (15.2%) occupations.
F13. MEDIAN HOUSEHOLD INCOME, 2016
Source: ABS, Census of Population & Housing, 2016.
1%
4%
7%
17%
33%
38%
1%
3%
7%
20%
34%
35%
2%
4%
11%
28%
27%
29%
0% 5% 10% 15% 20% 25% 30% 35% 40% 45%
Other families
Group households
One parent family
Lone person households
Couples without dependents
Couple families with dependents
Greater Geelong Surf Coast Torquay
$1,244
$1,419
$1,571
$1,767
$0 $200 $400 $600 $800 $1,000 $1,200 $1,400 $1,600 $1,800 $2,000
Greater Geelong
Victoria
Surf Coast
Torquay

Torquay – Jan Juc Retail & Employment Land Strategy – Background Report
30
4.4. EMPLOYMENT PROFILE OF TORQUAY RESIDENTS
Table 10 provides a summary of employment status for residents in Torquay, Surf Coast and Greater Geelong in 2016. Torquay had nearly 9,000 employed residents, with a relatively low unemployment rate of 4.1%. The number of employed residents in Torquay grew at an average annual rate of 3.6% between 2011 and 2016.
T10. EMPLOYMENT STATUS, TORQUAY, SURF COAST & GREATER GEELONG, 2016
Torquay Surf Coast Greater Geelong
Employed 8,878 14,084 103,577
Unemployed 381 559 7,055
Total 9,259 14,643 110,632
Unemployment rate 4.1% 3.8% 6.4%
Source: ABS, Census of Population & Housing, 2016.
INDUSTRY OF EMPLOYMENT
The key industry sectors in which Torquay residents are employed include Health Care and Social Assistance, Education and Training, and Construction, with over 1,000 residents employed in each industry (2016). Retail Trade represents the next largest industry of employment for residents.
As shown in Figure 14, there was significant growth in the number of residents employed in the social services industries of Health Care and Social Assistance and Education and Training between 2011 and 2016. Public Administration and Safety as well as Retail Trade also recorded strong increases between 2011 and 2016. There was also some increase in office related industries, however not to the same extent as social and public services.
Conversely, there was a reduction in residents employed in the Wholesale Trade and Manufacturing industries, reflecting the broad transition occurring across the Geelong region towards more knowledge and service based jobs from a former industrial focus.
The changes are likely to be influenced by the increase in educational attainment of residents over the period, with 23% of the population having a bachelor’s degree or higher in 2016 compared with 20% in 2011. Further, this has translated into proportional increases in residents who are Manager and Professionals as well as Community and Personal Service Workers, while the proportion decreasing trend in occupations related to industrial activity.
F14. INDUSTRY OF EMPLOYMENT, TORQUAY RESIDENTS, 2011 & 2016
Source: ABS, Census of Population & Housing, 2011 and 2016
0 200 400 600 800 1,000 1,200 1,400
MiningElectricity, Gas, Water and Waste Services
Agriculture, Forestry and FishingInformation Media and Telecommunications
Arts and Recreation ServicesRental, Hiring and Real Estate Services
Transport, Postal and WarehousingAdministrative and Support Services
Financial and Insurance ServicesOther Services
Wholesale TradeManufacturing
Public Administration and SafetyAccommodation and Food Services
Professional, Scientific and Technical ServicesRetail Trade
ConstructionEducation and Training
Health Care and Social Assistance
2011 2016
Torquay – Jan Juc Retail & Employment Land Strategy – Background Report
31
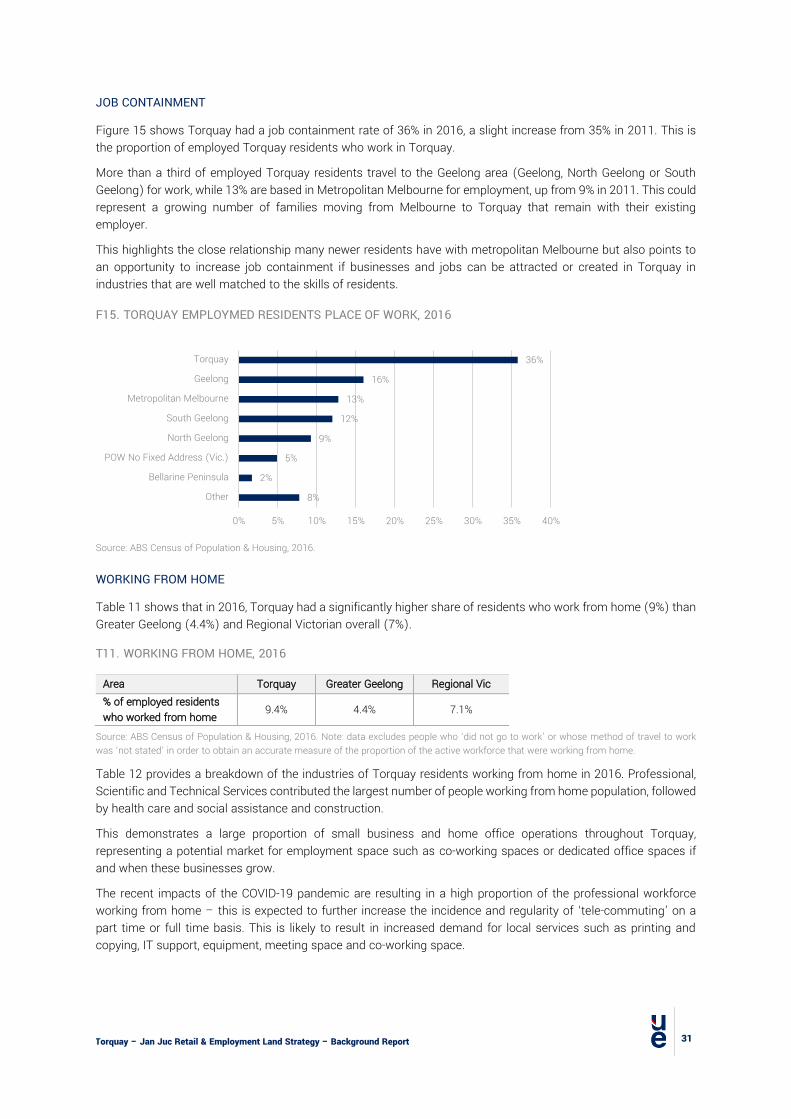
JOB CONTAINMENT
Figure 15 shows Torquay had a job containment rate of 36% in 2016, a slight increase from 35% in 2011. This is the proportion of employed Torquay residents who work in Torquay.
More than a third of employed Torquay residents travel to the Geelong area (Geelong, North Geelong or South Geelong) for work, while 13% are based in Metropolitan Melbourne for employment, up from 9% in 2011. This could represent a growing number of families moving from Melbourne to Torquay that remain with their existing employer.
This highlights the close relationship many newer residents have with metropolitan Melbourne but also points to an opportunity to increase job containment if businesses and jobs can be attracted or created in Torquay in industries that are well matched to the skills of residents.
F15. TORQUAY EMPLOYMED RESIDENTS PLACE OF WORK, 2016
Source: ABS Census of Population & Housing, 2016.
WORKING FROM HOME
Table 11 shows that in 2016, Torquay had a significantly higher share of residents who work from home (9%) than Greater Geelong (4.4%) and Regional Victorian overall (7%).
T11. WORKING FROM HOME, 2016
Area Torquay Greater Geelong Regional Vic % of employed residents who worked from home 9.4% 4.4% 7.1%
Source: ABS Census of Population & Housing, 2016. Note: data excludes people who ‘did not go to work’ or whose method of travel to work was ‘not stated’ in order to obtain an accurate measure of the proportion of the active workforce that were working from home.
Table 12 provides a breakdown of the industries of Torquay residents working from home in 2016. Professional, Scientific and Technical Services contributed the largest number of people working from home population, followed by health care and social assistance and construction.
This demonstrates a large proportion of small business and home office operations throughout Torquay, representing a potential market for employment space such as co-working spaces or dedicated office spaces if and when these businesses grow.
The recent impacts of the COVID-19 pandemic are resulting in a high proportion of the professional workforce working from home – this is expected to further increase the incidence and regularity of ‘tele-commuting’ on a part time or full time basis. This is likely to result in increased demand for local services such as printing and copying, IT support, equipment, meeting space and co-working space.
8%
2%
5%
9%
12%
13%
16%
36%
0% 5% 10% 15% 20% 25% 30% 35% 40%
Other
Bellarine Peninsula
POW No Fixed Address (Vic.)
North Geelong
South Geelong
Metropolitan Melbourne
Geelong
Torquay
Torquay – Jan Juc Retail & Employment Land Strategy – Background Report
32
T12. WORKING FROM HOME BY INDUSTRY, TORQUAY, 2016
Top 10 Industries No.1
Professional, Scientific and Technical Services 179 Health Care and Social Assistance 65 Construction 60 Education and Training 45 Financial and Insurance Services 35 Administrative and Support Services 35 Manufacturing 29 Other Services 29 Wholesale Trade 26 Retail Trade 26
Source: ABS Census of Population & Housing, 2016. Note 1: this does not include all employed residents – a proportion of respondents did not state their method of travel to work in 2016.
The Skills & Emerging Industries Audit & Strategy Report provides estimates of home-based businesses in Surf Coast Shire (as at May 2020). There a total of 2,252 home based businesses, with the largest categories being Building and Construction (840, 37%), Creatives (404, 18%), Professional Services (378, 17%) and Property Services (145, 6%).1
Table 13 provides a summary of the jobs leaving Torquay from the top 10 employment industries for residents. The social services industries of Health Care and Social Assistance and Education and Training have the highest proportion of labour leaving the local area (79%), primarily to major health and education institutions in Geelong.
A significant number of Torquay residents in the industries of construction, retail trade and professional, scientific and technical services are also leaving the area for employment.
T13. JOBS LEAVING TORQUAY, 2016
Industry Torquay Employment Jobs Leaving Torquay Total % Total %
Health Care and Social Assistance 1,180 14% 936 79% Education and Training 1,079 13% 848 79% Construction 1,039 12% 685 66% Retail Trade 861 10% 482 56% Professional, Scientific and Technical Services 664 8% 374 56% Accommodation and Food Services 652 8% 195 30% Public Administration and Safety 591 7% 451 76% Manufacturing 507 6% 350 69% Wholesale Trade 314 4% 130 41% Other Services 287 3% 166 58% Financial and Insurance Services 278 3% 220 79% Administrative and Support Services 251 3% 131 52%
Source: ABS Census of Population & Housing, 2016.
1 Skills & Emerging Industries Audit & Strategy Report – Draft, MCa, June 2020
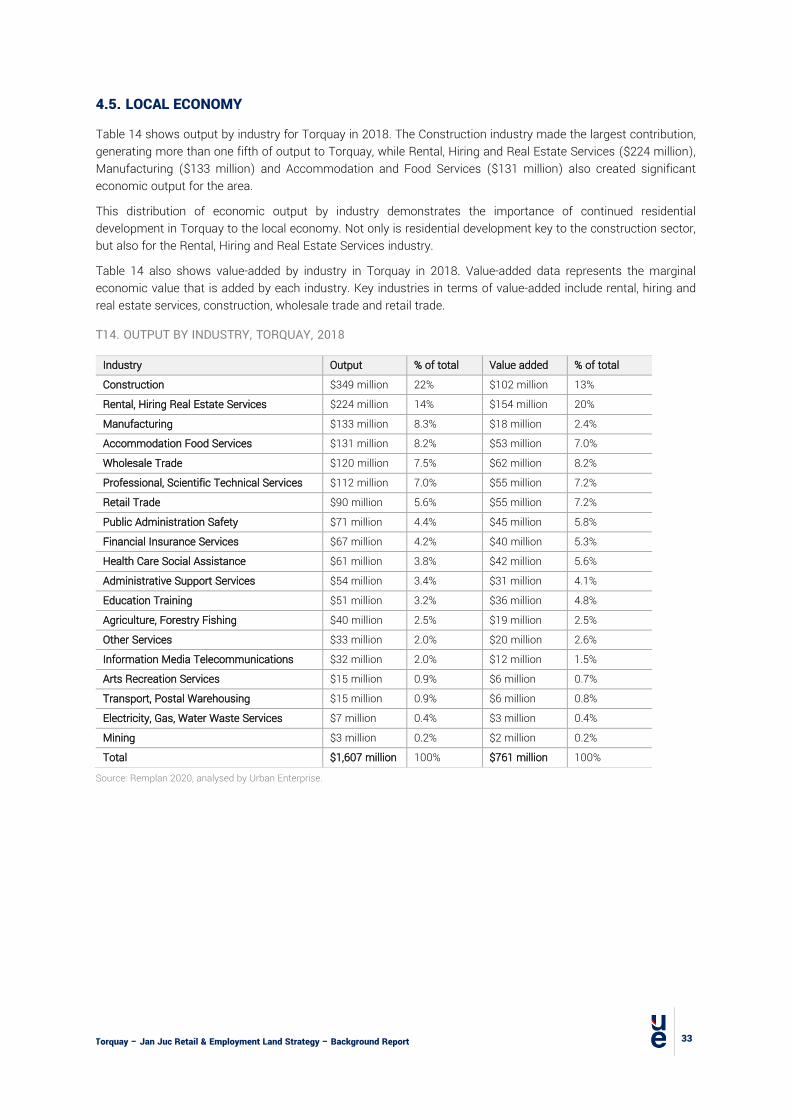
Torquay – Jan Juc Retail & Employment Land Strategy – Background Report
33
4.5. LOCAL ECONOMY
Table 14 shows output by industry for Torquay in 2018. The Construction industry made the largest contribution, generating more than one fifth of output to Torquay, while Rental, Hiring and Real Estate Services ($224 million), Manufacturing ($133 million) and Accommodation and Food Services ($131 million) also created significant economic output for the area.
This distribution of economic output by industry demonstrates the importance of continued residential development in Torquay to the local economy. Not only is residential development key to the construction sector, but also for the Rental, Hiring and Real Estate Services industry.
Table 14 also shows value-added by industry in Torquay in 2018. Value-added data represents the marginal economic value that is added by each industry. Key industries in terms of value-added include rental, hiring and real estate services, construction, wholesale trade and retail trade.
T14. OUTPUT BY INDUSTRY, TORQUAY, 2018
Industry Output % of total Value added % of total
Construction $349 million 22% $102 million 13%
Rental, Hiring Real Estate Services $224 million 14% $154 million 20%
Manufacturing $133 million 8.3% $18 million 2.4%
Accommodation Food Services $131 million 8.2% $53 million 7.0%
Wholesale Trade $120 million 7.5% $62 million 8.2%
Professional, Scientific Technical Services $112 million 7.0% $55 million 7.2%
Retail Trade $90 million 5.6% $55 million 7.2%
Public Administration Safety $71 million 4.4% $45 million 5.8%
Financial Insurance Services $67 million 4.2% $40 million 5.3%
Health Care Social Assistance $61 million 3.8% $42 million 5.6%
Administrative Support Services $54 million 3.4% $31 million 4.1%
Education Training $51 million 3.2% $36 million 4.8%
Agriculture, Forestry Fishing $40 million 2.5% $19 million 2.5%
Other Services $33 million 2.0% $20 million 2.6%
Information Media Telecommunications $32 million 2.0% $12 million 1.5%
Arts Recreation Services $15 million 0.9% $6 million 0.7%
Transport, Postal Warehousing $15 million 0.9% $6 million 0.8%
Electricity, Gas, Water Waste Services $7 million 0.4% $3 million 0.4%
Mining $3 million 0.2% $2 million 0.2%
Total $1,607 million 100% $761 million 100%
Source: Remplan 2020, analysed by Urban Enterprise.

Torquay – Jan Juc Retail & Employment Land Strategy – Background Report
34
4.6. LOCAL EMPLOYMENT
Torquay experienced strong local employment growth between 2011 and 2016 of 4.8% per annum to reach 5,344 workers by 2016, representing an increase of approximately 225 jobs per year. Torquay’s employment growth rate compares favourably to Surf Coast (4%) and Greater Geelong (3.7%).
Employment growth in Torquay comprised more than 70% of the increase across the Surf Coast Shire and Torquay’s employment base grew at a faster rate than its residential population (+4.3% p.a.) from 2011 to 2016.
T15. EMPLOYMENT NUMBER AND CHANGE, 2011 - 2016
Region 2011 2016 CHANGE 2011-2016
Total Average % AAGR
Torquay 4,226 5,344 1,118 224 26% 4.8%
Surf Coast 7,158 8,694 1,536 307 21% 4.0%
Greater Geelong 79,156 95,058 15,902 3,180 20% 3.7%
Source: ABS, Census of Population & Housing, 2011 and 2016.
INDUSTRY OF EMPLOYMENT
The main industries of employment in Torquay are tourism-related sectors of Accommodation and Food Services and Retail Trade which support approximately 30% of jobs in the area. Other significant industries include Construction (11%), Health and Social Assistance (9%) and Education and Training (8%).
Retail and tourism industries and social services sectors experienced the strongest employment growth between 2011 and 2016. Conversely, Wholesale Trade (-171 jobs) was the only industry to experience a decrease in the number of jobs, while Construction (+6 workers) and Manufacturing (+27) experienced minimal increases.
T16. TORQUAY SA2 WORKERS’ INDUSTRY OF EMPLOYMENT, 2011 & 2016
Industry 2011 2016 CHANGE
Total %. Total %. Total %. Accommodation and Food Services 596 14.2% 795 15.5% +199 +33% Retail Trade 614 14.6% 733 14.3% +119 +19% Construction 584 13.9% 590 11.5% +6 +1% Health Care and Social Assistance 290 6.9% 450 8.8% +160 +55% Education and Training 260 6.2% 408 8.0% +148 +57% Professional, Scientific and Technical Services 261 6.2% 354 6.9% +93 +36% Public Administration and Safety 257 6.1% 324 6.3% +67 +26% Wholesale Trade 468 11.2% 297 5.8% -171 -37% Manufacturing 218 5.2% 245 4.8% +27 +12% Other Services 151 3.6% 228 4.5% +77 +51% Administrative and Support Services 99 2.4% 176 3.4% +77 +78% Rental, Hiring and Real Estate Services 90 2.1% 107 2.1% +17 +19% Financial and Insurance Services 66 1.6% 99 1.9% +33 +50% Arts and Recreation Services 70 1.7% 92 1.8% +22 +31% Agriculture, Forestry and Fishing 74 1.8% 82 1.6% +8 +11% Information Media and Telecommunications 39 0.9% 69 1.3% +30 +77% Transport, Postal and Warehousing 46 1.1% 56 1.1% +10 +22% Electricity, Gas, Water and Waste Services 9 0.2% 13 0.3% +4 +44% Mining 0 0.0% 3 0.1% +3 NA Total 4,192 100% 5,121 100% +1,118 +22%
Source: ABS Census of Population & Housing, 2011, 2016.
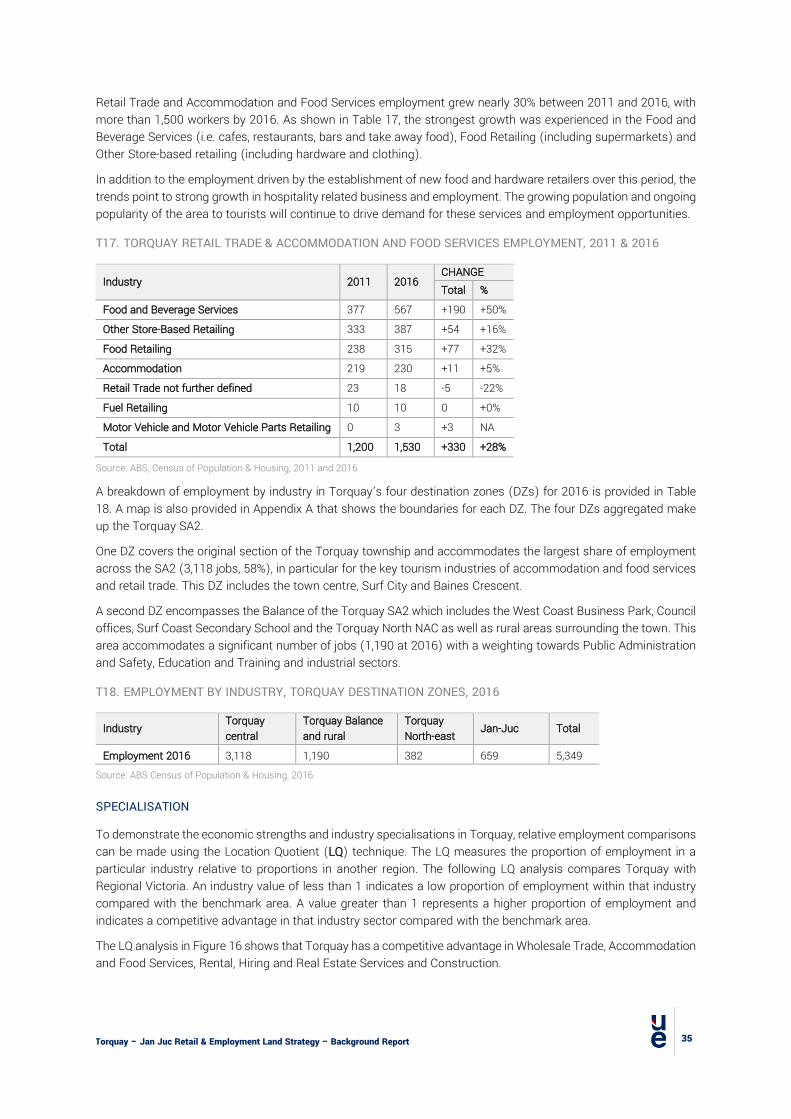
Torquay – Jan Juc Retail & Employment Land Strategy – Background Report
35
Retail Trade and Accommodation and Food Services employment grew nearly 30% between 2011 and 2016, with more than 1,500 workers by 2016. As shown in Table 17, the strongest growth was experienced in the Food and Beverage Services (i.e. cafes, restaurants, bars and take away food), Food Retailing (including supermarkets) and Other Store-based retailing (including hardware and clothing).
In addition to the employment driven by the establishment of new food and hardware retailers over this period, the trends point to strong growth in hospitality related business and employment. The growing population and ongoing popularity of the area to tourists will continue to drive demand for these services and employment opportunities.
T17. TORQUAY RETAIL TRADE & ACCOMMODATION AND FOOD SERVICES EMPLOYMENT, 2011 & 2016
Industry 2011 2016 CHANGE Total %
Food and Beverage Services 377 567 +190 +50%
Other Store-Based Retailing 333 387 +54 +16%
Food Retailing 238 315 +77 +32%
Accommodation 219 230 +11 +5%
Retail Trade not further defined 23 18 -5 -22%
Fuel Retailing 10 10 0 +0%
Motor Vehicle and Motor Vehicle Parts Retailing 0 3 +3 NA
Total 1,200 1,530 +330 +28%
Source: ABS, Census of Population & Housing, 2011 and 2016
A breakdown of employment by industry in Torquay’s four destination zones (DZs) for 2016 is provided in Table 18. A map is also provided in Appendix A that shows the boundaries for each DZ. The four DZs aggregated make up the Torquay SA2.
One DZ covers the original section of the Torquay township and accommodates the largest share of employment across the SA2 (3,118 jobs, 58%), in particular for the key tourism industries of accommodation and food services and retail trade. This DZ includes the town centre, Surf City and Baines Crescent.
A second DZ encompasses the Balance of the Torquay SA2 which includes the West Coast Business Park, Council offices, Surf Coast Secondary School and the Torquay North NAC as well as rural areas surrounding the town. This area accommodates a significant number of jobs (1,190 at 2016) with a weighting towards Public Administration and Safety, Education and Training and industrial sectors.
T18. EMPLOYMENT BY INDUSTRY, TORQUAY DESTINATION ZONES, 2016
Industry Torquay central
Torquay Balance and rural
Torquay North-east Jan-Juc Total
Employment 2016 3,118 1,190 382 659 5,349 Source: ABS Census of Population & Housing, 2016.
SPECIALISATION
To demonstrate the economic strengths and industry specialisations in Torquay, relative employment comparisons can be made using the Location Quotient (LQ) technique. The LQ measures the proportion of employment in a particular industry relative to proportions in another region. The following LQ analysis compares Torquay with Regional Victoria. An industry value of less than 1 indicates a low proportion of employment within that industry compared with the benchmark area. A value greater than 1 represents a higher proportion of employment and indicates a competitive advantage in that industry sector compared with the benchmark area.
The LQ analysis in Figure 16 shows that Torquay has a competitive advantage in Wholesale Trade, Accommodation and Food Services, Rental, Hiring and Real Estate Services and Construction.
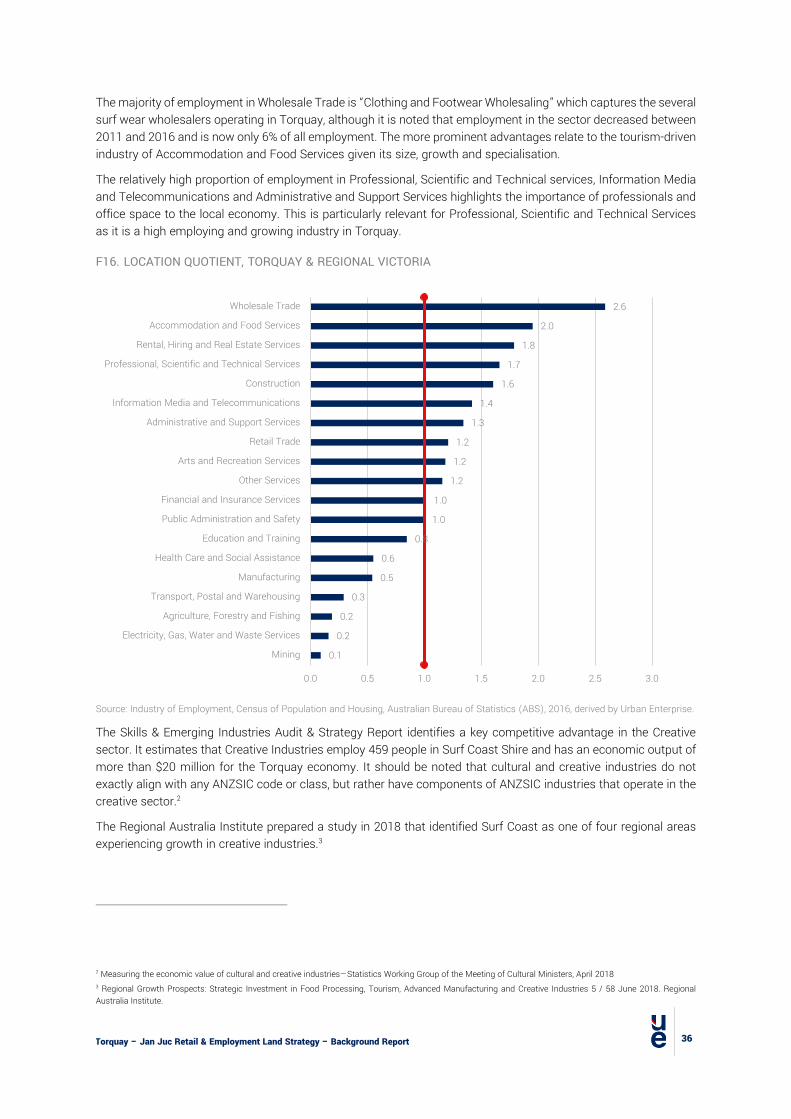
Torquay – Jan Juc Retail & Employment Land Strategy – Background Report
36
The majority of employment in Wholesale Trade is “Clothing and Footwear Wholesaling” which captures the several surf wear wholesalers operating in Torquay, although it is noted that employment in the sector decreased between 2011 and 2016 and is now only 6% of all employment. The more prominent advantages relate to the tourism-driven industry of Accommodation and Food Services given its size, growth and specialisation.
The relatively high proportion of employment in Professional, Scientific and Technical services, Information Media and Telecommunications and Administrative and Support Services highlights the importance of professionals and office space to the local economy. This is particularly relevant for Professional, Scientific and Technical Services as it is a high employing and growing industry in Torquay.
F16. LOCATION QUOTIENT, TORQUAY & REGIONAL VICTORIA
Source: Industry of Employment, Census of Population and Housing, Australian Bureau of Statistics (ABS), 2016, derived by Urban Enterprise.
The Skills & Emerging Industries Audit & Strategy Report identifies a key competitive advantage in the Creative sector. It estimates that Creative Industries employ 459 people in Surf Coast Shire and has an economic output of more than $20 million for the Torquay economy. It should be noted that cultural and creative industries do not exactly align with any ANZSIC code or class, but rather have components of ANZSIC industries that operate in the creative sector.2
The Regional Australia Institute prepared a study in 2018 that identified Surf Coast as one of four regional areas experiencing growth in creative industries.3
2 Measuring the economic value of cultural and creative industries—Statistics Working Group of the Meeting of Cultural Ministers, April 2018 3 Regional Growth Prospects: Strategic Investment in Food Processing, Tourism, Advanced Manufacturing and Creative Industries 5 / 58 June 2018. Regional Australia Institute.
0.1
0.2
0.2
0.3
0.5
0.6
0.8
1.0
1.0
1.2
1.2
1.2
1.3
1.4
1.6
1.7
1.8
2.0
2.6
0.0 0.5 1.0 1.5 2.0 2.5 3.0
Mining
Electricity, Gas, Water and Waste Services
Agriculture, Forestry and Fishing
Transport, Postal and Warehousing
Manufacturing
Health Care and Social Assistance
Education and Training
Public Administration and Safety
Financial and Insurance Services
Other Services
Arts and Recreation Services
Retail Trade
Administrative and Support Services
Information Media and Telecommunications
Construction
Professional, Scientific and Technical Services
Rental, Hiring and Real Estate Services
Accommodation and Food Services
Wholesale Trade

Torquay – Jan Juc Retail & Employment Land Strategy – Background Report
37
WORKERS’ PLACE OF RESIDENCE
Figure 17 shows the place of usual residence for workers in Torquay in 2016. Nearly 60% of the local workforce also live in Torquay, with another third of workers residing in either Greater Geelong or the surrounding SA2s of Winchelsea and Lorne-Anglesea. This indicates that Torquay has a workforce catchment with an approximately 40 kilometre radius from the town centre, equivalent to a 45-minute drive.
F17. TORQUAY WORKERS’ PLACE OF RESIDENCE, 2016
Source: ABS Census of Population & Housing, 2016.
REGIONAL EMPLOYMENT GROWTH
Federal government employment projections are published for each region of Australia (ABS SA4 level) for the 5-year period from 2019 to 2024.
These projections provide an indication of the trends in industry growth that should be planned for. Table 19 shows the projections for the Geelong region which includes Torquay. The largest forecast increases in employment are expected in healthcare and social assistance, construction, education and training and professional, scientific and technical services.
Manufacturing, transport, postal and warehousing and agriculture, forestry and fishing are all expected to reduce in employment over the period. These projections reflect the macroeconomic shifts in the Geelong region, whereby employment is transitioning away from industrial land uses towards professional and social services to facilitate growth in population and knowledge industries.
These projections do not necessarily hold true at the local level, however. For example, Torquay has seen an increase in employment in certain industrial sectors over the period 2011 to 2016.
5%
2%
2%
3%
5%
7%
17%
59%
0% 10% 20% 30% 40% 50% 60% 70%
Other
Geelong
Winchelsea
Lorne - Anglesea
North Geelong
Bellarine Peninsula
South Geelong
Torquay
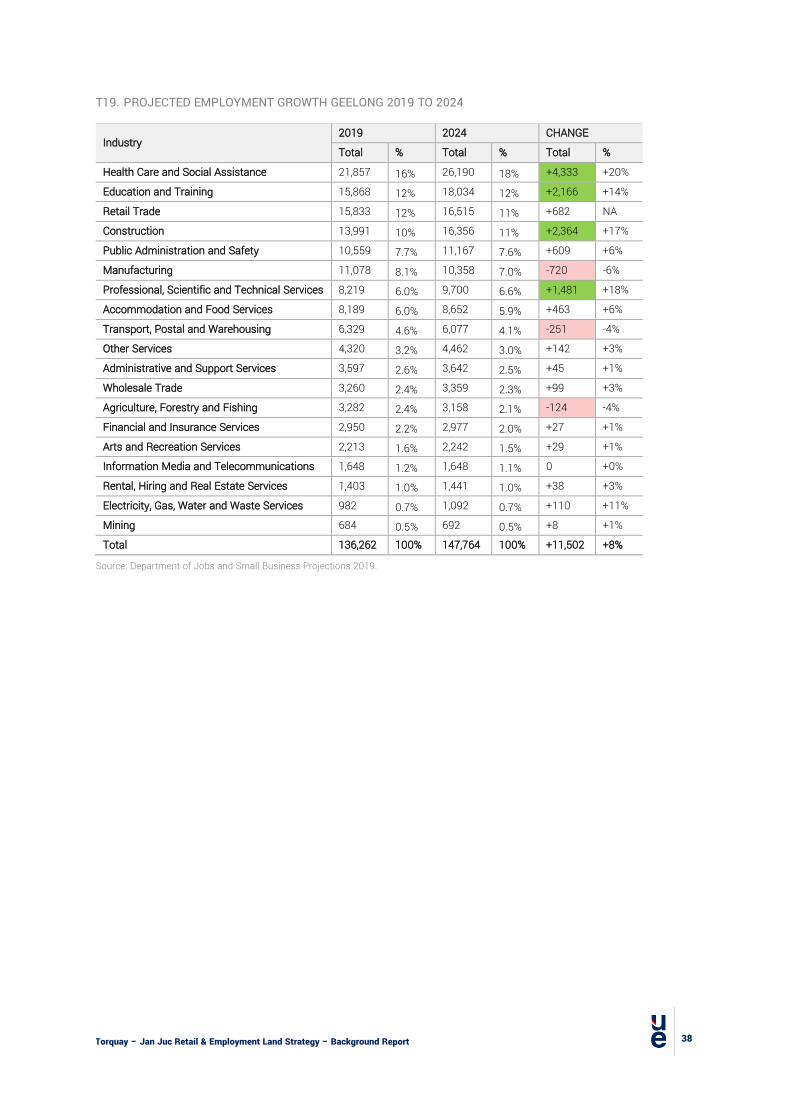
Torquay – Jan Juc Retail & Employment Land Strategy – Background Report
38
T19. PROJECTED EMPLOYMENT GROWTH GEELONG 2019 TO 2024
Industry 2019 2024 CHANGE
Total % Total % Total %
Health Care and Social Assistance 21,857 16% 26,190 18% +4,333 +20%
Education and Training 15,868 12% 18,034 12% +2,166 +14%
Retail Trade 15,833 12% 16,515 11% +682 NA
Construction 13,991 10% 16,356 11% +2,364 +17%
Public Administration and Safety 10,559 7.7% 11,167 7.6% +609 +6%
Manufacturing 11,078 8.1% 10,358 7.0% -720 -6%
Professional, Scientific and Technical Services 8,219 6.0% 9,700 6.6% +1,481 +18%
Accommodation and Food Services 8,189 6.0% 8,652 5.9% +463 +6%
Transport, Postal and Warehousing 6,329 4.6% 6,077 4.1% -251 -4%
Other Services 4,320 3.2% 4,462 3.0% +142 +3%
Administrative and Support Services 3,597 2.6% 3,642 2.5% +45 +1%
Wholesale Trade 3,260 2.4% 3,359 2.3% +99 +3%
Agriculture, Forestry and Fishing 3,282 2.4% 3,158 2.1% -124 -4%
Financial and Insurance Services 2,950 2.2% 2,977 2.0% +27 +1%
Arts and Recreation Services 2,213 1.6% 2,242 1.5% +29 +1%
Information Media and Telecommunications 1,648 1.2% 1,648 1.1% 0 +0%
Rental, Hiring and Real Estate Services 1,403 1.0% 1,441 1.0% +38 +3%
Electricity, Gas, Water and Waste Services 982 0.7% 1,092 0.7% +110 +11%
Mining 684 0.5% 692 0.5% +8 +1%
Total 136,262 100% 147,764 100% +11,502 +8%
Source: Department of Jobs and Small Business Projections 2019.
Torquay – Jan Juc Retail & Employment Land Strategy – Background Report
39
4.7. IMPLICATIONS FOR STRATEGY
• Since the previous strategy was prepared, the local population has increased by 7,000 residents, almost 50% of the population at 2010. Projections are for continued strong growth over the planning period in the order of a further 9,000 – 10,000 additional residents. This ongoing rapid growth will drive demand for a range of services, retail and employment. At the end of the planning period, the local catchment population will exceed 30,000 residents which is likely to support higher order facilities.
• The DAL project may have an influence on the long term population capacity of Torquay through the implementation of settlement boundaries. Additionally, there remains uncertainty about the long term future of Spring Creek. Projections from Forecast ID include 1,065 dwellings in the Spring Creek development to 2036. If Spring Creek is not developed within the projection period and sufficient residential land is not provided elsewhere to accommodate land, it may result in lower population growth in Torquay.
• Torquay has a relatively young community with above average incomes. There is the opportunity to continue to provide retail, services and employment opportunities which match these characteristics. Over the medium term, the ageing of the population will result in increasing demand for services suited to retirees and older residents.
• A high proportion of newer residents to the town work in Melbourne or Geelong, whereas nearly 60% of the local workforce live locally in Torquay. The Strategy could seek to reduce the number of local residents working in other municipalities, while capitalising on any population and labour force growth within southern Geelong and Surf Coast Shire to support local business growth.
• The tourism industry plays a significant and growing role in terms of employment in Torquay, especially in terms of accommodation and hospitality. This is an ongoing strength that should be considered as part of the Strategy.
• Increasing demand for health, education and recreation services will need to be considered as part of the strategy, alongside traditional office and industrial land uses.
• Recent and projected growth in the labour force and employment in industries using office space will create demand for more office space over the planning period. The high number of professionals working from home in the study area and the impacts of the COVID-19 pandemic will further drive this need, alongside supporting services and goods.
• Torquay’s competitive advantage in the Accommodation and Food Service should continue to be leveraged, using the tourism sector continue to support this industry as well as capturing and catering for the growing resident base. Accommodation opportunities in central areas, such as the town centre and Bell Street precincts are well placed to provide a strong tourism offer.
• Torquay should leverage the position of Surf Coast as a unique area experiencing growth in Creative industries. The Torquay Cultural Feasibility Study (July 2020) recommends an entirely new Cultural Facility and Library at the site of the existing Visitor Information Centre and Australian National Surfing Museum on Beach Road, Torquay. There is potential for a significant investment such as this to contribute to the ongoing development of Creative industries in Torquay.
Torquay – Jan Juc Retail & Employment Land Strategy – Background Report
40
5. DEMAND DRIVERS
5.1. INTRODUCTION
This section provides a discussion of the drivers of demand for retail and employment in Torquay over the planning period and a review of current trends that will influence the types and locations of business opportunities.
The section is informed by research and consultation with selected landowners, businesses and developers actively involved in employment and retail land in the town.
5.2. CONSULTATION
Consultation was undertaken with the Council Economic Development Team as well as local real estate agents and landowners regarding local property market and business conditions, trends observed and drivers of demand for new development in the towns.
The following comments were made during consultation, noting that the comments have been paraphrased and grouped into logical sections for the purposes of this report.
LABOUR FORCE, EMPLOYMENT AND BUSINESS TRENDS
• Torquay has a large labour force catchment, which draws many workers from Geelong to Torquay for the hospitality employment provision. Conversely, many Torquay residents travel to Geelong for employment in office, health and education sectors.
• There is a high proportion of residents working form home, which is translating to an increased demand and provision of co-working spaces in the town. The conditions enforced during COVID-19 may be “fast-tracking” this trend.
• Council has noticed an ongoing trend of enquiries from creative and unique business sectors to locate in the West Coast Business Park, rather than strategic industrial or sub-regional business needs.
GENERAL MARKET CONDITIONS
• Population growth is the major driver of employment need and is expected to be very strong into the future. • The residential market in Torquay is primarily driven by higher income residents relocating from Melbourne. • The Torquay market seems to act within its own bubble and does not appear to react to the rest of the
residential market but is rather experiencing an isolated “boom”. • Many working residents that are relocating to Torquay are from Melbourne and have an interest in the surf
culture of the region. Many of these are professionals and trades people.
INDUSTRIAL TRENDS
• Property prices in the West Coast Business Park are high compared with Geelong and other industrial areas, meaning many businesses are looking elsewhere for more affordable lots. This is partially due to the constrained land supply and possible latent demand for industrial lots. A greater provision of industrial lots is required in Torquay.
• There is a single landowner of all future industrial land in the town, creating a monopoly on this land. Competition is required in the town for a healthy industrial property market and should be considered as a high priority.
• Many businesses buying into and occupying the West Coast Business Park are not typical of an industrial precinct, but are rather boutique businesses like gyms, boutique retailers and small construction related businesses. A number of these businesses include both production and retail elements, with the rise of online sales assisting this.

Torquay – Jan Juc Retail & Employment Land Strategy – Background Report
41
• The high prices have priced out businesses looking for larger lots. • Demand is strong for small factoryette (small factories / warehouses), with demand driven by small
construction related businesses or individual tradesmen who have outgrown their garages at home. The trend for these types of lots has been a growing trend in the precinct since 2015.
• In some cases, original lots created in the business park by subdivision have been purchased by investors and land banked until demand is sufficient to further subdivide into smaller lots (creating small factory and warehouse spaces).
RETAIL TRENDS
• A view was expressed that the current retail floorspace is sufficient to cater to current demand levels. • Although the Town Centre is the geographical centre of town, the precinct is underperforming and requires
major investment to improve traffic flow, parking and quality of public realm. • There has been some private sector redevelopment of land in the town centre, which is positive and creating
new floorspace, reinvestment and underground parking. • The structure and fragmented nature of the retail centres within Torquay has created a “soullessness”, leaving
the town without a core. • High rents in the Town Centre are contributing to higher rates of vacancy, as is the economic slow down
associated with the COVID pandemic. New office and retail spaces have been recently created and some have not been leased due to current business challenges. This is considered a short term challenge, however.
• Demand for surf retail in Surf City appears on a decreasing trend with more café, restaurants and bars locating there over the years.
• Expansion of the next stages at the West Coast Business Park may be holding land for a potential larger format retailer, such as a discount department store.
COMMERCIAL AND OFFICE TRENDS
• Office space has experienced strong growth in recent years, with a number of new developments providing offices that have been occupied by smaller service businesses such as legal, allied health, health, accounting and insurance businesses.
• Office floorspace absorption has slowed or stopped due to uncertain economic conditions, leaving a relatively high office vacancy rate, such as in some of the newer town centre developments indicating that office provision is currently sufficient within the town for the short-term.
• In other cases, micro-businesses have relocated back to dwellings and at-home operations. • There is some concern over amenity conflicts in residential areas if these micro-businesses do not relocate
to formal office spaces once they grow to a sufficient size. • There is a clear gap in health provision within the town. Although some medical facilities are provided, the
growth in health-related employment and the growing population triggers consideration of the need for a consolidated or planned health cluster. Recent permit applications at 85 Geelong Road and Cylinders Drive appear to be trying to address this gap.
• The town provides few entertainment facilities (outside of the tourism attractions) that take advantage of the natural features of the town. Both residents and visitors during the peak season may travel elsewhere for entertainment facilities (i.e. cinema) which could be provided in town.
• A current planning permit at 81 Geelong Road (the Horse Paddocks) is intending to address the apparent market gaps relating to health and entertainment.
• Consultees identified the opportunity to address unmet demand for visitor accommodation.
Torquay – Jan Juc Retail & Employment Land Strategy – Background Report
42
PLANNING ISSUES AND OPPORTUNITIES
• The planning zones applied to retail and employment centres in Torquay are too restrictive. The SUZ5 is an example of a zone that was appropriate at the time of being implemented and for the intended purpose, however there are now too many prohibited uses for current proposals.
• The SUZ5 in Torquay contains the only major strategic development site in the town. • The SUZ5 is not responding to the trends in the retail and commercial market at the moment. Needs to
consider and adapt to the changing demands to provide sufficient opportunity for development. • Design requirements, including setbacks, of lots in the West Coast Business Park lead to underutilisation of
land (50% site development) and are limiting the attractiveness of the area for some businesses. These requirements, including parking, are contributing to higher prices.
• Height restrictions in the Town Centre (when coupled with fragmented land ownership) are a major constraint to development. There is limited opportunity to increase the footprint of the centre, so to provide a net increase in available space, increased building heights and more upper-level development should be considered.
• Many existing businesses and developments in Torquay are restricted in their ability to expand footprints. There has also been difficulty in consolidating lots to facilitate major developments, particularly in the Town Centre. Consideration of increased building heights would provider greater incentives to developers.
• There was a general consensus that some planning zones and controls are restrictive and that there is an opportunity to review provisions to ensure investment and employment growth is encouraged and possible within existing zones designed for those purposes.
5.3. RETAIL TRENDS
Retail spending is a critical component of the economy, providing economic stimulus through direct expenditure. Despite steady employment growth across Melbourne and surrounding areas, household finances have come under pressure from stagnant wages growth and declining wealth, and this has reduced consumer sentiment and household’s inclination to spend, particularly on discretionary items such as retail.
Retail turnover growth slowed throughout the second half of 2018 and into 2019.4 Challenging retail conditions are forecast to continue throughout the remainder of 2019 and 2020. The biggest retail category improvers in recent years have been clothing, footwear and accessories, as well as cafes, restaurants and take away food, which maintained consistent growth as consumers continue to spend healthily on leisure and experience based retail such as dining out.
The number of major retailer defaults is on the rise in Australia, indicated by the announcement of major discount department store and department store closures such as Big W (closure of 30 stores), Target and David Jones (closure of select stores and a reduction in floorspace). Shopping centre owners and landlords are expected to look to repurpose vacant space into more service-based offerings such as gyms, fitness centres, hospitality, childcare and entertainment.5
Digital retailing is becoming more prevalent too. In 2018, the number of online purchases in Australia grew by over 20%.6 Despite the growth in online sales, 90% of retail transactions remain in-store, however the recent restrictions associated with the COVID-19 pandemic has created another short term spike in online purchases and has enabled many new customers to familiarise with the channel.
4 Australia Economic Outlook, Deloitte, 2019 5 Real Estate Market Outlook 2019, CBRE, 2019 6 Inside Australian Online Shopping, e-commerce industry report, Australia Post, 2019
Torquay – Jan Juc Retail & Employment Land Strategy – Background Report
43
With the growing prevalence of online retail activity, retailers are increasing their omnichannel retail strategy, enabling people to interact either in-store or online, on a multitude of devices.7 Some retail centres and strips are responding to online competition by seeking to improve the shopping “experience”, something that cannot be replicated online. This includes a greater focus on hospitality, entertainment and meeting places co-located with retailers.8
SURF AND LEISURE GOODS
Recent trends for Sport and Camping Retailing in Australia has indicated an annual decrease in revenue of 1.7% between 2015 and 2019, largely due to the falling household discretionary income, decreasing consumer sentiment and strong competition from online retailers. It is expected that consumer sentiment and household discretionary income will increase between 2020 and 2025, leading to a projected annual revenue growth of 1.3% over this period, however the COVID-19 pandemic will present short term challenges to that outlook. Water sport, snow sport and skating equipment accounts for 25% of Sport and Camping Retail, having grown significantly over the past 5 years to become the industry’s largest product segment.9
Given Torquay’s historic strength in the surf retail scene, the decline of discretionary income and spending on sport related retail presents a significant challenge. Additionally, there are a number of other apparel retailers in the Town Centre which will also be impacted by the broader industry trends. However, there continues to be strong expenditure at food retailers, which are beginning to locate in the West Coast Business Park, Surf City and Baines Crescent despite not being generally precincts for this type of use. Clear directions need to be in place to ensure that appropriate precincts such as the Town Centre continue to be lively with a healthy provision of growing industries and retail types that will capture this discretionary retail.
5.4. RESIDENTIAL DEVELOPMENT AND POPULATION GROWTH
The population of the Torquay SA2 is expected to increase by over 9,000 residents by 2036, which is likely to be the principal driver for retail and employment demand in Torquay.
The location and type of residential development will drive demand for retail and employment in particular spatial locations across the study area.
Figure 18 shows the location of residential lot construction between 2007 and 2018, showing the significant expansion north of the town. Additionally, there has been some development west of the town and ongoing infill development occurring in the established parts of the town.
7 Retail Trends: What is Digital’s Impact on the Retail Sector, PWC, 2017 8 Retail Trends: What is Digital’s Impact on the Retail Sector, PWC, 2017 9 IBISWorld Industry Report G4241 Sport and Camping Equipment Retailing in Australia, IbisWorld, November 2019

Torquay – Jan Juc Retail & Employment Land Strategy – Background Report
44
F18. RESIDENTIAL LOT CONSTRUCTION, 2007-2018
Source: Surf Coast Residential Land Supply & Demand Assessment, Spatial Economic 2018
Figure 19 identifies future residential development opportunities in Torquay, along with the expected timing for these lots to be developed. The majority of the known development sites are located in Torquay North, with the expected development timeframes being within 5 years. There are also some smaller opportunities to the west of the town.
Future potential residential development opportunities are identified in three locations, being Messmate Road, Horseshoe Bend Rd and Spring Creek. It is understood that there is some uncertainty regarding the future development prospects of Spring Creek. It is not clear whether further residential land will be identified as potential residential development areas elsewhere in the town.
As a result, the majority of future residential development opportunities are located to the north of the town. Planning for future retail and employment provision should consider the future direction and location of population growth.
F19. FUTURE RESIDENTIAL DEVELOPMENT AREAS
Source: Surf Coast Residential Land Supply & Demand Assessment, Spatial Economic 2018.
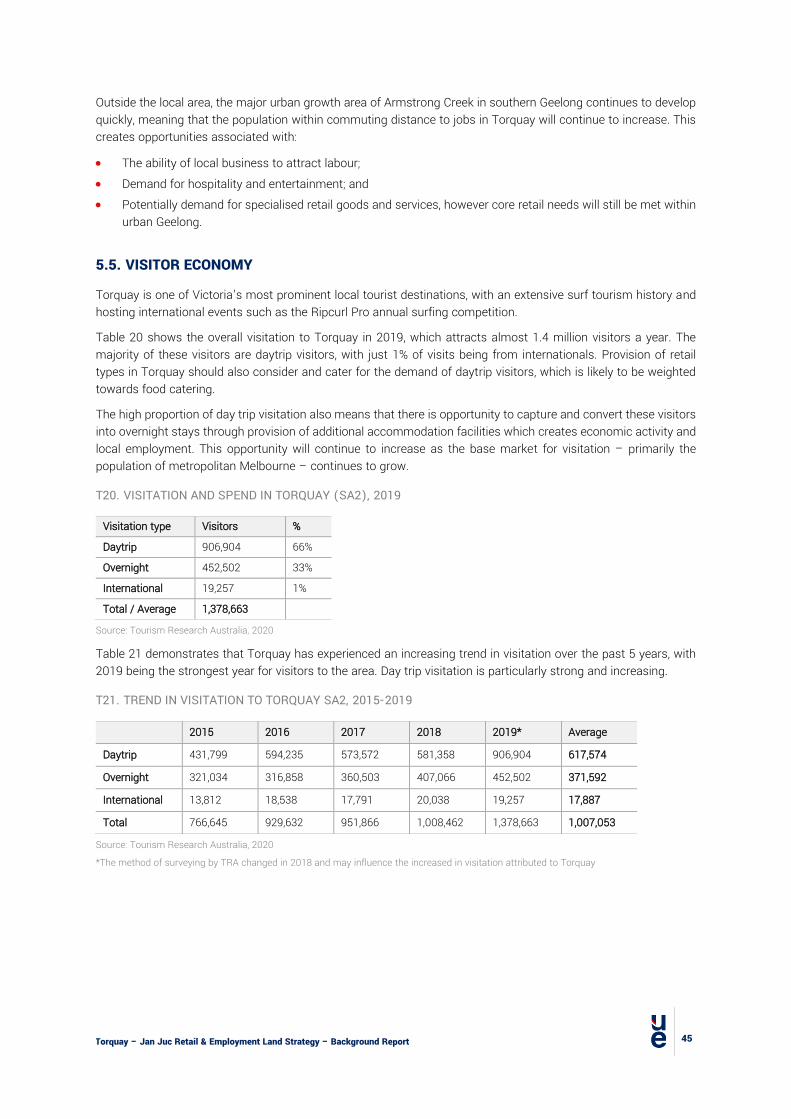
Torquay – Jan Juc Retail & Employment Land Strategy – Background Report
45
Outside the local area, the major urban growth area of Armstrong Creek in southern Geelong continues to develop quickly, meaning that the population within commuting distance to jobs in Torquay will continue to increase. This creates opportunities associated with:
• The ability of local business to attract labour; • Demand for hospitality and entertainment; and • Potentially demand for specialised retail goods and services, however core retail needs will still be met within
urban Geelong.
5.5. VISITOR ECONOMY
Torquay is one of Victoria’s most prominent local tourist destinations, with an extensive surf tourism history and hosting international events such as the Ripcurl Pro annual surfing competition.
Table 20 shows the overall visitation to Torquay in 2019, which attracts almost 1.4 million visitors a year. The majority of these visitors are daytrip visitors, with just 1% of visits being from internationals. Provision of retail types in Torquay should also consider and cater for the demand of daytrip visitors, which is likely to be weighted towards food catering.
The high proportion of day trip visitation also means that there is opportunity to capture and convert these visitors into overnight stays through provision of additional accommodation facilities which creates economic activity and local employment. This opportunity will continue to increase as the base market for visitation – primarily the population of metropolitan Melbourne – continues to grow.
T20. VISITATION AND SPEND IN TORQUAY (SA2), 2019
Visitation type Visitors %
Daytrip 906,904 66%
Overnight 452,502 33%
International 19,257 1%
Total / Average 1,378,663
Source: Tourism Research Australia, 2020
Table 21 demonstrates that Torquay has experienced an increasing trend in visitation over the past 5 years, with 2019 being the strongest year for visitors to the area. Day trip visitation is particularly strong and increasing.
T21. TREND IN VISITATION TO TORQUAY SA2, 2015-2019
2015 2016 2017 2018 2019* Average
Daytrip 431,799 594,235 573,572 581,358 906,904 617,574
Overnight 321,034 316,858 360,503 407,066 452,502 371,592
International 13,812 18,538 17,791 20,038 19,257 17,887
Total 766,645 929,632 951,866 1,008,462 1,378,663 1,007,053
Source: Tourism Research Australia, 2020
*The method of surveying by TRA changed in 2018 and may influence the increased in visitation attributed to Torquay

Torquay – Jan Juc Retail & Employment Land Strategy – Background Report
46
In 2019, 73% of daytrip and overnight visitation was generated by people living in Greater Melbourne. This demonstrates that the target market for capturing expenditure should be aimed at demographics from these areas.
Greater Melbourne is expected to accommodate an additional 4 million residents between 2018 and 2056. This strong population growth is likely to contribute to ongoing daytrip and overnight visitation to Torquay given the significance of Greater Melbourne’s proportion of the existing visitation market share.
T22. LOCATION OF TORQUAY VISITOR ORIGIN, 2019
Visitor type Origin Torquay Melbourne as % of Total visitors
Daytrip Greater Melbourne 696,714
77% All 906,904
Overnight Greater Melbourne 296,270
65% All 452,502
Both Greater Melbourne 992,984
73% All 1,359,406
Source: Tourism Research Australia, 2020.
Historically, a large proportion of the dwelling stock has been unoccupied dwellings, most of which are holiday homes for residents of metropolitan Melbourne. Table 23 shows the number and proportion of unoccupied dwellings in Torquay in 2011 and 2016. The overall number of unoccupied dwellings increased from 2,300 to nearly 2,500 over the five year period. However, due to the significant increase in permanent residents, there has been a decrease in the proportion of unoccupied dwellings.
This indicates that the area remains popular as a holiday home destination, alongside the strong growth in permanent residences.
T23. UNOCCUPIED DWELLINGS TORQUAY SA2, 2011 & 2016
Dwelling occupancy 2011 2016
Occupied Private Dwellings 5,222 6,198
Unoccupied Private Dwellings 2,303 2,497
Proportion Unoccupied 30.6% 28.7%
Source: ABS Census, 2011 & 2016.
5.6. IMPLICATIONS
The economic and employment role of Torquay is changing and is expected to continue to change based on the various trends summarised in this section.
The employment role of Torquay has traditionally been limited to a focus on local retail, services, light industrial, tourism and hospitality. The strong growth in population, changing economic circumstances and the attraction of a younger and skilled workforce to the town is resulting in new demand and opportunity for the economic and employment role of the town.
Key considerations include:
• Increasing professional workforce, driving demand and opportunities for office space and business services; • Ongoing growth in the local construction industry and workforce, • An emerging culture of small business creation and production of goods locally, especially in food and
beverage production. This should be supported as a point of difference, given that the town does not have a competitive advantage to accommodate larger industrial businesses which will seek locations in northern Geelong and metropolitan Melbourne.

Torquay – Jan Juc Retail & Employment Land Strategy – Background Report
47
• An ongoing association between the surf culture and the local economy, however the exit of major anchors of the Surf City precinct is resulting in changes in the way the surf culture manifests in economic opportunity and employment growth. The surf remains an attractor, however this is now prominent as an attractor of labour as well as an attractor of consumers and visitors.
• The growing population base and influx of young families is driving demand for a range of service-based business growth and employment opportunity, especially across health, community services, education, childcare, recreation and entertainment.
• Hospitality, entertainment and local employment opportunities – Given the growth in population and ongoing strength of tourism in the region, there is a major opportunity to increase the focus of the towns economy and retail offer to focus on hospitality and entertainment. This would serve the needs of both residents and visitors.
COVID-19 PANDEMIC
The impacts of the current COVID-19 pandemic and the associated restrictions raise a number of key considerations for planning in both the short and medium term in Torquay-Jan Juc. The following provides a summary of the key impacts and considerations for the town in the context of this project:
• Restrictions on movement have resulted in an increasing proportion of online retail expenditure, with demographics who were previously not exposed to online shopping now making purchases through these platforms. This is having, and will have, a significant short-term impact on bricks and mortar retailing.
• Movement restrictions and office closures has resulted in many working from home or remotely. Torquay already has a high proportion of jobs operating from home and recent trends have seen an increase in demand for co-working spaces. The pandemic may result in an increased demand for these spaces as a step change in how people work.
• Although all tourism sectors have been heavily impacted due to border closures, reduced movement of people and short term reductions in incomes for many people, Torquay is expected to be relatively resilient to the COVID-19 impacts on tourism visitation. This is because of the low proportion of international visitors and the strong connection to ‘local’ and holiday home visitors from Melbourne. The core visitation market remains available and accessible to Torquay.
• It is likely that there will be ongoing short-medium term impacts on major public gatherings, events and large format hospitality. This may result in impacts on the casual, hospitality labour force which is a significant sector in the town.
Although the short term and medium term economic impacts of the pandemic are expected to be significant, this strategy needs to apply a long term approach to planning for employment and retail needs. Therefore, the impacts described above are most relevant to the extent that they might become enduring or structural changes to the performance of the local economy.
Equally important is the need to ensure that the local economy and businesses are not restricted during the coming years of relative economic uncertainty, and that opportunities to develop, expand, innovate and create are facilitated wherever possible through planning policy.
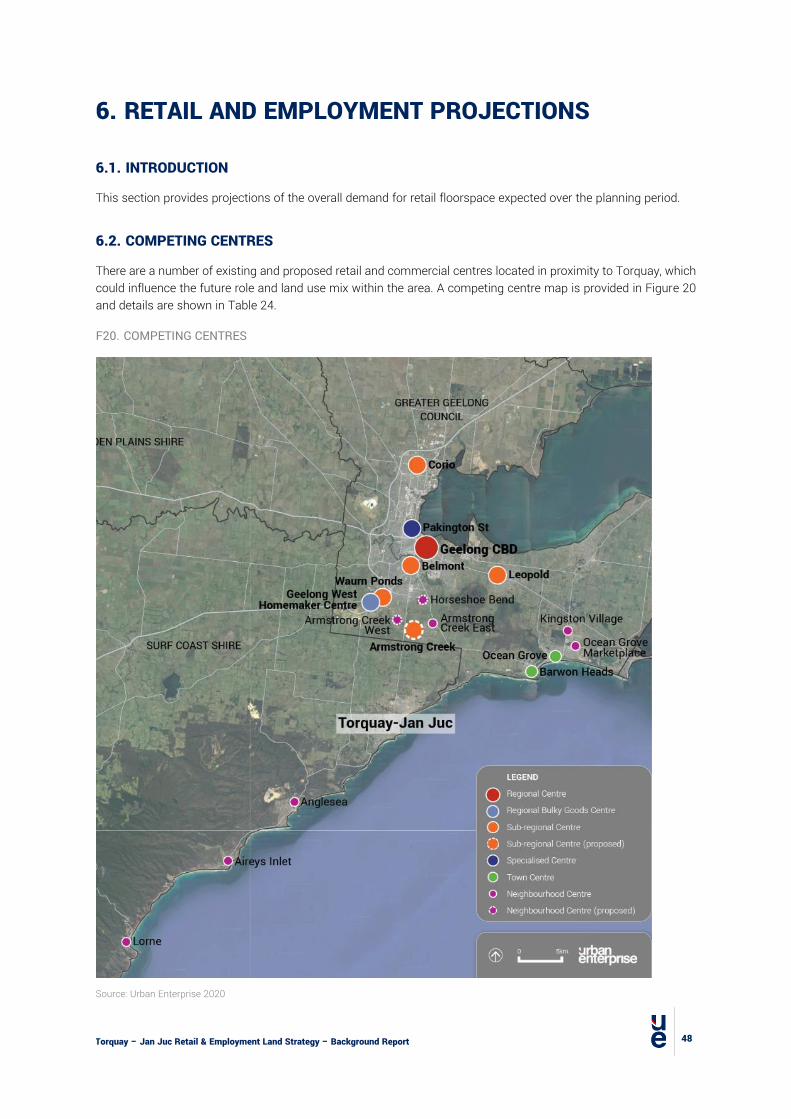
Torquay – Jan Juc Retail & Employment Land Strategy – Background Report
48
6. RETAIL AND EMPLOYMENT PROJECTIONS
6.1. INTRODUCTION
This section provides projections of the overall demand for retail floorspace expected over the planning period.
6.2. COMPETING CENTRES
There are a number of existing and proposed retail and commercial centres located in proximity to Torquay, which could influence the future role and land use mix within the area. A competing centre map is provided in Figure 20 and details are shown in Table 24.
F20. COMPETING CENTRES
Source: Urban Enterprise 2020
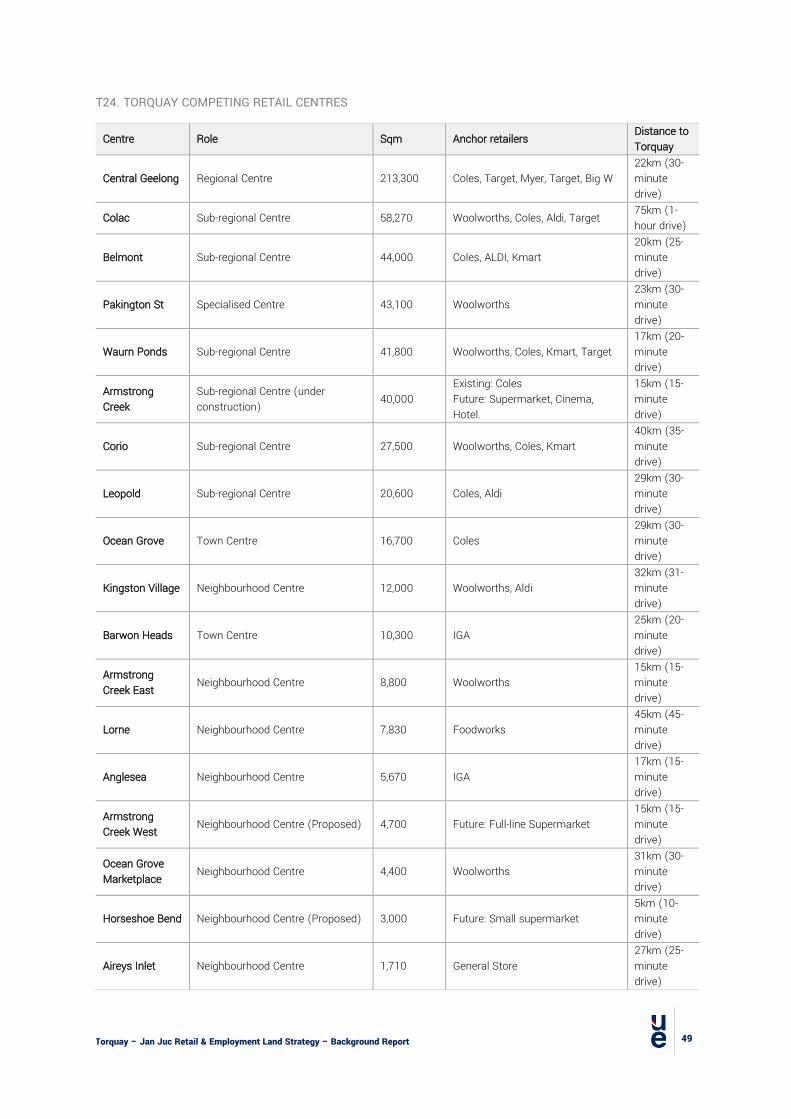
Torquay – Jan Juc Retail & Employment Land Strategy – Background Report
49
T24. TORQUAY COMPETING RETAIL CENTRES
Centre Role Sqm Anchor retailers Distance to Torquay
Central Geelong Regional Centre 213,300 Coles, Target, Myer, Target, Big W 22km (30-minute drive)
Colac Sub-regional Centre 58,270 Woolworths, Coles, Aldi, Target 75km (1-hour drive)
Belmont Sub-regional Centre 44,000 Coles, ALDI, Kmart 20km (25-minute drive)
Pakington St Specialised Centre 43,100 Woolworths 23km (30-minute drive)
Waurn Ponds Sub-regional Centre 41,800 Woolworths, Coles, Kmart, Target 17km (20-minute drive)
Armstrong Creek
Sub-regional Centre (under construction) 40,000
Existing: Coles Future: Supermarket, Cinema, Hotel.
15km (15-minute drive)
Corio Sub-regional Centre 27,500 Woolworths, Coles, Kmart 40km (35-minute drive)
Leopold Sub-regional Centre 20,600 Coles, Aldi 29km (30-minute drive)
Ocean Grove Town Centre 16,700 Coles 29km (30-minute drive)
Kingston Village Neighbourhood Centre 12,000 Woolworths, Aldi 32km (31-minute drive)
Barwon Heads Town Centre 10,300 IGA 25km (20-minute drive)
Armstrong Creek East
Neighbourhood Centre 8,800 Woolworths 15km (15-minute drive)
Lorne Neighbourhood Centre 7,830 Foodworks 45km (45-minute drive)
Anglesea Neighbourhood Centre 5,670 IGA 17km (15-minute drive)
Armstrong Creek West Neighbourhood Centre (Proposed) 4,700 Future: Full-line Supermarket
15km (15-minute drive)
Ocean Grove Marketplace Neighbourhood Centre 4,400 Woolworths
31km (30-minute drive)
Horseshoe Bend Neighbourhood Centre (Proposed) 3,000 Future: Small supermarket 5km (10-minute drive)
Aireys Inlet Neighbourhood Centre 1,710 General Store 27km (25-minute drive)

Torquay – Jan Juc Retail & Employment Land Strategy – Background Report
50
Source: Urban Enterprise 2020.
Based on the location and scale of competing centres, the following observations are made:
• Geelong will continue to serve the role of a large regional centre, with significant retail and commercial floorspace in relatively close proximity to Torquay. The city’s core includes higher order retail provision and entertainment facilities which will continue to attract visitation and expenditure from Torquay. The Geelong CBD is a business district with a high concentration of office jobs and other employment;
• There is an extensive network of sub-regional and neighbourhood retail centres throughout suburban Geelong meaning that retail services are readily accessible.
• Waurn Ponds provides a sub-regional centre, providing higher order and entertainment facilities, along with a Regional Bulky Goods Centre. The co-location of these facilities will continue to provide strong competition to Torquay and has capacity for future expansion.
• The development of a sub-regional centre in Armstrong Creek will increase the prospect of Torquay resident expenditure being attracted into this part of Geelong. The growth area is expected to experience significant population growth over the next 20 years, with the vast majority of the growth area expected to be developed by 2031, within the planning period for this strategy. The sub-regional centre is proposed to include discount department stores and a wide range of retail, hospitality, entertainment, accommodation, services, bulky goods and employment. Direct competition with this centre should be carefully considered.
• A network of neighbourhood centres in Armstrong Creek West, East and Horseshoe Bend Precincts will serve a neighbourhood role to support the local population. These are not expected to include any substantial employment or larger format retail uses; and
• The neighbourhood centres in the tourist towns of Anglesea, Aireys Inlet and Lorne are unlikely to create significant competition for Torquay in the future due to their focus on local residents and holiday-makers and the lack of spatial opportunity to expand.
6.3. RETAIL CATCHMENT AND POPULATION
A retail catchment has been adopted for the purpose of projecting supportable retail floorspace – the catchment is shown in Figure 21. The catchment is based on analysis of competing centres and current retail role and offer of Torquay and includes:
• A Primary Catchment – Torquay SA2; • A Secondary South Catchment – Lorne-Anglesea SA2; and • A Secondary North Catchment – Winchelsea SA2.
Together, these catchment areas form the Main Trade Area (MTA) for Torquay.

Torquay – Jan Juc Retail & Employment Land Strategy – Background Report
51
F21. RETAIL CATCHMENT AREAS
Source: Urban Enterprise, 2020
Table 25 shows the population projections for each catchment and the MTA. There is expected to be an additional 11,800 new residents between 2019 and 2036, of which 10,300 are expected to be located within the Primary Catchment. Strong growth is projected in the Primary Catchment, with low growth in the secondary catchments.
T25. POPULATION PROJECTIONS, 2019-2036
Catchment 2019 2021 2026 2031 2036 Change 2019-36
# AAGR Primary Catchment 21,766 22,905 26,503 29,879 32,068 10,302 2.3% Secondary South Catchment 5,444 5,521 5,695 5,870 6,029 585 0.6% Secondary North Catchment 5,952 6,098 6,363 6,627 6,887 935 0.9% Main Trade Area 33,162 34,524 38,561 42,376 44,984 11,822 1.8%
Source: Victoria In Future 2019
6.4. EXPENDITURE
Retail expenditure of catchment residents has been using Marketinfo, an industry standard resource which uses micro-simulation to estimate expenditure of residents based on a range of demographic variables.
As shown in Table 26, it is estimated that residents of the primary catchment have an average annul retail expenditure of just over $15,000 per person. The Secondary South Catchment has a much higher per person retail expenditure, while the Secondary North Catchment is lower but similar to that of the Primary Catchment.
Based on the 2019 population and retail expenditure rates, it is estimated that the catchment spends more than $500 million per annum on retail goods and services, as shown in Table 27.
Torquay – Jan Juc Retail & Employment Land Strategy – Background Report
52
T26. RETAIL EXPENDITURE PER PERSON, 2019 DOLLARS
Retail Category Primary Secondary South Secondary North
Food, Liquor and Groceries $6,768 $7,338 $7,058
Food Catering $1,873 $1,937 $1,781
Apparel, Homewares and Leisure $4,015 $4,327 $3,819
Bulky Goods $1,872 $1,897 $1,764
Retail Services $563 $628 $532
Total $15,091 $16,127 $14,954
Source: MarketInfo, 2016; Urban Enterprise, 2020
T27. TOTAL RETAIL EXPENDITURE, 2019 DOLLARS
Catchment Population Expenditure pp Total Expenditure Primary Catchment 21,766 $15,091 $328,462,040 Secondary South Catchment 5,444 $16,127 $87,793,971 Secondary North Catchment 5,952 $14,954 $89,004,851 Total 33,162 $15,236 $505,260,861
Source: MarketInfo, 2016; Urban Enterprise, 2020
6.5. EXISTING TURNOVER AND MARKET SHARES
Table 28 shows the estimate of existing retail floorspace in the Torquay-Jan Juc area and their approximate turnover based on the turnover densities shown.
As a broad estimate, retailers in the study area are estimated to have a combined turnover in the order of $318 million per annum.
T28. RETAIL FLOORSPACE AND TURNOVER, TORQUAY-JAN JUC
Retail Category Floorspace Turnover Density Turnover
Supermarket 13,648 $9,000 $122,800,000
Other FLG 1,577 $8,000 $12,600,000
Food Catering 11,667 $6,000 $70,000,000
Apparel, Homewares and Leisure 12,010 $5,500 $66,100,000
Bulky Goods 10,299 $3,000 $30,900,000
Retail Services 2,981 $4,500 $13,400,000
Retail Unclassified 525 $4,500 $2,400,000
Total 52,707 $6,000 $318,200,000
Source: MarketInfo, Urban Enterprise.
VISITOR TRADE
As discussed earlier, tourism and visitation to the region is an important factor to consider for Torquay’s retail and employment role. Over the past 5 years (2015-2019), Torquay has averaged more than 1 million individual visitors per annum.
Table 29 shows that this visitation to Torquay has resulted in an estimated $110 million retail spend per annum. Overnight visitors generate the greatest share of retail expenditure (including holiday homes visitors and those using commercial accommodation), closely followed by day trip visitors.
Torquay – Jan Juc Retail & Employment Land Strategy – Background Report
53
This analysis reinforces the importance of tourism visitation to the town’s retail economy and highlights the ongoing opportunity associated with providing visitor accommodation and services and activities that meet the needs of visitors.
T29. VISITOR RETAIL EXPENDITURE, TORQUAY (SA2)
Visitor type Average Visitor days / nights (2017-2019)1
Average expenditure per day / night 2 Total Spend
% spent on retail3 Retail Spend
Daytrip 687,278 $99 $68,040,544 65% $44,300,000
Overnight 909,358 $147 $133,675,660 45% $60,200,000
International 123,530 $109 $13,464,803 40% $5,500,000
Total $215,181,006 $110,000,000
Sources: 1. TRA. 2. Surf Coast Visitor Insights 2019. 3. Regional Victorian expenditure Data, Tourism Victoria, 2017-2019.
MARKET SHARE
Table 30 shows a summary of the estimated market shares of the Torquay retail sales to residents of the various catchments and to visitors. It is estimated that:
• Torquay-Jan Juc retailers capture 41% of the available expenditure in the catchment, including 55% of the Primary Trade Area spending. This means that 59% of the trade area resident spending occurs in other parts of the region, primarily Geelong and metropolitan Melbourne.
• Approximately 35% of sales are to visitors, a lower proportion (but higher volume) than the previous assessment in 2010 of 43%.
• Torquay also captures an estimate 21% of the spending from Secondary South catchment and 10% of the spending of the Secondary North catchment.
T30. RETAIL MARKET SHARES
Summary table Expenditure Turnover Market Share
Turnover from catchment residents $505,300,000 $208,000,000 41%
Primary catchment $328,500,000 $180,700,000 55%
Secondary South Catchment $87,800,000 $18,400,000 21%
Secondary North Catchment $89,000,000 $8,900,000 10%
Turnover drawn from outside catchment $110,200,000 35%
Torquay Retailers Annual Turnover $318,200,000
Source: Urban Enterprise, 2020.
Previous assessments by Essential Economics (2005) and Tim Nott (2011) estimate that the escape expenditure is in the order of 41% and 48% respectively. Although, the escape expenditure in this assessment shows another minor increase, this is largely due to the increased catchment to include a broader area in the Secondary North Catchment (Winchelsea), which was not included in the catchments of the previous assessments.
6.6. SUPPORTABLE FLOORSPACE GROWTH
A model of supportable floorspace growth in the study area over the period 2019 – 2036 has been prepared as a guide to the scale of retail floorspace growth that Council should be planning to accommodate over the period. The model results are shown in Table 31.
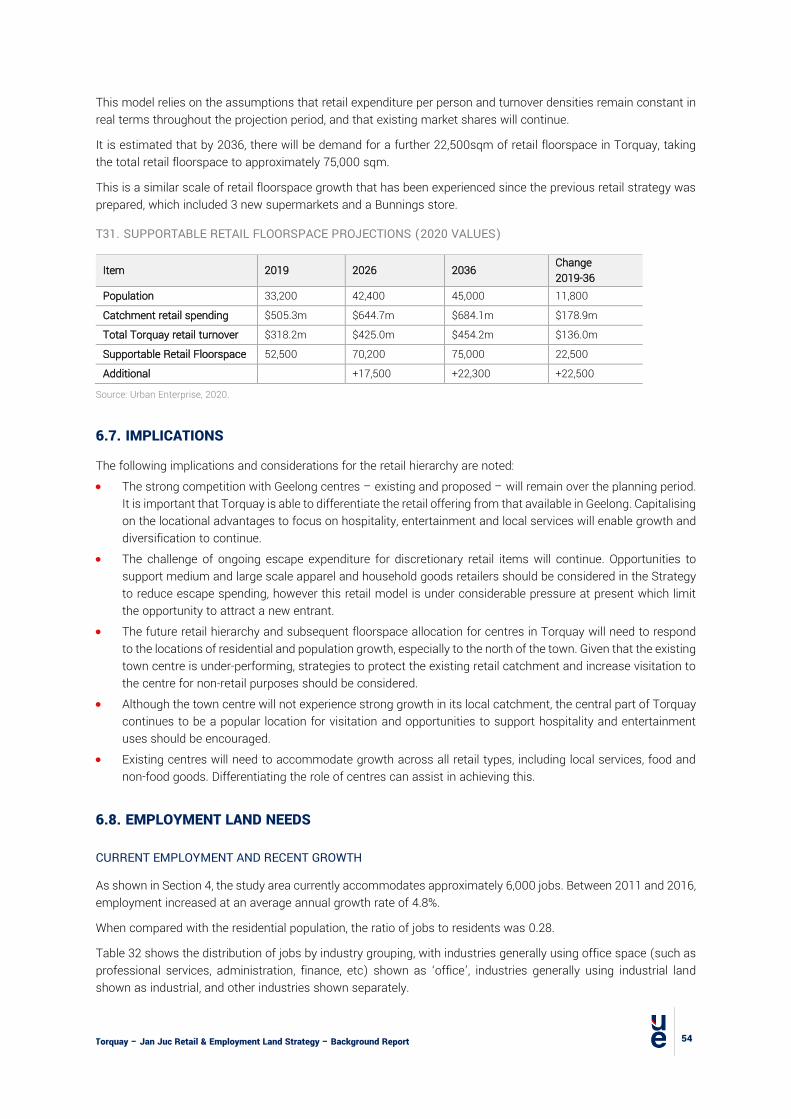
Torquay – Jan Juc Retail & Employment Land Strategy – Background Report
54
This model relies on the assumptions that retail expenditure per person and turnover densities remain constant in real terms throughout the projection period, and that existing market shares will continue.
It is estimated that by 2036, there will be demand for a further 22,500sqm of retail floorspace in Torquay, taking the total retail floorspace to approximately 75,000 sqm.
This is a similar scale of retail floorspace growth that has been experienced since the previous retail strategy was prepared, which included 3 new supermarkets and a Bunnings store.
T31. SUPPORTABLE RETAIL FLOORSPACE PROJECTIONS (2020 VALUES)
Item 2019 2026 2036 Change 2019-36
Population 33,200 42,400 45,000 11,800
Catchment retail spending $505.3m $644.7m $684.1m $178.9m Total Torquay retail turnover $318.2m $425.0m $454.2m $136.0m Supportable Retail Floorspace 52,500 70,200 75,000 22,500
Additional +17,500 +22,300 +22,500
Source: Urban Enterprise, 2020.
6.7. IMPLICATIONS
The following implications and considerations for the retail hierarchy are noted: • The strong competition with Geelong centres – existing and proposed – will remain over the planning period.
It is important that Torquay is able to differentiate the retail offering from that available in Geelong. Capitalising on the locational advantages to focus on hospitality, entertainment and local services will enable growth and diversification to continue.
• The challenge of ongoing escape expenditure for discretionary retail items will continue. Opportunities to support medium and large scale apparel and household goods retailers should be considered in the Strategy to reduce escape spending, however this retail model is under considerable pressure at present which limit the opportunity to attract a new entrant.
• The future retail hierarchy and subsequent floorspace allocation for centres in Torquay will need to respond to the locations of residential and population growth, especially to the north of the town. Given that the existing town centre is under-performing, strategies to protect the existing retail catchment and increase visitation to the centre for non-retail purposes should be considered.
• Although the town centre will not experience strong growth in its local catchment, the central part of Torquay continues to be a popular location for visitation and opportunities to support hospitality and entertainment uses should be encouraged.
• Existing centres will need to accommodate growth across all retail types, including local services, food and non-food goods. Differentiating the role of centres can assist in achieving this.
6.8. EMPLOYMENT LAND NEEDS
CURRENT EMPLOYMENT AND RECENT GROWTH
As shown in Section 4, the study area currently accommodates approximately 6,000 jobs. Between 2011 and 2016, employment increased at an average annual growth rate of 4.8%.
When compared with the residential population, the ratio of jobs to residents was 0.28.
Table 32 shows the distribution of jobs by industry grouping, with industries generally using office space (such as professional services, administration, finance, etc) shown as ‘office’, industries generally using industrial land shown as industrial, and other industries shown separately.
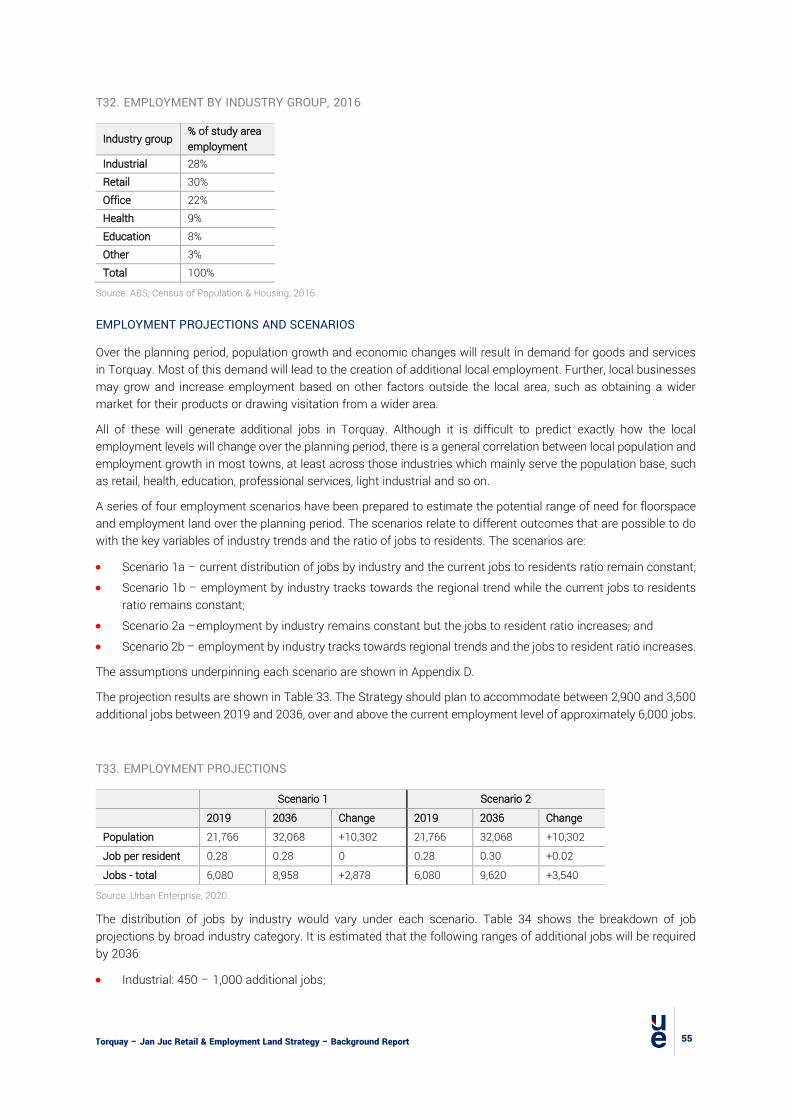
Torquay – Jan Juc Retail & Employment Land Strategy – Background Report
55
T32. EMPLOYMENT BY INDUSTRY GROUP, 2016
Industry group % of study area employment
Industrial 28% Retail 30% Office 22% Health 9% Education 8% Other 3% Total 100%
Source: ABS, Census of Population & Housing, 2016.
EMPLOYMENT PROJECTIONS AND SCENARIOS
Over the planning period, population growth and economic changes will result in demand for goods and services in Torquay. Most of this demand will lead to the creation of additional local employment. Further, local businesses may grow and increase employment based on other factors outside the local area, such as obtaining a wider market for their products or drawing visitation from a wider area.
All of these will generate additional jobs in Torquay. Although it is difficult to predict exactly how the local employment levels will change over the planning period, there is a general correlation between local population and employment growth in most towns, at least across those industries which mainly serve the population base, such as retail, health, education, professional services, light industrial and so on.
A series of four employment scenarios have been prepared to estimate the potential range of need for floorspace and employment land over the planning period. The scenarios relate to different outcomes that are possible to do with the key variables of industry trends and the ratio of jobs to residents. The scenarios are:
• Scenario 1a – current distribution of jobs by industry and the current jobs to residents ratio remain constant; • Scenario 1b – employment by industry tracks towards the regional trend while the current jobs to residents
ratio remains constant; • Scenario 2a –employment by industry remains constant but the jobs to resident ratio increases; and • Scenario 2b – employment by industry tracks towards regional trends and the jobs to resident ratio increases.
The assumptions underpinning each scenario are shown in Appendix D.
The projection results are shown in Table 33. The Strategy should plan to accommodate between 2,900 and 3,500 additional jobs between 2019 and 2036, over and above the current employment level of approximately 6,000 jobs.
T33. EMPLOYMENT PROJECTIONS
Scenario 1 Scenario 2 2019 2036 Change 2019 2036 Change Population 21,766 32,068 +10,302 21,766 32,068 +10,302 Job per resident 0.28 0.28 0 0.28 0.30 +0.02 Jobs - total 6,080 8,958 +2,878 6,080 9,620 +3,540
Source: Urban Enterprise, 2020.
The distribution of jobs by industry would vary under each scenario. Table 34 shows the breakdown of job projections by broad industry category. It is estimated that the following ranges of additional jobs will be required by 2036:
• Industrial: 450 – 1,000 additional jobs;
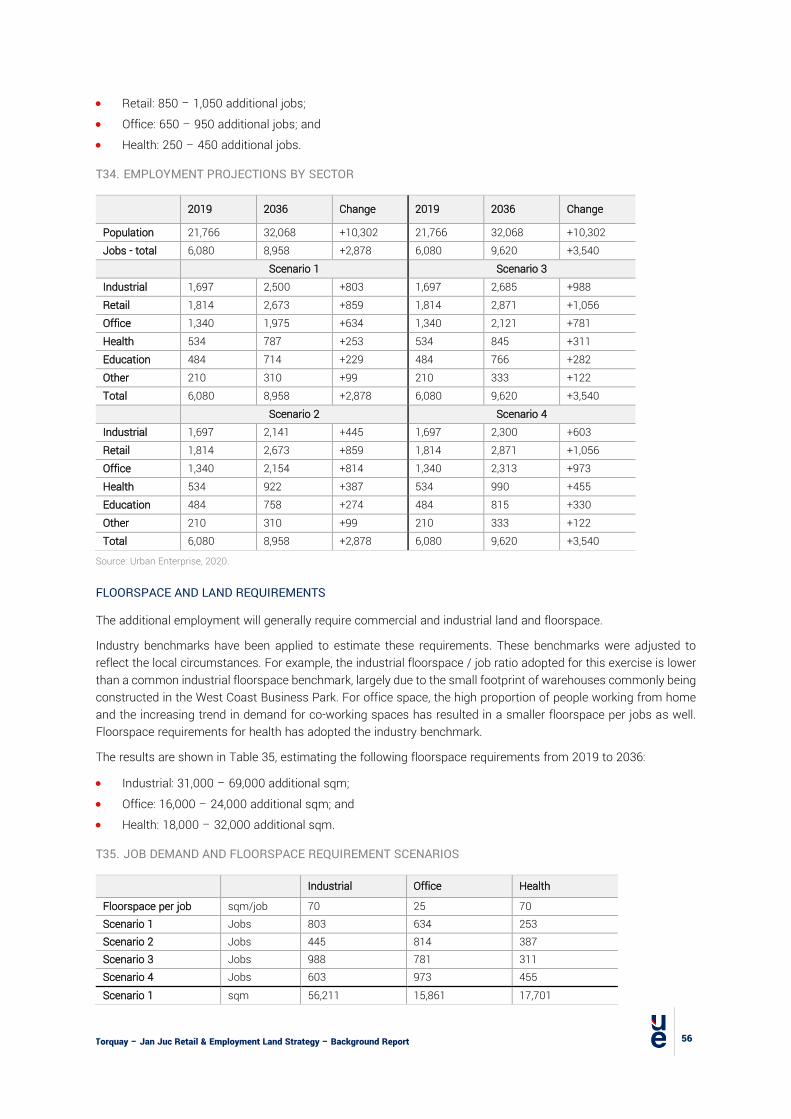
Torquay – Jan Juc Retail & Employment Land Strategy – Background Report
56
• Retail: 850 – 1,050 additional jobs; • Office: 650 – 950 additional jobs; and • Health: 250 – 450 additional jobs.
T34. EMPLOYMENT PROJECTIONS BY SECTOR
2019 2036 Change 2019 2036 Change
Population 21,766 32,068 +10,302 21,766 32,068 +10,302 Jobs - total 6,080 8,958 +2,878 6,080 9,620 +3,540 Scenario 1 Scenario 3 Industrial 1,697 2,500 +803 1,697 2,685 +988 Retail 1,814 2,673 +859 1,814 2,871 +1,056 Office 1,340 1,975 +634 1,340 2,121 +781 Health 534 787 +253 534 845 +311 Education 484 714 +229 484 766 +282 Other 210 310 +99 210 333 +122 Total 6,080 8,958 +2,878 6,080 9,620 +3,540 Scenario 2 Scenario 4 Industrial 1,697 2,141 +445 1,697 2,300 +603 Retail 1,814 2,673 +859 1,814 2,871 +1,056 Office 1,340 2,154 +814 1,340 2,313 +973 Health 534 922 +387 534 990 +455 Education 484 758 +274 484 815 +330 Other 210 310 +99 210 333 +122 Total 6,080 8,958 +2,878 6,080 9,620 +3,540
Source: Urban Enterprise, 2020.
FLOORSPACE AND LAND REQUIREMENTS
The additional employment will generally require commercial and industrial land and floorspace.
Industry benchmarks have been applied to estimate these requirements. These benchmarks were adjusted to reflect the local circumstances. For example, the industrial floorspace / job ratio adopted for this exercise is lower than a common industrial floorspace benchmark, largely due to the small footprint of warehouses commonly being constructed in the West Coast Business Park. For office space, the high proportion of people working from home and the increasing trend in demand for co-working spaces has resulted in a smaller floorspace per jobs as well. Floorspace requirements for health has adopted the industry benchmark.
The results are shown in Table 35, estimating the following floorspace requirements from 2019 to 2036:
• Industrial: 31,000 – 69,000 additional sqm; • Office: 16,000 – 24,000 additional sqm; and • Health: 18,000 – 32,000 additional sqm.
T35. JOB DEMAND AND FLOORSPACE REQUIREMENT SCENARIOS
Industrial Office Health
Floorspace per job sqm/job 70 25 70 Scenario 1 Jobs 803 634 253 Scenario 2 Jobs 445 814 387 Scenario 3 Jobs 988 781 311 Scenario 4 Jobs 603 973 455 Scenario 1 sqm 56,211 15,861 17,701
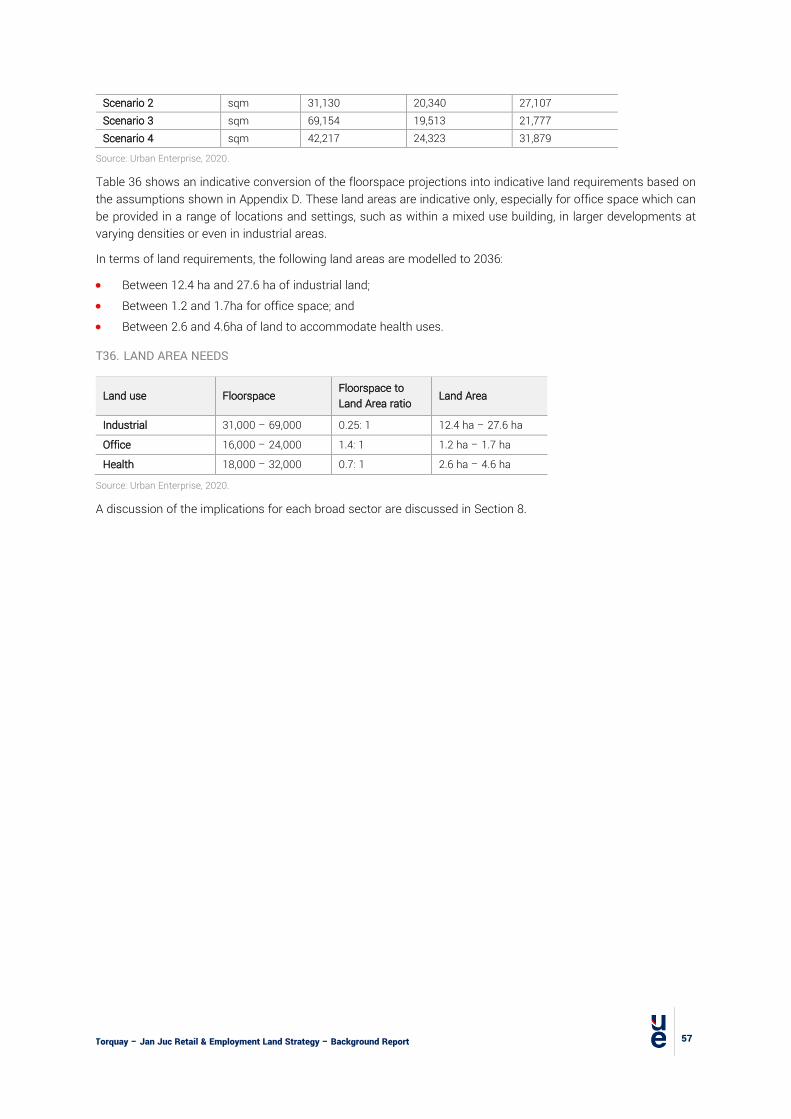
Torquay – Jan Juc Retail & Employment Land Strategy – Background Report
57
Scenario 2 sqm 31,130 20,340 27,107 Scenario 3 sqm 69,154 19,513 21,777 Scenario 4 sqm 42,217 24,323 31,879
Source: Urban Enterprise, 2020.
Table 36 shows an indicative conversion of the floorspace projections into indicative land requirements based on the assumptions shown in Appendix D. These land areas are indicative only, especially for office space which can be provided in a range of locations and settings, such as within a mixed use building, in larger developments at varying densities or even in industrial areas.
In terms of land requirements, the following land areas are modelled to 2036:
• Between 12.4 ha and 27.6 ha of industrial land; • Between 1.2 and 1.7ha for office space; and • Between 2.6 and 4.6ha of land to accommodate health uses.
T36. LAND AREA NEEDS
Land use Floorspace Floorspace to Land Area ratio Land Area
Industrial 31,000 – 69,000 0.25: 1 12.4 ha – 27.6 ha
Office 16,000 – 24,000 1.4: 1 1.2 ha – 1.7 ha
Health 18,000 – 32,000 0.7: 1 2.6 ha – 4.6 ha
Source: Urban Enterprise, 2020.
A discussion of the implications for each broad sector are discussed in Section 8.
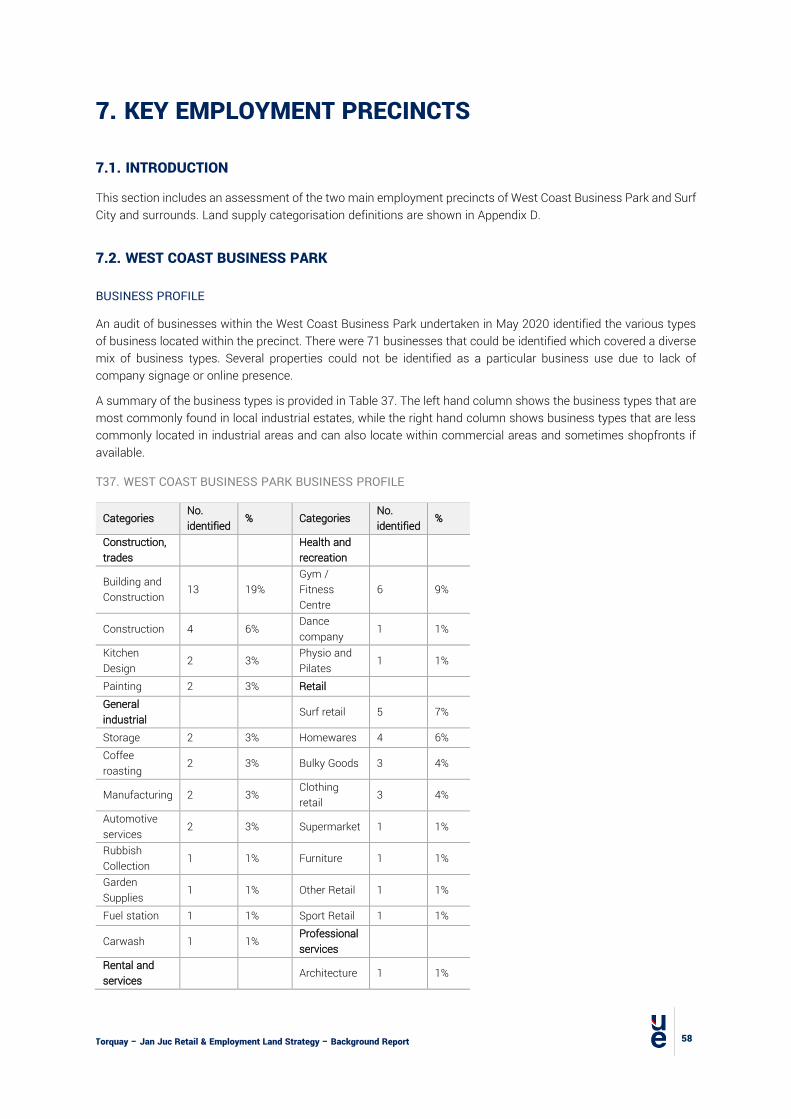
Torquay – Jan Juc Retail & Employment Land Strategy – Background Report
58
7. KEY EMPLOYMENT PRECINCTS
7.1. INTRODUCTION
This section includes an assessment of the two main employment precincts of West Coast Business Park and Surf City and surrounds. Land supply categorisation definitions are shown in Appendix D.
7.2. WEST COAST BUSINESS PARK
BUSINESS PROFILE
An audit of businesses within the West Coast Business Park undertaken in May 2020 identified the various types of business located within the precinct. There were 71 businesses that could be identified which covered a diverse mix of business types. Several properties could not be identified as a particular business use due to lack of company signage or online presence.
A summary of the business types is provided in Table 37. The left hand column shows the business types that are most commonly found in local industrial estates, while the right hand column shows business types that are less commonly located in industrial areas and can also locate within commercial areas and sometimes shopfronts if available.
T37. WEST COAST BUSINESS PARK BUSINESS PROFILE
Categories No. identified % Categories No.
identified %
Construction, trades
Health and recreation
Building and Construction 13 19%
Gym / Fitness Centre
6 9%
Construction 4 6% Dance company 1 1%
Kitchen Design 2 3% Physio and
Pilates 1 1%
Painting 2 3% Retail General industrial
Surf retail 5 7%
Storage 2 3% Homewares 4 6% Coffee roasting 2 3% Bulky Goods 3 4%
Manufacturing 2 3% Clothing retail 3 4%
Automotive services 2 3% Supermarket 1 1%
Rubbish Collection 1 1% Furniture 1 1%
Garden Supplies
1 1% Other Retail 1 1%
Fuel station 1 1% Sport Retail 1 1%
Carwash 1 1% Professional services
Rental and services Architecture 1 1%
Torquay – Jan Juc Retail & Employment Land Strategy – Background Report
59
Equipment rental 1 1% Nutrition 1 1%
Laundrette 1 1% Management Services 1 1%
Party Hire 1 1% Office 1 1%
Graphic Designer 2 3%
Total 69 100%
Source: Urban Enterprise, 2020.
Building and construction businesses make up the largest share (19%) within the precinct, while Gyms and Fitness Centres (9%) and Surf Retail/Manufacturing businesses (7%) also have a significant presence in the business park.
Other key business types include food manufacturing, sport and recreation and homewares, which all make up about 8% of businesses in the precinct. There are multiple automotive services and rental equipment businesses, along with an ALDI supermarket and Bunnings.
While Building and Construction represent the largest portion of the business mix, many of these businesses are small trade groups, occupying small warehouses for storage of equipment but largely operate off-site. Consultation with estate agents and local landowners suggests that there is significant demand generated for ‘factoryette’ spaces due to many tradesmen outgrowing the garage at their home. This observation is supported by a site visit to the precinct, which identified a number of small, trade-related businesses within the Building and Construction sector. It should also be noted that The Hub website (development including 42 factoryettes) targets “local tradies” who “have outgrown [their] current premises or home garage” as purchasers for factoryettes.
Further observation that is reflected in the business mix is the significant and diverse range of small and unique business types. Many of these appear to be start-ups operating in a niche market. Further, it was also noticeable that a number of warehouse spaces appeared to sub-lease spaces within the office and warehouse unit, which means there may be further businesses operating within the precinct that have not been captured by the audit.
In this sense, the business mix and profile of the precinct is relatively unique. The high proportion of individual tradesman, Surf Retail, Urban Food Manufacturing as well as Sport and Recreation businesses distinguish this precinct from a typical industrial precinct, which would commonly include a higher proportion of Automotive Services, Manufacturing, trade supplies, workshops , storage and equipment rental businesses.
LAND SUPPLY
All land in the WBP is in the Industrial 3 Zone. The extent of available land was assessed based on an audit and a review of aerial photography current as of May 2020.
There is a total of 22.88 ha of zoned lot area (excluding roads) in the WBP. Approximately 10.55 ha of the land supply in the precinct is vacant, 4.1 ha of which was only recently rezoned in 2019.
Figure 22 shows the location of all vacant land in the precinct at the time of this audit. Although some lots remain in completed stages of subdivision, the majority of the land is in the southern section and the recently rezoned land to the west of the developed section.

Torquay – Jan Juc Retail & Employment Land Strategy – Background Report
60
F22. VACANT LAND, WEST COAST BUSINESS PARK 2020
Source: Urban Enterprise, May 2020.
DEVELOPMENT PROGRESS
The following timeline indicates how the WBP has been developed:
• The majority of the existing zoned land was zoned in July 2004 (Amendment C6); • Minor additions were zoned in March 2008 (C41); • Further additions (4ha) were zoned in April 2019 (C118). • Early stages of subdivision commenced around 2008 following C41. • Further subdivision stages have occurred in 2012, 2014 and 2016.
Table 38 summarises planning permits issued for subdivisions in the precinct since 2011. Most permits have been for small subdivisions creating less than 5 additional lots. Four permits have created more than 10 additional lots during this time, occurring in June 2012, December 2014, September 2017 and November 2018.
Apart from the 72 lot subdivision approved in November 2018, the precinct has been developed in small stages over a period of 8-9 years.
T38. SUBDIVISION PERMITS APPROVED, WEST COAST BUSINESS PARK 2011-2020
Approval Date Permit Description Net Lots Created
14-Dec-11 Three lot subdivision 1
23-May-12 Two lot subdivision 2
08-Jun-12 Eighteen lot subdivision 17
26-Feb-14 Construction of 7 factory units and subdivision of the land into 7 lots
6
05-Sep-14 Use and development of the land for a store; subdivision of the land into two lots 1
24-Sep-14 Three lot subdivision 2
12-Dec-14 Fourteen lot staged subdivision 13
25-Feb-15 Two lot subdivision of existing buildings 1
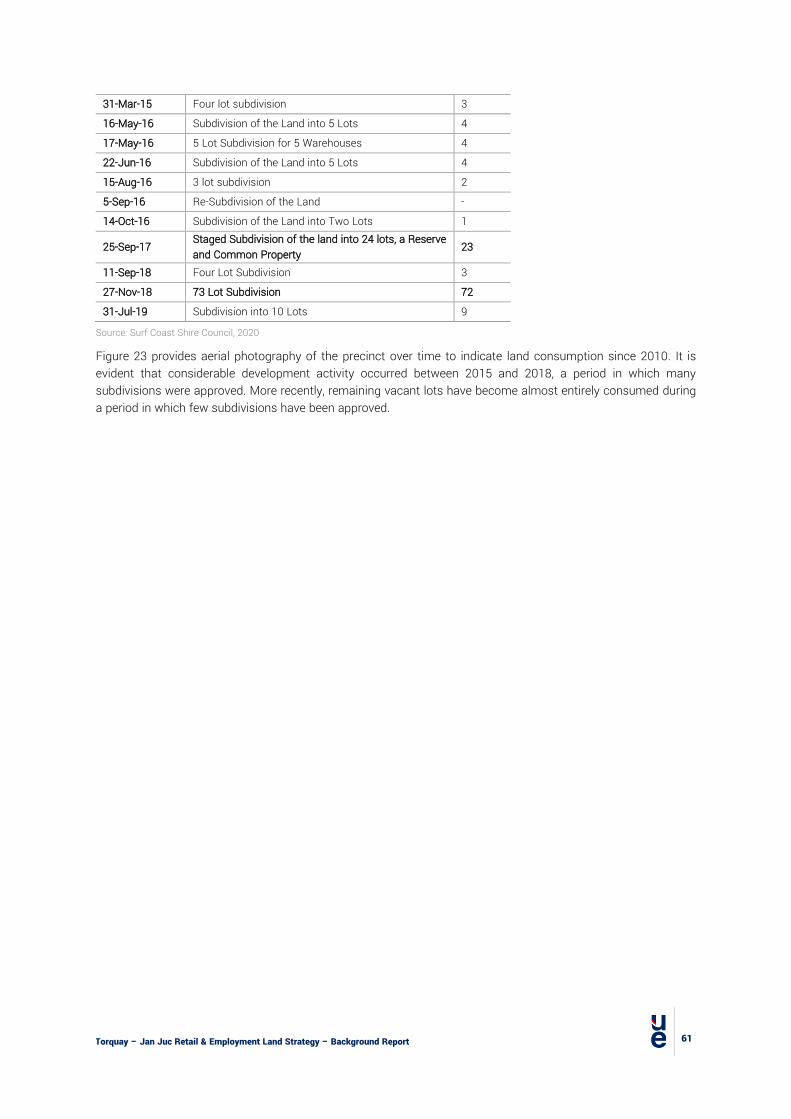
Torquay – Jan Juc Retail & Employment Land Strategy – Background Report
61
31-Mar-15 Four lot subdivision 3
16-May-16 Subdivision of the Land into 5 Lots 4
17-May-16 5 Lot Subdivision for 5 Warehouses 4
22-Jun-16 Subdivision of the Land into 5 Lots 4
15-Aug-16 3 lot subdivision 2
5-Sep-16 Re-Subdivision of the Land -
14-Oct-16 Subdivision of the Land into Two Lots 1
25-Sep-17 Staged Subdivision of the land into 24 lots, a Reserve and Common Property 23
11-Sep-18 Four Lot Subdivision 3
27-Nov-18 73 Lot Subdivision 72
31-Jul-19 Subdivision into 10 Lots 9
Source: Surf Coast Shire Council, 2020
Figure 23 provides aerial photography of the precinct over time to indicate land consumption since 2010. It is evident that considerable development activity occurred between 2015 and 2018, a period in which many subdivisions were approved. More recently, remaining vacant lots have become almost entirely consumed during a period in which few subdivisions have been approved.

Torquay – Jan Juc Retail & Employment Land Strategy – Background Report
62
F23. LAND CONSUMPTION
Source: Nearmap, 2020.
PROPERTY PRICES
Analysis of the existing real estate market at West Coast Business Park, in comparison to Geelong, indicates relatively high property values in the precinct.
Table 39 provides a summary of listed property in the precinct as of May 2020 according to online listings. The asking price per sqm ranges from $2,200 to $3,400. This is generally consistent with the Valuer General’s report on median industrial land values for sales in Surf Coast Shire in 2018 (from $1,400 to $2,500/sqm), but higher than Greater Geelong’s median of 780 and $2,100.
Table 40 shows properties currently listed for lease in the precinct, indicating an asking lease price per sqm of between $168 and $200, with an average of $188 per sqm.
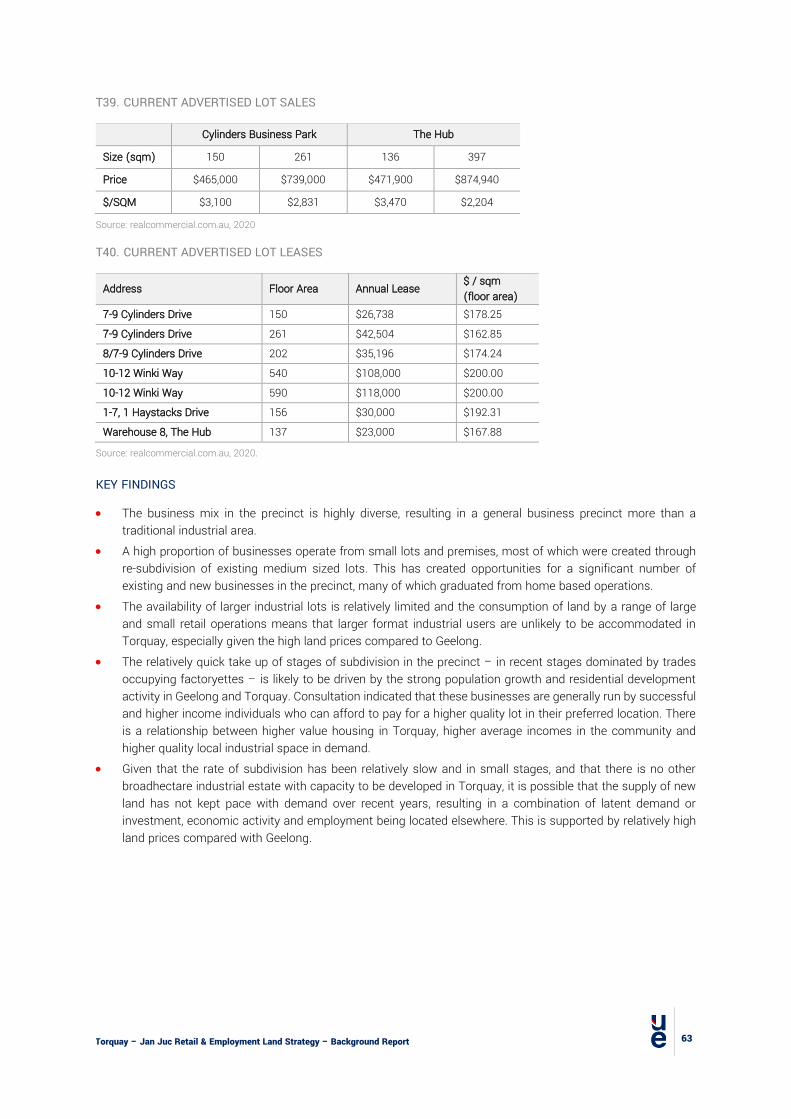
Torquay – Jan Juc Retail & Employment Land Strategy – Background Report
63
T39. CURRENT ADVERTISED LOT SALES
Cylinders Business Park The Hub
Size (sqm) 150 261 136 397
Price $465,000 $739,000 $471,900 $874,940
$/SQM $3,100 $2,831 $3,470 $2,204
Source: realcommercial.com.au, 2020
T40. CURRENT ADVERTISED LOT LEASES
Address Floor Area Annual Lease $ / sqm (floor area)
7-9 Cylinders Drive 150 $26,738 $178.25
7-9 Cylinders Drive 261 $42,504 $162.85
8/7-9 Cylinders Drive 202 $35,196 $174.24
10-12 Winki Way 540 $108,000 $200.00
10-12 Winki Way 590 $118,000 $200.00
1-7, 1 Haystacks Drive 156 $30,000 $192.31
Warehouse 8, The Hub 137 $23,000 $167.88
Source: realcommercial.com.au, 2020.
KEY FINDINGS
• The business mix in the precinct is highly diverse, resulting in a general business precinct more than a traditional industrial area.
• A high proportion of businesses operate from small lots and premises, most of which were created through re-subdivision of existing medium sized lots. This has created opportunities for a significant number of existing and new businesses in the precinct, many of which graduated from home based operations.
• The availability of larger industrial lots is relatively limited and the consumption of land by a range of large and small retail operations means that larger format industrial users are unlikely to be accommodated in Torquay, especially given the high land prices compared to Geelong.
• The relatively quick take up of stages of subdivision in the precinct – in recent stages dominated by trades occupying factoryettes – is likely to be driven by the strong population growth and residential development activity in Geelong and Torquay. Consultation indicated that these businesses are generally run by successful and higher income individuals who can afford to pay for a higher quality lot in their preferred location. There is a relationship between higher value housing in Torquay, higher average incomes in the community and higher quality local industrial space in demand.
• Given that the rate of subdivision has been relatively slow and in small stages, and that there is no other broadhectare industrial estate with capacity to be developed in Torquay, it is possible that the supply of new land has not kept pace with demand over recent years, resulting in a combination of latent demand or investment, economic activity and employment being located elsewhere. This is supported by relatively high land prices compared with Geelong.
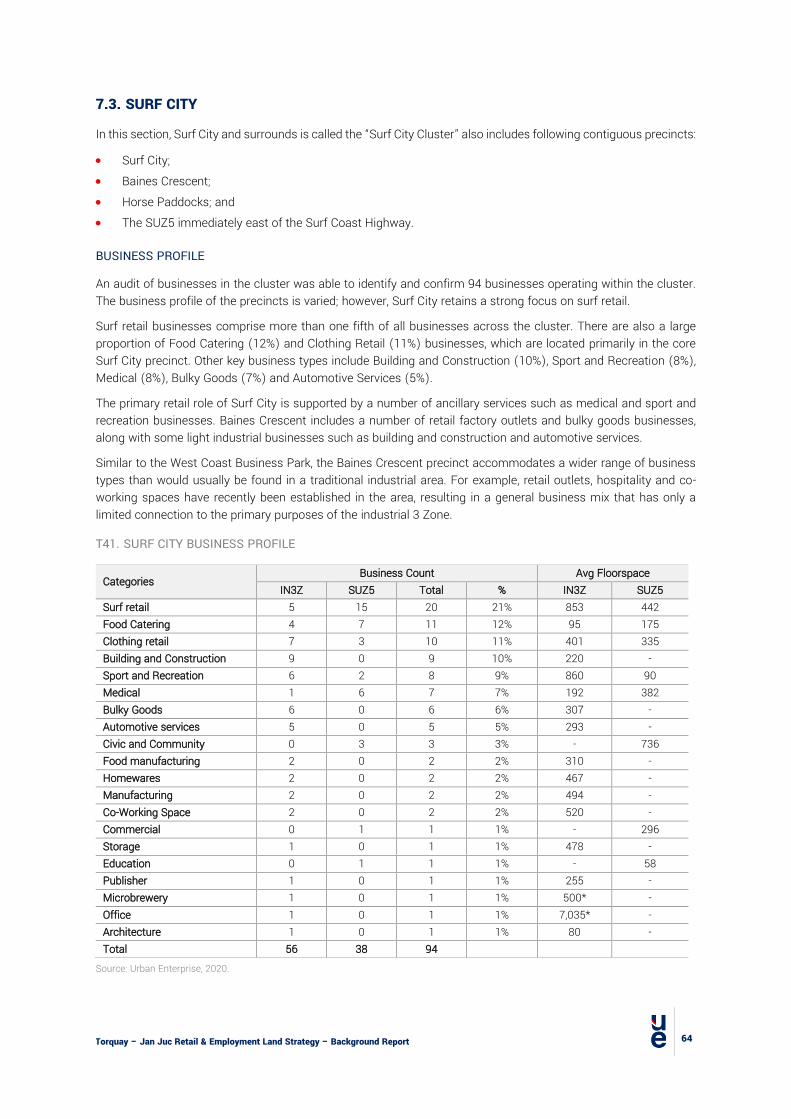
Torquay – Jan Juc Retail & Employment Land Strategy – Background Report
64
7.3. SURF CITY
In this section, Surf City and surrounds is called the “Surf City Cluster” also includes following contiguous precincts:
• Surf City; • Baines Crescent; • Horse Paddocks; and • The SUZ5 immediately east of the Surf Coast Highway.
BUSINESS PROFILE
An audit of businesses in the cluster was able to identify and confirm 94 businesses operating within the cluster. The business profile of the precincts is varied; however, Surf City retains a strong focus on surf retail.
Surf retail businesses comprise more than one fifth of all businesses across the cluster. There are also a large proportion of Food Catering (12%) and Clothing Retail (11%) businesses, which are located primarily in the core Surf City precinct. Other key business types include Building and Construction (10%), Sport and Recreation (8%), Medical (8%), Bulky Goods (7%) and Automotive Services (5%).
The primary retail role of Surf City is supported by a number of ancillary services such as medical and sport and recreation businesses. Baines Crescent includes a number of retail factory outlets and bulky goods businesses, along with some light industrial businesses such as building and construction and automotive services.
Similar to the West Coast Business Park, the Baines Crescent precinct accommodates a wider range of business types than would usually be found in a traditional industrial area. For example, retail outlets, hospitality and co-working spaces have recently been established in the area, resulting in a general business mix that has only a limited connection to the primary purposes of the industrial 3 Zone.
T41. SURF CITY BUSINESS PROFILE
Categories Business Count Avg Floorspace
IN3Z SUZ5 Total % IN3Z SUZ5 Surf retail 5 15 20 21% 853 442 Food Catering 4 7 11 12% 95 175 Clothing retail 7 3 10 11% 401 335 Building and Construction 9 0 9 10% 220 - Sport and Recreation 6 2 8 9% 860 90 Medical 1 6 7 7% 192 382 Bulky Goods 6 0 6 6% 307 - Automotive services 5 0 5 5% 293 - Civic and Community 0 3 3 3% - 736 Food manufacturing 2 0 2 2% 310 - Homewares 2 0 2 2% 467 - Manufacturing 2 0 2 2% 494 - Co-Working Space 2 0 2 2% 520 - Commercial 0 1 1 1% - 296 Storage 1 0 1 1% 478 - Education 0 1 1 1% - 58 Publisher 1 0 1 1% 255 - Microbrewery 1 0 1 1% 500* - Office 1 0 1 1% 7,035* - Architecture 1 0 1 1% 80 - Total 56 38 94
Source: Urban Enterprise, 2020.

Torquay – Jan Juc Retail & Employment Land Strategy – Background Report
65
*Microbrewery floorspace is advised by Council, but not included in Rates Data. Office floorspace is as per Rates Data and does not include the new proposal at the Boardriders site.
LAND SUPPLY
Based on a review of aerial photography industrial land supply is in the Surf City precincts is estimated at 7.79 ha (lot area, excluding roads) of IN3Z land and 6.13 ha of SUZ5 land. Approximately 0.65 ha of the IN3Z and 2.75 ha of the SUZ5 land supply in the precinct is considered vacant.
As shown in Figure 24, there is very little vacant land in the cluster, with the supply opportunities largely restricted to the west of Baines Crescent and the Horse Paddocks (which is the subject of a development proposal).
Given that the cluster has been developed over a long period of time and has been well established for many years, it is not surprising to see little vacant supply. Further, the precinct is landlocked by residential development and has no apparent opportunities to rezone surrounding land for further expansion.
F24. VACANT LAND SUPPLY, SURF CITY CLUSTER
Source: Urban Enterprise, 2020.

Torquay – Jan Juc Retail & Employment Land Strategy – Background Report
66
DEMAND INDICATORS
The cluster has been well established for many years. A review of the planning permits approved shows that there has been a significant number of permits for various works, however, permits for subdivision has created only 6 net additional lots since 2011. There are 43 other planning permits relating to the change of use of the site, indicating a very high turnover in land uses in the period.
There has, however, been little investment in the construction of new and substantially renovated premises (especially in Baines Crescent), resulting in a relatively poorly presented environment despite the highly accessible location and proximity to the popular Surf City retailers.
A review of aerial photography indicates that only 3 previously vacant lots have been occupied since 2010, all located within the Baines Crescent precinct (totalling 0.27 ha). There has been no evident vacant land consumption in the SUZ5 within this cluster during this time.
T42. LAND CONSUMPTION, SURF CITY CLUSTER
Address Year Land Area
IN3Z SUZ5
38 Baines Crescent, Torquay 2015 0.10 ha -
22 Baines Crescent, Torquay 2016 0.12 ha -
2/83 Beach Road, Torquay 2017 0.05 ha -
Total 2010 – 2020 0.27 ha 0 ha
Source: Urban Enterprise, 2020.
Several development proposals and major changes are proposed for the cluster as discussed in earlier sections. These include the proposed redevelopment of the Quiksilver headquarters and the Horse Paddocks site. When these proposals are considered alongside a number of changes of use and the recent trend towards a mix of retail, office, medical and hospitality uses, it is clear that the broader cluster is undergoing a shift in its role and its attractiveness to different types of business use.
KEY FINDINGS
• Although surf retail remains the dominant land use in the cluster, the land uses and business types are changing towards a wide mix of retail, office, medical and hospitality uses, alongside remnant industrial businesses and emerging food production uses.
• Vacant land is in short supply, other than the major opportunity to develop the Horse Paddocks site. The lack of reinvestment in part of the cluster – particularly the industrial area – indicates that the land use zoning / permissible uses may not be appropriate to encourage development and investment.
• Many of the emerging and proposed uses in the cluster will serve the growing local population, either as the primary market or alongside the existing visitor market. This is a shift towards population led demand rather than the long history of the precinct being targeted to visitors.
Torquay – Jan Juc Retail & Employment Land Strategy – Background Report
67
8. MAIN EMPLOYMENT SECTOR REQUIREMENTS
8.1. INTRODUCTION
This section provides a summary of the requirements for each key employment sector of office, health and industrial land.
8.2. OFFICE
The Torquay Town Centre Small Business Office Space Assessment was prepared for Council in 2019, to identify future demand for smaller scale office space in the Torquay/ Jan Juc area. The report provides an overview of local trends influencing the demand for smaller scale office space in Torquay, which has experienced:
• Strong business growth; • Increase in local jobs; • Increase in persons working from home; • Space use across multiple precincts; and • Trends in small business office space.
The report identifies key issues affecting future provision of space for small businesses in Torquay on both the demand and supply side. On the demand side, it is identified that businesses are using less average space per employee compared with other patterns of space use. Secondly, projected population growth will increase demand for number of businesses in health and community services, business and professional services. Thirdly, medical and allied health businesses have tended to locate on the Surf Coast Highway, and this pattern is likely to continue without significant investment in this space, such as a major medical facility or hospital.
On the supply side, it is identified that additional office space will come available with the redevelopment of sites in Gilbert Street and other parts of the Town Centre. Secondly, over time shop front retail space may be used for service businesses requiring a ground floor location. Thirdly, future developments on the Surf Coast Highway, such as the “Horse Paddock” will include some office space and medical suites. Lastly, changes occurring in the surf industry are opening up significant amounts of space in Surf City Precinct for other uses including office space for small and medium sized businesses.
These findings are supported by the research and analysis in this Background Report which indicates that office space will be an important facilitator of employment growth in the study area. The lack of modern, well-located office space was identified as a relative weakness of the building stock and several major developments are proposing new office space, primarily co-working and smaller tenancies.
The new co-working spaces that have recently located in Torquay, or are proposed in the short term, demonstrate increasing demand for this product to support the high proportion of residents working from home. Additionally, the impacts of COVID-19 may accelerate the trend toward remote working, particularly for the 50% of residents who work in Melbourne and Geelong.
Some vacancies exist in the town centre, however many of these were recently constructed and it is expected that demand will increase once the immediate effects of COVID subside.
It is important that the Strategy encourages office space in areas that will be attractive to businesses, especially smaller businesses, and in locations that can form part of an integrated employment and activity area. Key spatial priorities for office space should include:
• Town Centre (primary); • Surf City (secondary); • Torquay North (tertiary / longer term).
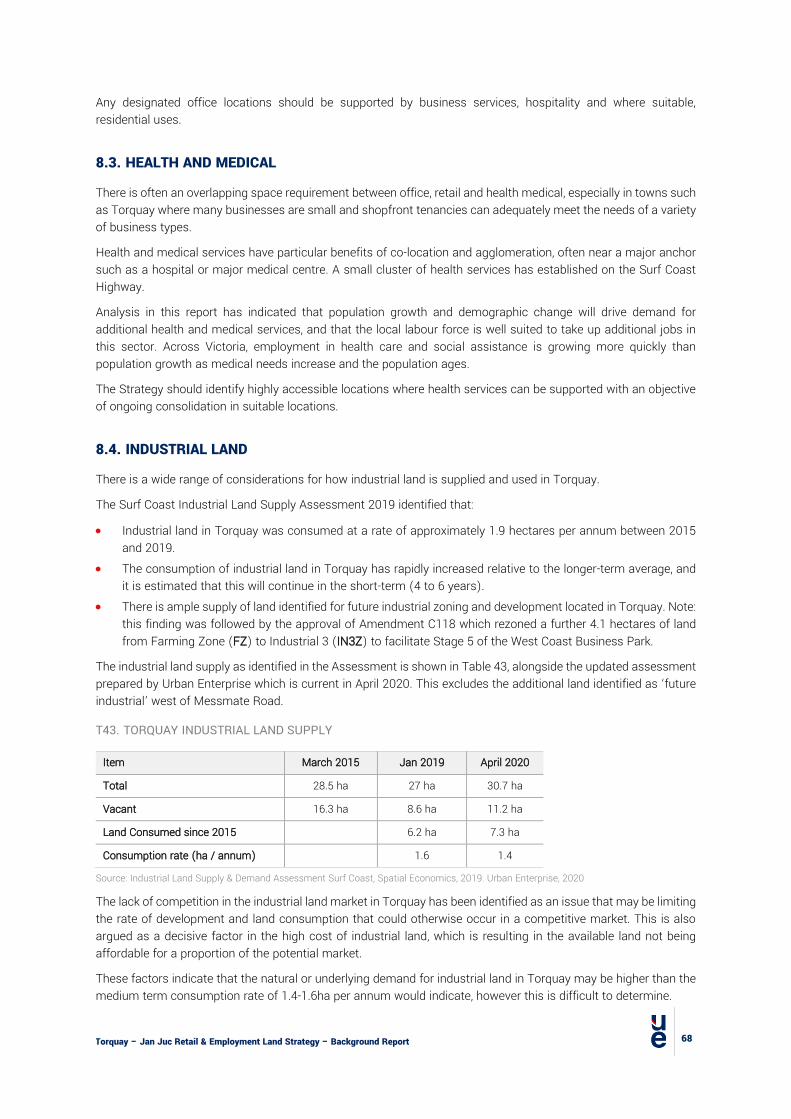
Torquay – Jan Juc Retail & Employment Land Strategy – Background Report
68
Any designated office locations should be supported by business services, hospitality and where suitable, residential uses.
8.3. HEALTH AND MEDICAL
There is often an overlapping space requirement between office, retail and health medical, especially in towns such as Torquay where many businesses are small and shopfront tenancies can adequately meet the needs of a variety of business types.
Health and medical services have particular benefits of co-location and agglomeration, often near a major anchor such as a hospital or major medical centre. A small cluster of health services has established on the Surf Coast Highway.
Analysis in this report has indicated that population growth and demographic change will drive demand for additional health and medical services, and that the local labour force is well suited to take up additional jobs in this sector. Across Victoria, employment in health care and social assistance is growing more quickly than population growth as medical needs increase and the population ages.
The Strategy should identify highly accessible locations where health services can be supported with an objective of ongoing consolidation in suitable locations.
8.4. INDUSTRIAL LAND
There is a wide range of considerations for how industrial land is supplied and used in Torquay.
The Surf Coast Industrial Land Supply Assessment 2019 identified that:
• Industrial land in Torquay was consumed at a rate of approximately 1.9 hectares per annum between 2015 and 2019.
• The consumption of industrial land in Torquay has rapidly increased relative to the longer-term average, and it is estimated that this will continue in the short-term (4 to 6 years).
• There is ample supply of land identified for future industrial zoning and development located in Torquay. Note: this finding was followed by the approval of Amendment C118 which rezoned a further 4.1 hectares of land from Farming Zone (FZ) to Industrial 3 (IN3Z) to facilitate Stage 5 of the West Coast Business Park.
The industrial land supply as identified in the Assessment is shown in Table 43, alongside the updated assessment prepared by Urban Enterprise which is current in April 2020. This excludes the additional land identified as ‘future industrial’ west of Messmate Road.
T43. TORQUAY INDUSTRIAL LAND SUPPLY
Item March 2015 Jan 2019 April 2020
Total 28.5 ha 27 ha 30.7 ha
Vacant 16.3 ha 8.6 ha 11.2 ha
Land Consumed since 2015 6.2 ha 7.3 ha
Consumption rate (ha / annum) 1.6 1.4
Source: Industrial Land Supply & Demand Assessment Surf Coast, Spatial Economics, 2019. Urban Enterprise, 2020
The lack of competition in the industrial land market in Torquay has been identified as an issue that may be limiting the rate of development and land consumption that could otherwise occur in a competitive market. This is also argued as a decisive factor in the high cost of industrial land, which is resulting in the available land not being affordable for a proportion of the potential market.
These factors indicate that the natural or underlying demand for industrial land in Torquay may be higher than the medium term consumption rate of 1.4-1.6ha per annum would indicate, however this is difficult to determine.

Torquay – Jan Juc Retail & Employment Land Strategy – Background Report
69
The employment model results indicate a projected requirement for between 12.4 and 27.6ha over the period 2019 to 2036, equating to between 0.7 and 1.6ha per annum. The lower bound relates to a scenario where the employment mix of Torquay would be weighted more towards services than industrial business types, essentially meaning a material reduction in the industrial role of the town. Although this is possible, the recent take up rates of land and relative lack of competition in the industrial land development market would indicate that this scenario is unlikely to occur over the planning period.
On balance, the Strategy should seek to provide at least 1ha per annum and up to 1.6ha of industrial land per annum to the market and increase the competition in the market to manage price levels and ensure efficient release of land to investors and businesses.
Table 44 shows a comparison of industrial land demand and supply, indicating that current zoned land supply is sufficient to cater to between 6 and 10 years demand.
T44. IN3Z REMAINING YEARS SUPPLY
Torquay Total Zoned Land Area
Developable area (80%)
Scenario 1 (1 ha / annum)
Scenario 2 (1.6 ha / annum)
Industrial land 11.2 ha 9.8 ha 10 years 6 years
Source: Urban Enterprise, 2020
Of particular relevance is the recent consumption of industrial land for micro-businesses in the construction, trades and food and beverage industries, and the use of industrial land for a range of recreation, office and retail purposes. It is important that a variety of small and medium sized industrial lots and premises are made available over the period to continue to encourage business creation and growth, especially those businesses that are created by local residents and are generating local employment in sectors that are not solely reliant on local custom. This is even more important in times of economic challenges and considering the reduction in the local employment associated with the surf sector.
Many of these business types do not require large lots and do not present major amenity conflicts with sensitive uses. Some of the businesses have a retail element, and many could operate well as part of a more diverse employment precinct than simply a traditional industrial estate. Other businesses will require strategically located industrial land with separation from sensitive uses. The Strategy would benefit from facilitating the provision of a variety of employment land types so that there is better delineation between ‘industrial’ land and general employment land.
Torquay – Jan Juc Retail & Employment Land Strategy – Background Report
70
9. ISSUES AND OPPORTUNITIES SUMMARY
9.1. INTRODUCTION
This section provides a brief summary of the key issues and opportunities identified in this Background Report. Although not exhaustive, these provide direction on the main issues to be addressed by the Strategy.
9.2. RETAIL
Issues to address: • Increasing retail competition from online sales and larger centres in Geelong. • Challenges to the surf retail industry due to manufacturing moving offshore and potential reduction in the
‘place brand’ due to Quiksilver departure. • Strong reliance on the casual workforce needs to be offset by more permanent retail related employment. • Fragmented retail offering and ‘out of centre’ larger format retailers drawing trade. • Under-performance of town centre. • Lack of vacant land in Commercial 1 Zone, fragmented lot profile and a lack of diversity / competition in the
ownership of developable parcels in the town centre. • No obvious location for larger format retailer to be accommodated. Opportunities to consider: • Strong population growth will generate demand for an additional 22,000 sqm of retail floorspace by 2036. • Ongoing population growth in Armstrong Creek creating additional demand for hospitality and entertainment. • Investment in hospitality and entertainment uses to complement retail role. • Ongoing demand for accommodation, activities and hospitality from domestic visitors to drive sales from
outside the local catchment. • Potential demand for a Discount Department Store, however weak trading conditions at present and lack of
appropriate location in the Town Centre. • Strong demand in northern Torquay will support additional floorspace in Torquay North.
9.3. OFFICE
Issues to address: • No dedicated office location, resulting in dispersed locations. • Lack of vacant land in C1Z, challenges developing new space in the town centre. • Loss of headquarter Quiksilver jobs. Opportunities to consider: • Increasing professional labour force and improving conditions to work remotely, especially attracting residents
from Melbourne in professional occupations • Strong population growth will drive demand for services and floorspace • Identify preferred locations of office growth and supporting with policy and investment. • Integrating office space with residential in areas appropriate for mixed use. • Recent growth in co-working developments to support home-based workers and businesses. Remote working
may be accelerated due to COVID-19 impacts.
Torquay – Jan Juc Retail & Employment Land Strategy – Background Report
71
9.4. INDUSTRIAL
Issues to address: • Lack of competition and high prices in new industrial land development. • Strong competition from non-industrial land uses locating in industrial precincts. • Potential loss of investment due to limited land and prices. • Remaining land supply is not sufficient to meet planning policy requirement of 15 years supply based on
demand projections in this study. Opportunities to consider: • Demand from small and niche producers • Demand from construction and trades businesses • Continue to diversify the mix of uses and provide sufficient space to enable smaller businesses to graduate
into formal premises. • Plan for a strategic, ongoing expansion of industrial land to meet population and business needs, including
differentiating from competing supply. Providing affordable land is a key priority.
9.5. HEALTH
Issues to address: • Ageing population and the growing demand for services • No designated location for uses to locate. Opportunities to consider: • Providing space, policy support and encouragement for a greater health business base in the town. • Potential to accommodate a hospital in an appropriate location, which may lead to relocation of existing
medical businesses
9.6. MAIN PRECINCTS
TORQUAY TOWN CENTRE
Issues to address: • Under performance of precinct • Trade lost to out of centre retailers • Minimal population growth in local catchment • Fragmented lot profile and lack of opportunity to accommodate larger developments • Traffic congestion and parking issues. Opportunities to consider: • Proximity to coast and associated ongoing visitation • Improving conditions for emerging mixed use developments to drive reinvestment and greater footfall in the
centre, including considering height limits and landownership issues. • Facilitating accommodation and residential uses on upper levels; • Stronger hospitality and visitor role in future. • Investment to improve public realm, street life and traffic flow.

Torquay – Jan Juc Retail & Employment Land Strategy – Background Report
72
SURF CITY CLUSTER
Issues to address: • Changing surf retail role, manufacturing moving offshore, loss of Quiksilver. • Conditions placed on a broad range of land uses requiring permits under current zoning discourage or prevent
a number of uses that may be in demand, such as a cap on convenience shop floorspace and a cap on food and drink premises floorspace. Very few uses do not require a permit in the SUZ5.
• Proximity to town centre and the need to retain the town centres primacy from a retail perspective. • Lack of vacant land other than Horse Paddocks. • Lack of reinvestment in Baines Crescent and emerging interest in a wider variety of business uses. Opportunities to consider: • Major developments proposed could regenerate the area and support other businesses to locate. • Development of the Horse Paddocks could address a range of market gaps, including health and medical
facilities, entertainment and accommodation uses. • Prospect of accommodating both residential and office uses in some sections of the precinct. • Review zoning to ensure it is compatible with economic trends and local opportunities for employment and
investment. • Potential to develop a cluster to accommodate innovation and creative industries.
WEST COAST BUSINESS PARK
Issues to address: • Providing a sufficient supply of industrial land over the life of the strategy • Lack of competition with other precincts. • High land prices. Opportunities to consider: • Ongoing population growth driving demand for construction and local industrial needs. • Encourage and support the emergence of a variety of niche industries and related uses. • Expand the extent of zoned land to accommodate growth. • Revisit planning policy and controls to ensure that lots can be provided at an accessible price point and that
land is maximised.
TORQUAY NORTH
Issues to address: • Strong population growth expected in catchment. • Family demographic and expected demand for local work, recreation and retail services. • Retail floorspace caps to be reviewed. Opportunities to consider: • Encourage a wide variety of land uses and investment in this important location close to new residents,
following the 20-minute neighbourhood objective, including office and other employment uses. • Potential expansion of the zoned land.

Torquay – Jan Juc Retail & Employment Land Strategy – Background Report
73
BELL STREET
Issues to address: • Lack of existing vacant land within the precinct boundary. Opportunities to consider: • Strengthen Bell Street as a food precinct. • Provide high quality tourist accommodation at the western edge of the centre to take advantage of strategic
location near key tourist attractions.

Torquay – Jan Juc Retail & Employment Land Strategy – Background Report
74
APPENDICES APPENDIX A DATA AREA MAPS
F25. TORQUAY SA2
Source: Remplan, 2020
F26. SURF COAST SHIRE
Source: Remplan, 2020
Torquay – Jan Juc Retail & Employment Land Strategy – Background Report
75
F27. GREATER GEELONG
Source: Remplan, 2020
F28. GEELONG SA4
Source: Remplan, 2020

Torquay – Jan Juc Retail & Employment Land Strategy – Background Report
76
F29. TORQUAY, FORECAST ID
Source; Forecast id, 2020
F30. TORQUAY DESTINATION ZONES
Source: Remplan, 2020
Torquay – Jan Juc Retail & Employment Land Strategy – Background Report
77
F31. BESPOKE REGIONS OF GEELONG AND BELLARINE PENINSULA
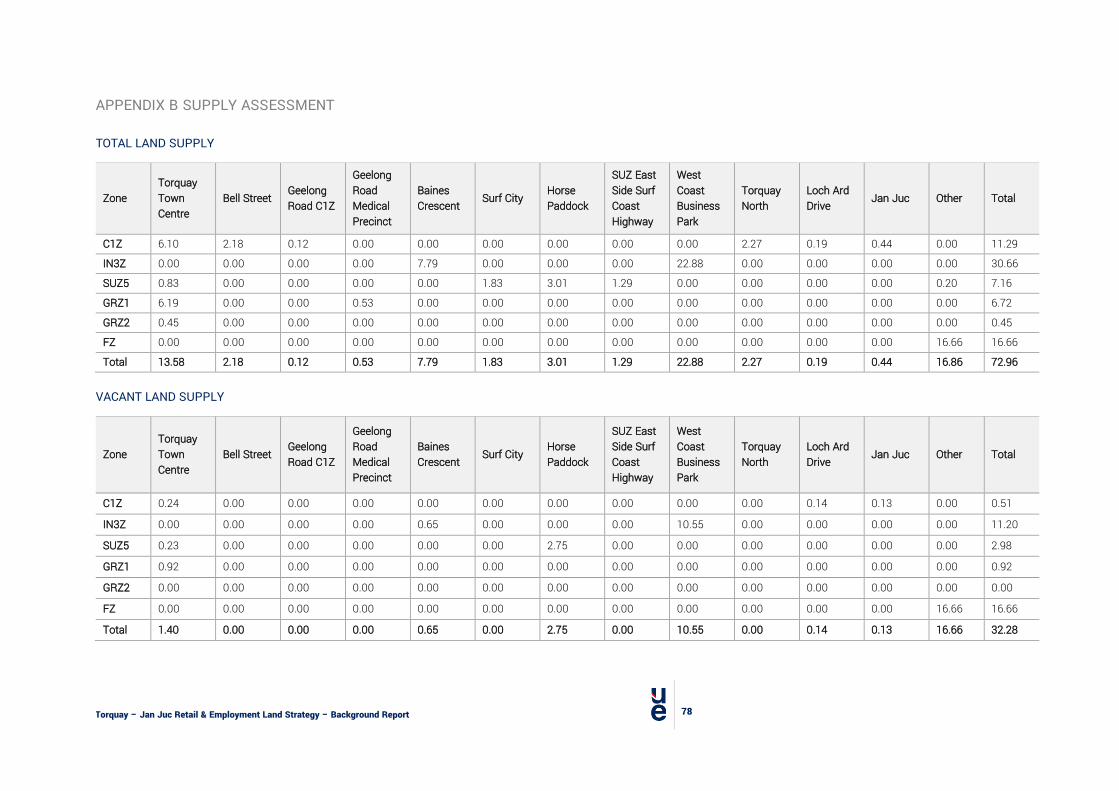
Torquay – Jan Juc Retail & Employment Land Strategy – Background Report
78
APPENDIX B SUPPLY ASSESSMENT
TOTAL LAND SUPPLY
Zone Torquay Town Centre
Bell Street Geelong Road C1Z
Geelong Road Medical Precinct
Baines Crescent Surf City Horse
Paddock
SUZ East Side Surf Coast Highway
West Coast Business Park
Torquay North
Loch Ard Drive Jan Juc Other Total
C1Z 6.10 2.18 0.12 0.00 0.00 0.00 0.00 0.00 0.00 2.27 0.19 0.44 0.00 11.29
IN3Z 0.00 0.00 0.00 0.00 7.79 0.00 0.00 0.00 22.88 0.00 0.00 0.00 0.00 30.66
SUZ5 0.83 0.00 0.00 0.00 0.00 1.83 3.01 1.29 0.00 0.00 0.00 0.00 0.20 7.16
GRZ1 6.19 0.00 0.00 0.53 0.00 0.00 0.00 0.00 0.00 0.00 0.00 0.00 0.00 6.72
GRZ2 0.45 0.00 0.00 0.00 0.00 0.00 0.00 0.00 0.00 0.00 0.00 0.00 0.00 0.45
FZ 0.00 0.00 0.00 0.00 0.00 0.00 0.00 0.00 0.00 0.00 0.00 0.00 16.66 16.66
Total 13.58 2.18 0.12 0.53 7.79 1.83 3.01 1.29 22.88 2.27 0.19 0.44 16.86 72.96
VACANT LAND SUPPLY
Zone Torquay Town Centre
Bell Street Geelong Road C1Z
Geelong Road Medical Precinct
Baines Crescent Surf City
Horse Paddock
SUZ East Side Surf Coast Highway
West Coast Business Park
Torquay North
Loch Ard Drive Jan Juc Other Total
C1Z 0.24 0.00 0.00 0.00 0.00 0.00 0.00 0.00 0.00 0.00 0.14 0.13 0.00 0.51
IN3Z 0.00 0.00 0.00 0.00 0.65 0.00 0.00 0.00 10.55 0.00 0.00 0.00 0.00 11.20
SUZ5 0.23 0.00 0.00 0.00 0.00 0.00 2.75 0.00 0.00 0.00 0.00 0.00 0.00 2.98
GRZ1 0.92 0.00 0.00 0.00 0.00 0.00 0.00 0.00 0.00 0.00 0.00 0.00 0.00 0.92
GRZ2 0.00 0.00 0.00 0.00 0.00 0.00 0.00 0.00 0.00 0.00 0.00 0.00 0.00 0.00
FZ 0.00 0.00 0.00 0.00 0.00 0.00 0.00 0.00 0.00 0.00 0.00 0.00 16.66 16.66
Total 1.40 0.00 0.00 0.00 0.65 0.00 2.75 0.00 10.55 0.00 0.14 0.13 16.66 32.28
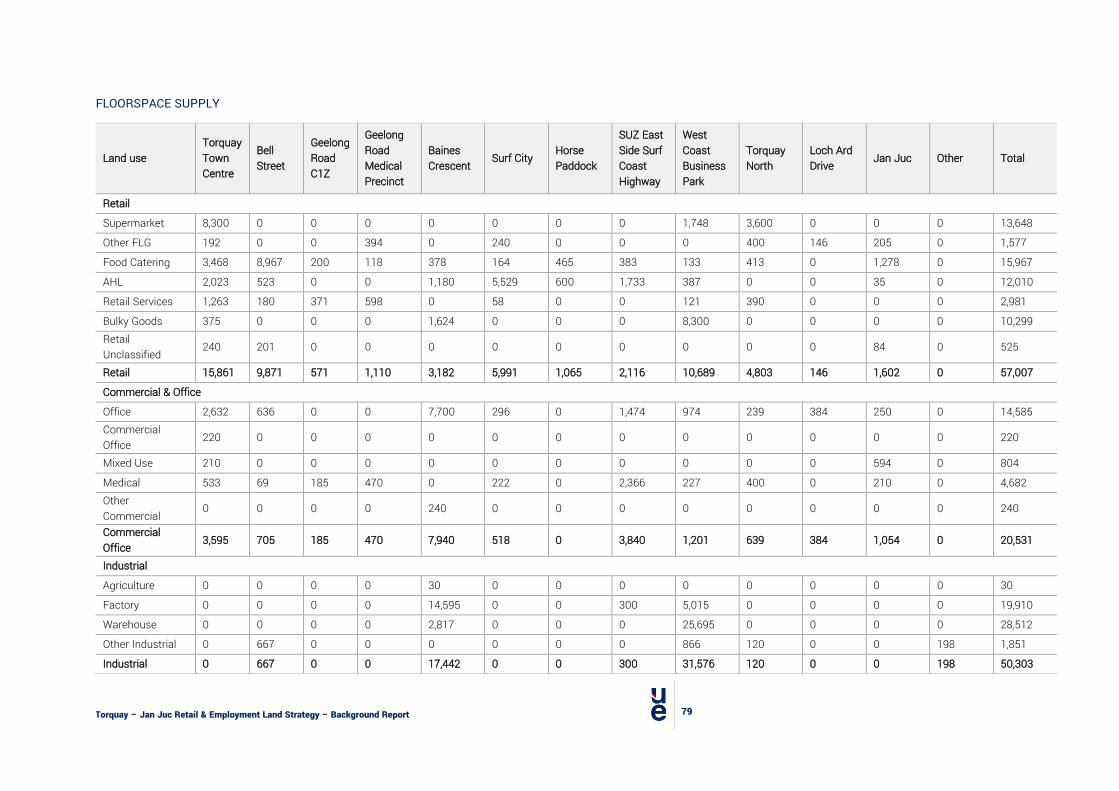
Torquay – Jan Juc Retail & Employment Land Strategy – Background Report
79
FLOORSPACE SUPPLY
Land use Torquay Town Centre
Bell Street
Geelong Road C1Z
Geelong Road Medical Precinct
Baines Crescent Surf City Horse
Paddock
SUZ East Side Surf Coast Highway
West Coast Business Park
Torquay North
Loch Ard Drive Jan Juc Other Total
Retail
Supermarket 8,300 0 0 0 0 0 0 0 1,748 3,600 0 0 0 13,648
Other FLG 192 0 0 394 0 240 0 0 0 400 146 205 0 1,577
Food Catering 3,468 8,967 200 118 378 164 465 383 133 413 0 1,278 0 15,967
AHL 2,023 523 0 0 1,180 5,529 600 1,733 387 0 0 35 0 12,010
Retail Services 1,263 180 371 598 0 58 0 0 121 390 0 0 0 2,981
Bulky Goods 375 0 0 0 1,624 0 0 0 8,300 0 0 0 0 10,299 Retail Unclassified
240 201 0 0 0 0 0 0 0 0 0 84 0 525
Retail 15,861 9,871 571 1,110 3,182 5,991 1,065 2,116 10,689 4,803 146 1,602 0 57,007
Commercial & Office
Office 2,632 636 0 0 7,700 296 0 1,474 974 239 384 250 0 14,585 Commercial Office
220 0 0 0 0 0 0 0 0 0 0 0 0 220
Mixed Use 210 0 0 0 0 0 0 0 0 0 0 594 0 804
Medical 533 69 185 470 0 222 0 2,366 227 400 0 210 0 4,682 Other Commercial
0 0 0 0 240 0 0 0 0 0 0 0 0 240
Commercial Office 3,595 705 185 470 7,940 518 0 3,840 1,201 639 384 1,054 0 20,531
Industrial
Agriculture 0 0 0 0 30 0 0 0 0 0 0 0 0 30
Factory 0 0 0 0 14,595 0 0 300 5,015 0 0 0 0 19,910
Warehouse 0 0 0 0 2,817 0 0 0 25,695 0 0 0 0 28,512
Other Industrial 0 667 0 0 0 0 0 0 866 120 0 0 198 1,851
Industrial 0 667 0 0 17,442 0 0 300 31,576 120 0 0 198 50,303
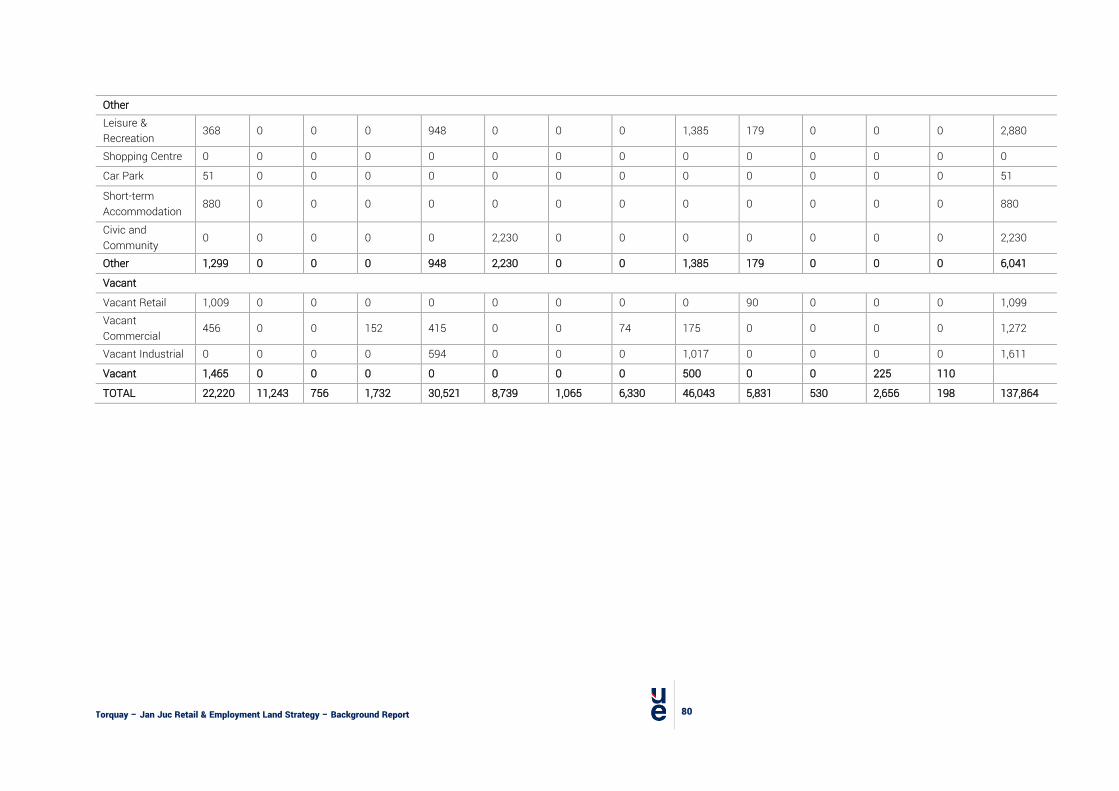
Torquay – Jan Juc Retail & Employment Land Strategy – Background Report
80
Other Leisure & Recreation 368 0 0 0 948 0 0 0 1,385 179 0 0 0 2,880
Shopping Centre 0 0 0 0 0 0 0 0 0 0 0 0 0 0
Car Park 51 0 0 0 0 0 0 0 0 0 0 0 0 51
Short-term Accommodation 880 0 0 0 0 0 0 0 0 0 0 0 0 880
Civic and Community 0 0 0 0 0 2,230 0 0 0 0 0 0 0 2,230
Other 1,299 0 0 0 948 2,230 0 0 1,385 179 0 0 0 6,041
Vacant
Vacant Retail 1,009 0 0 0 0 0 0 0 0 90 0 0 0 1,099 Vacant Commercial
456 0 0 152 415 0 0 74 175 0 0 0 0 1,272
Vacant Industrial 0 0 0 0 594 0 0 0 1,017 0 0 0 0 1,611
Vacant 1,465 0 0 0 0 0 0 0 500 0 0 225 110
TOTAL 22,220 11,243 756 1,732 30,521 8,739 1,065 6,330 46,043 5,831 530 2,656 198 137,864

Torquay – Jan Juc Retail & Employment Land Strategy – Background Report
81
APPENDIX C SUZ5 AMENDMENTS
Amendment Details
Amendment C128 06/02/2020
Corrected land use terms, reworded application requirements, decision guidelines etc. for change of use and subdivision, building and works and signs
Amendment C113 02/03/2017
Amends Schedule by including Precinct T1 in the list of precincts where a planning permit application can be made for the use of land for a service station.
Amendment C97 19/05/2016
Renames schedule to Torquay Tourism Development Precincts, removes mention of Precincts in Anglesea. Adds reference to food and drink premises in purpose, moves art and craft centre from Section 1 use to Section 2. Amends condition for Office and Service station (Section 2 use)
Amendment C102 12/02/2015 Removes market from prohibited uses and corrects wording in the purpose.
Amendment C90 24/04/2014 Inserts Market in the Table of uses as a Section 2 use.
Amendment C92 13/02/2014 Removes mineral exploration, mining and search for stone from the Table of Uses Section 1.
Amendment C78 10/10/2013
Makes formatting and restructuring changes to the MSS and also updates and corrects the zoning/overlays of a number of properties, and deletes overlays that have become redundant
Amendment C37 10/06/2010
Rezones the eastern end of Gilbert Street in the Town Centre from Special Use Zone 5 to Business 1 Zone to allow a more flexible consideration of appropriate uses and rezones 120 Surf Coast Hwy, Torquay from Residential 1 Zone to Special Use Zone Schedule 5. Modifies Schedule to facilitate a number of small changes.
Amendment C36 03/05/2007 Modifies the permitted uses for Precincts T1 and T2 to encourage a greater mix of land uses.
Amendment C10 10/06/2004 Revises the name of the local policy and reference document.
Amendment C1 30/11/2000
Amends Clause 37.01 Schedule 5 to replace the Torquay Tourist Development Plan with an updated version that refers only to those precincts nominated in the schedule.

Torquay – Jan Juc Retail & Employment Land Strategy – Background Report
82
APPENDIX D INDUSTRIAL LAND SUPPLY DEFINITIONS
The following definitions of occupied and vacant land are applied in this assessment to industrial land:
In order for a lot to be classified as occupied it is required to meet one or more of the following criteria:
• The lot is occupied by an existing business; • A building is in the process of being constructed on the lot; • The lot is clearly being utilised for materials or equipment storage; • There is evidence of business activities occurring on site.
This is consistent with the approach used in the Urban Development Program assessment of industrial land, where in order for a site to be considered occupied there needs to be some evidence of the use of land, this included buildings, hardstand storage areas, carparks etc.
In order for the site to be considered vacant, there must be no use occurring on the land.10
10 Urban Development Program, Metropolitan Melbourne Industrial, 2018 p. 23

Torquay – Jan Juc Retail & Employment Land Strategy – Background Report
83
APPENDIX E EMPLOYMENT PROJECTIONS DETAIL
T45. EMPLOYMENT SCENARIO ASSUMPTIONS AND INDUSTRY SHIFTS
Scenario 1 Scenario 2 Scenario 3 Scenario 4
Employment Distribution
Industrial 28% 24% 28% 24% Retail 30% 30% 30% 30% Office 22% 24% 22% 24% Health 9% 10% 9% 10% Education 8% 8% 8% 8% Other 3% 3% 3% 3%
Jobs: resident ratio 0.28: 1 0.28: 1 0.30: 1 0.30: 1 Source: Urban Enterprise, 2020. based on Small Area Labour Market Projections, Federal Government.
T46. LAND AREA RATIOS
Land use Levels Site coverage Floorspace to Site Area ratio
Site Area to Land Area ratio
Floorspace to Land Area ratio
Industrial 1 35% 0.35: 1 70% 0.25: 1 Office 2 70% 1.4: 1 100% 1.4:1 Health 1 70% 0.7: 1 100% 0.7:1
Source: Urban Enterprise, 2020