Embed Size (px)
Citation preview
Tort Personal Injury Claims Statistics: Is There a
Compensation Culture in the United Kingdom?
RICHARD LEWIS, ANNETTE MORRIS, and KEN OLIPHANT *
This article seeks to identify the most reliable sources of statistical information about
the workings of the personal injury litigation system in the United Kingdom (UK), to
present their principal data in clear, straightforward and accessible form, and to
subject them to critical analysis. These figures provide the basis for an initial
examination of the claim that a damaging compensation culture has developed in the
UK in recent years.
INTRODUCTION
At a time when the personal injury litigation system is attracting renewed attention –
stimulated above all by claims of a compensation culture – attempts at serious evaluation are
undermined by the lack of up-to-date statistical information about its workings.1 In the UK
there has been no comprehensive empirical investigation of the system since the time of the
Pearson Royal Commission (1978)2 and the personal injury survey conducted by the
* Cardiff Law School, Cardiff University, Wales, UK.
We wish to thank the editor, the anonymous referee, and our colleague, Richard Moorhead, for their
comments.
1 K Williams, ‘State of Fear: Britain’s ‘Compensation Culture’ Reviewed’ (2005) 25 Legal Studies 499 at
513 – 4. This article relies mainly on secondary sources, and presents only a partial account of the
evidence that is available. On the importance of evaluating the tort system by reference to reliable
statistical data see D Dewees, D Duff, and M Trebilcock, Exploring the Domain of Accident Law:
Taking the Facts Seriously, Oxford University Press, Oxford, 1996.
2 Royal Commission on Compensation for Personal Injury (Chairman: Lord Pearson), Report, Cmnd 7054
(3 vols), HMSO, London, 1978.

2
Oxford Centre for Social Legal Studies (“the Oxford survey”).3 A subsequent study
undertaken for the Civil Justice Review was very small-scale and paid disproportionate
attention to tried cases as opposed to out-of-court settlements, disqualifying it as a reliable
source of empirical evidence about the personal injury litigation system as a whole.4
The purpose of the current article is to present in simple and accessible form some basic
facts about the modern personal injury litigation system in the UK, drawing upon the most
reliable data sources that are available. In the first part of the article (“Sources”), we identify
three key sources of statistical information about claims in tort, explaining how their data is
assembled and giving a brief overview of what we can learn from them, focusing on data
relating to the number and cost (including the legal cost) of claims. In the second part
(“Analysis”), we consider trends in these data over time, seeking to identify the major
factors that may have influenced claims frequency and average claims costs. An important
ulterior goal is to give at least a preliminary evaluation of the contention that both the number
and the cost of claims have been driven to record levels. If the figures bear this out, it would
lend support to those who consider the UK to be gripped by a compensation culture,5 and
3 D Harris et al, Compensation and Support for Illness and Injury, Oxford University Press,
Oxford,1984.
4 See Inbucon Management Consultants, Civil Justice Review: Study of Personal Injury Litigation,
Lord Chancellor’s Department, London, 1986, and Civil Justice Review, Report of the Review Body on
Civil Justice, Cm 394, HMSO, London, 1988.
5 See, eg, F Furedi, Courting Mistrust: The Hidden Growth of a Culture of Litigation in Britain, Centre
for Policy Studies, London, 1999. But cf E Lee et al, Compensation Crazy: Do We Blame and Claim
Too Much? Hodder & Stoughton, London, 2002. For an account of how the media has exaggerated
the number and cost of tort claims in the USA, see W Haltom and M McCann, Distorting the Law:
Politics, Media, and the Litigation Crisis, University of Chicago Press, Chicago, 2004, and for similar
concerns in the context of clinical negligence see T Baker, The Medical Malpractice Myth, University
of Chicago Press, Chicago, 2005. For further analysis see Williams, above n 1 and A Morris,
‘Spiralling or Stabilising? The Compensation Culture and Our Propensity to Claim Damages for
Personal Injury’ (forthcoming).
3
undermine the Government’s view that, although the compensation culture is a myth, the
public’s erroneous belief that it exists results in real and costly burdens.6
SOURCES
Three sources relating to tort claims are examined in outline and their main findings
summarised. These sources are, firstly, the data supplied in recent years by the
Government’s Compensation Recovery Unit concerning the total number of claims made for
personal injury each year; secondly, actuarial analyses based on over a million claims and
produced for successive reports commissioned by the Association of British Insurers; and
finally, the detailed figures collated in relation to clinical negligence claims made against the
National Health Service. A distinguishing feature of all three sources of information is that
they are founded upon a very wide statistical base.
COMPENSATION RECOVERY UNIT STATISTICS
Since 1990, the Compensation Recovery Unit (CRU) has administered the scheme
which enables the state to recover from tort damages any social security benefit paid as a
result of a relevant accident or disease.7 An essential part of this scheme is that all
compensators must provide prompt notification to CRU of any claim for personal injury
made against them. As a result CRU presently holds the most comprehensive and reliable
data on the number of current personal injury claims.8 It is a potentially rich source of
6 The Government’s view, following the conclusions of its Better Regulation Task Force in Better
Routes to Redress, Cabinet Office Publications, London, 2004, underlies the curious provisions of the
current Compensation Bill, introduced in November 2005, which simply reiterates the current test of
breach of duty in negligence (clause 1), and then establishes a framework for the regulation of claims
management services.
7 The Unit was established by the Social Security Act 1989 and administers the scheme now provided
for by the Social Security (Recovery of Benefits) Act 1997.
8 It also records annual numbers of settlements, but this information is currently of limited use because
there is a considerable element of double-counting of interim and final compensation payments.
4
information about various aspects of the tort system which hitherto has received little
attention, partly because only some of the information gathered has been made public.
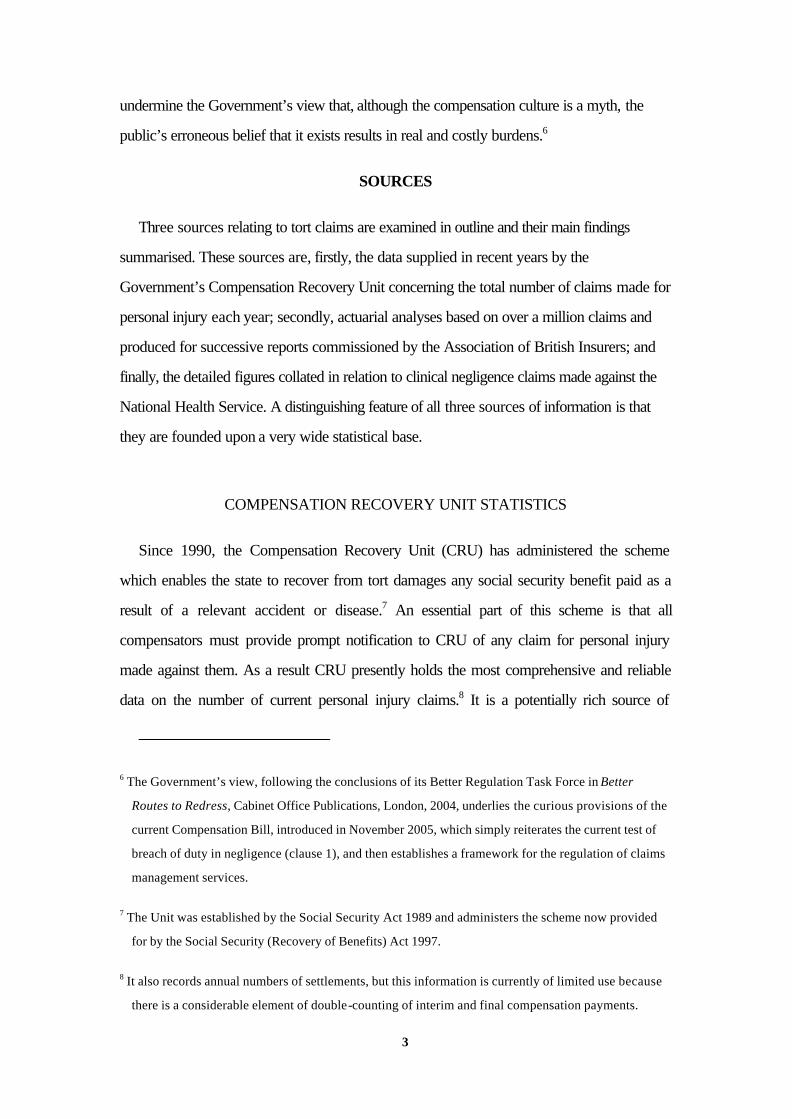
However, there are particular difficulties in using the statistics which relate to claims made
before 2000. They were not made widely available and their full details remain unknown
outside of CRU. In addition, until 1997 benefits could not be recovered from damages
awards of £2,500 or below, and compensators were not required to report claims that fell
within this category. As a result the Department of Social Security (DSS) estimated that half
of all the claims made were not reported at all.9 Therefore the earlier figures, where
available, reveal only part of the compensation picture. It was only in October 1997 that the
exemption for small payments was removed and the reporting requirement extended to
cover all claims, no matter how small. By contrast with these earlier figures, those for current
claims are very accurate because the rate of compliance with the increased reporting
requirement is very high. This is partly because standardised procedures have now been
built into the claims handling procedures of the insurers and other bodies who, in practice,
constitute the real defendants in tort claims.
Table 1: Total Number of Claims Notified Since 2000 (Source: CRU)
Year Number
2000/2001 735,931
2001/2002 688,315
2002/2003 706,697
2003/2004 770,243
2004/2005 755,875
9 DSS, Memorandum of Evidence to the Social Security Select Committee (1995) HC 196, para 40.
5
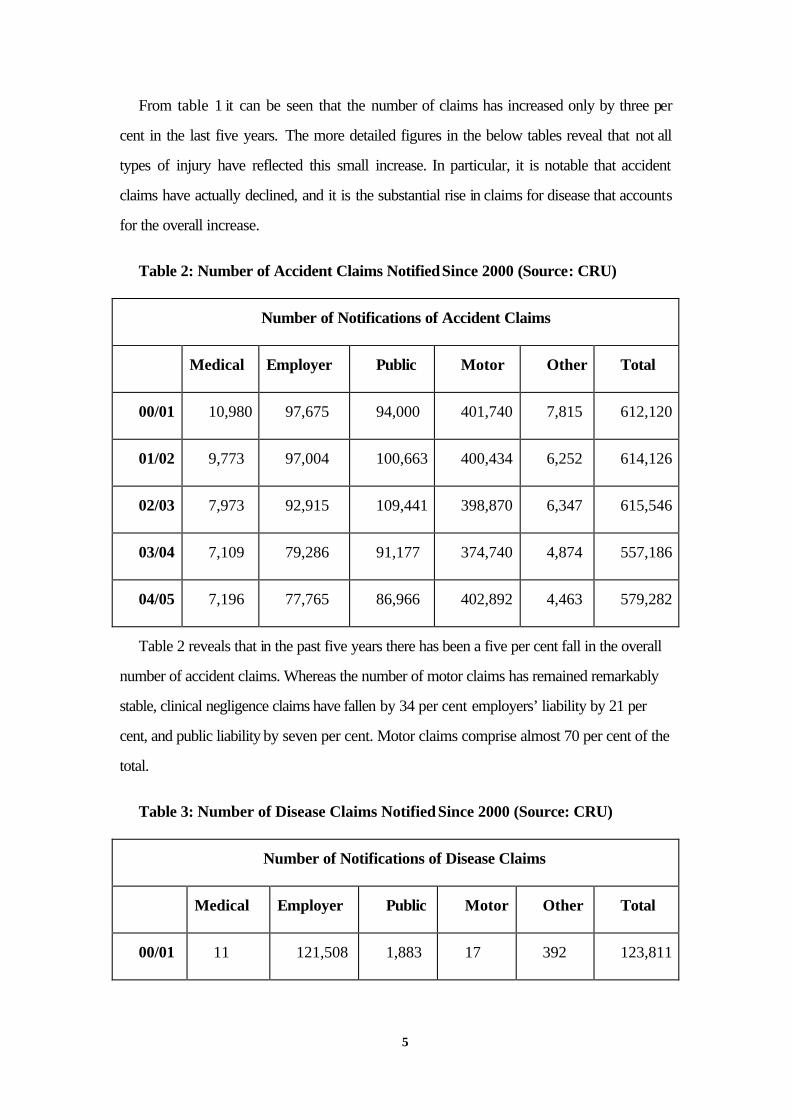
From table 1 it can be seen that the number of claims has increased only by three per
cent in the last five years. The more detailed figures in the below tables reveal that not all
types of injury have reflected this small increase. In particular, it is notable that accident
claims have actually declined, and it is the substantial rise in claims for disease that accounts
for the overall increase.
Table 2: Number of Accident Claims Notified Since 2000 (Source: CRU)
Number of Notifications of Accident Claims
Medical Employer Public Motor Other Total
00/01 10,980 97,675 94,000 401,740 7,815 612,120
01/02 9,773 97,004 100,663 400,434 6,252 614,126
02/03 7,973 92,915 109,441 398,870 6,347 615,546
03/04 7,109 79,286 91,177 374,740 4,874 557,186
04/05 7,196 77,765 86,966 402,892 4,463 579,282
Table 2 reveals that in the past five years there has been a five per cent fall in the overall
number of accident claims. Whereas the number of motor claims has remained remarkably
stable, clinical negligence claims have fallen by 34 per cent employers’ liability by 21 per
cent, and public liability by seven per cent. Motor claims comprise almost 70 per cent of the
total.
Table 3: Number of Disease Claims Notified Since 2000 (Source: CRU)
Number of Notifications of Disease Claims
Medical Employer Public Motor Other Total
00/01 11 121,508 1,883 17 392 123,811
6
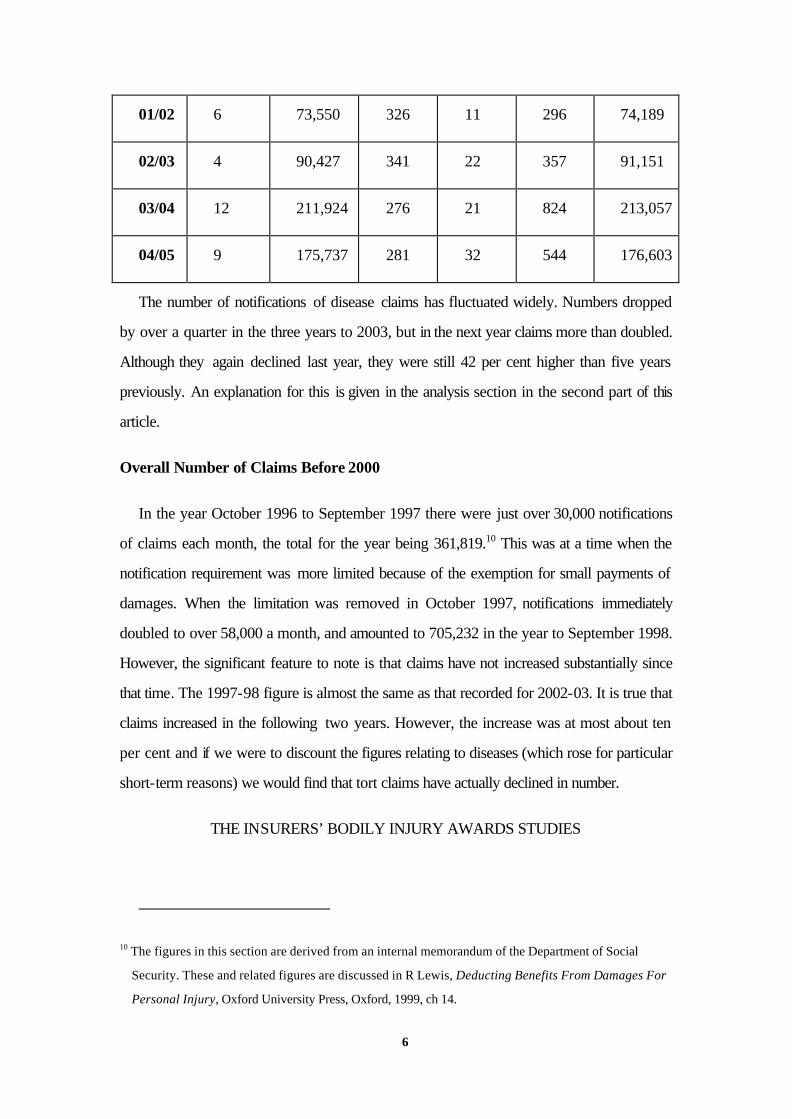
01/02 6 73,550 326 11 296 74,189
02/03 4 90,427 341 22 357 91,151
03/04 12 211,924 276 21 824 213,057
04/05 9 175,737 281 32 544 176,603
The number of notifications of disease claims has fluctuated widely. Numbers dropped
by over a quarter in the three years to 2003, but in the next year claims more than doubled.
Although they again declined last year, they were still 42 per cent higher than five years
previously. An explanation for this is given in the analysis section in the second part of this
article.
Overall Number of Claims Before 2000
In the year October 1996 to September 1997 there were just over 30,000 notifications
of claims each month, the total for the year being 361,819.10 This was at a time when the
notification requirement was more limited because of the exemption for small payments of
damages. When the limitation was removed in October 1997, notifications immediately
doubled to over 58,000 a month, and amounted to 705,232 in the year to September 1998.
However, the significant feature to note is that claims have not increased substantially since
that time. The 1997-98 figure is almost the same as that recorded for 2002-03. It is true that
claims increased in the following two years. However, the increase was at most about ten
per cent and if we were to discount the figures relating to diseases (which rose for particular
short-term reasons) we would find that tort claims have actually declined in number.
THE INSURERS’ BODILY INJURY AWARDS STUDIES
10 The figures in this section are derived from an internal memorandum of the Department of Social
Security. These and related figures are discussed in R Lewis, Deducting Benefits From Damages For
Personal Injury, Oxford University Press, Oxford, 1999, ch 14.
7
Commissioned by the Association of British Insurers and by the International
Underwriting Association of London, three successive reports have been published into
claims received by insurers for compensation for personal injury resulting from use of motor
vehicles.11 The first report appeared in 1997, the second in 1999, and the most recent in
2003. They investigate injury claims trends in the UK and the forces that affect them.
The studies claim to be the biggest exercise of their kind ever undertaken. Although the
accounts they give of the changes in the law and legal system are unexceptional, it is certainly
true that the actuarial analyses has been carried out using a very wide statistical base: for the
third report 1.1 million personal injury claims made against motor insurers were analysed,
the information being obtained from insurers representing 90 per cent of the overall motor
insurance market. Relying in part upon the earlier reports, the 2003 report produces figures
which cover motor accidents which occurred between 1991 and 2000, and consists of 208
pages of statistics and commentary.
However, the reports do not cover claims made other than against insurers, nor do they
deal with injuries other than those involving a motor vehicle. Unlike the Compensation
Recovery Unit statistics, therefore, the reports do not attempt to be comprehensive of all
personal injury claims (or even of insured personal injury claims) and neither do they focus
on very precise claims figures for any particular year.
Claim Frequency
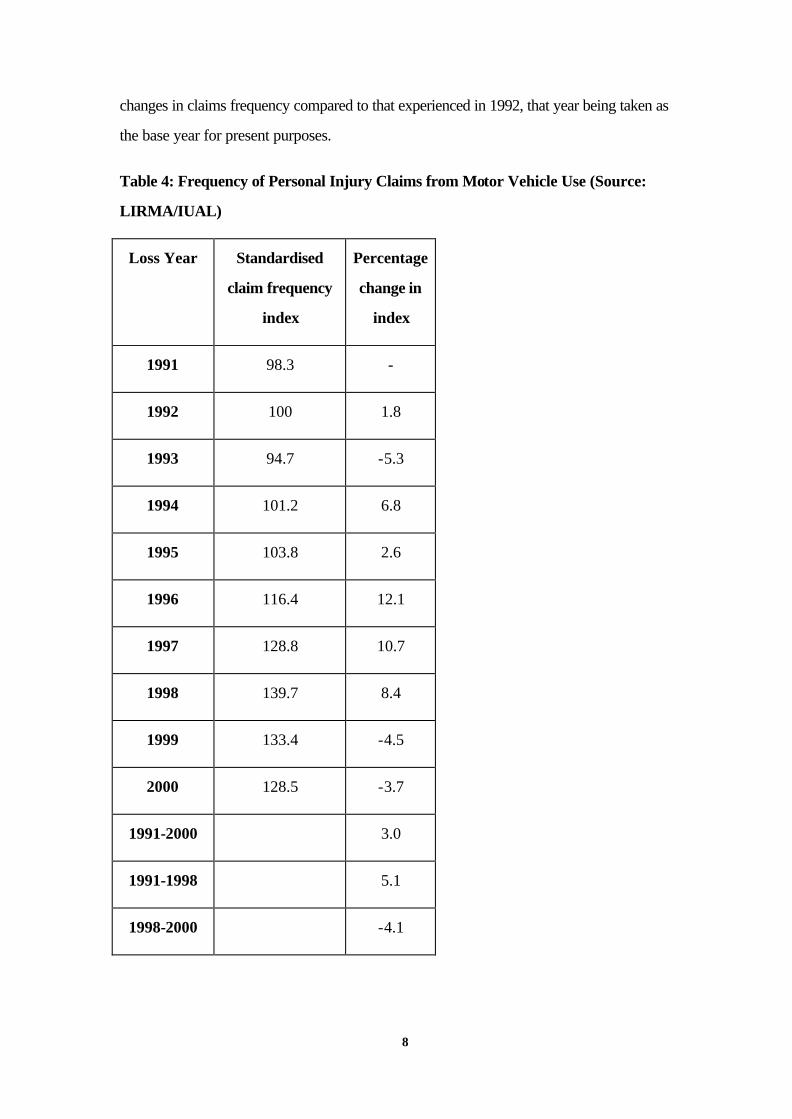
Table 4 below reveals that claim frequency - the number of claims made in relation to the
number of policies issued - increased by an average of 3 per cent a year from 1991-2000,
even though it fell by an average of 4.1 per cent a year in 1999 and 2000. The fall was due
to a decline in very small claims. The standardised index in the below table shows the
11 London International Insurance and Reinsurance Market Association (LIRMA), UK Bodily Injury
Awards Study, LIRMA, London, 1997, International Underwriting Association of London (IUAL),
Second UK Bodily Injury Awards Study, IUAL, London, 1999), and IUAL, Third UK Bodily Injury
Awards Study, IUAL, London, 2003.
8
changes in claims frequency compared to that experienced in 1992, that year being taken as
the base year for present purposes.
Table 4: Frequency of Personal Injury Claims from Motor Vehicle Use (Source:
LIRMA/IUAL)
Loss Year Standardised
claim frequency
index
Percentage
change in
index
1991 98.3 -
1992 100 1.8
1993 94.7 -5.3
1994 101.2 6.8
1995 103.8 2.6
1996 116.4 12.1
1997 128.8 10.7
1998 139.7 8.4
1999 133.4 -4.5
2000 128.5 -3.7
1991-2000 3.0
1991-1998 5.1
1998-2000 -4.1
9
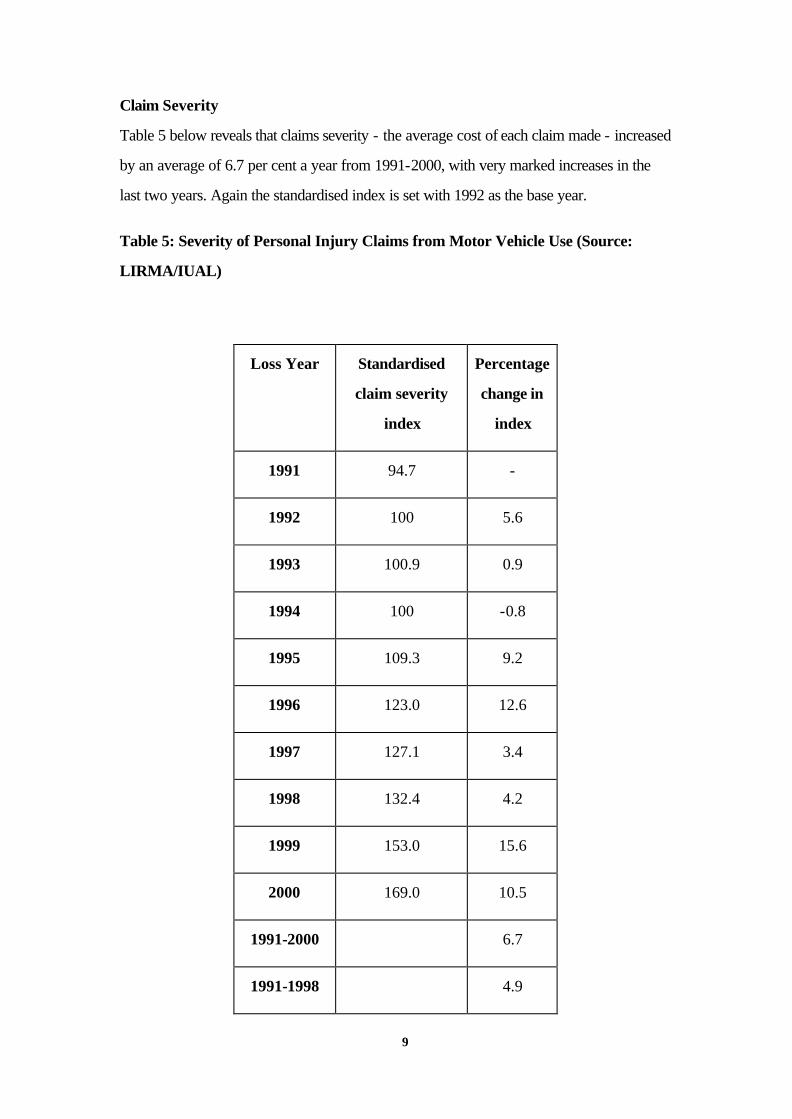
Claim Severity
Table 5 below reveals that claims severity - the average cost of each claim made - increased
by an average of 6.7 per cent a year from 1991-2000, with very marked increases in the
last two years. Again the standardised index is set with 1992 as the base year.
Table 5: Severity of Personal Injury Claims from Motor Vehicle Use (Source:
LIRMA/IUAL)
Loss Year Standardised
claim severity
index
Percentage
change in
index
1991 94.7 -
1992 100 5.6
1993 100.9 0.9
1994 100 -0.8
1995 109.3 9.2
1996 123.0 12.6
1997 127.1 3.4
1998 132.4 4.2
1999 153.0 15.6
2000 169.0 10.5
1991-2000 6.7
1991-1998 4.9

10
1998-2000 13.0
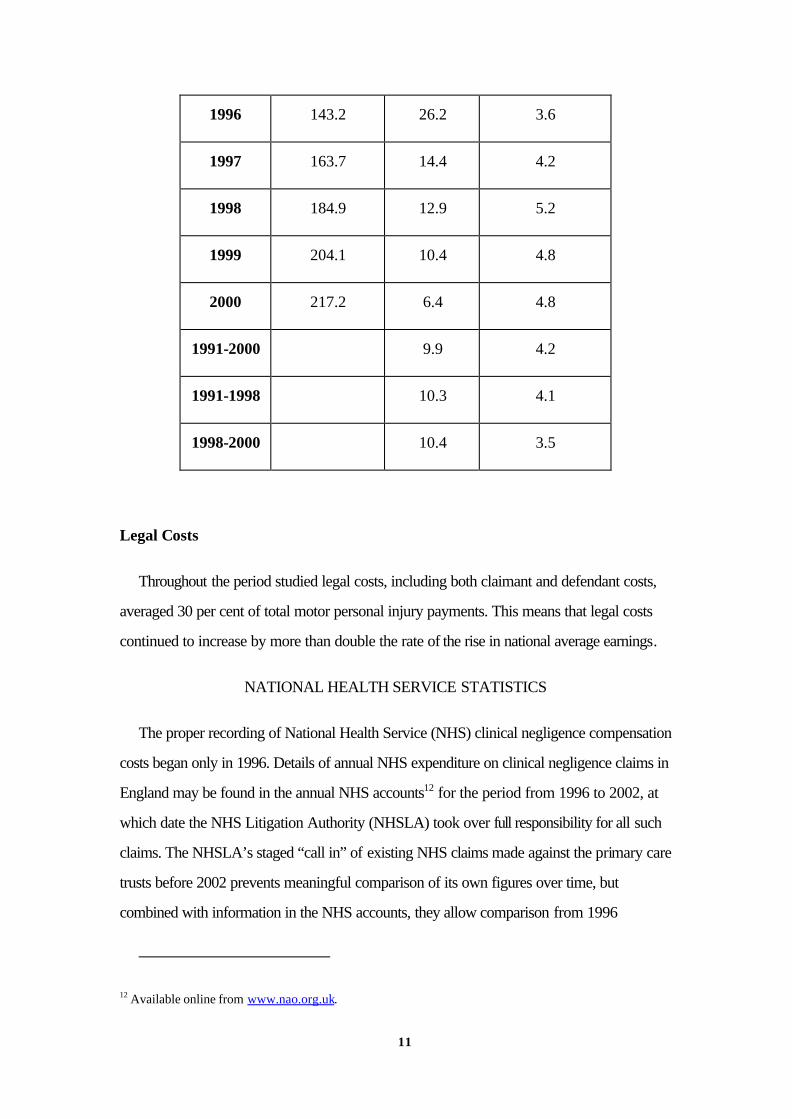
Burning Costs
Burning cost is a term widely used in the insurance industry to represent the claim cost
per policy. It is made up of a combination of claim frequency and claim severity, that is, in
effect Tables 4 and 5 above. Table 6 below again uses 1992 as the base year and reveals
that the cost per policy increased by an average of 9.9 per cent a year from 1991 - 2000,
as against an average rise in national earnings of 4.2 per cent. As compared with 1991,
claims cost in 2000 had risen by 133 per cent compared to a rise in national average
earnings of 45 per cent. However, from 1998 the rise in burning costs was much less steep
and was only 6.6 per cent in 2000. This reflected the drop in claim frequency, although
claim severity continued to increase. Although claim frequency declined in these later years,
it was still 29 per cent higher than it was in 1992.
Table 6: Burning Cost of Personal Injury Claims from Motor Vehicle Use (Source:
LIRMA/IUAL)
Loss Year Standardised
burning costs
index
Percentage
change in
index
Percentage
change in
national average
earnings index
1991 93.0 - -
1992 100 7.5 6.0
1993 95.5 -4.5 3.1
1994 101.2 5.9 3.6
1995 113.4 12.1 3.1
11
1996 143.2 26.2 3.6
1997 163.7 14.4 4.2
1998 184.9 12.9 5.2
1999 204.1 10.4 4.8
2000 217.2 6.4 4.8
1991-2000 9.9 4.2
1991-1998 10.3 4.1
1998-2000 10.4 3.5
Legal Costs
Throughout the period studied legal costs, including both claimant and defendant costs,
averaged 30 per cent of total motor personal injury payments. This means that legal costs
continued to increase by more than double the rate of the rise in national average earnings.
NATIONAL HEALTH SERVICE STATISTICS
The proper recording of National Health Service (NHS) clinical negligence compensation
costs began only in 1996. Details of annual NHS expenditure on clinical negligence claims in
England may be found in the annual NHS accounts12 for the period from 1996 to 2002, at
which date the NHS Litigation Authority (NHSLA) took over full responsibility for all such
claims. The NHSLA’s staged “call in” of existing NHS claims made against the primary care
trusts before 2002 prevents meaningful comparison of its own figures over time, but
combined with information in the NHS accounts, they allow comparison from 1996
12 Available online from www.nao.org.uk.
12
onwards of the total compensation costs in England. From 2002 the NHSLA statistics
provide a complete picture of clinical negligence claims volumes and costs.
Before 1996 the picture is incomplete, with a limited amount of information available in
official reports,13 answers to parliamentary questions, and various independent studies.14 It is
difficult to make comparisons because of the differences in the methods employed, but some
information about trends may be drawn from Fenn et al.’s longitudinal study of negligence
claims arising from treatment in the Oxfordshire health authority area from the early 1980s to
1999.15
Number of Claims
There has undoubtedly been a very great increase in clinical negligence claims in the last
30 or so years. The Pearson Commission reported in 1978 that the number of claims of
malpractice against doctors and dentists (including those in private practice) had been
running at about 500 a year.16 By 1990-91, the estimated number of new medical
negligence claims made against the NHS in England had risen to between 5419 and 6979
13 National Audit Office, Handling Clinical Negligence Claims, HC 403, Session 2000-2001, The
Stationery Office, London, 2001, and Department of Health, Making Amends: A consultation paper
setting out proposals for reforming the approach to clinical negligence in the NHS (A report by the
Chief Medical Officer) , Department of Health Publications, London, 2003.
14 See C Ham, R Dingwall, P Fenn and D Harris, Medical Negligence: Compensation and
Accountability, King’s Fund Institute, London, 1988; P Fenn, D Hermans and R Dingwall, ‘Estimating
the cost of compensating victims of medical negligence’ (1994) 309 BMJ 389, and P Fenn, S Diacon, A
Gray, R Hodges, N Rickman, ‘Current cost of medical negligence in NHS hospitals: analysis of claims
database’ (2000) 320 BMJ 1567. The earlier research, and more recent NHSLA data, are considered
further in P Fenn, A Gray and N Rickman, ‘The Economics of Clinical Negligence Reform in England’
(2004) 114 The Economic Journal F272.
15 Fenn, Diacon et al, above n 14.
16 Pearson, above n 2, vol 1, para 1318.
13
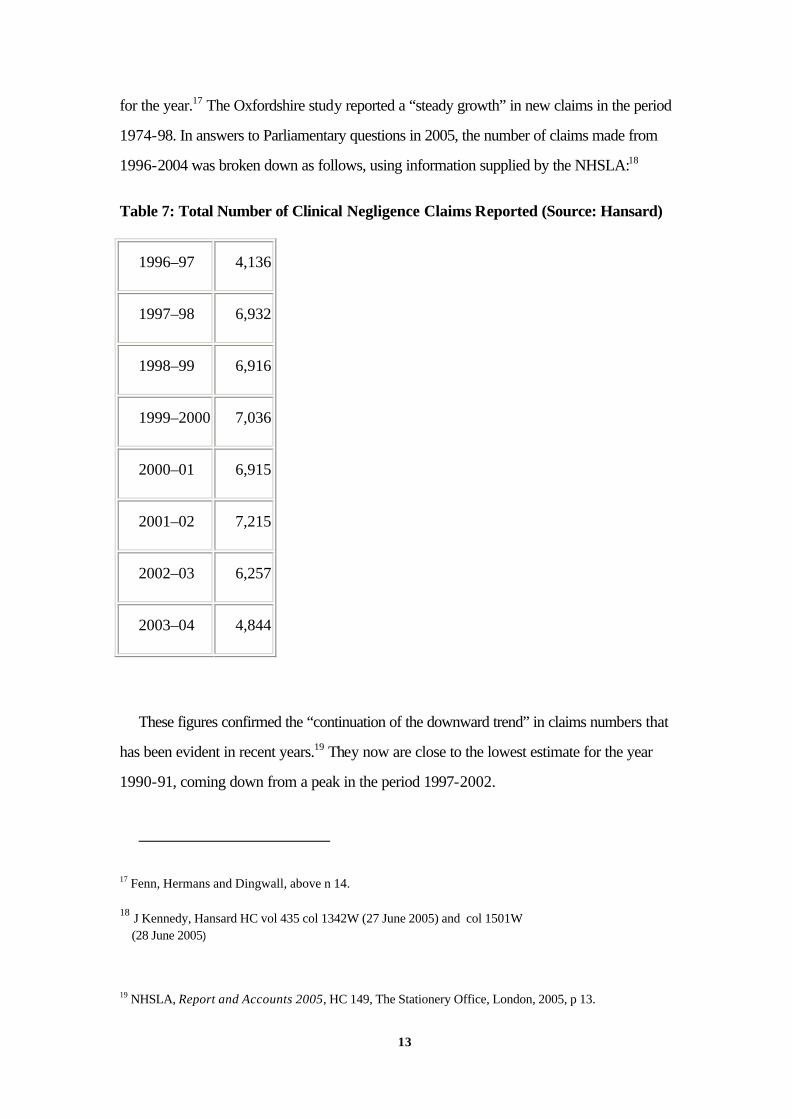
for the year.17 The Oxfordshire study reported a “steady growth” in new claims in the period
1974-98. In answers to Parliamentary questions in 2005, the number of claims made from
1996-2004 was broken down as follows, using information supplied by the NHSLA:18
Table 7: Total Number of Clinical Negligence Claims Reported (Source: Hansard)
1996–97 4,136
1997–98 6,932
1998–99 6,916
1999–2000 7,036
2000–01 6,915
2001–02 7,215
2002–03 6,257
2003–04 4,844
These figures confirmed the “continuation of the downward trend” in claims numbers that
has been evident in recent years.19 They now are close to the lowest estimate for the year
1990-91, coming down from a peak in the period 1997-2002.
17 Fenn, Hermans and Dingwall, above n 14.
18 J Kennedy, Hansard HC vol 435 col 1342W (27 June 2005) and col 1501W (28 June 2005)
19 NHSLA, Report and Accounts 2005, HC 149, The Stationery Office, London, 2005, p 13.
14
Claims Settled and Closed
The NHSLA’s analysis of all clinical negligence claims handled since its inception in 1995
reveals that 45 per cent were abandoned by the claimant and 52 per cent settled out of
court; 2 per cent were concluded by a court judgment for the claimant (including court
approvals of settlements negotiated on behalf of children); and 0.6 per cent by judgment for
the NHS.20 In 2004-05 the NHSLA “closed” a total of 8,393 claims (irrespective of
whether or not they closed with the payment of damages or costs).21 Assuming half or more
involved the payment of damages, the number of “settled” claims (including those resolved in
court) has clearly risen significantly from the early 1990s, when it was reported that 1618
and 1751 claims had been settled in 1990-91 and 1991-92 respectively.22 This is further
confirmed by the finding of the Oxfordshire study that the number of closed claims more
than doubled in the period 1990-98, with the rate of closed cases per 1000 finished
consultant episodes rising from 0.46 in 1990 to 0.91 in 1998, a rate of increase of about 7
per cent a year.23 These increases are not matched by comparable increases in the number
of new claims over that period, and it seems likely that they reflect a rise in the number of
new claims made before 1990 but taking several years to settle.
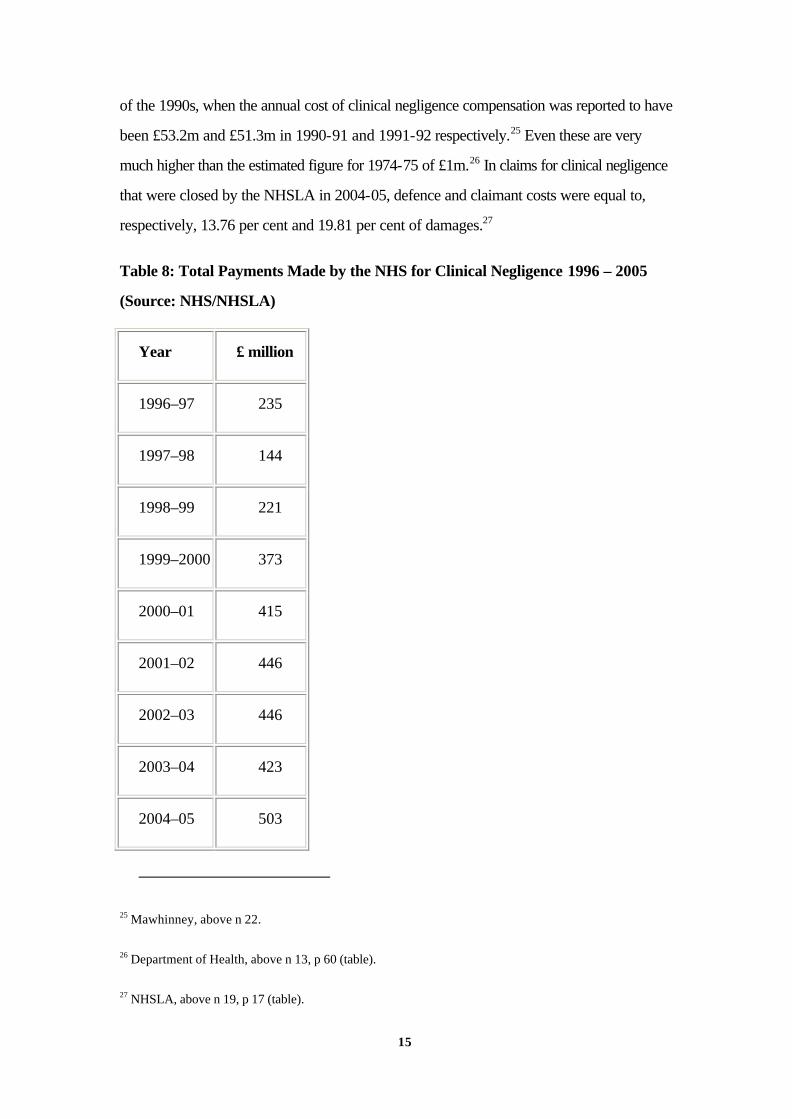
Cost of Claims
A complete picture of the NHS’s annual expenditure on clinical negligence compensation
in England is available from 1996.24 This reveals a general upwards trend up to and
including the year 2004-05. The figures are startlingly higher than those available for the start
20 Figures from www.nhsla.com (accessed 10 August 2005), recalculated to exclude outstanding claims).
21 NHSLA, above n 19, p 17.
22 B Mawhinney, Hansard HC vol 239 col 538 (14 March 1994 WA). 23 Fenn, Diacon et al, above n 14.
24 Sources: NHS (England) annual accounts; NHSLA, above n 19; Department of Health, above n 13,
para 35 (table).
15
of the 1990s, when the annual cost of clinical negligence compensation was reported to have
been £53.2m and £51.3m in 1990-91 and 1991-92 respectively.25 Even these are very
much higher than the estimated figure for 1974-75 of £1m.26 In claims for clinical negligence
that were closed by the NHSLA in 2004-05, defence and claimant costs were equal to,
respectively, 13.76 per cent and 19.81 per cent of damages.27
Table 8: Total Payments Made by the NHS for Clinical Negligence 1996 – 2005
(Source: NHS/NHSLA)
Year £ million
1996–97 235
1997–98 144
1998–99 221
1999–2000 373
2000–01 415
2001–02 446
2002–03 446
2003–04 423
2004–05 503
25 Mawhinney, above n 22.
26 Department of Health, above n 13, p 60 (table).
27 NHSLA, above n 19, p 17 (table).
16
Outstanding Liabilities for Clinical Negligence
One of the most frequently misapplied statistics in the current compensation culture
debate is the annual estimate of the NHS’s outstanding liabilities for clinical negligence
(including both known and unknown but expected claims, and taking into account the
likelihood of settlement). This has risen from £3.2 billion in 1999 to £5.9 billion in 2003 and
£7.8 billion in 2004. The figures refer to liabilities that the NHS claims will arise over a long
period of time, and are very much greater than the sums that are actually paid out on an
annual basis. Estimating the cost of outstanding liabilities is an exercise that is fraught with
difficulties and the resulting figure representing a “worst case” scenario has been heavily
criticised.28 Although the estimate of outstanding liabilities is frequently cited in the press and
media, it must be handled with care. It would be quite wrong, for example, to use it to
calculate the percentage of the annual NHS budget that is currently spent on clinical
negligence compensation.
OTHER SOURCES
In addition to the three primary sources we have relied upon in this article, we have also
derived useful information from elsewhere, and it may be helpful to make a brief note of our
other sources. Statistical information about compensation claims against the Ministry of
Defence (MoD) is to be found in a report by the National Audit Office in 2003.29 Members
of the armed forces were first allowed to pursue actions for damages against the MoD in
1987,30 and the report inevitably charts a considerable rise in the volume of litigation over
28 Fenn, Diacon et al, above n 14, P Fenn, ‘Counting the Cost of Medical Negligence’ (2002) 325 BMJ
233, and Fenn, Grey and Rickman above n 14, and D Marshall, ‘Dressing Up The Figures?’ (2002) 152
NLJ 1632.
29 National Audit Office, Ministry of Defence: Compensation Claims, HC 957 Session 2002-2003, The
Stationery Office, London 2003.
30 Crown Proceedings (Armed Forces) Act 1987.
17
the period it surveys, reflecting the build up of claims from zero. Of more interest to us is the
substantial rise in MoD compensation costs – and legal costs in particular – in the four years
from 1998-1999. Legal costs as a percentage of damages rose from 14.1 per cent in 1998-
1999 to 18.5 per cent in 2001-2002.31 Confirmation that increases in legal costs have
occurred in other contexts as well is to be found in two commissioned studies by Fenn and
Rickman, dealing with low-value road traffic accident and employers’ liability claims.32
Claimants injured by uninsured or unidentified motor vehicles are able to claim
compensation from the Motor Insurers Bureau (MIB), a reserve body financed by a levy
upon all motor insurers in the market. The number of claims submitted to the MIB are
published in its annual reports.33 There has been a rise from about 40,000 in 1995 to about
75,000 in 2003. In the same period, amounts paid out to successful claimants rose from
under £100 million to almost £240 million. Another relevant source, though not strictly-
speaking a part of the tort system, is the Criminal Injuries Compensation Authority (CICA),
which reports annually on the number of applications submitted to the Criminal Injuries
Compensation Scheme.34 Since the scheme’s establishment in 1964, applications have
increased steadily every year, rising from an average of 4,000 or so in the 1960s to 15,000
in the 1970s, 35,000 in the 1980s, 70,000 in the 1990s, and around 75,000 in more recent
years. It is impossible to specify the effect on these numbers of the various changes in the
31 National Audit Office, above n 29, p 13 fig 6.
32 P Fenn and N Rickman, Costs of Low Value RTA Claims 1997-2002: A Report Prepared for the Civil
Justice Council, 2003, and P Fenn and N Rickman, Costs of Low Value Employers’ Liability Claims
1997-2002, Department for Constitutional Affairs, London, 2003.
33 The MIB’s most recent annual reports are available from www.mib.org.uk. See also Association of
British Insurers, Response of the Association of British Insurers on behalf of the MIB to the
Greenaway Review of Compulsory Motor Insurance and Uninsured Driving, 2004.
34 The Authority’s most recent annual reports are available from www.cica.gov.uk. See also National
Audit Office, Compensating Victims of Violent Crime , HC 398 Session 1999-2000, The Stationery
Office, London, 2000.
18
scope of the scheme, and the entitlements available under it, that have taken place over the
scheme’s history.
None of the above sources of information about personal injury claims provides anything
like as broad or significant a data set as those derived from our three principal sources, but
they nevertheless provide useful supporting evidence of various trends that are the subject of
our analysis below.
ANALYSIS
THE FREQUENCY OF CLAIMS
According to the CRU statistics, the total number of personal injury claims has risen in
three out of the last four years for which statistics are available. However, it would be
simplistic to treat this as evidencing an upwards trend in the volume of personal injury
litigation, for the reasons set out below. Firstly, there has been no growth in the number of
claims of accidental injury in the last five years or so. This is broadly substantiated by each
of our three principal sources. In fact, there has been, if anything, a downwards trend in the
volume of new accident claims.
Secondly, by way of contrast there have been wild fluctuations in the number of disease
claims in the same period, and these have meant that the total number of personal injury
claims has shown certain year-on-year increases even where the number of accident claims
has declined. At the same time, the number of new disease claims was hugely inflated in the
period 1999-2004 by the Coal Health compensation schemes for vibration white finger and
respiratory disease which together accounted for almost all new disease claims notified to
CRU in that period. These claims, many referring to events several decades ago, have
significantly skewed total personal injury claims figures in recent times, particularly in the run-
up to the schemes’ cut off dates in 2002 and 2004. Since 1999 some 750,000 of these
coalmining claims have been registered. They have been said to constitute “the biggest
19
personal injury schemes in British legal history and possibly the world”.35 To date, a total of
£2.8 billion has been paid in compensation, with many cases yet to be finally resolved and it
is estimated that the total compensation bill will exceed £7.5 billion. With no new claims
now being registered it can be anticipated that there will be a substantial decline in the
number of disease claims notified to CRU.
Although recent years have shown a degree of stability in the total number of claims, this
follows a substantial rise in claims in preceding years: numbers increased considerably in the
period following Pearson and the Civil Justice Review. The Pearson Commission estimated
that in 1973 there were approximately 250,000 personal injury claims pursued through the
tort system.36 The Civil Justice Review estimated that there were approximately 340,000
claims in 1988.37 Since then, as shown by the statistics in the first part of this article, total
claims numbers have continued to rise, though they seem now to have stabilised around
700-750,000 per year (approximately 600,000 are for injuries by accident).38 But this
pattern is not apparent in every category of claim. The number of employers’ liability claims,
for example has fallen well under 100,000 a year, reflecting the decline of heavy industry
and manufacturing processes traditionally associated with illness and injury caused by work.
What is noticeable, however, is the dramatic rise in the number of other types of claims:
motor vehicle claims now run at close to four times the 1973 figure; public liability claims
35 http://www.dti.gov.uk/coalhealth/01.htm
36 Pearson, above n 2, vol 2, para 59. The estimate is based on an analysis of all personal injury claims
(8,275 in total) received by insurers who belonged to the British Insurance Association (BIA) in a
four-week period in November 1973, combined with data from court records and other sources. BIA
members accounted at that time for about 88 per cent of all personal injury claims in tort, and 94 per
cent of their total value. See Pearson, above n 2, vol 2, ch 22.
37 Civil Justice Review, above n 4, para 391. This estimate is only stated, with no indication of its factual
substratum, and does not appear to be derived from the Review’s own commis sioned research into
personal injury claims: see Inbucon, above n 4.
38 A similar long term trend is also evident in the number of claims processed each year by the Criminal
Injuries Compensation Authority.
20
(not recorded as such by Pearson) are at least twice as numerous as in 1973, and clinical
negligence claims are about 100 times the 1973 level (albeit from a much lower starting
point).
The increased frequency of claims since Pearson and prior to the current period of
relative stability is likely to be attributable to a wide variety of factors. At one end of the
spectrum, increased social understanding of injuries and their causes has meant that we are
more likely to characterise symptoms as injuries and to attribute responsibility for that injury
to another individual or entity. For example, it is now common knowledge that whiplash can
result from a road traffic accident and indeed insurers have suggested that as many as 80 per
cent of all road accident claims involve a claim for whiplash injury.39 At the other end of the
spectrum, there has been an extension in the number of people who can qualify for
compensation through the tort system. This is in part a consequence of legal developments.
For example, liability for psychiatric harm, consequent upon involvement in or witnessing an
accident has been widened in crucial respects,40 and the Motor Insurers’ Bureau uninsured
drivers’ agreement has extended the categories of claims for which it (and indirectly the
insurance industry) is responsible.41 In addition, the Crown Proceedings (Armed Forces)
Act 1987 allowed service personnel to claim for the first time against the Ministry of
Defence. As a result in 2001-2002 there were 7,700 claims against the Ministry of
Defence, costing a total of £97 million, including legal fees, the amount having risen almost
fourfold from £25 million in 1992-93.42 Revealingly, the MoD was then facing claims from
2,000 former personnel as a result of alleged negligence in preventing, managing or treating
psychological reactions to combat since 1969.
39 Datamonitor, UK Personal Injury Litigation 2003 - Where Does the Industry Go From Here? London,
2003 p 45 and Datamonitor, UK Personal Injury Litigation - Trial and Error London, 2004 p 38.
40 For example, in McLoughlin v O’Brian [1983] AC 410 and Page v Smith [1996] 1 AC 155.
41 Both the uninsured and untraced drivers agreements have been extended in recent years. The
changes are noted on the MIB website at http://www.mib.org.uk/Default.htm
42 National Audit Office, above n 29.
21
It is not only, however, that the law has expanded but also that the increased
specialisation of lawyers in personal injury claims has enabled them to become increasingly
adept at identifying and developing grounds for pursuing claims within the current legal
framework. The founding of the Association of Personal Injury Lawyers in 1990 and its
subsequent activity reflects the increasing abilities and resources of claimant lawyers. The
Association now has over 5,250 members, employs 28 people, and has a turnover of £1.94
million. It helps co-ordinate claims and share expertise. This has undoubtedly facilitated a
number of prominent group actions in recent years.
The reasons underlying our increased propensity to respond to injury by seeking legal
redress are likely to be numerous, complex and inter-related. Perhaps the most important
factor is the increased social awareness of the possibility of claiming compensation following
an accident. Both the Pearson Commission and the Oxford survey found that many injured
people did not claim because they did not appreciate that they could do so.43 As
knowledge has increased, therefore, so has the number of people who can identify that they
have a potential claim. Increased knowledge does not just increase our ability to identify a
claim, however, but may also increase our willingness to claim. Lloyd-Bostock’s research in
the context of the Oxford survey suggested that once we are aware that compensation is
available, we become more likely to interpret and reinterpret events in such a way as to
justify claiming.44 Increased levels of social awareness may also raise our expectations of
recovering compensation following an injury, thereby increasing the sense of entitlement to
compensation, whilst at the same time creating the sense that claiming is acceptable and
routine and not a privilege to be rarely used. Greater social awareness provides, therefore,
both the opportunity and the motivation for greater levels of claiming. Our increased
assertiveness is unlikely, however, just to stem from increased social awareness and is
probably also due to changes in our relationships with, and in our expectations of, each
43 Pearson, above n 2, vol 2, table 84 and Harris et al, above n 3, pp 70-6.
44 S Lloyd-Bostock, ‘Fault and Liability for Accidents: The Accident Victim’s Perspective’, in Harris et
al, above n 3.
22
other, our employers and the state. Another possible factor, for which we have not been
able to test, is changes over time in the value of and entitlement to social security benefits.
It must be emphasised that, contrary to popular belief, the introduction of conditional fee
agreements (CFAs) and the advent of widespread advertising by the claims industry have
not increased the frequency of claims to any significant extent. CFAs allow lawyers to act
for personal injury claimants on a no-win no-fee basis. This means that if the claim is
unsuccessful, the claimant is not liable to pay his or her own lawyer for the work done.
However, liability to pay the costs of the other side remains, and to protect against this,
claimants entering CFAs usually purchase after-the-event (ATE) legal expenses insurance.
Where the claim is successful, although the claimant is liable to pay his or her own lawyer for
the work done plus a ‘success fee’ for taking the risk of losing the case, these costs
(including the success fee) can be recovered from the defendant. The financial risks of
claiming have therefore been substantially reduced.
The use of CFAs became widespread after April 2000 with the implementation of the
Access to Justice Act 1999. The Act withdrew legal aid for the majority of personal injury
claims on the assumption that they could be funded by CFAs instead. The no-win no-fee
no-risk aspect of CFAs is perceived to have led to a ‘no reason not to sue’ attitude. As
noted above, however, the frequency of accident claims has remained relatively stable since
April 2000. It is true that CFAs were introduced in 1995 to facilitate access to justice for
those who neither qualified for legal aid nor could afford to fund their claims privately. They
may, therefore, have contributed to the long-term increase in the frequency of claims evident
before 1997-1998. CFA studies have suggested, however, that the take up of CFAs was
relatively slow before this date.45 Similarly, lawyers have been able to advertise their
services since the mid-1980s and their advertising is likely to account for increased levels of
45 S Yarrow, The Price of Success: Lawyers, Clients and Conditional Fees, Policy Studies Institute,
London, 1997, J Shapland et al, Affording Civil Justice, Law Society, London, 1998, and P Fenn, Gray,
N Rickman and Carrier, The Impact of Conditional Fees on the Selection, Handling and Outcomes of
Personal Injury Cases, Lord Chancellor's Department, 2002.
23
social awareness.46 Widespread advertising in national papers, on television and on the
radio has, however, been a significant feature since the mid-to-late 1990s with the rapid
growth of claims intermediaries. Claims advertising may, therefore, have contributed to the
upward trend in claims evident before 1997-1998 but it has not led to a continuing increase
in the frequency of claims.
THE COST OF CLAIMS
The cost of individual claims has risen sharply in recent years and appears to be due to
increases in both damages paid and legal costs incurred. Damages are likely to have
increased for a number of reasons:
• Firstly, the decision in Heil v Rankin increased damages for non-pecuniary loss
in order to bring such awards in line with inflation.47 The effect of this judgment
was to increase the highest levels of award for pain and suffering by one third
from £150,000 to £200,000. Awards below £10,000 were not increased but
tapered increases were applied for injuries falling between £10,000 and the
highest awards. The Department of Health estimated that, because of the
disproportionate number of high value claims brought against the NHS, this
judgment would cost it £74 million in future liabilities.48 Given that the vast
majority of general claims in tort are below £10,000, however, the impact of
Heil v Rankin should not be exaggerated.49
• Of much more importance is the second reason. This is that damages have
increased as a result of the reduction in the discount rate applied to future
46 Solicitors were first allowed to advertise in 1984, after amendment of the Law Society’s Practice Rules.
47 [2001] QB 272
48 Department of Health, above n 13.
49 R Lewis, ‘Increasing the Price of Pain’ (2001) 64 MLR 100.
24
pecuniary losses. The rate makes allowance for the investment return upon lump
sum damages. For thirty years prior to 1998 the rate was 4.5 per cent but this
was then reduced by the House of Lords in Wells v Wells to 3 per cent.50 In
2001 the Lord Chancellor used his power to reduce the rate still further to 2.5
per cent.51 As a result of the last change alone, the NHS predicted an increase in
their liabilities of £100 million a year, being about a quarter of its total
expenditure on damages for clinical negligence at that time. Apart from a £4
million increase in the value of MoD claims, other Government departments and
local authorities predicted that the effect would be negligible as they mainly dealt
with relatively minor slips and trips. Although the effect upon the insurance
industry was substantial, the Association of British Insurers was much more
conservative in its estimates than the NHS. It predicted an increase of only £57
million in the annual bill,52 even though it pays out six times as much in claims for
damages over £100,000 compared to the NHS.53
• Thirdly, the use of the Ogden tables,54 which was approved by the House of
Lords in Wells v Wells, has increased the multipliers applied in claims and,
therefore, the level of damages paid. The multipliers in the Ogden tables provide
an aid for those assessing the current capital value of future pecuniary losses or
expenses on the basis of various assumptions, including rates of mortality. Whilst
they used to be based on historical mortality rates, they are now based on
reasonable estimates of future mortality. In effect, the forecast that those living
50 [1999] 1 AC 345.
51 Damages (Personal Injury) Order, SI 2001/2301.
52 Department for Constitutional Affairs, Damages Act 1996: Analysis of the Impact of the Prescribed
Discount Rate of 2.5 per cent , 2002.
53 Lord Chancellor’s Department, Courts Bill: Regulatory Impact Assessment, 2002.
54 Government Actuary’s Department, Actuarial Tables For Use In Personal Injury And Fatal Accident
Cases, 5th ed, The Stationery Office, London, 2004 (“the Ogden Tables”).
25
today will survive longer than their forebears increases the cost of compensating
them for life.
• Fourthly, damages have also increased due to the introduction of legislation
which has considerably increased compensators’ liability to pay for the claimant’s
social security benefits and NHS hospital charges. Since 1990 the state has been
able to recover benefits paid to the claimant as a result of an accident in which
damages for personal injury are paid. The scheme, administered by CRU, was
extended in 1997 so as to apply to all cases no matter what the level of damages
involved.55 Two years later another Act introduced a similarly centralised and
efficient system for the recovery of NHS charges in road traffic accident claims.
Prior to this, NHS costs were recovered by individual hospitals many of which
did not use their powers and recovered very little. This scheme has also since
been extended. Fixed sums have been set for the recovery of ambulance and
care costs, and these will soon apply to all types of accident.56
• Finally, a large part of the damages award reflects income. Not only lost wages
themselves but also those costs of care which reflect income levels have
increased at rates well above inflation in prices. On average, real earnings growth
has exceeded price inflation by almost two per cent a year for almost the last
sixty years.57 As a result, it is to be expected that damages in serious injury cases
will rise in real terms, but not that they will increase at more than double the rise
in national earnings as the insurers bodily injury study showed.
In our study of the figures produced both by the insurance industry and in relation to the
NHS, legal costs amount to approximately 30 per cent of the total tort payments. They have
55 The Social Security (Recovery of Benefits) Act 1997. R Lewis, above n 10.
56 The Road Traffic (NHS Charges) Act 1999 was extended by Part III of the Health and Social Care
(Community Health and Standards) Act 2003.
57 The Ogden Tables, n 54, Appendix A para 12.
26
continued to increase in line with the level of damages by more than double the rate of the
rise in national earnings. It is frequently alleged that the continuing increases are due to the
expansion of CFAs and claimants’ ability to recover success fees and ATE insurance
premiums. However, this remains a matter of controversy, and for present purposes the
most that can be said is that there appears to be some correlation between the level of
damages and legal fees.58
CONCLUSION
Although this article has highlighted only the main sources of information concerning
personal injuries in the UK, these sources have often been overlooked by those who write
on the law of tort. They are obviously of fundamental concern in any debate about the
compensation culture, but they also inform many issues concerning the scope and operation
of the narrow liability rules on which most writers focus. This study builds on our conviction
that tort lawyers have a responsibility to inform themselves of the practical operation of the
caselaw and statutory principles that they study, and their effects.
The conclusions we draw from the evidence we have presented can be summarised as
follows. First, there is no evidence that the tort system has been flooded with an increasing
number of personal injury claims in recent years. In fact the number of claims has been
relatively stable since at least 1997-1998, the first year for which reliable CRU statistics are
available. The swelling of the headline total claims figure from 2003 to 2005 is entirely due
to a surge in disease claims prior to the closure of the Coal Health compensation schemes.
In the same years, the number of accident claims actually fell. Nor can it be said that the
introduction of CFAs and advertising for legal services has led to any measurable increase in
claims during this period.
58 A Morris, ‘Conditional Fee Agreements in Northern Ireland: Godsend or Gimmick?’ (2005) 56 NILQ 38.
27
Secondly, and by way of contrast, consideration of a longer timeframe reveals that there
has undoubtedly been a very substantial increase in the number of personal injury claims.
Comparison of the CRU figures with the Pearson Commission’s estimates from the 1970s
shows an approximately three-fold rise in total claims numbers over 30 years, though not all
categories of claim follow this pattern. Unfortunately there is no reliable data source which
tracks the increase from year to year and therefore no means of determining whether it
proceeded by steady increments or in fits and starts as a result of particular causative
factors. It must be emphasised, however, that a mere rise in claims numbers is insufficient to
establish the existence of a damaging compensation culture, as this insinuates that a
significant proportion of claims are fraudulent, exaggerated or otherwise lacking in merit. We
are not aware of any data that would support such a contention. The rise in claims numbers
from the 1970s is equally consistent with there having been significant under-claiming at that
time, with a subsequent increase in the proportion of those with genuine claims who chose to
initiate legal action.
Finally, the average cost of compensation claims has undoubtedly risen in recent years at
considerably more than the rate of inflation, whether in prices or earnings. This has been
caused not only by changes in the legal rules governing the calculation of damages, but also
by increases in lawyers’ costs, and by the general increase in income levels. Much of the
current debate about compensation culture stems from this rise in the cost of individual
claims. Overall, what cannot be contested is that that debate would be better informed if
attention were paid to the statistical information we already have about how the tort system
actually operates.


![TORT LAW AND MORAL LUCK - Cornell Law · PDF file2007] TORT LAW AND MORAL LUCK 1127 our claims about tort law and their claims about moral responsibility. See Nagel,](https://img.pdfslide.net/doc/110x75/5a7b9dc27f8b9a66798c26e7/tort-law-and-moral-luck-cornell-law-tort-law-and-moral-luck-1127-our-claims-about.jpg)