Embed Size (px)
Citation preview
TorusVis: A Topology Data Visualization Tool
Omar Padron, Dave SemeraroNational Center for Supercomputing Applications
University of Illinois at Urbana ChampaignUrbana, IL USA
{opadron, semeraro}@illinois.edu
Abstract—The ever-growing scope of extreme-scale super-computers requires an increasing volume of component-localmetrics to better understand their systemic behavior. Thecollection and analysis of these metrics have become data-intensive tasks in their own right, the products of whichinform system support activities critical to ongoing operations.With recent emphasis being placed on topology-awareness asa step towards better coping with extreme scale, the ability tovisualize complex topology data has become increasingly valu-able, particularly for the visualization of multidimensional tori.Several independent efforts to produce similar visualizationsexist, but they have typically been in-house developments tailor-made for very specific purposes; and not trivially applicableto visualization needs not featured among those purposes.In contrast, a more general-purpose tool offers benefits thatease understanding of many interrelated aspects of a system’sbehavior, such as application performance, job node placement,and network traffic patterns. Perhaps more significantly, sucha tool can offer analysts insight into the complex topologicalrelationships shared among these considerations; relationshipsthat are often difficult to quantify by any other means.
We present TorusVis, a general-purpose visualization toolapplicable to a wide variety of topology-related data presenta-tion scenarios. Its general-purpose software architecture lendsitself well to rapid prototyping of various data presentationconcepts as well as publishing fully featured visualizations.We describe several key design elements and implementationstrategies, and how they strike a balance between usability,generality, and simplicity. Furthermore, we present use casestudies where the capabilities available in TorusVis aided un-derstanding of system behavior in ways not possible, otherwise.
Keywords-visualization; performance analysis; system moni-toring
I. INTRODUCTION
System monitoring is an absolutely vital task for effec-tively operating HPC resources. Whether they are supportstaff helping users optimize their applications, maintenancepersonnel detecting and resolving issues, or administratorsreconfiguring system behavior, detailed system metrics em-power both operators and users to maximize the productivevalue of their computing resources. As the capabilities ofmodern systems are pushed further towards exascale, so tooare the complexities involved with the collection, analysis,and representation of operational metrics data.
For example, the placement of applications on a sys-tem’s compute network can give clues about application
performance. Information about which nodes are used by anapplication, the placement of those nodes on the communi-cation fabric, the relative location of other applications, andthe relative location of service nodes can be used to bettercharacterize application performance and provide insight onthe modifications best suited for maximizing it. Applicationplacement and performance data can be further augmentedwith system data (e.g. from event logs) and better guidediagnostic efforts.
All of this information is readily available on most HPCsystems, but in addition to the growing costs of collecting,storing, and curating it; HPC support staff are faced withthe challenge of representing analysis results in a formaccessible by human comprehension. One natural choice isan interactive 3D visualization where the system topologyis represented by a graph mesh whose visual characteristics,such as node color, size, and shape, are modulated to conveythe operational data of interest to an analyst.
In this paper, we discuss the topology data visualizationwork performed at NCSA in support of the Blue Watersproject. We present several realized usage scenarios anddiscuss how our early software prototypes empowered oper-ations staff to better understand system behavior and appli-cation performance. We also discuss some hypothetical ca-pabilities for other anticipated use cases, and their potentialvalue to the HPC community. This potential motivates ourrecent efforts to channel the development experiences gainedinto a new modular and general-purpose topology datavisualization software library we have named “TorusVis”.We briefly outline the core software design of TorusVis, andconclude with our future plans, which include releasing itfor the community under an open-source license.
II. CASE STUDIES
The display of the placement of user jobs and systemresources in relation to the communication topology hasa number of uses. For example, job performance may beimpacted by the location of the job nodes in relation to eachother and system resources. A variety of information can bedisplayed in addition to just node placement. Network traffic,for example, is an important metric that, if visualized overtime on the network can reveal patterns that may aid the
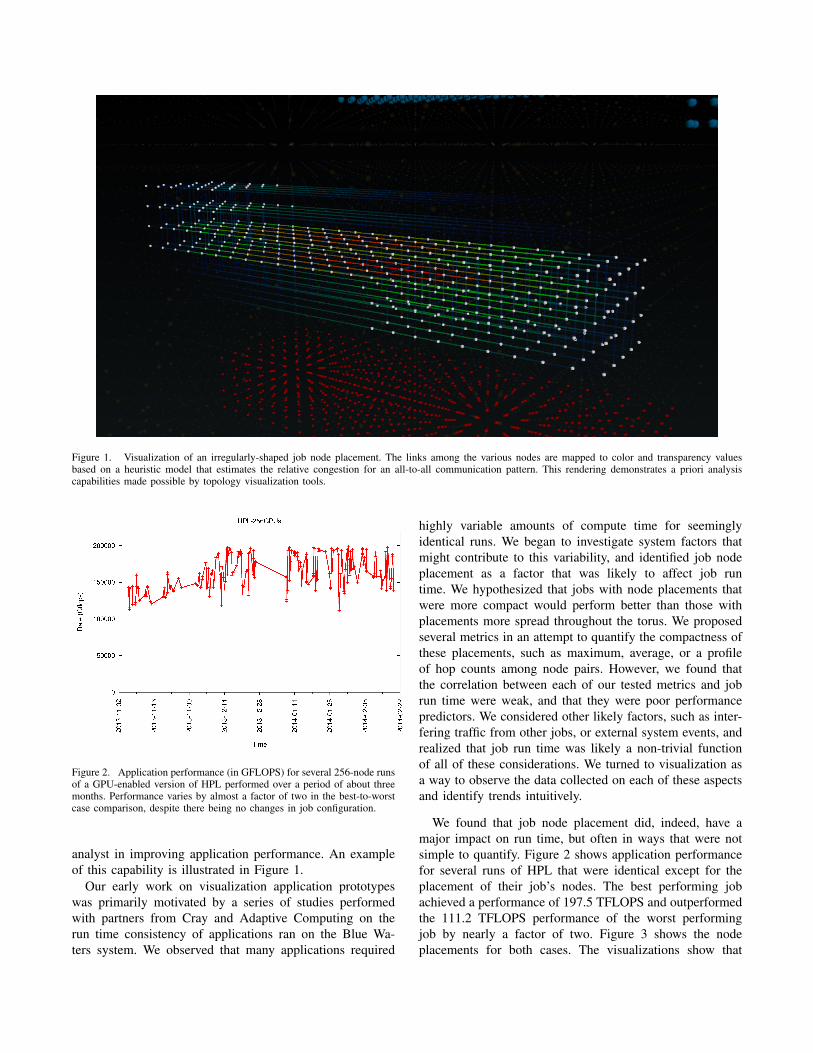
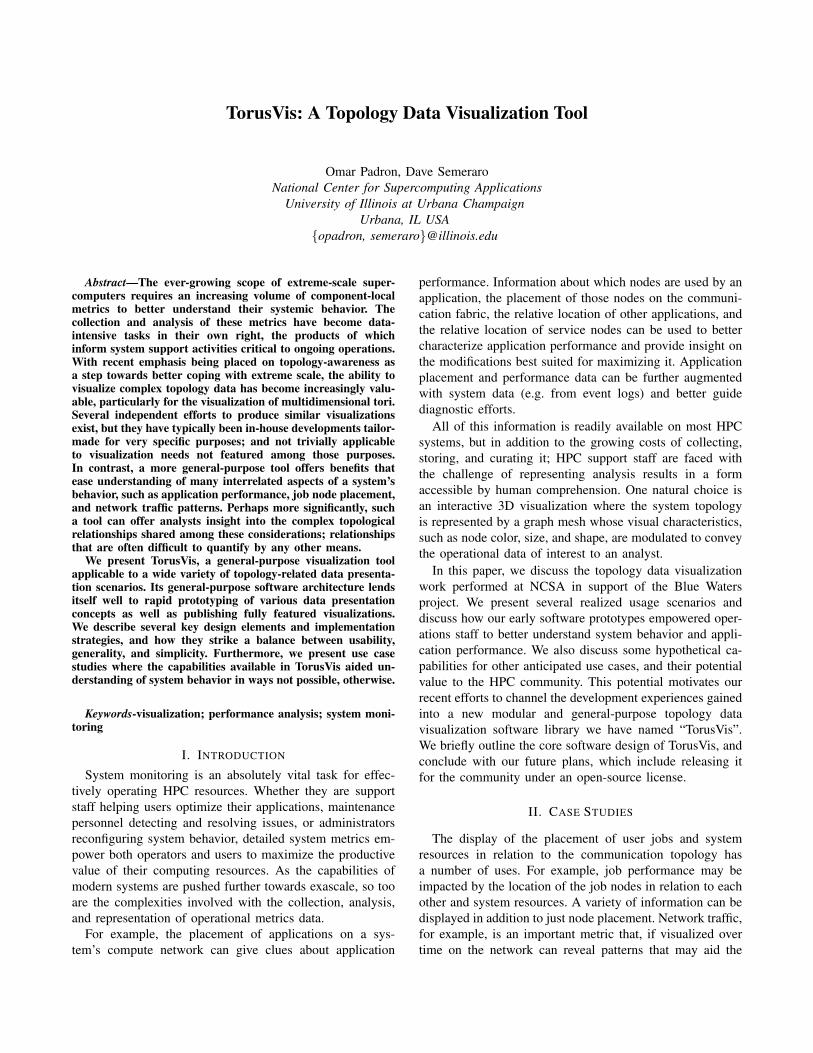
Figure 1. Visualization of an irregularly-shaped job node placement. The links among the various nodes are mapped to color and transparency valuesbased on a heuristic model that estimates the relative congestion for an all-to-all communication pattern. This rendering demonstrates a priori analysiscapabilities made possible by topology visualization tools.
Figure 2. Application performance (in GFLOPS) for several 256-node runsof a GPU-enabled version of HPL performed over a period of about threemonths. Performance varies by almost a factor of two in the best-to-worstcase comparison, despite there being no changes in job configuration.
analyst in improving application performance. An exampleof this capability is illustrated in Figure 1.
Our early work on visualization application prototypeswas primarily motivated by a series of studies performedwith partners from Cray and Adaptive Computing on therun time consistency of applications ran on the Blue Wa-ters system. We observed that many applications required
highly variable amounts of compute time for seeminglyidentical runs. We began to investigate system factors thatmight contribute to this variability, and identified job nodeplacement as a factor that was likely to affect job runtime. We hypothesized that jobs with node placements thatwere more compact would perform better than those withplacements more spread throughout the torus. We proposedseveral metrics in an attempt to quantify the compactness ofthese placements, such as maximum, average, or a profileof hop counts among node pairs. However, we found thatthe correlation between each of our tested metrics and jobrun time were weak, and that they were poor performancepredictors. We considered other likely factors, such as inter-fering traffic from other jobs, or external system events, andrealized that job run time was likely a non-trivial functionof all of these considerations. We turned to visualization asa way to observe the data collected on each of these aspectsand identify trends intuitively.
We found that job node placement did, indeed, have amajor impact on run time, but often in ways that were notsimple to quantify. Figure 2 shows application performancefor several runs of HPL that were identical except for theplacement of their job’s nodes. The best performing jobachieved a performance of 197.5 TFLOPS and outperformedthe 111.2 TFLOPS performance of the worst performingjob by nearly a factor of two. Figure 3 shows the nodeplacements for both cases. The visualizations show that
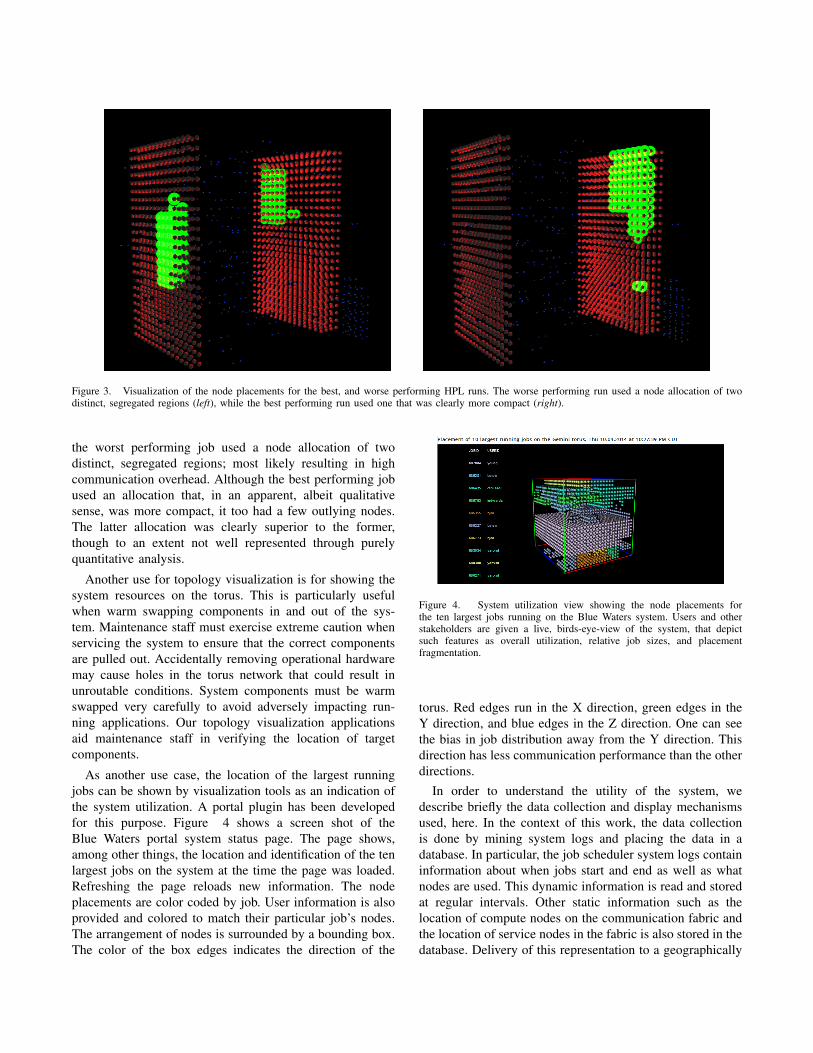
Figure 3. Visualization of the node placements for the best, and worse performing HPL runs. The worse performing run used a node allocation of twodistinct, segregated regions (left), while the best performing run used one that was clearly more compact (right).
the worst performing job used a node allocation of twodistinct, segregated regions; most likely resulting in highcommunication overhead. Although the best performing jobused an allocation that, in an apparent, albeit qualitativesense, was more compact, it too had a few outlying nodes.The latter allocation was clearly superior to the former,though to an extent not well represented through purelyquantitative analysis.
Another use for topology visualization is for showing thesystem resources on the torus. This is particularly usefulwhen warm swapping components in and out of the sys-tem. Maintenance staff must exercise extreme caution whenservicing the system to ensure that the correct componentsare pulled out. Accidentally removing operational hardwaremay cause holes in the torus network that could result inunroutable conditions. System components must be warmswapped very carefully to avoid adversely impacting run-ning applications. Our topology visualization applicationsaid maintenance staff in verifying the location of targetcomponents.
As another use case, the location of the largest runningjobs can be shown by visualization tools as an indication ofthe system utilization. A portal plugin has been developedfor this purpose. Figure 4 shows a screen shot of theBlue Waters portal system status page. The page shows,among other things, the location and identification of the tenlargest jobs on the system at the time the page was loaded.Refreshing the page reloads new information. The nodeplacements are color coded by job. User information is alsoprovided and colored to match their particular job’s nodes.The arrangement of nodes is surrounded by a bounding box.The color of the box edges indicates the direction of the
Figure 4. System utilization view showing the node placements forthe ten largest jobs running on the Blue Waters system. Users and otherstakeholders are given a live, birds-eye-view of the system, that depictsuch features as overall utilization, relative job sizes, and placementfragmentation.
torus. Red edges run in the X direction, green edges in theY direction, and blue edges in the Z direction. One can seethe bias in job distribution away from the Y direction. Thisdirection has less communication performance than the otherdirections.
In order to understand the utility of the system, wedescribe briefly the data collection and display mechanismsused, here. In the context of this work, the data collectionis done by mining system logs and placing the data in adatabase. In particular, the job scheduler system logs containinformation about when jobs start and end as well as whatnodes are used. This dynamic information is read and storedat regular intervals. Other static information such as thelocation of compute nodes on the communication fabric andthe location of service nodes in the fabric is also stored in thedatabase. Delivery of this representation to a geographically
distributed user base can be most easily accomplished viaa web based interface, so the viewer extracts near real-timedata and displays the information on a web browser.
III. ARCHITECTURE
Due to its broad applicability, many desirable features orcapabilities were suggested during our early design and pro-totyping efforts. We began to notice a number of recurringrequirements that many of our use cases shared in common.For TorusVis, we identified these requirements, and set outto meet them as our primary design goals.
A. Requirements
Our highest priority goal was to design TorusVis to begeneric, and applicable to as many topology data presen-tation scenarios as possible. During our initial study onapplication run time consistency, we had many small codesthat would produce some form of visualization of the BlueWaters torus topology. Each would do so in a differentway, and emphasize certain features or attributes that serveslightly different purposes. They were created for a specificuse and often required significant, involved changes whennew needs were identified. We also learned that some of ourindustry collaborators were working on their own similar setof torus visualization tools, and noted that between us, therewere at least half a dozen different in-house tools producingslightly different visualizations of what was essentially thesame subject. We set out to create a software library thatcould replace most of the functionality of these disparateapplications with a single general-purpose code base.
To promote this broad applicability, we designed TorusVisto be extensible and flexible. For every major step of thetopology visualization process, the default behavior can beextended or completely replaced with application-specificlogic. Our design identifies three of these features andformulates the process as a data flow between layers, onefor each step (section III-C). Each layer provides a setof commonly used data structures and routines and serveas extension points for applications. This flexibility allowsmany users to adapt TorusVis to their specific needs whilealso taking advantage of the core visualization functionalityneeded for most applications.
Finally, despite being extensible and generic, we try tokeep TorusVis simple where practical. We target a useraudience that primarily consists of domain experts andadministrators; users that may not be willing or able todevote time to learning the details of a complex softwaredesign. Furthermore, we expect that some applications andvisualizations produced will target project stakeholders or amore public audience, such as in the case where they areused as a dissemination tool. TorusVis must be simple indesign to promote improvements throughout development,expose a simple API that is readily extensible for appli-cations, and facilitate applications with wide accessibility.
DataLayer
Groups
OutputContent
TopologicalStructures Attributes
MappingLayer
Graph LayoutsViews
Spacial Transformations
OutputLayer
StatisticsCharts
Visualization
InputData
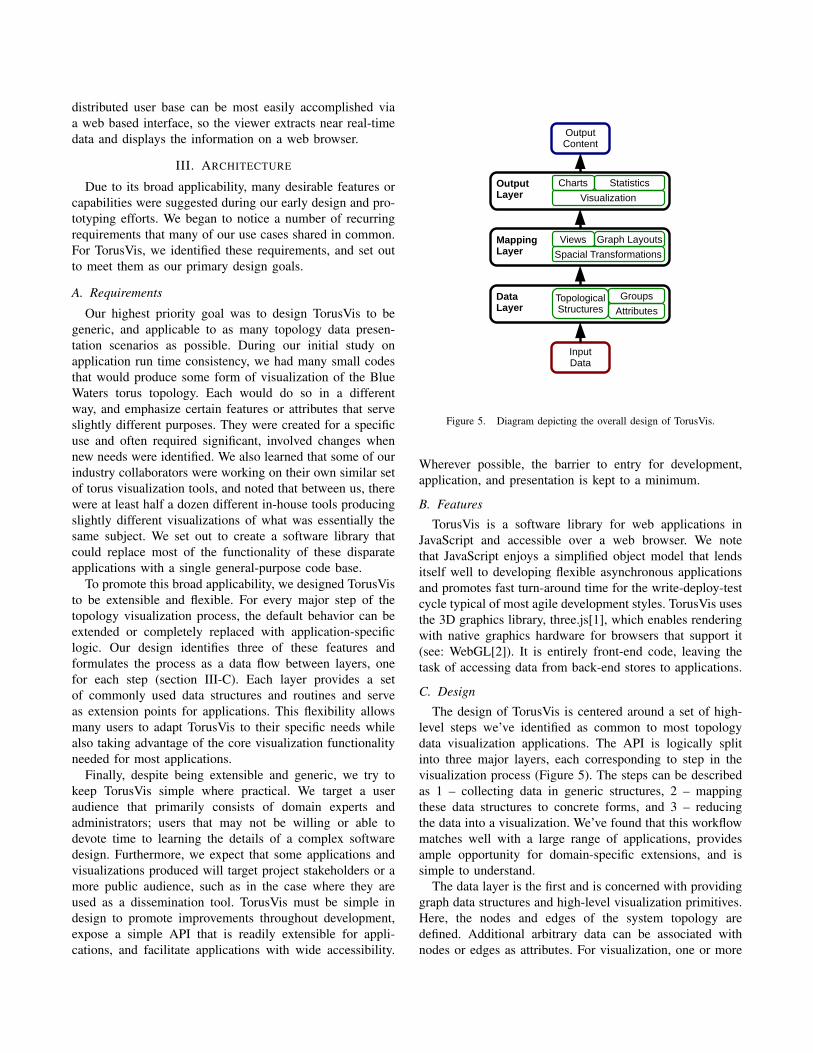
Figure 5. Diagram depicting the overall design of TorusVis.
Wherever possible, the barrier to entry for development,application, and presentation is kept to a minimum.
B. Features
TorusVis is a software library for web applications inJavaScript and accessible over a web browser. We notethat JavaScript enjoys a simplified object model that lendsitself well to developing flexible asynchronous applicationsand promotes fast turn-around time for the write-deploy-testcycle typical of most agile development styles. TorusVis usesthe 3D graphics library, three.js[1], which enables renderingwith native graphics hardware for browsers that support it(see: WebGL[2]). It is entirely front-end code, leaving thetask of accessing data from back-end stores to applications.
C. Design
The design of TorusVis is centered around a set of high-level steps we’ve identified as common to most topologydata visualization applications. The API is logically splitinto three major layers, each corresponding to step in thevisualization process (Figure 5). The steps can be describedas 1 – collecting data in generic structures, 2 – mappingthese data structures to concrete forms, and 3 – reducingthe data into a visualization. We’ve found that this workflowmatches well with a large range of applications, providesample opportunity for domain-specific extensions, and issimple to understand.
The data layer is the first and is concerned with providinggraph data structures and high-level visualization primitives.Here, the nodes and edges of the system topology aredefined. Additional arbitrary data can be associated withnodes or edges as attributes. For visualization, one or more
sets of nodes or edges are also defined in the form of groups.Groups are selections of a subset of a graph’s nodes or edgesthat are to be rendered, and are also associated with a setof options that control the visual characteristics at a highlevel, such as color, size, and shape. Groups can be usedto represent the set of nodes in a job’s allocation, a set oflinks along a path of interest, or any set of components thatmatch a criteria.
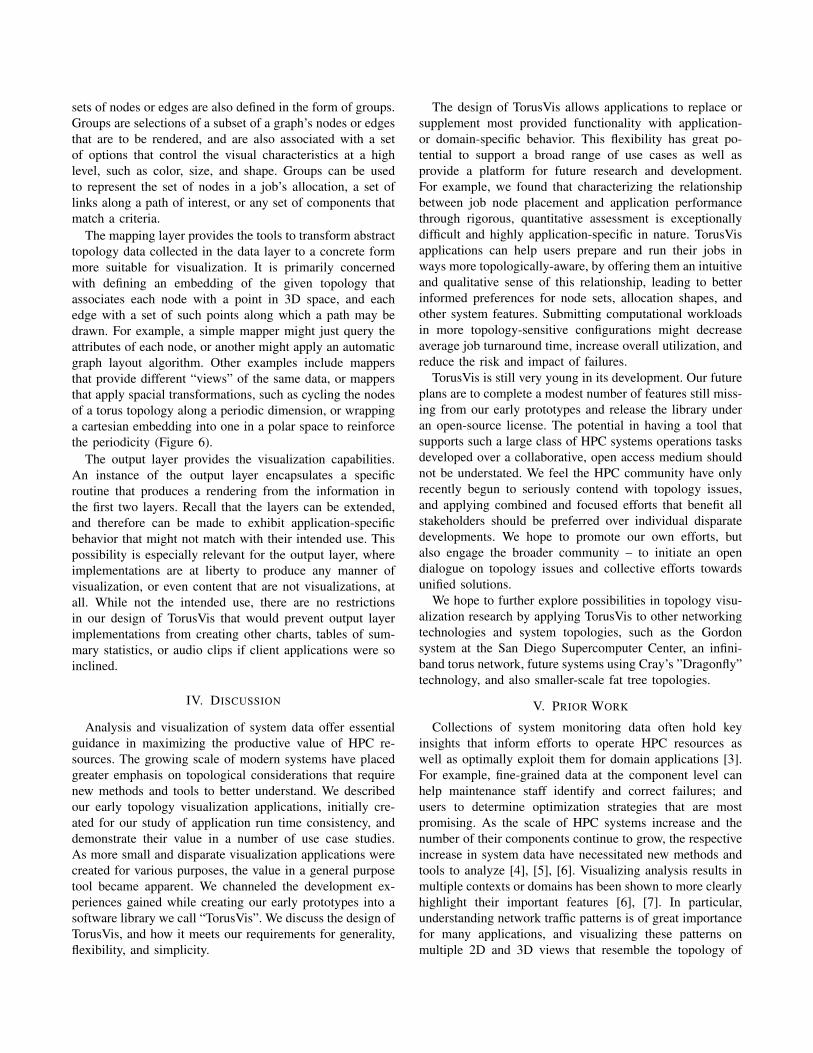
The mapping layer provides the tools to transform abstracttopology data collected in the data layer to a concrete formmore suitable for visualization. It is primarily concernedwith defining an embedding of the given topology thatassociates each node with a point in 3D space, and eachedge with a set of such points along which a path may bedrawn. For example, a simple mapper might just query theattributes of each node, or another might apply an automaticgraph layout algorithm. Other examples include mappersthat provide different “views” of the same data, or mappersthat apply spacial transformations, such as cycling the nodesof a torus topology along a periodic dimension, or wrappinga cartesian embedding into one in a polar space to reinforcethe periodicity (Figure 6).
The output layer provides the visualization capabilities.An instance of the output layer encapsulates a specificroutine that produces a rendering from the information inthe first two layers. Recall that the layers can be extended,and therefore can be made to exhibit application-specificbehavior that might not match with their intended use. Thispossibility is especially relevant for the output layer, whereimplementations are at liberty to produce any manner ofvisualization, or even content that are not visualizations, atall. While not the intended use, there are no restrictionsin our design of TorusVis that would prevent output layerimplementations from creating other charts, tables of sum-mary statistics, or audio clips if client applications were soinclined.
IV. DISCUSSION
Analysis and visualization of system data offer essentialguidance in maximizing the productive value of HPC re-sources. The growing scale of modern systems have placedgreater emphasis on topological considerations that requirenew methods and tools to better understand. We describedour early topology visualization applications, initially cre-ated for our study of application run time consistency, anddemonstrate their value in a number of use case studies.As more small and disparate visualization applications werecreated for various purposes, the value in a general purposetool became apparent. We channeled the development ex-periences gained while creating our early prototypes into asoftware library we call “TorusVis”. We discuss the design ofTorusVis, and how it meets our requirements for generality,flexibility, and simplicity.
The design of TorusVis allows applications to replace orsupplement most provided functionality with application-or domain-specific behavior. This flexibility has great po-tential to support a broad range of use cases as well asprovide a platform for future research and development.For example, we found that characterizing the relationshipbetween job node placement and application performancethrough rigorous, quantitative assessment is exceptionallydifficult and highly application-specific in nature. TorusVisapplications can help users prepare and run their jobs inways more topologically-aware, by offering them an intuitiveand qualitative sense of this relationship, leading to betterinformed preferences for node sets, allocation shapes, andother system features. Submitting computational workloadsin more topology-sensitive configurations might decreaseaverage job turnaround time, increase overall utilization, andreduce the risk and impact of failures.
TorusVis is still very young in its development. Our futureplans are to complete a modest number of features still miss-ing from our early prototypes and release the library underan open-source license. The potential in having a tool thatsupports such a large class of HPC systems operations tasksdeveloped over a collaborative, open access medium shouldnot be understated. We feel the HPC community have onlyrecently begun to seriously contend with topology issues,and applying combined and focused efforts that benefit allstakeholders should be preferred over individual disparatedevelopments. We hope to promote our own efforts, butalso engage the broader community – to initiate an opendialogue on topology issues and collective efforts towardsunified solutions.
We hope to further explore possibilities in topology visu-alization research by applying TorusVis to other networkingtechnologies and system topologies, such as the Gordonsystem at the San Diego Supercomputer Center, an infini-band torus network, future systems using Cray’s ”Dragonfly”technology, and also smaller-scale fat tree topologies.
V. PRIOR WORK
Collections of system monitoring data often hold keyinsights that inform efforts to operate HPC resources aswell as optimally exploit them for domain applications [3].For example, fine-grained data at the component level canhelp maintenance staff identify and correct failures; andusers to determine optimization strategies that are mostpromising. As the scale of HPC systems increase and thenumber of their components continue to grow, the respectiveincrease in system data have necessitated new methods andtools to analyze [4], [5], [6]. Visualizing analysis results inmultiple contexts or domains has been shown to more clearlyhighlight their important features [6], [7]. In particular,understanding network traffic patterns is of great importancefor many applications, and visualizing these patterns onmultiple 2D and 3D views that resemble the topology of
Figure 6. Example application demonstrating an alternative mapping implementation. Here, the spacial embedding of a square torus is wrapped radiallyalong two dimensions (top and bottom), with each view showing the progression of the transformation (left to right).
the system interconnect provides insight valuable to bothapplication developers and performance engineers [8].
Our current development focuses on working with di-rected graph structures, a representation we expect wouldbe general enough to be adapted to most topology data sets.We also note that visualizations of similar data, but in lessgeneric forms (Gantt charts, timeline views, scatter plots,etc.) are already extensively covered by existing methodsand tools [9], [10], [11], [12], [13], [14], [15], [16], [17],[18], [19], [20], [21], [22], [23]. Prior software systems foranalyzing graph data have typically combined graph layoutalgorithms and visualization features [24], [25], [26], [27],[28], [29]. We chose not to focus on graph layout featuressince in the most common use cases, users will alreadyhave one of possibly several layouts predetermined, such asthat of the interconnect topology, one depicting the virtualtopology of an application, or a physical map of where thesystem hardware components lie in a data center. Despitethis omission, we suspect that automatic graph layout ca-pabilities will eventually prove to be a worthwhile additionand another avenue for future research and development.
ACKNOWLEDGMENT
We would like to thank our collaborators at Cray andAdaptive Computing for their help in the application runtime consistency testing that served as the initial motivationfor this project. We would also like to thank our colleagues
Celso Mendes, Robert Sisneros, Galen Arnold, and GregBauer for their valuable contributions and feedback.
This research is part of the Blue Waters sustained-petascale computing project, which is supported by theNational Science Foundation (award number ACI 1238993)and the state of Illinois. Blue Waters is a joint effort of theUniversity of Illinois at Urbana-Champaign and its NationalCenter for Supercomputing Applications.
REFERENCES
[1] R. Cabello, “three.js - javascript 3d library,” April 2014.[Online]. Available: http://www.threejs.org
[2] The Khronos Group, “Webgl - opengl es 2.0 for theweb,” April 2014. [Online]. Available: http://www.khronos.org/webgl
[3] J. Brandt, A. Gentile, J. Mayo, P. Pebay, D. Roe, D. Thomp-son, and M. Wong, “Resource monitoring and managementwith ovis to enable hpc in cloud computing environments,”in Parallel Distributed Processing, 2009. IPDPS 2009. IEEEInternational Symposium on, May 2009, pp. 1–8.
[4] C. W. Lee, C. Mendes, and L. Kale, “Towards scalable per-formance analysis and visualization through data reduction,”in Parallel and Distributed Processing, 2008. IPDPS 2008.IEEE International Symposium on, April 2008, pp. 1–8.
[5] C. Muelder, F. Gygi, and K.-L. Ma, “Visual analysis of inter-process communication for large-scale parallel computing,”Visualization and Computer Graphics, IEEE Transactions on,vol. 15, no. 6, pp. 1129–1136, Nov 2009.
[6] M. Schulz, J. Levine, P.-T. Bremer, T. Gamblin, and V. Pas-cucci, “Interpreting performance data across intuitive do-mains,” in Parallel Processing (ICPP), 2011 InternationalConference on, Sept 2011, pp. 206–215.
[7] N. Bhatia, F. Song, F. Wolf, J. Dongarra, B. Mohr, andS. Moore, “Automatic experimental analysis of communica-tion patterns in virtual topologies,” in Parallel Processing,2005. ICPP 2005. International Conference on, June 2005,pp. 465–472.
[8] A. Landge, J. Levine, A. Bhatele, K. Isaacs, T. Gamblin,M. Schulz, S. Langer, P.-T. Bremer, and V. Pascucci, “Vi-sualizing network traffic to understand the performance ofmassively parallel simulations,” Visualization and ComputerGraphics, IEEE Transactions on, vol. 18, no. 12, pp. 2467–2476, Dec 2012.
[9] V. Herrarte and E. Lusk, “Studying parallel program behaviorwith upshot,” Argonne National Lab., IL (United States),Tech. Rep., 1991.
[10] M. T. Heath and J. Etheridge, “Visualizing the performance ofparallel programs,” Software, IEEE, vol. 8, no. 5, pp. 29–39,Sept 1991.
[11] M. T. Heath and J. E. Finger, “Paragraph: A tool for visualiz-ing performance of parallel programs,” Second Workshop onEnvironments and Tools for Parallel Sci. Comput., pp. 221–230, 1994.
[12] E. Karrels and E. Lusk, “Performance analysis of mpi pro-grams,” in Proceedings of the Workshop on Environments andTools For Parallel Scientific Computing, 1994, pp. 195–200.
[13] D. Kranzlmuller, S. Grabner, and J. Volkert, “Debugging mas-sively parallel programs with atempt,” in High-PerformanceComputing and Networking. Springer, 1996, pp. 806–811.
[14] W. E. Nagel, A. Arnold, M. Weber, H.-C. Hoppe, andK. Solchenbach, VAMPIR: Visualization and analysis of MPIresources, 1996, vol. 12, no. 1.
[15] D. F. Jerding, J. T. Stasko, and T. Ball, “Visualizing inter-actions in program executions,” in Proceedings of the 19thinternational conference on Software engineering. ACM,1997, pp. 360–370.
[16] D. Kranzlmuller and J. Volkert, “Debugging point-to-pointcommunication in mpi and pvm,” in Recent Advances inParallel Virtual Machine and Message Passing Interface.Springer, 1998, pp. 265–272.
[17] B. Topol, J. T. Stasko, and V. Sunderam, “Pvanim: A tool forvisualization in network computing environments,” Concur-rency: Practice and Experience, vol. 10, no. 14, pp. 1197–1222, 1998.
[18] E. Shaffer, D. A. Reed, S. Whitmore, and B. Schaeffer,“Virtue: Performance visualization of parallel and distributedapplications,” Computer, vol. 32, no. 12, pp. 44–51, 1999.
[19] C. Wu, A. Bolmarcich, M. Snir, D. Wootton, F. Parpia,A. Chan, E. Lusk, and W. Gropp, “From trace generationto visualization: A performance framework for distributedparallel systems,” in Supercomputing, ACM/IEEE 2000 Con-ference, Nov 2000, pp. 50–50.
[20] S. S. Shende and A. D. Malony, “The tau parallel perfor-mance system,” International Journal of High PerformanceComputing Applications, vol. 20, no. 2, pp. 287–311, 2006.
[21] A. Chan, W. D. Gropp, and E. L. Lusk, “An efficient formatfor nearly constant-time access to arbitrary time intervals inlarge trace files,” Sci. Programming, vol. 16, pp. 155–165,2007.
[22] S. Moreta and A. Telea, “Multiscale visualization of dynamicsoftware logs,” in Proceedings of the 9th Joint Eurograph-ics/IEEE VGTC conference on Visualization. EurographicsAssociation, 2007, pp. 11–18.
[23] B. Cornelissen, A. Zaidman, D. Holten, L. Moonen, A. vanDeursen, and J. J. van Wijk, “Execution trace analysis throughmassive sequence and circular bundle views,” Journal ofSystems and Software, vol. 81, no. 12, pp. 2252–2268, 2008.
[24] J. Ellson, E. Gansner, L. Koutsofios, S. North, and G. Wood-hull, “Graphviz open source graph drawing tools,” in LectureNotes in Computer Science. Springer-Verlag, 2001, pp. 483–484.
[25] M. Bastian, S. Heymann, and M. Jacomy, “Gephi: An opensource software for exploring and manipulating networks,”2009. [Online]. Available: http://www.aaai.org/ocs/index.php/ICWSM/09/paper/view/154
[26] T. Moscovich, F. Chevalier, N. Henry, E. Pietriga, and J.-D.Fekete, “Topology-aware navigation in large networks,” inProceedings of the SIGCHI Conference on Human Factorsin Computing Systems, ser. CHI ’09. New York, NY,USA: ACM, 2009, pp. 2319–2328. [Online]. Available:http://doi.acm.org/10.1145/1518701.1519056
[27] D. Auber, P. Mary, M. Mathiaut, J. Dubois, A. Lambert,D. Archambault, R. Bourqui, B. Pinaud, M. Delest,and G. Melancon, “Tulip: a scalable graph visualizationframework,” in Extraction et Gestion des Connaissances(EGC) 2010, S. B. Yahia and J.-M. Petit, Eds., vol.RNTI E-19. Hammamet, Tunisia: RNTI, Jan. 2010, pp.623–624. [Online]. Available: http://hal.archives-ouvertes.fr/inria-00482563
[28] B. Pinaud, G. Melancon, and J. Dubois, “Porgy: Avisual graph rewriting environment for complex systems,”Computer Graphics Forum, vol. 31, no. 3, pp. 1265–1274, 2012. [Online]. Available: http://hal.archives-ouvertes.fr/hal-00682550
[29] F. Zaidi and G. Melancon, “Topological decomposition andheuristics for high speed clustering of complex networks,”in Extraction et Gestion de Connaissance, 2012, Hermann,Ed., vol. RNTI-E-23, Bordeaux, France, Jan. 2012, pp.447–458. [Online]. Available: http://hal.archives-ouvertes.fr/hal-00679668