Embed Size (px)
Citation preview
Tosas Auguet, O; Betley, JR; Stabler, RA; Patel, A; Ioannou, A;Marbach, H; Hearn, P; Aryee, A; Goldenberg, SD; Otter, JA; Desai,N; Karadag, T; Grundy, C; Gaunt, MW; Cooper, BS; Edgeworth,JD; Kypraios, T (2016) Evidence for Community Transmission ofCommunity-Associated but Not Health-Care-Associated Methicillin-Resistant Staphylococcus Aureus Strains Linked to Social and Ma-terial Deprivation: Spatial Analysis of Cross-sectional Data. PLoSmedicine, 13 (1). e1001944. ISSN 1549-1277 DOI: https://doi.org/10.1371/journal.pmed.1001944
Downloaded from: http://researchonline.lshtm.ac.uk/2528481/
DOI: 10.1371/journal.pmed.1001944
Usage Guidelines
Please refer to usage guidelines at http://researchonline.lshtm.ac.uk/policies.html or alterna-tively contact [email protected].
Available under license: http://creativecommons.org/licenses/by/2.5/

RESEARCH ARTICLE
Evidence for Community Transmission ofCommunity-Associated but Not Health-Care-Associated Methicillin-ResistantStaphylococcus Aureus Strains Linked toSocial and Material Deprivation: SpatialAnalysis of Cross-sectional DataOlga Tosas Auguet1,2*, Jason R. Betley3, Richard A. Stabler4, Amita Patel1,Avgousta Ioannou3, Helene Marbach1, Pasco Hearn1, Anna Aryee1, SimonD. Goldenberg1, Jonathan A. Otter1, Nergish Desai5, Tacim Karadag6, Chris Grundy7,Michael W. Gaunt4, Ben S. Cooper2,8, Jonathan D. Edgeworth1, Theodore Kypraios9
1 Centre for Clinical Infection and Diagnostics Research, Department of Infectious Diseases, King's CollegeLondon and Guy's and St Thomas' NHS Foundation Trust, London, United Kingdom, 2 Centre for TropicalMedicine and Global Health, Nuffield Department of Clinical Medicine, University of Oxford, Oxford, UnitedKingdom, 3 Illumina, Cambridge Limited, Chesterford Research Park, Little Chesterford, Essex, UnitedKingdom, 4 Department of Pathogen Molecular Biology, Faculty of Infectious and Tropical Diseases, LondonSchool of Hygiene and Tropical Medicine, London, United Kingdom, 5 Department of Medical Microbiology,King's Hospital NHS Foundation Trust, London, United Kingdom, 6 Department of Microbiology, UniversityHospital Lewisham, Lewisham and Greenwich NHS Trust, London, United Kingdom, 7 Department of Socialand Environmental Health Research, Faculty of Public Health and Policy, London School of Hygiene andTropical Medicine, London, United Kingdom, 8 Mahidol Oxford Tropical Medicine Research Unit (MORU),Bangkok, Thailand, 9 School of Mathematical Sciences, University Park, University of Nottingham,Nottingham, United Kingdom
Abstract
Background
Identifying and tackling the social determinants of infectious diseases has become a public
health priority following the recognition that individuals with lower socioeconomic status are
disproportionately affected by infectious diseases. In many parts of the world, epidemiologi-
cally and genotypically defined community-associated (CA) methicillin-resistant Staphylococ-cus aureus (MRSA) strains have emerged to become frequent causes of hospital infection.
The aim of this study was to use spatial models with adjustment for area-level hospital atten-
dance to determine the transmission niche of genotypically defined CA- and health-care-
associated (HA)-MRSA strains across a diverse region of South East London and to explore
a potential link between MRSA carriage and markers of social and material deprivation.
Methods and Findings
This study involved spatial analysis of cross-sectional data linked with all MRSA isolates
identified by three National Health Service (NHS) microbiology laboratories between 1
PLOSMedicine | DOI:10.1371/journal.pmed.1001944 January 26, 2016 1 / 24
OPEN ACCESS
Citation: Tosas Auguet O, Betley JR, Stabler RA,Patel A, Ioannou A, Marbach H, et al. (2016)Evidence for Community Transmission ofCommunity-Associated but Not Health-Care-Associated Methicillin-Resistant StaphylococcusAureus Strains Linked to Social and MaterialDeprivation: Spatial Analysis of Cross-sectional Data.PLoS Med 13(1): e1001944. doi:10.1371/journal.pmed.1001944
Academic Editor: Mirjam E. E. Kretzschmar, TheNational Institute for Public Health and theEnvironment, NETHERLANDS
Received: March 27, 2015
Accepted: December 11, 2015
Published: January 26, 2016
Copyright: © 2016 Tosas Auguet et al. This is anopen access article distributed under the terms of theCreative Commons Attribution License, which permitsunrestricted use, distribution, and reproduction in anymedium, provided the original author and source arecredited.
Data Availability Statement:Whole genomesequence (WGS) data used in this study have beensubmitted to the European Nucleotide Archive. Thestudy accession number is PRJEB11177. We havepermission from NRES Committee North West—Greater Manchester West to release all theanonymised metadata into the public domain. All therelevant data are within the paper and its supporting
November 2011 and 29 February 2012. The cohort of hospital-based NHS microbiology
diagnostic services serves 867,254 usual residents in the Lambeth, Southwark, and Lewi-
sham boroughs in South East London, United Kingdom (UK). Isolates were classified as
HA- or CA-MRSA based on whole genome sequencing. All MRSA cases identified over
4 mo within the three-borough catchment area (n = 471) were mapped to small geographies
and linked to area-level aggregated socioeconomic and demographic data. Disease map-
ping and ecological regression models were used to infer the most likely transmission
niches for each MRSA genetic classification and to describe the spatial epidemiology of
MRSA in relation to social determinants. Specifically, we aimed to identify demographic and
socioeconomic population traits that explain cross-area extra variation in HA- and CA-
MRSA relative risks following adjustment for hospital attendance data. We explored the
potential for associations with the English Indices of Deprivation 2010 (including the Index
of Multiple Deprivation and several deprivation domains and subdomains) and the 2011
England andWales census demographic and socioeconomic indicators (including numbers
of households by deprivation dimension) and indicators of population health. Both CA-and
HA-MRSA were associated with household deprivation (CA-MRSA relative risk [RR]: 1.72
[1.03–2.94]; HA-MRSA RR: 1.57 [1.06–2.33]), which was correlated with hospital atten-
dance (Pearson correlation coefficient [PCC] = 0.76). HA-MRSA was also associated with
poor health (RR: 1.10 [1.01–1.19]) and residence in communal care homes (RR: 1.24
[1.12–1.37]), whereas CA-MRSA was linked with household overcrowding (RR: 1.58 [1.04–
2.41]) and wider barriers, which represent a combined score for household overcrowding,
low income, and homelessness (RR: 1.76 [1.16–2.70]). CA-MRSA was also associated
with recent immigration to the UK (RR: 1.77 [1.19–2.66]). For the area-level variation in RR
for CA-MRSA, 28.67% was attributable to the spatial arrangement of target geographies,
compared with only 0.09% for HA-MRSA. An advantage to our study is that it provided a
representative sample of usual residents receiving care in the catchment areas. A limitation
is that relationships apparent in aggregated data analyses cannot be assumed to operate at
the individual level.
Conclusions
There was no evidence of community transmission of HA-MRSA strains, implying that HA-
MRSA cases identified in the community originate from the hospital reservoir and are main-
tained by frequent attendance at health care facilities. In contrast, there was a high risk of
CA-MRSA in deprived areas linked with overcrowding, homelessness, low income, and
recent immigration to the UK, which was not explainable by health care exposure. Further-
more, areas adjacent to these deprived areas were themselves at greater risk of CA-MRSA,
indicating community transmission of CA-MRSA. This ongoing community transmission
could lead to CA-MRSA becoming the dominant strain types carried by patients admitted to
hospital, particularly if successful hospital-based MRSA infection control programmes are
maintained. These results suggest that community infection control programmes targeting
transmission of CA-MRSA will be required to control MRSA in both the community and hos-
pital. These epidemiological changes will also have implications for effectiveness of risk-
factor-based hospital admission MRSA screening programmes.
MRSA Spatial Epidemiology in Relation to Socioeconomic Deprivation
PLOSMedicine | DOI:10.1371/journal.pmed.1001944 January 26, 2016 2 / 24
information files. Specifically, the metadata areavailable in S1 Text and S2 Text, which correspond toexcel files.
Funding: JDE received funding from the NationalInstitute for Health Research (NIHR), Guy's and StThomas' NHS Foundation Trust and King's CollegeLondon, Biomedical Research Centre, Programme ofInfection and Immunity (RJ112/N027), for the conductof this study. The research outlined here is part of theInfection Theme Programme of the National Institutefor Health Research (NIHR), Collaboration forLeadership in Applied Health Research and CareSouth London, at King’s College Hospital NHSFoundation Trust. BSC was supported by TheMedical Research Council and Department forInternational Development (grant number MR/K006924/1). The Mahidol Oxford Tropical MedicineResearch Unit is part of the Wellcome-Trust MajorOverseas Programme in SE Asia (grant number106698/Z/14/Z). The statements made herein aresolely the responsibility of the authors. The viewsexpressed are not necessarily those of the funders,the NHS, the NIHR or the Department of Health. Thefunders had no role in study design, data collectionand analysis, decision to publish, or preparation ofthe manuscript.
Competing Interests: The authors have declaredthat no competing interests exist.
Abbreviations: BYM, Besag, York, and Mollie’smodel; CA, community associated; CE, communalestablishment; CIDR, Centre for Clinical Infection andDiagnostics Research; DDI, Deprivation DomainIndex; DIC, deviance information criterion; GP,general practice or practitioner; GSTT, Guy’s and StThomas’ NHS Foundation Trust; HA, health careassociated; HES, Hospital Episode Statistics; HSCIC,Health and Social Care Information Centre; ICAR,intrinsic conditional autoregressive structure; iid,independent random noise model; IMD, Index ofMultiple Deprivation; INLA, integrated nested Laplaceapproximation; LSOA, Lower Layer Super OutputArea; MLST, multilocus sequence type; MRSA,methicillin-resistant Staphylococcus aureus; NHS,National Health Service; NIHR, National Institute forHealth Research; NRES, National Research EthicsService; PCC, Pearson correlation coefficient; PVL,Panton-Valentine leucocidin; REC, Research EthicsCommittee; RR, relative risk; SCCmec,staphylococcal cassette chromosome mec; UK,United Kingdom; WGS, whole genome sequencing.

IntroductionIn recent years, systematic health inequalities and the uneven distribution of adverse healthoutcomes have been found to affect a wide array of infectious diseases, not just chronic diseasesor signature infections of social determinants such as tuberculosis or human immunodefi-ciency virus (HIV) [1–3]. In 2004, a study in the UK showed that the incidence of postoperativeinfection with methicillin-resistant Staphylococcus aureus (MRSA) was 7-fold higher inpatients whose residential postcode was located in the most deprived areas [4]. Following therecognition that individuals with lower socioeconomic status are disproportionately affected byinfections in every European Union member state [1], addressing the social determinants ofinfectious diseases has become a public health priority in recent years [5,6].
The epidemiology of MRSA is complex, particularly given the coexistence of two geneticallyand epidemiologically distinct classifications. Until the emergence of community-associatedMRSA (CA-MRSA) in the late 1990s [7,8], infection was predominantly due to health-care-associated (HA) strains associated with advanced age, comorbidities, surgical procedures, orindwelling medical devices [9–12]. CA-MRSA later emerged as a cause of infection in the com-munity in previously healthy individuals of all ages, with no history of hospital contact andnone of the risk profiles that are typical of health care exposure [7,8]. Recently, however,CA-MRSA strains have emerged as a cause of health-care-associated infection in some parts ofthe world [13], challenging definitions of CA-MRSA based on clinical epidemiology and wheredisease manifests [14–16] in favour of genotype-based definitions [17–19]. Nonetheless,CA-MRSA strains retain a number of important characteristics, notably the association withinfection in previously healthy individuals in the community [7,8,12,16,20].
Health care settings are regarded as the epicentre for MRSA transmission in Europe [21,22].Consequently, to date the predominant focus in the UK has been HA-MRSA and minimisingthe threat to patients through rigorous infection control practice and universal admissionscreening [10,23–25]. However, it is increasingly recognised that this approach is at odds withthe shifting epidemiology of MRSA, which makes it necessary to consider both HA- andCA-MRSA transmission dynamics together [26]. Whilst application of advanced spatial statis-tical methods may be useful to characterise transmission dynamics of MRSA [21,27,28], appli-cation of these models to describe the epidemiology in relation to social determinants andhealth care exposure is lacking.
The objectives of this study are 2-fold: first, to investigate the relationship between socioeco-nomic deprivation and both CA- and HA-MRSA in South East London and to identify whethersocial determinants are associated with carriage of either MRSA classification and, second, toidentify the main transmission niches for HA- and CA-MRSA (i.e., community versus healthcare setting) and whether niches are distinct or shared. For the first time, we fit spatial modelsand account for hospital attendance in each geography to establish the relative contribution ofspatial effects and account for any potential confounding.
Methods
Study PopulationA description of the study population has been reported previously [29]. Briefly, over a 4-moperiod (from 1 November 2011 to 29 February 2012), we collected all MRSA isolates identifiedby a hospital cohort that serves a population of 867,254 usual residents [30] and providesmicrobiology diagnostic services to all inpatients, outpatients, and community patients in theLambeth, Southwark, and Lewisham boroughs in South East London (Fig 1). Participant cen-tres included four acute tertiary hospitals in two NHS Trusts (Guy’s and St Thomas’ NHS
MRSA Spatial Epidemiology in Relation to Socioeconomic Deprivation
PLOSMedicine | DOI:10.1371/journal.pmed.1001944 January 26, 2016 3 / 24

Foundation Trust [GSTT]; King’s College NHS Foundation Trust) and one acute district gen-eral hospital (University Hospital Lewisham; Lewisham and Greenwich NHS Trust).
Laboratory MethodsMRSA isolates were submitted to the Centre for Clinical Infection and Diagnostics Research(CIDR) at GSTT and were included in the study if confirmed as MRSA by culture on chromo-genic agar (Oxoid Brilliance) and rapid latex agglutination test (Staphaurex, Remel) [29]. Rele-vant clinical, geographic, and demographic anonymised patient-level details were submittedwith each specimen and recorded in the study database [29]. Whole genome sequencing(WGS) was conducted on the first confirmed MRSA isolate from each individual at eachunique health care setting (i.e., whenever an individual was admitted as inpatient to a new hos-pital or received care in a new outpatient clinic or community service during the study period),implying availability of follow-up genomic information when patients received care at multiplesettings. Genomic DNA quantification, DNA sample preparation, and library pooling forpaired-end 150-cycle sequencing on the Illumina HiSeq 2500 platform in rapid run mode wasconducted as per manufacturer’s instructions and as described previously [29]. Following denovo assembly of contigs [29], draft assemblies were analysed in silico to determine the multi-locus sequence type (MLST), staphylococcal cassette chromosomemec (SCCmec) type and car-riage of the Panton-Valentine leukocidin (PVL) using BWA [31] and BLAST [32]. Isolateswere classified as HA-MRSA if they were PVL negative and contained SCCmec types I, II, orIII, and as CA-MRSA if they were PVL positive or contained type IV, V, or nontypeable
Fig 1. Map of London boroughs showing catchment areas for the hospital cohort. Shown in red from left to right, catchment areas for the hospitalcohort were south of the river Thames and included the Southwark, Lambeth, and Lewisham boroughs.
doi:10.1371/journal.pmed.1001944.g001
MRSA Spatial Epidemiology in Relation to Socioeconomic Deprivation
PLOSMedicine | DOI:10.1371/journal.pmed.1001944 January 26, 2016 4 / 24

SCCmec [19,29,33]. Exceptions were ST22-IV isolates and ST5-IV isolates, which were classi-fied as HA unless they were PVL positive [19,29,33]. WGS data are available from the Euro-pean Nucleotide Archive database under accession number PRJEB11177.
Data CollectionThe study included the subset of all individuals who had a confirmed MRSA isolate, but also aresidential postcode within the catchment areas (Fig 1). Eligible individuals with MRSA werethen classed as CA- or HA-MRSA based on the WGS analysis. Persons with both CA- andHA-MRSA in repeated samplings were classified as having a mixed infection and excludedfrom analyses of CA- and HA-MRSA but included in the analysis of all MRSA. Boundary datafor mapping 2011 small geographies (named Lower Layer Super Output Areas [LSOAs]) incatchment areas were obtained from the Office for National Statistics, UK [34]. An LSOA is ageography for the collection and publication of small area statistics in England andWales; eachLSOA has 1,500 residents and 650 households on average. MRSA cases were then mapped toLSOAs following conversion of the residential postcode into a LSOA using GeoConvert [35].Publicly available small-area-level aggregated data for each LSOA within the Lambeth, South-wark, and Lewisham catchment areas (n = 513) were obtained from the English Indices of Dep-rivation 2010 [36] and the 2011 England and Wales census [30]. Demographic data(population census and age and gender population structure) were also obtained from the 2011census. Publicly available data from these sources that were included in the analysis of potentialrisk factors of MRSA are given in Box 1. The individual patient-level and aggregated LSOA-level metadata analysed in this study are available in S1 and S2 Text, respectively.
The Health and Social Care Information Centre (HSCIC, UK) provided hospital attendancedata for catchment areas from the Hospital Episode Statistics (HES) Database [37]. This wasdefined as the percentage of usual residents of at least 1 y of age in each LSOA who had attendedany London Accident and Emergency department or had been admitted to any London hospital(i.e., inside or outside catchment areas) as inpatients between 1 April 2011 and 31March 2012.
Statistical AnalysisHierarchical models to investigate the spatial epidemiology of HA- and CA-MRSA were devel-oped and fitted to the observed data using an integrated nested Laplace approximation (INLA)approach [38] in R-INLA package (www.r-inla.org) within R-3.1.1 statistical software [39].INLA is a computationally efficient approach to Bayesian inference for latent Gaussian models.The latter are very wide and flexible class models that include spatial and spatial-temporalmodels [40,38]. Several examples in the literature have recently demonstrated the successfulapplication of INLA to mapping of disease incidence and prevalence [41–43].
Based on counts of observed cases within LSOAs, we adopted a model-based approach toobtain reliable estimates of LSOA-level local risks of HA-, CA-, or any MRSA with or withoutconsideration of available area-level statistics. A model-based approach provides a mechanismto “borrow information” across small LSOAs to improve local risk estimates, resulting in thesmoothing of extreme risks based on small local sample sizes. It also enables consideration ofthe spatial setting by borrowing more information from neighbouring rather than distant areasand by smoothing local rates toward local (neighbouring) values where appropriate.
Numbers of MRSA cases in each LSOA were modelled as Poisson random variables byusing a logarithmic link and accounting for the age-and-gender standardised expected count ofMRSA cases in each LSOA. We considered models without covariates (i.e., disease mapping)and with covariates (i.e., ecological regression). To estimate local risks of MRSA, we examinedmodels of increasing hierarchical complexity to account for the hierarchy of different
MRSA Spatial Epidemiology in Relation to Socioeconomic Deprivation
PLOSMedicine | DOI:10.1371/journal.pmed.1001944 January 26, 2016 5 / 24
Box 1. Description of Publicly Available Area-Level Data Utilised inEcological Regression Models to Assess Risk Factors for Health-Care-Associated (HA-) and Community-Associated (CA-) MRSASummary statistics for area-level variables are given in S1 Table.
The English Indices of Deprivation 2010 [36]The Index of Multiple Deprivation (IMD) is a wide measure of multiple deprivation forLower Layer Super Output Area (LSOA) geographies in England. It is conceptualized asa weighted area-level aggregation of seven deprivation domain indices (DDIs): (1)income, (2) employment, (3) health and disability, (4) education, skills, and training, (5)barriers to housing and services, (6) crime, and (7) living environment. Most of theweight in the IMD comes from income and employment (45.00%) followed by healthand education (27.00%) DDIs. The remaining DDIs contribute 9.30% weight each. Ofnote, the indicators used to construct DDIs in the IMD 2010 are different from thoseused in the 2011 census to classify households by deprivation dimension. Barriers tohousing and services is composed of two sub-DDIs. First, “wider barriers” is a combinedmeasure of numbers of homeless residents—as informed by the rate of acceptances forhousing assistance under the homelessness provisions of the 1996 Housing Act—the pro-portion of households aged under 35 whose income means they are unable to afford toenter owner occupation, and the proportion of households judged to have insufficientspace to meet the household’s needs (i.e., overcrowding). Second, “geographical barrierssub-DDI” is a combined measure of the mean distance to the closest general practitioner(GP) surgery, supermarket or general store, primary school, and post or sub-post officefor people living in the LSOA. Living environment DDI is also composed of two sub-DDIs. First, “indoors living environment”measures the quality of housing as the com-bined proportion of homes that fail to meet the decent homes standard or do not havecentral heating. Second, “outdoors living environment” is a combined measure of airquality (based on modelled estimates of the atmospheric concentration of four pollut-ants) and road traffic accidents involving pedestrians and cyclists.
The 2011 England andWales Census [30]Households by deprivation dimensions is a less broad indicator of deprivation inEngland andWales at the LSOA level. It classifies households by four deprivation dimen-sions, namely (1) employment (deprived if any member of the household [not a full-timestudent] is either unemployed or long-term sick), (2) education (deprived if no person inthe household has at least level 2 education and no person aged 16–18 y is a full-time stu-dent), (3) health and disability (deprived if any person in the household has generalhealth that is “bad or very bad” or has a long-term health problem), and (4) housing sta-tus (deprived if the household’s accommodation is either overcrowded with an occu-pancy rating −1 or less, is in a shared dwelling, or has no central heating). A householdmay be classified as being deprived in none or one to four of these dimensions in anycombination. Study variables are based on the “percentage of households deprived in oneor several dimensions” in each LSOA. Population density is the “number of persons perhectare” in each LSOA.Health variables are based on percentage of usual residents who,following self-assessment, reported “bad/very bad general health” or “day-to-day
MRSA Spatial Epidemiology in Relation to Socioeconomic Deprivation
PLOSMedicine | DOI:10.1371/journal.pmed.1001944 January 26, 2016 6 / 24

populations in the analysis. We fitted models to the observed data with unstructured randomeffects only (independent random noise “iid”model), spatially structured random effects only(“Besag”model), and both structured and unstructured random effects (“Besag, York, andMollie[BYM]”model) [44]. A model with unstructured random effects only induces some correlationamong the observations but does not specifically induce spatial correlation. In other words, allthe LSOA-specific risk estimates are a weighted average of the observed data in each LSOA andthe global overall mean. On other hand, spatially structured random effects result in local esti-mates being a weighted average of the local data and an average of observations in neighbouringregions. Hence, such an approach borrows information locally, rather than globally. Structuredrandom effects were modelled using an intrinsic conditional autoregressive structure (ICAR), inwhich neighbouring geographical areas for each LSOA were accounted for as described previ-ously [45]. See S1 Methods for details. The set of neighbours for each LSOA was obtained fromthe shape file of the study region using the R packages “maptools” [46] and “spdep” [47,48].
We adopted uninformative priors for the model parameters of interest. We assigned vaguenormal priors for the fixed effects parameters with zero mean and large variance (equal to 104)and exponential distributions with various rates for the structured and unstructured randomeffects precision parameters. For the “iid” and “Besag”models, priors on the precision corre-sponded to a gamma distribution with (1, 5e-05) shape and scale parameters respectively. ForBYM, priors on the unstructured and structured effect precisions corresponded to a gammadistribution with parameters (1, 5e-04).
Structured random effects account for variation in the response variable that is due to thespatial arrangement of LSOAs, whilst unstructured effects account for unobserved
activities ‘very’/’a little’ limited” due to disability or a long-term health problem lastingmore than 12 mo, in the census questionnaire.Household overcrowding variables arebased on bedroom occupancy rating data in which the ages of the household membersand their relationships to each other are used to derive the number of bedrooms theyrequire. An “occupancy rating of −1” implies that a household has one fewer bedroomthan required. An “occupancy rating of −2 or less” implies there are at least two fewerbedrooms than required. Variables for usual residents living in communal establish-ments (CEs) refer to the percentage of residents who live in managed residential accom-modation with ten or more beds. “Any communal establishment” includes all CEs thatmeet the definition above. “Communal care homes” includes all medical and care CEsthat are managed by local authorities or other and are classed as a “care home” with orwithout nursing. “Other communal medical and care establishments” include hospitals,mental health hospitals/units, children’s homes, and medical and care establishmentsother than care homes, which are managed by the National Health Service (NHS), localauthorities, registered social landlord or housing associations, or other. Ethnic groupvariables relate to percentage of usual residents who reported “White,” “Asian,” “Black,”(including Black-African and Black-Caribbean subcategories) or “Arab” ethnicity in thecensus questionnaire.Household spaces by dwelling type are the percentage of house-holds located in purpose-built blocks of flats or tenements as opposite to in, for example,detached or semidetached properties amongst other. Length of residence in the UKshows the percentage of usual residents who have lived in the UK “less than 2 y,” “2 y ormore but less than 5 y,” or “5 y or more but less than 10 y.” It is derived from the date thata person last arrived to live in the UK and excludes short visits and usual residents bornin the UK who have emigrated and since returned.
MRSA Spatial Epidemiology in Relation to Socioeconomic Deprivation
PLOSMedicine | DOI:10.1371/journal.pmed.1001944 January 26, 2016 7 / 24

heterogeneity that is not explained by the covariates or the spatial effects. For HA-, CA-, andany MRSA separately, the most appropriate random effect structure for disease mapping andecological regression models was chosen based on examination of R-INLA built-in modelselection tools in combination with inspection of the variation attributable to spatial effectsand of the effects of different levels of spatial smoothing on the spatial field imposed by alterna-tive prior parameters during prior sensitivity analyses. Model selection tools included the devi-ance information criterion (DIC) and the mean logarithmic score, and, given that DIC isaccurate only when the number of effective parameters in the model is small compared to thetotal number of independent observations [49], the ratio of total observations (n = 513 LSOAs)to the number of effective parameters was also examined.
The potential for associations betweenMRSA and area-level socioeconomic and demographicprofiles was examined in separate unadjusted ecological regression models and models adjusted byLSOA-level quintile-stratified hospital attendance data. Several transformations of each variablewere examined, including untransformed (continuous) and two two-level dichotomous transforma-tions reflecting classifications above and below the catchment area median or above and below acut-off point that minimised the within group variance for each classification. Small-area-level esti-mates of MRSA andmeasures of association for the fixed terms (i.e., predictor variables), were sum-marized by relative risks (RRs). Significant predictor variables were those in which 95% credibleintervals for MRSA RR estimates did not overlap with 1 in adjusted analyses. Out of all significantvariables identified, we report the RR and 95% credible interval for the variable with lowest DICwithin each group of variable transformations and/or “synonymous” variable indicators, to aid read-ability and interpretability of results. Synonymous variable indicators were considered for depriva-tion, health, household overcrowding, and usual residents by length of residency in the UK (S1Table). For robustness, results from ecological regressions were validated across alternative randomeffect models and the range of prior scale parameters tested. Further details are given in S1Methods.
Choropleth maps, in which areas are shaded in proportion to the quantile measurement ofthe variable being displayed, were used to show the posterior mean for LSOA-specific RRs ofHA- and CA-MRSA compared to the whole catchment area and to show the distribution ofsignificant covariates. Spatial correlations abound in disease mapping studies and can make theimplementation of multiple regression impossible. In this study, we examined the effect of mul-tiple indicators of social and material deprivation independently and following adjustment forhospital attendance data in each area. We then examined pairwise correlation coefficientsbetween significant predictors of MRSA using the function “correlog” of the “ncf” package [50]to aid interpretability of adjusted and unadjusted results. A correlation network summarisingthe relationship between variables was produced using the “igraph” package [51].
EthicsThis research was conducted following approval from the National Research Ethics Service(NRES Committee North West–Greater Manchester West; Research Ethics Committee [REC]reference 11/NW/0733). Approval and waived consent was obtained from NHS research anddevelopment departments at Guy’s and St Thomas’NHS Foundation Trust, King’s CollegeHospital NHS Foundation Trust, and University Hospital Lewisham, now part of Lewishamand Greenwich NHS Trust.
Results
MRSA Cases in the Study AreasEight-hundred and thirty-nine MRSA positive patients were identified, of which 56.14%(n = 471) had a residential postcode within the three boroughs. Of the patients living in these
MRSA Spatial Epidemiology in Relation to Socioeconomic Deprivation
PLOSMedicine | DOI:10.1371/journal.pmed.1001944 January 26, 2016 8 / 24

boroughs, 79.41% (374/471) had MRSA identified in a single health care episode, whilst theremaining 20.59% (97/471) had MRSA identified in multiple episodes. Overall, 635 MRSA pos-itive episodes in 471 individuals were identified, of which 43.31% (275/635) were inpatient,39.37% (250/635) outpatient, and 17.32% (110/635) community episodes from GPs. MRSAcases were detected in 52.63% (270/513) of LSOAs in target boroughs.
Of the 471 individuals with MRSA with a residential postcode in the three boroughs,83.23% (392/471) could be genotypically categorised into HA- or CA-MRSA based on genomesequencing, whilst the remaining 16.77% (79/471) were unclassified. 71.68% of classified cases(281/392) were HA-MRSA, and 26.28% (103/392) were CA-MRSA. Both CA- and HA-MRSAwere identified in 2.04% of individuals (8/392). These proportions were similar to thoseobserved for the whole study population (of 696/839 patients with MRSA genotypic characteri-sation, 74.28% had HA-MRSA (n = 517); 23.85% CA-MRSA (n = 166) and 1.87% mixed-MRSA (n = 13)).
Population Structure in Catchment AreasThe number of usual residents in LSOAs ranged from 1,043 to 2,551, with substantial variationin age and gender population structure across areas (S2 Table). Only a minority of usual resi-dents in the 513 LSOA in Lambeth, Southwark, and Lewisham were aged 65 y or more(between 0.58% and 18.77%), and 50.61% were female.
Description of Area-Level Variables Considered in the StudySummary statistics are given in S1 Table. There was substantial heterogeneity in the ethnicitymakeup and factors of social and material deprivation across LSOAs, with ethnicities localisingto different areas. The percentage of households deprived in 1–4 dimensions ranged from26.64% to 83.33%, and the percentage of household spaces in purpose-built blocks of flats ran-ged from 1.10% to 97.70%. Cross-area differences were also evident for health indicatorsdespite the relatively low percentage of residents aged 65 y or above in the same areas. The per-centage of usual residents self-reporting bad or very bad health ranged from 0.48% to 10.13%,and that of residents reporting limited daily activities due to poor health ranged from 2.73% to23.84%.
A large proportion of residents aged 1 y or older had attended a London hospital accidentand emergency department or had been admitted to a hospital as an inpatient around thestudy period. The mean percentage of residents attending a hospital was 33.10% but rangedfrom 17.31% to 48.94% (S1 Table).
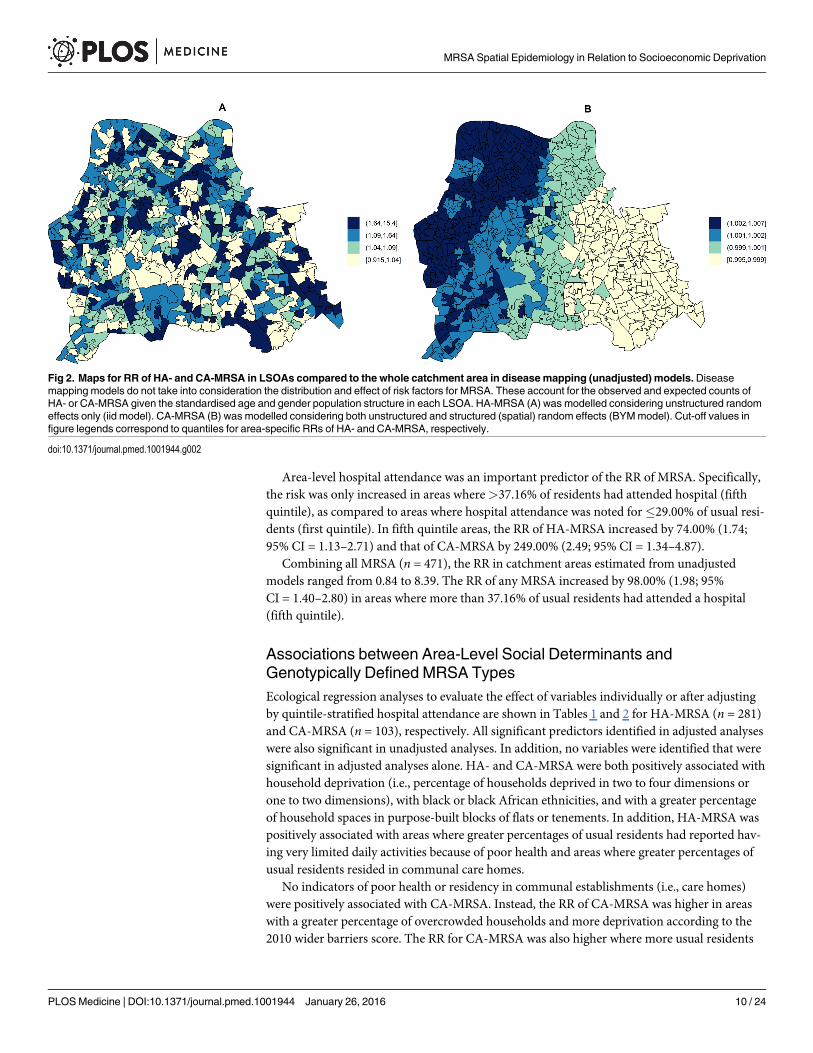
Distribution of Genotypically Defined MRSA Types in Catchment Areasin Relation to Area-Level Hospital AttendanceFor HA-MRSA (n = 281), and for all MRSA combined (HA-, CA- and unclassified; n = 471),the contribution of spatial (structured) effects to explaining the variance in RRs betweenLSOAs within the three boroughs was negligible (unadjusted model: 0.10%; model adjusted forarea-level hospital attendance: 0.09%), with 99.90% variation attributable to unobserved het-erogeneity alone (unstructured effects). In contrast, substantial variation in small area-levelRRs of CA-MRSA within the three boroughs was attributable to the spatial arrangement ofLSOAs (unadjusted model: 27.67%; adjusted model: 28.67%).
In unadjusted models, the RR of HA-MRSA across the three boroughs ranged from 0.92 to15.40 depending on the LSOA and that of CA-MRSA ranged from 1.00 to 1.01. Fig 2 shows thearea-specific RRs of HA- and CA-MRSA compared to the whole catchment area in unadjustedmodels.
MRSA Spatial Epidemiology in Relation to Socioeconomic Deprivation
PLOSMedicine | DOI:10.1371/journal.pmed.1001944 January 26, 2016 9 / 24
Area-level hospital attendance was an important predictor of the RR of MRSA. Specifically,the risk was only increased in areas where>37.16% of residents had attended hospital (fifthquintile), as compared to areas where hospital attendance was noted for�29.00% of usual resi-dents (first quintile). In fifth quintile areas, the RR of HA-MRSA increased by 74.00% (1.74;95% CI = 1.13–2.71) and that of CA-MRSA by 249.00% (2.49; 95% CI = 1.34–4.87).
Combining all MRSA (n = 471), the RR in catchment areas estimated from unadjustedmodels ranged from 0.84 to 8.39. The RR of any MRSA increased by 98.00% (1.98; 95%CI = 1.40–2.80) in areas where more than 37.16% of usual residents had attended a hospital(fifth quintile).
Associations between Area-Level Social Determinants andGenotypically Defined MRSA TypesEcological regression analyses to evaluate the effect of variables individually or after adjustingby quintile-stratified hospital attendance are shown in Tables 1 and 2 for HA-MRSA (n = 281)and CA-MRSA (n = 103), respectively. All significant predictors identified in adjusted analyseswere also significant in unadjusted analyses. In addition, no variables were identified that weresignificant in adjusted analyses alone. HA- and CA-MRSA were both positively associated withhousehold deprivation (i.e., percentage of households deprived in two to four dimensions orone to two dimensions), with black or black African ethnicities, and with a greater percentageof household spaces in purpose-built blocks of flats or tenements. In addition, HA-MRSA waspositively associated with areas where greater percentages of usual residents had reported hav-ing very limited daily activities because of poor health and areas where greater percentages ofusual residents resided in communal care homes.
No indicators of poor health or residency in communal establishments (i.e., care homes)were positively associated with CA-MRSA. Instead, the RR of CA-MRSA was higher in areaswith a greater percentage of overcrowded households and more deprivation according to the2010 wider barriers score. The RR for CA-MRSA was also higher where more usual residents
Fig 2. Maps for RR of HA- and CA-MRSA in LSOAs compared to the whole catchment area in diseasemapping (unadjusted) models.Diseasemapping models do not take into consideration the distribution and effect of risk factors for MRSA. These account for the observed and expected counts ofHA- or CA-MRSA given the standardised age and gender population structure in each LSOA. HA-MRSA (A) was modelled considering unstructured randomeffects only (iid model). CA-MRSA (B) was modelled considering both unstructured and structured (spatial) random effects (BYMmodel). Cut-off values infigure legends correspond to quantiles for area-specific RRs of HA- and CA-MRSA, respectively.
doi:10.1371/journal.pmed.1001944.g002
MRSA Spatial Epidemiology in Relation to Socioeconomic Deprivation
PLOSMedicine | DOI:10.1371/journal.pmed.1001944 January 26, 2016 10 / 24

had immigrated to the UK within the 2 y preceding the 2011 census. The proportion of vari-ance in CA-MRSA explained by the spatial structure component of the models presented inTable 2 ranged from 26.24% to 27.66%.
Analyses considering all 471 MRSA cases in catchment areas (Table 3) showed that vari-ables significantly increasing the RR of any MRSA were a combination of HA-MRSA andCA-MRSA predictors (i.e., poor health, residency in care homes, and household overcrowd-ing). A negative association was only identified in the combined analysis (n = 471). The RR of
Table 1. Ecological regression models for HA-MRSA in 513 LSOAs.
Unadjusted Adjusted
RR 95% CI DIC mD pD RR5th Qi
95% CI RR 95% CI DIC mD pD
Population Density
- - - - - - - - - - - - -
Deprivation¥
Households Deprived in 2–4Dimensions (%)
1.53 1.15–2.03 980.59 874.06 106.52 1.15 0.66–2.03 1.57 1.06–2.33 981.68 872.53 109.15
Health¥
Usual Residents with Daily ActivitiesVery Limited (%)
1.10 1.04–1.17 979.57 872.50 107.07 1.22 0.72–2.08 1.10 1.01–1.19 980.47 870.54 109.93
Barriers to Housing
- - - - - - - - - - - - -
Household Overcrowding¥
- - - - - - - - - - - - -
Environment
- - - - - - - - - - - - -
Usual Residents Living inCommunal Establishments (%)
Communal Care Homes (%) 1.24 1.12–1.37 975.90 874.08 101.82 1.61 1.05–2.50 1.24 1.12–1.37 975.14 872.06 103.08
Usual Residents by Ethnic Group(%)
Any Black (%) 1.53 1.16–2.02 980.37 874.14 106.23 1.29 0.77–2.16 1.45 1.03–2.05 981.54 871.79 109.75
Usual Residents by Length ofResidency in the UK (%)¥
- - - - - - - - - - - - -Household Spaces by DwellingType (%)
Household Spaces in Purpose-BuiltBlock of Flats or Tenements (%)
1.01 1.00–1.01 980.81 873.77 107.04 1.52 0.97–2.38 1.01 1.00–1.01 980.62 871.19 109.43
A total of 281 HA-MRSA cases were identified in the study areas. Hierarchical Models with unstructured random effects (iid) were in all instances
preferred over models with structured (spatial) random effects. The table shows variables that were found to be significant predictors of MRSA following
adjustment for the quintile-stratified percentage of usual residents attending a hospital. All identified variables were also significant in unadjusted analyses.
Only the lowest DIC model is presented in cases in which several indicator variables measuring the same overarching population trait were found to be
significant. RR 5th Qi shows the RR of HA-MRSA in areas with more hospital attendance (fifth quintile) compared to in areas with less residents attending
a hospital (first quintile). The RR for the covariate is shown in the “RR” column. Ninety-five percent credible intervals for RRs are also shown. The DIC is
shown along with its two components summarising the fit (posterior mean of the deviance; mD) and complexity (number of effective parameters; pD) of
the models.¥ The variable indicator with lowest DIC is shown.
doi:10.1371/journal.pmed.1001944.t001
MRSA Spatial Epidemiology in Relation to Socioeconomic Deprivation
PLOSMedicine | DOI:10.1371/journal.pmed.1001944 January 26, 2016 11 / 24

any MRSA decreased by about 30% in areas where more usual residents were of white ethnicity(36.30% unadjusted model; 26.20% adjusted model). See Table 3.
The area-specific RRs of MRSA compared to the whole catchment area in adjusted modelsaccounting for hospital attendance and households deprived in 2–4 dimensions (HA-MRSA)or 1–2 dimensions (CA-MRSA) are shown in Fig 3. The overall RR of HA-MRSA ranged from0.82 to 12.46 depending on the LSOA and that of CA-MRSA from 0.99 to 1.01. The RR for allMRSA combined (n = 471) in a model adjusted for hospital attendance and householdsdeprived in 2–4 dimensions ranged from 0.76 to 6.70 depending on the LSOA.
Table 2. Ecological regression models for CA-MRSA in 513 LSOAs.
Unadjusted Adjusted
RR 95% CI DIC mD pD RR5th Qi
95% CI RR 95% CI DIC mD pD
Population Density
- - - - - - - - - - - - -
Deprivation¥
Households Deprived in 1–2Dimensions (%)
2.02 1.33–3.17 545.22 543.06 2.15 1.63 0.78–3.56 1.72 1.03–2.94 550.08 543.97 6.11
Health¥
- - - - - - - - - - - - -Barriers to Housing
Wider Barriers Sub-domain Score 1.98 1.33–2.99 544.97 542.82 2.15 2.00 1.05–3.98 1.76 1.16–2.70 547.12 541.02 6.10
Household Overcrowding¥
Households with bedroom occupancyrating of −1 (%)
1.84 1.24–2.73 546.94 544.79 2.15 1.97 1.02–3.98 1.58 1.04–2.41 549.75 543.65 6.10
Environment
- - - - - - - - - - - - -
Usual Residents Living in CommunalEstablishments (%)
- - - - - - - - - - - - -Usual Residents by Ethnic Group (%)
Black African (%) 2.10 1.40–3.19 543.06 540.91 2.15 1.53 0.73–3.32 1.86 1.15–3.10 547.99 541.89 6.10
Usual Residents by Length ofResidency in the UK (%)¥
<2 y (%) 1.72 1.16–2.58 549.00 546.85 2.15 2.57 1.38–5.02 1.77 1.19–2.66 546.27 546.27 6.10
Household Spaces by Dwelling Type(%)
Household Spaces in Purpose-BuiltBlock of Flats or Tenements (%)
1.01 1.01–1.02 540.14 538.00 2.15 1.92 1.01–3.81 1.01 1.01–1.02 543.13 537.03 6.10
A total of 103 CA-MRSA cases were identified in the study areas. Hierarchical Models with unstructured plus structured (spatial) random effects (BYM)
were in all instances preferred over models without spatial or unstructured random effects. The table shows variables that were found to be significant
predictors of MRSA following adjustment for the quintile-stratified percentage of usual residents attending a hospital. All identified variables were also
significant in unadjusted analyses. Only the lowest DIC model is presented in cases in which several indicator variables measuring the same overarching
population trait were found to be significant. RR 5th Qi shows the RR of CA-MRSA in areas with more hospital attendance (fifth quintile) compared to in
areas with less residents attending a hospital (first quintile). The RR for the covariate is shown in the “RR” column. Ninety-five percent credible intervals
for RRs are also shown. The DIC is shown along with its two components summarising the fit (posterior mean of the deviance; mD) and complexity
(number of effective parameters; pD) of the models.¥ The variable indicator with lowest DIC is shown.
doi:10.1371/journal.pmed.1001944.t002
MRSA Spatial Epidemiology in Relation to Socioeconomic Deprivation
PLOSMedicine | DOI:10.1371/journal.pmed.1001944 January 26, 2016 12 / 24

Correlations of Area-Level Predictors of Genotypically DefinedMRSATypesModerate (Pearson correlation coefficient [PCC]� 0.70 or� −0.70) to strong (PCC> 0.80 or< −0.80) correlations amongst significant predictors of HA-MRSA, CA-MRSA, or any MRSA
Table 3. Ecological regression models for all MRSA in 513 LSOAs.
Unadjusted Adjusted
RR 95% CI DIC mD pD RR5th Qi
95% CI RR 95% CI DIC mD pD
Population Density
- - - - - - - - - - - - -
Deprivation ¥
Households deprived in 2–4dimensions (%)
1.64 1.32–2.04 1,286.15 1,170.96 115.19 1.39 0.91–2.13 1.49 1.12–1.99 1,286.70 1,168.97 117.73
Health¥
Usual Residents with DailyActivities Very Limited (%)
1.58 1.27–1.96 1,286.17 1,166.92 119.24 1.55 1.04–2.32 1.37 1.05–1.78 1,286.38 1,165.32 121.06
Barriers to Housing
- - - - - - - - - - - - -
Household Overcrowding¥
Households with bedroomoccupancy rating of −1 (%)
1.53 1.23–1.90 1,289.30 1,170.71 118.58 1.70 1.19–2.43 1.38 1.10–1.73 1,286.07 1,167.79 118.27
Environment
- - - - - - - - - - - - -Usual Residents Living inCommunalEstablishments (%)
Communal Care Homes (%) 2.31 1.68–3.15 1,283.78 1,172.34 111.43 1.81 1.29–2.55 2.12 1.54–2.90 1,279.11 1,169.68 109.42
Usual Residents by EthnicGroup (%)
Any Black (%) 1.65 1.34–2.05 1,285.05 1,169.71 115.34 1.45 0.97–2.17 1.47 1.13–1.91 1,285.50 1,167.43 118.08
Black African (%) 1.66 1.34–2.06 1,285.34 1,170.34 115.00 1.45 0.98–2.15 1.50 1.16–1.95 1,285.05 1,167.84 117.21
Any White (%) 0.64 0.51–0.79 1,286.74 1,167.58 119.16 1.55 1.04–2.32 0.74 0.57–0.96 1,286.49 1,165.44 121.05
Usual Residents byLength of Residency in theUK (%)¥
- - - - - - - - - - - - -
Household Spaces byDwelling Type (%)
Household Spaces inPurpose-Built Block of Flats
or Tenements (%)
1.01 1.00–1.01 1,286.96 1,168.83 118.14 1.71 1.21–2.44 1.01 1.00–1.01 1,283.39 1,166.27 117.11
A total of 471 MRSA cases were identified in the study areas. Hierarchical Models with unstructured random effects (iid) were in all instances preferred
over models with structured (spatial) random effects. The table shows variables that were found to be significant predictors of MRSA following adjustment
for the quintile-stratified percentage of usual residents attending a hospital. All identified variables were also significant in unadjusted analyses. Only the
lowest DIC model is presented in cases in which several indicator variables measuring the same overarching population trait were found to be significant.
RR 5th Qi shows the RR of any MRSA in areas with more hospital attendance (fifth quintile) compared to in areas with less residents attending a hospital
(first quintile). The RR for the covariate is shown in the “RR” column. Ninety-five percent credible intervals for RRs are also shown. The DIC is shown
along with its two components summarising the fit (posterior mean of the deviance; mD) and complexity (number of effective parameters; pD) of themodels.¥ The variable indicator with lowest DIC is shown.
doi:10.1371/journal.pmed.1001944.t003
MRSA Spatial Epidemiology in Relation to Socioeconomic Deprivation
PLOSMedicine | DOI:10.1371/journal.pmed.1001944 January 26, 2016 13 / 24

are presented for the catchment areas in Fig 4. Of note, the percentage of usual residents livingin communal care homes or having moved to the UK within the 2 y preceding the 2011 censuswere not correlated with deprivation or any other significant predictors of MRSA.
DiscussionTo the best of our knowledge, this is the first study to use spatial models to describe the epide-miology of MRSA and to investigate genetically defined CA- and HA-MRSA classificationsseparately in relation to social determinants and transmission niches. Multiple reports had pre-viously linked MRSA rates to postcode or neighbourhood data [52–59], but only classical tests[4,54], nonspatial regression [52,53,55–61], or cluster detection methods [52,58] had been usedto determine the impact of socioeconomic indicators. Here for the first time, we provideunprecedented insight into the epidemiology of HA- and CA-MRSA in the UK, by accountingfor spatial effects—and hence the potential for impact from neighbouring geographies—andconfounding hospital attendance.
We specifically conducted the study in three adjacent boroughs of South East London totake advantage of the wide variation that exists in population traits across LSOAs. Our worksuggests that the most deprived areas are at greater risk of MRSA but that the causality of thisassociation differs depending on the MRSA genetic classification. We hypothesise that relevantrisk factors must lie within the deprivation domains considered in the 2011 census (i.e., house-holds deprived in any dimension). In contrast, a lack of association with the 2010 IMD overallscore suggests that such a wide scoring predominantly weighted by income and employment(45.00%) with lesser contribution of wider barriers and household overcrowding is less helpfulat describing the spatial epidemiology of MRSA in the UK.
Vast analytical complexity arises from disease mapping studies in which spatial correlationsabound, which can result in spurious associations. We found that areas with a higher percent-age of deprived households correlated closely with various other identified risk factors for
Fig 3. Maps for RR of HA- and CA-MRSA in LSOAs compared to the whole catchment area, in ecological regression models accounting for area-specific quintile-stratified percentage of usual residents attending a hospital and households deprived in 2–4 dimensions (HA-MRSA) or 1–2dimensions (CA- MRSA). Ecological regression models account for the distribution and effect of risk factors for MRSA in addition to the observed andexpected counts of HA- or CA-MRSA given the standardised age and gender population structure in each LSOA. HA-MRSA (A) was modelled consideringunstructured random effects only (iid model). CA-MRSA (B) was modelled considering both unstructured and structured (spatial) random effects (BYMmodel). Cut-off values in figure legends correspond to quantiles for area-specific RRs of HA- and CA-MRSA, respectively.
doi:10.1371/journal.pmed.1001944.g003
MRSA Spatial Epidemiology in Relation to Socioeconomic Deprivation
PLOSMedicine | DOI:10.1371/journal.pmed.1001944 January 26, 2016 14 / 24

MRSA, especially black or black African ethnicity, poor housing, poor health, and hospitalattendance. In this context, we sought to address whether the most important precursor foracquiring MRSA is living in deprived conditions or attending a hospital as a result of beingdeprived and whether it is the hospital or the community that presently constitutes the maintransmission site for MRSA.
We found that 26.24% to 28.67% of area-level variation in CA-MRSA could be explained bythe spatial arrangement of LSOAs, implying that residents in locations neighbouring high-riskareas are themselves at higher risk of infection and/or colonisation compared to more distantlocations. In contrast, no spatial patterns were observed for HA-MRSA, suggesting that little orno transmission of hospital lineages occurs in the community. These findings indicate that thepredominant transmission route for genetically classified CA-MRSA in the UK is still the com-munity, whilst transmission of HA-MRSA continues to be hospital led, with little evidence fortransmission outside the health care or care home setting. The implications are 2-fold. The firstimplication is that an association between HA-MRSA and deprivation may result from theincreased likelihood of attending a hospital as a result of being deprived rather than from livingin deprived conditions alone. This is supported by additional markers of poor health (i.e., dailyactivities very limited) and the percentage of usual residents living in communal care homesbeing significant predictors for HA-MRSA and by the lack of an independent association with
Fig 4. Correlation network of area-level significant predictors of MRSA infection or colonisation in catchment areas of the London hospital cohort.Moderate positive PCCs are shown by black dashed edges (�0.70 and�0.80) and strong PCCs by continuous black edges (>0.80). Moderate negativePCCs are shown by red dashed edges (�−0.80 and�−0.70) and strong negative PCCs by continuous red edges (<−0.80). The size of vertices reflects thenumber of variables correlated with that vertex. Vertex colours represent variable indicators of health (green), deprivation (red), ethnicity (yellow), widerbarriers and household overcrowding (blue), and household spaces by dwelling type (black). Areas with more households deprived in any dimension arethose where more persons of black or black African ethnicity reside and those with greater percentages of overcrowded households. The later alsocorrespond to those where more household spaces are located in purpose-built blocks of flats or tenements and to those with worse wider barriers scores.Negative PCCs show that persons of white ethnicity tend to reside outside the boundaries of the deprived areas where usual residents of black or blackAfrican ethnicity predominate. More residents from deprived areas self-report having daily activities very limited because of poor health, have attended aLondon accident and emergency hospital department, or have been admitted to hospital as inpatients around the time of the study. The greatest number ofmoderate to strong correlations are for the percentage of households deprived in 2–4 dimensions (n = 7), bedroom occupancy rating of –1 (n = 6), and blackAfrican ethnicity (n = 6). Maps for predictor variables of HA-, CA-, and any MRSA are shown in Fig 5.
doi:10.1371/journal.pmed.1001944.g004
MRSA Spatial Epidemiology in Relation to Socioeconomic Deprivation
PLOSMedicine | DOI:10.1371/journal.pmed.1001944 January 26, 2016 15 / 24

wider barriers and/or household overcrowding alone. Of note, previous studies reporting a linkbetween socioeconomic deprivation and S. aureus bacteraemia [56], postoperative MRSAinfection [4], or HA-MRSA [55] had not adjusted for area-level attendance at hospitals. Sec-ondly, there is an implication that an association between CA-MRSA and deprivation mostlikely arises from living in deprived conditions, rather than from attending a hospital as a resultof being deprived. This is supported by the lack of association between CA-MRSA and markersof poor health (e.g., daily activities very limited because of poor health) or residency in carehomes. Instead, CA-MRSA is associated with wider barriers (a combination of homelessness,low income, and household overcrowding) and with the percentage of households with bed-room occupancy rates reflecting overcrowding. We hypothesise that in the UK an associationwith hospital attendance may be spurious, due to more persons in deprived areas attending ahospital, although evidence of ongoing or limited transmission of CA-MRSA in the hospital
Fig 5. Maps for significant predictors of MRSA infection or colonisation in catchment areas of the London hospital cohort. The brown coloured mapshows the percentage of usual residents of at least 1 y of age in each LSOAwho attended any London accident or emergency department or had beenadmitted to any London hospital between 1 April 2011 and 31 March 2012. Blue coloured maps show the spatial distribution of population traits associatedwith either lower or increased risk of MRSA infection or colonisation following adjustment for hospital attendance data. The cut-off values in figure legendscorrespond to the variable quantiles. The units in the legends correspond to percentage of usual residents (with daily activities very limited; living incommunal care homes; of any white, black, or black African ethnicity; with length of residency in the UK <2 y), percentage of households or householdspaces (in purpose-built blocks of flats; with bedroom occupancy rating of −1; deprived in 2–4 or 1–2 dimensions) and a score, which is a combined measureof household overcrowding, homelessness, and difficulty of access to owner occupation (wider barriers).
doi:10.1371/journal.pmed.1001944.g005
MRSA Spatial Epidemiology in Relation to Socioeconomic Deprivation
PLOSMedicine | DOI:10.1371/journal.pmed.1001944 January 26, 2016 16 / 24
setting is lacking. CA-MRSA has previously been linked to socioeconomic deprivation[54,55,57,58,60], public housing [52], and alternative housing (e.g., shelters) [53,59] in studiesoutside the UK. A link between CA-MRSA and household overcrowding has been shown insome non-UK studies [54,61] but not others [52].
These findings are important because whilst the overall burden of MRSA in Europe isdeclining [62], due to decline in HA-MRSA lineages [23,63,64], CA-MRSA lineages are emerg-ing in every continent [17,65,66]. The prevalence of CA-MRSA in Europe is thought to beincreasing [7] partly through continuous importation from endemic regions [67,68]. Our worksuggests that the prevalence of CA-MRSA in South East London is significant (26.28% of caseswere CA-MRSA), and may be increasing based on observations that community-level trans-mission from deprived areas to neighbouring areas is ongoing and that importation ofCA-MRSA is linked with recent immigration to the UK.
An advantage to our study is that it has provided a representative sample of usual residentsreceiving care in the catchment areas. The vast majority of biological samples from public andprivate patients residing in the study areas are analysed by laboratories in the cohort, whilst thecontribution of other diagnostic providers is negligible. This is in contrast to studies in which asample may be restricted to a particular population layer, such as patients with medical insur-ance. There are several limitations to our study. Firstly, analyses of aggregated data risk the“ecological fallacy” whereby relationships apparent at the group level are spuriously assumedto operate at the individual level. This bias is a result of the fact that, unlike individual‐levelstudies, group‐level studies do not link individual outcome events to individual exposure histo-ries [69,70]. We therefore recognise the need for parallel analysis of individual level data torevisit the impact of socioeconomic deprivation and demographic indicators on risk of HA-and CA-MRSA infection or colonisation in Europe. Secondly, choosing small values for thescale parameter of priors, the LSOA-specific RRs for CA-MRSA compared to the whole catch-ment area, suggested an almost constant risk across the area (RRs: 0.99–1.01). The apparent“flat risk,” however, almost undoubtedly resulted from the very low numbers of observedCA-MRSA cases in each LSOA (minimum = 0; maximum = 3) and from comparing individualLSOA RRs against the average as opposite to against other/neighbouring LSOAs. Increasingthe scale parameter for the prior on the spatial effect precision, and hence increasing the weightof small observations, significant differences in CA-MRSA LSOA-specific RRs were apparent,with LSOA-specific posterior probabilities indicating excess risk for some of the areas. More-over, greater percentage variation attributable to spatial effects was also observed at greater val-ues of the scale parameter. This was in sharp contrast with HA-MRSA, with which effects ofdifferent levels of spatial smoothing on the spatial field imposed by alternative prior parametershad little influence on LSOA RRs, and percentage variation attributable to spatial effectsremained negligible regardless of prior choice. Consequently, we argue that, unlike HA-MRSA,the distribution of CA-MRSA cases was spatially structured.
In summary, this study shows that the predominant transmission niches for HA- andCA-MRSA in South East London are specific to each genetic classification. HA-MRSA lineagesoriginate from hospitals, and there is no evidence that active transmission of these lineagesoccurs outside the health care setting. We present evidence that CA-MRSA strains are spread-ing in the community from the most deprived areas where favourable conditions are met.There is also importation from recent immigration. The extent to which CA-MRSA is trans-mitting within health care premises is unknown, particularly in the context of declining overallMRSA prevalence in UK hospitals due to stringent control measures. However, in some coun-tries, CA-MRSA is increasingly implicated in nosocomial infections [13,16], has begun tospread within hospitals [13], and may have the capacity to displace HA-MRSA in these settings[71–73], particularly given repeated community admissions [26] coupled with poor
MRSA Spatial Epidemiology in Relation to Socioeconomic Deprivation
PLOSMedicine | DOI:10.1371/journal.pmed.1001944 January 26, 2016 17 / 24

adaptability of HA-MRSA to persist in the community [21,63]. In this context, we show thatfactors are at play in the UK that could result in the displacement of HA-MRSA lineages infavour of CA-MRSA in the future. We propose that future efforts to master sustained controlof MRSA in hospitals and the community should focus on prevention of community spreadwithin deprived areas. Future reviews of UK hospital admission screening policies for MRSAshould carefully consider the growing threat of importation of CA-MRSA lineages intohospitals.
Supporting InformationS1 Methods. Description of modelling approach.(DOCX)
S1 Table. Summary statistics for area-level variables in 513 LSOAs within catchment areasof the hospital cohort. Data was obtained from the 2011 England andWales census [30]unless otherwise specified. 1The English Indices of Deprivation 2010 data [36]. 2HSCIC data.(DOC)
S2 Table. Population structure of 513 LSOAs within catchment areas of the hospital cohort.Data from the 2011 England and Wales census [30].(DOC)
S1 Text. Individual patient-level metadata.(XLS)
S2 Text. LSOA-level aggregated metadata.(XLS)
AcknowledgmentsDigital boundaries for maps used in this manuscript were obtained from freely availablesources under the Ordnance Survey OpenData and the Open Government Licensing agree-ment, UK. Our manuscript contains National Statistics data Crown copyright and databaseright 2012 and Ordnance Survey data Crown copyright and database right 2012.
Author ContributionsConceived and designed the experiments: OTA CGMWG BSC JDE TKy. Performed the exper-iments: OTA JRB RAS AP AI HM PHMWG. Analyzed the data: OTA RAS MWG BSC TKy.Contributed reagents/materials/analysis tools: JRB RAS AI ND TKa CGMWG.Wrote the firstdraft of the manuscript: OTA TKy. Contributed to the writing of the manuscript: OTA SDGJAO AA BSC JDE TKy. Agree with the manuscript’s results and conclusions: OTA JRB RASAP AI HM PH AA SDG JAO ND TKa CGMWG BSC JDE TKy. Collected all positive MRSAisolates from participant laboratories during the study period: ND TKa AP. All authors haveread, and confirm that they meet, ICMJE criteria for authorship.
References1. Semenza JC, Giesecke J. Intervening to reduce inequalities in infections in Europe. American journal
of public health. 2008; 98(5):787–92. doi: 10.2105/AJPH.2007.120329 PMID: 18381991
2. Semenza JC. Strategies to intervene on social determinants of infectious diseases. Euro surveillance:bulletin Europeen sur les maladies transmissibles = European communicable disease bulletin. 2010;15(27):32–9.
MRSA Spatial Epidemiology in Relation to Socioeconomic Deprivation
PLOSMedicine | DOI:10.1371/journal.pmed.1001944 January 26, 2016 18 / 24

3. Gillespie IA, Mook P, Little CL, Grant KA, McLauchlin J. Human listeriosis in England, 2001–2007:association with neighbourhood deprivation. Euro surveillance: bulletin Europeen sur les maladiestransmissibles = European communicable disease bulletin. 2010; 15(27):7–16.
4. Bagger JP, Zindrou D, Taylor KM. Postoperative infection with meticillin-resistant Staphylococcusaureus and socioeconomic background. Lancet. 2004; 363(9410):706–8. PMID: 15001331
5. Commission of the European Communities. White paper. Together for Health: A strategic approach forthe EU 2008–2013. Brussels; 2007. http://ec.europa.eu/health-eu/doc/whitepaper_en.pdf
6. Semenza JC, Suk JE, Tsolova S. Social determinants of infectious diseases: a public health priority.Euro surveillance: bulletin Europeen sur les maladies transmissibles = European communicable dis-ease bulletin. 2010; 15(27):2–4.
7. Otter JA, French GL. Molecular epidemiology of community-associated meticillin-resistant Staphylo-coccus aureus in Europe. The Lancet Infectious diseases. 2010; 10(4):227–39. doi: 10.1016/S1473-3099(10)70053-0 PMID: 20334846
8. Herold BC, Immergluck LC, Maranan MC, Lauderdale DS, Gaskin RE, Boyle-Vavra S, et al. Commu-nity-acquired methicillin-resistant Staphylococcus aureus in children with no identified predisposingrisk. Jama. 1998; 279(8):593–8. PMID: 9486753
9. Lowy FD. Staphylococcus aureus infections. New Engl J Med. 1998; 339:520–32. PMID: 9709046
10. Coia JE, Duckworth GJ, Edwards DI, Farrington M, Fry C, Humphreys H, et al. Guidelines for the con-trol and prevention of meticillin-resistant Staphylococcus aureus (MRSA) in healthcare facilities. TheJournal of hospital infection. 2006; 63 Suppl 1:S1–44. PMID: 16581155
11. Harbarth S, Sax H, Fankhauser-Rodriguez C, Schrenzel J, Agostinho A, Pittet D. Evaluating the proba-bility of previously unknown carriage of MRSA at hospital admission. The American journal of medicine.2006; 119(3):275 e15-23.
12. Naimi TS, LeDell KH, Como-Sabetti K, Borchardt SM, Boxrud DJ, Etienne J, et al. Comparison of com-munity- and health care-associated methicillin-resistant Staphylococcus aureus infection. Jama. 2003;290(22):2976–84. PMID: 14665659
13. Egea AL, Gagetti P, Lamberghini R, Faccone D, Lucero C, Vindel A, et al. New patterns of methicillin-resistant Staphylococcus aureus (MRSA) clones, community-associated MRSA genotypes behave likehealthcare-associated MRSA genotypes within hospitals, Argentina. International journal of medicalmicrobiology: IJMM. 2014; 304(8):1086–99. doi: 10.1016/j.ijmm.2014.08.002 PMID: 25240872
14. Popovich KJ, Weinstein RA. Commentary: The graying of methicillin-resistant Staphylococcus aureus.Infection control and hospital epidemiology. 2009; 30(1):9–12. doi: 10.1086/592709 PMID: 19046052
15. Popovich KJ, Weinstein RA, Hota B. Are community-associated methicillin-resistant Staphylococcusaureus (MRSA) strains replacing traditional nosocomial MRSA strains? Clinical infectious diseases: anofficial publication of the Infectious Diseases Society of America. 2008; 46(6):787–94.
16. Otter JA, French GL. Community-associated meticillin-resistant Staphylococcus aureus strains as acause of healthcare-associated infection. The Journal of hospital infection. 2011; 79(3):189–93. doi:10.1016/j.jhin.2011.04.028 PMID: 21741111
17. Chua K, Laurent F, Coombs G, Grayson ML, Howden BP. Antimicrobial resistance: Not community-associated methicillin-resistant Staphylococcus aureus (CA-MRSA)! A clinician's guide to communityMRSA—its evolving antimicrobial resistance and implications for therapy. Clinical infectious diseases:an official publication of the Infectious Diseases Society of America. 2011; 52(1):99–114.
18. Millar BC, Loughrey A, Elborn JS, Moore JE. Proposed definitions of community-associated meticillin-resistant Staphylococcus aureus (CA-MRSA). The Journal of hospital infection. 2007; 67(2):109–13.PMID: 17669546
19. Otter JA, French GL. Community-associated meticillin-resistant Staphylococcus aureus: the case for agenotypic definition. The Journal of hospital infection. 2012; 81(3):143–8. doi: 10.1016/j.jhin.2012.04.009 PMID: 22622448
20. Zetola N, Francis JS, Nuermberger EL, Bishai WR. Community-acquired meticillin-resistant Staphylo-coccus aureus: an emerging threat. The Lancet Infectious diseases. 2005; 5(5):275–86. PMID:15854883
21. Grundmann H, Aanensen DM, van denWijngaard CC, Spratt BG, Harmsen D, Friedrich AW. Geo-graphic distribution of Staphylococcus aureus causing invasive infections in Europe: a molecular-epi-demiological analysis. PLoS Med. 2010; 7(1):e1000215. doi: 10.1371/journal.pmed.1000215 PMID:20084094
22. Tiemersma EW, Bronzwaer SL, Lyytikainen O, Degener JE, Schrijnemakers P, Bruinsma N, et al.Methicillin-resistant Staphylococcus aureus in Europe, 1999–2002. Emerging infectious diseases.2004; 10(9):1627–34. PMID: 15498166
MRSA Spatial Epidemiology in Relation to Socioeconomic Deprivation
PLOSMedicine | DOI:10.1371/journal.pmed.1001944 January 26, 2016 19 / 24

23. Johnson AP, Davies J, Guy R, Abernethy J, Sheridan E, Pearson A, et al. Mandatory surveillance ofmethicillin-resistant Staphylococcus aureus (MRSA) bacteraemia in England: the first 10 years. TheJournal of antimicrobial chemotherapy. 2012; 67(4):802–9. doi: 10.1093/jac/dkr561 PMID: 22223229
24. Derde LP, Cooper BS, Goossens H, Malhotra-Kumar S, Willems RJ, Gniadkowski M, et al. Interven-tions to reduce colonisation and transmission of antimicrobial-resistant bacteria in intensive care units:an interrupted time series study and cluster randomised trial. The Lancet Infectious diseases. 2014; 14(1):31–9. doi: 10.1016/S1473-3099(13)70295-0 PMID: 24161233
25. Lee AS, Cooper BS, Malhotra-Kumar S, Chalfine A, Daikos GL, Fankhauser C, et al. Comparison ofstrategies to reduce meticillin-resistant Staphylococcus aureus rates in surgical patients: a controlledmulticentre intervention trial. BMJ open. 2013; 3(9):e003126. doi: 10.1136/bmjopen-2013-003126PMID: 24056477
26. Harris SR, Cartwright EJ, Torok ME, Holden MT, Brown NM, Ogilvy-Stuart AL, et al. Whole-genomesequencing for analysis of an outbreak of meticillin-resistant Staphylococcus aureus: a descriptivestudy. The Lancet Infectious diseases. 2013; 13(2):130–6. doi: 10.1016/S1473-3099(12)70268-2PMID: 23158674
27. Bastin L, Rollason J, Hilton A, Pillay D, Corcoran C, Elgy J, et al. Spatial aspects of MRSA epidemiol-ogy: a case study using stochastic simulation, kernel estimation and SaTScan. Int J Geogr Inf Sci.2007; 21(7):811–36.
28. Gray RR, Tatem AJ, Johnson JA, Alekseyenko AV, Pybus OG, Suchard MA, et al. Testing Spatiotem-poral Hypothesis of Bacterial Evolution Using Methicillin-Resistant Staphylococcus aureus ST239Genome-wide Data within a Bayesian Framework. Mol Biol Evol. 2011; 28(5):1593–603. doi: 10.1093/molbev/msq319 PMID: 21112962
29. Hughes J, Stabler R, Gaunt M, Karadag T, Desai N, Betley J, et al. Clonal variation in high- and low-level phenotypic and genotypic mupirocin resistance of MRSA isolates in south-east London. The Jour-nal of antimicrobial chemotherapy. 2015. dkv248–. doi: 10.1093/jac/dkv248
30. UK Data Service Census Support. Office for National Statistics, 2011 Census: Aggregate data(England andWales). http://infuse.mimas.ac.uk. Licensed under the terms of the Open GovernmentLicence. [http://www.nationalarchives.gov.uk/doc/open-government-licence/version/2].
31. Li H, Durbin R. Fast and accurate short read alignment with Burrows-Wheeler transform. Bioinformat-ics. 2009; 25(14):1754–60. doi: 10.1093/bioinformatics/btp324 PMID: 19451168
32. Altschul SF, GishW, Miller W, Myers EW, Lipman DJ. Basic local alignment search tool. Journal ofmolecular biology. 1990; 215(3):403–10. PMID: 2231712
33. Miller CE, Batra R, Cooper BS, Patel AK, Klein J, Otter JA, et al. An association between bacterialgenotype combined with a high-vancomycin minimum inhibitory concentration and risk of endocarditisin methicillin-resistant Staphylococcus aureus bloodstream infection. Clinical infectious diseases: anofficial publication of the Infectious Diseases Society of America. 2012; 54(5):591–600.
34. Office for National Statistics, 2011 Census: Digitised Boundary Data (England andWales). UK DataService Census Support. http://www.ons.gov.uk/ons/guide-method/geography/products/census/index.html
35. UK Data Service Census Support. Office for National Statistics. GeoConvert. http://geoconvert.mimas.ac.uk/.
36. English indices of deprivation 2010. Department for Communities and Local Government—Publica-tions—GOV.UK. https://www.gov.uk/government/statistics/english-indices-of-deprivation-2010.
37. Health and Social Care Information Centre (HSCIC). Hospital Episode Statistics. http://www.hscic.gov.uk/hes.
38. Rue H, Martino S, Chopin N. Approximate Bayesian inference for latent Gaussian models by using inte-grated nested Laplace approximations. J R Stat Soc B. 2009; 71:319–92.
39. R Core Team. R: A Language and Environment for Statistical Computing Vienna, Austria: R Founda-tion for Statistical Computing; 2013. http://www.r-project.org/
40. Rue H, Martino S. Approximate Bayesian inference for hierarchical Gaussian Markov random fieldmodels. J Stat Plan Infer. 2007; 137(10):3177–92.
41. Roos M, Held L. Sensitivity analysis in Bayesian generalized linear mixed models for binary data.Bayesian Anal. 2011; 6(2):259–78.
42. Schrodle B, Held L, Riebler A, Danuser J. Using integrated nested Laplace approximations for the eval-uation of veterinary surveillance data from Switzerland: a case-study. J R Stat Soc C-Appl. 2011;60:261–79.
43. Blangiardo M, Cameletti M, Baio G, Rue H. Spatial and spatio-temporal models with R-INLA. Spatialand spatio-temporal epidemiology. 2013; 7:39–55. PMID: 24377114
MRSA Spatial Epidemiology in Relation to Socioeconomic Deprivation
PLOSMedicine | DOI:10.1371/journal.pmed.1001944 January 26, 2016 20 / 24

44. Besag J, York J, Mollie A. Bayesian Image-Restoration, with 2 Applications in Spatial Statistics. Ann IStat Math. 1991; 43(1):1–20.
45. S B. Revisiting Spherical Trigonometry with Orthogonal Projectors. Math Assoc Am Coll Math J. 2004;35:375–81.
46. Bivand R, Lewin-Koh N. Maptools: Tools for reading and handling spatial objects. 2014. http://cran.r-project.org/package=maptools
47. Bivand R, Hauke J, Kossowski T. Computing the Jacobian in Gaussian Spatial Autoregressive Models:An Illustrated Comparison of Available Methods. Geogr Anal. 2013; 45(2):150–79.
48. Bivand R, Piras G. Comparing Implementations of Estimation Methods for Spatial Econometrics. J StatSoftw. 2015; 63(18):1–36.
49. Rue HMS, Chopin N, Sara Martino NC. Implementing approximate Bayesian inference for latentGaussian models using integrated nested Laplace approximations: A manual for the inla-program. J RStat Soc Ser B (Statistical Methodol). 2009(71: ):319–92.
50. Bjornstad ON. Ncf: spatial nonparametric covariance functions. 2013. http://cran.r-project.org/package=ncf
51. Csardi G NT. The igraph software package for complex network research. InterJournal. 2006;ComplexSystems:1695. http://igraph.org
52. Hota B, Ellenbogen C, Hayden MK, Aroutcheva A, Rice TW,Weinstein RA. Community-associatedmethicillin-resistant Staphylococcus aureus skin and soft tissue infections at a public hospital: do publichousing and incarceration amplify transmission? Archives of internal medicine. 2007; 167(10):1026–33. PMID: 17533205
53. Popovich KJ, Smith KY, Khawcharoenporn T, Thurlow CJ, Lough J, Thomas G, et al. Community-asso-ciated methicillin-resistant Staphylococcus aureus colonization in high-risk groups of HIV-infectedpatients. Clinical infectious diseases: an official publication of the Infectious Diseases Society of Amer-ica. 2012; 54(9):1296–303.
54. Bratu S, Landman D, Gupta J, Trehan M, Panwar M, Quale J. A population-based study examining theemergence of community-associated methicillin-resistant Staphylococcus aureus USA300 in NewYork City. Annals of clinical microbiology and antimicrobials. 2006; 5:29. PMID: 17137512
55. Casey JA, Cosgrove SE, Stewart WF, Pollak J, Schwartz BS. A population-based study of the epidemi-ology and clinical features of methicillin-resistant Staphylococcus aureus infection in Pennsylvania,2001–2010. Epidemiology and infection. 2013; 141(6):1166–79. doi: 10.1017/S0950268812001872PMID: 22929058
56. Huggan PJ, Wells JE, Browne M, Richardson A, Murdoch DR, Chambers ST. Population-based epide-miology of Staphylococcus aureus bloodstream infection in Canterbury, New Zealand. Internal medi-cine journal. 2010; 40(2):117–25. doi: 10.1111/j.1445-5994.2009.01910.x PMID: 19226421
57. Tong SY, van Hal SJ, Einsiedel L, Currie BJ, Turnidge JD. Impact of ethnicity and socio-economic sta-tus on Staphylococcus aureus bacteremia incidence and mortality: a heavy burden in Indigenous Aus-tralians. BMC infectious diseases. 2012; 12:249. doi: 10.1186/1471-2334-12-249 PMID: 23043704
58. Tong SY, Bishop EJ, Lilliebridge RA, Cheng AC, Spasova-Penkova Z, Holt DC, et al. Community-asso-ciated strains of methicillin-resistant Staphylococcus aureus and methicillin-susceptible S. aureus inindigenous Northern Australia: epidemiology and outcomes. The Journal of infectious diseases. 2009;199(10):1461–70. doi: 10.1086/598218 PMID: 19392622
59. Popovich KJ, Weinstein RA, Aroutcheva A, Rice T, Hota B. Community-associated methicillin-resistantStaphylococcus aureus and HIV: intersecting epidemics. Clinical infectious diseases: an official publi-cation of the Infectious Diseases Society of America. 2010; 50(7):979–87.
60. Murphy CR, Hudson LO, Spratt BG, Elkins K, Terpstra L, Gombosev A, et al. Predictors of hospitalswith endemic community-associated methicillin-resistant Staphylococcus aureus. Infection control andhospital epidemiology. 2013; 34(6):581–7. doi: 10.1086/670631 PMID: 23651888
61. Golding GR, Levett PN, McDonald RR, Irvine J, Nsungu M, Woods S, et al. A comparison of risk factorsassociated with community-associated methicillin-resistant and -susceptible Staphylococcus aureusinfections in remote communities. Epidemiology and infection. 2010; 138(5):730–7. doi: 10.1017/S0950268809991488 PMID: 20092664
62. Johnson AP. Methicillin-resistant Staphylococcus aureus: the European landscape. The Journal ofantimicrobial chemotherapy. 2011; 66 Suppl 4:iv43–iv8. doi: 10.1093/jac/dkr076 PMID: 21521706
63. Ellington MJ, Hope R, Livermore DM, Kearns AM, Henderson K, Cookson BD, et al. Decline ofEMRSA-16 amongst methicillin-resistant Staphylococcus aureus causing bacteraemias in the UKbetween 2001 and 2007. The Journal of antimicrobial chemotherapy. 2010; 65(3):446–8. doi: 10.1093/jac/dkp448 PMID: 20035019
MRSA Spatial Epidemiology in Relation to Socioeconomic Deprivation
PLOSMedicine | DOI:10.1371/journal.pmed.1001944 January 26, 2016 21 / 24

64. Edgeworth JD. Has decolonization played a central role in the decline in UK methicillin-resistant Staph-ylococcus aureus transmission? A focus on evidence from intensive care. The Journal of antimicrobialchemotherapy. 2011; 66 Suppl 2:ii41–7. doi: 10.1093/jac/dkq325 PMID: 20852273
65. David MZ, Daum RS. Community-associated methicillin-resistant Staphylococcus aureus: epidemiol-ogy and clinical consequences of an emerging epidemic. Clinical microbiology reviews. 2010; 23(3):616–87. doi: 10.1128/CMR.00081-09 PMID: 20610826
66. DeLeo FR, Otto M, Kreiswirth BN, Chambers HF. Community-associated meticillin-resistant Staphylo-coccus aureus. Lancet. 2010; 375(9725):1557–68. doi: 10.1016/S0140-6736(09)61999-1 PMID:20206987
67. Bartels MD, Kristoffersen K, Boye K, Westh H. Rise and subsequent decline of community-associatedmethicillin resistant Staphylococcus aureus ST30-IVc in Copenhagen, Denmark through an effectivesearch and destroy policy. Clinical microbiology and infection: the official publication of the EuropeanSociety of Clinical Microbiology and Infectious Diseases. 2010; 16(1):78–83.
68. Urth T, Juul G, Skov R, Schonheyder HC. Spread of a methicillin-resistant Staphylococcus aureusST80-IV clone in a Danish community. Infection control and hospital epidemiology. 2005; 26(2):144–9.PMID: 15756884
69. Greenland S, Morgenstern H. Ecological bias, confounding, and effect modification. International jour-nal of epidemiology. 1989; 18(1):269–74. PMID: 2656561
70. Greenland S. Divergent biases in ecologic and individual-level studies. Statistics in medicine. 1992; 11(9):1209–23. PMID: 1509221
71. Gonzalez BE, Rueda AM, Shelburne SA, 3rd, Musher DM, Hamill RJ, Hulten KG. Community-associ-ated strains of methicillin-resistant Staphylococccus aureus as the cause of healthcare-associatedinfection. Infection control and hospital epidemiology. 2006;27(10):1051–6.
72. Agata EM, Webb GF, Horn MA, Moellering RC, Jr., Ruan S. Modeling the invasion of community-acquired methicillin-resistant Staphylococcus aureus into hospitals. Clinical infectious diseases: an offi-cial publication of the Infectious Diseases Society of America. 2009; 48(3):274–84.
73. Skov RL, Jensen KS. Community-associated meticillin-resistant Staphylococcus aureus as a cause ofhospital-acquired infections. The Journal of hospital infection. 2009; 73(4):364–70. doi: 10.1016/j.jhin.2009.07.004 PMID: 19786313
MRSA Spatial Epidemiology in Relation to Socioeconomic Deprivation
PLOSMedicine | DOI:10.1371/journal.pmed.1001944 January 26, 2016 22 / 24

Editors' Summary
Background
Addressing health inequality requires understanding the social determinants of poorhealth. Previous studies have suggested a link between deprived living conditions andinfections with methicillin-resistant Staphylococcus aureus (MRSA), that is, strains of thecommon bacterium S. aureus that have acquired antibiotic resistance and are thereforemore difficult to treat. MRSA was first identified in the 1960s and for years thought of as adangerous health-care-associated (HA-) pathogen that infects hospital patients who arepredominantly older, sick, or undergoing invasive procedures. In the late 1990s, however,community-associated MRSA (CA-MRSA) emerged as pathogen infecting healthy indi-viduals of all ages and without recent hospital contact. Most CA-MRSA cases are conta-gious skin infections, and numerous outbreaks have been reported in differentcommunities. The traditional distinction between HA-MRSA and CA-MRSA based onwhere transmission occurred has become problematic in recent years, because CA-MRSAtransmission has also been reported in health care settings. However, as HA- and CA-MRSA strains are genetically distinct, cases can be classified by DNA sequencing regard-less of where a patient got infected.
WhyWas This Study Done?
With hospitals historically considered the only place of MRSA transmission, preventionefforts remain focused on health care settings. Given the changing patterns of MRSA infec-tions, however, the need to consider HA and CA transmission settings together has beenrecognized. This study was designed to take a closer look at the relationship between bothHA- and CA-MRSA and socioeconomic deprivation, with the ultimate aim to inform pre-vention efforts. The researchers selected three boroughs in South East London with ahighly diverse population of approximately 850,000 residents for whom socioeconomicand demographic data were available at a high level of spatial resolution. They also haddata on hospital attendance for the residents and were therefore able to account for thisfactor in their analysis. The study addressed the following questions: is there a linkbetween socioeconomic deprivation and both HA- and CA-MRSA cases among the resi-dents? What social determinants are associated with HA- and CA-MRSA cases? What arethe transmission settings (i.e., community versus health care) for HA- and CA-MRSA?
What Did the Researchers Do and Find?
They analyzed data on all MRSA samples collected over 4 consecutive mo in late 2011 andearly 2012 by microbiology laboratories that serve the three boroughs. Of 471 MRSA casesthat occurred in residents, 392 could be classified based on genome sequencing. Of these,approximately 72% were HA-MRSA, and 26% were CA-MRSA. Approximately 2% of resi-dents carried both HA- and CA-MRSA. All MRSA cases were mapped to 513 smallerareas (called Lower Layer Super Output Areas, or LSOAs) in the three boroughs for whichextensive socioeconomic and demographic data existed. The former included data onincome, employment, health, and education, the latter data on number individuals perhousehold, their ages and gender, and length of residence in the UK. MRSA cases weredetected in just over half of the LSOAs in the study area. The researchers then used mathe-matical models to determine the most likely transmission settings for each MRSA genetic
MRSA Spatial Epidemiology in Relation to Socioeconomic Deprivation
PLOSMedicine | DOI:10.1371/journal.pmed.1001944 January 26, 2016 23 / 24

classification. They also described the spatial distributions of the two in relation to socio-economic and demographic determinants. Both CA-and HA-MRSA were associated withhousehold deprivation, which was itself correlated with hospital attendance. HA-MRSAwas also associated with poor health and with living in communal care homes, whereasCA-MRSA was linked with household overcrowding and a combination of householdovercrowding, low income, and homelessness. CA-MRSA was also associated with recentimmigration to the UK. Around 27% of local variation in CA-MRSA could be explainedby the spatial arrangement of LSOAs, meaning areas of high risk tended to cluster. Nosuch clustering was observed for HA-MRSA.
What Do these Findings Mean?
The results show that residents in the most deprived areas are at greater risk for MRSA.The absence of spatial clusters of HA-MRSA suggests that transmission of geneticallydetermined HA-MRSA occurs in hospitals, with little or no transmission in the commu-nity. The most important risk factor for acquiring HA-MRSA is therefore likely to be hos-pital attendance as a result of deprivation. In contrast, genetically determined CA-MRSAboth affects deprived areas disproportionately, and—as the clusters imply—spreads fromsuch areas in the community. This suggests that living in deprived conditions itself is arisk factor for acquiring CA-MRSA, as is living near deprived neighbors. Some of the CA-MRSA cases are also likely imported by recent immigrants. Whereas transmission of CA-MRSA in health care settings has been reported in a number of other studies, data fromthis study cannot answer whether or to what extent this is the case here. However, becauseof ongoing transmission in the community, and because deprived residents are both morelikely to have CA-MRSA and to attend a hospital, importation of CA-MRSA strains intohospitals is an obvious concern. While the researchers intentionally located the study in anarea with a very diverse population, it is not clear how generalizable the findings are toother communities, either in the UK or in other countries. Nonetheless, the results justifyspecial focus on deprived populations in the control of MRSA and are useful for the designof specific strategies for HA-MRSA and CA-MRSA.
Additional Information
Please access these Web sites via the online version of this summary at http://dx.doi.org/10.1371/journal.pmed.1001944.
• Online information on MRSA from the UK National Health Service: http://www.nhs.uk/conditions/MRSA/Pages/Introduction.aspx
• MRSA webpage from the US Centers of Disease Control and Prevention: http://www.cdc.gov/mrsa/
• MRSA page from the San Francisco Department of Public Health: http://www.sfcdcp.org/mrsa.html
• MedlinePlus provides links to information about MRSA, including sources in languagesother than English: https://www.nlm.nih.gov/medlineplus/mrsa.html
MRSA Spatial Epidemiology in Relation to Socioeconomic Deprivation
PLOSMedicine | DOI:10.1371/journal.pmed.1001944 January 26, 2016 24 / 24