Embed Size (px)
Citation preview
nutrients
Article
Total and Free Sugar Content of Pre-Packaged Foodsand Non-Alcoholic Beverages in Slovenia
Nina Zupanic 1, Krista Miklavec 1, Anita Kušar 1 ID , Katja Žmitek 1,2, Nataša Fidler Mis 3 ID
and Igor Pravst 1,* ID
1 Nutrition Institute, Tržaška cesta 40, Ljubljana SI-1000, Slovenia; [email protected] (N.Z.);[email protected] (K.M.); [email protected] (A.K.); [email protected] (K.Z.)
2 VIST—Higher School of Applied Sciences, Gerbiceva cesta 51a, Ljubljana SI-1000, Slovenia3 Department of Gastroenterology, Hepatology and Nutrition, University Children’s Hospital,
University Medical Centre Ljubljana, Ljubljana 1000, Slovenia; [email protected]* Correspondence: [email protected]; Tel.: +386-590-68871; Fax: +386-130-07981
Received: 14 November 2017; Accepted: 26 January 2018; Published: 30 January 2018
Abstract: Scientific evidence of the association between free sugar consumption and several adversehealth effects has led many public health institutions to take measures to limit the intake of addedor free sugar. Monitoring the efficiency of such policies and the amount of free sugar consumedrequires precise knowledge of free sugar content in different food products. To meet this need,our cross-sectional study aimed at assessing free sugar content for 10,674 pre-packaged food itemsavailable from major Slovenian food stores during data collection in 2015. Together, 52.6% of allanalyzed products contained free sugar, which accounted for an average of 57.5% of the totalsugar content. Food categories with the highest median free sugar content were: honey andsyrups (78.0 g/100 g), jellies (62.9 g/100 g), chocolate and sweets (44.6 g/100 g), jam and spreads(35.9 g/100 g), and cereal bars (23.8 g/100 g). Using year-round sales data provided by the retailers,the data showed that chocolate, sweets, and soft drinks alone accounted for more than 50% of all freesugar sold on the Slovenian market. The results of this study can be used to prepare more targetedinterventions and efficient dietary recommendations.
Keywords: free sugar; sugars; food composition; sales data; nutrition label; Slovenia
1. Introduction
A worldwide pandemic of obesity and metabolic diseases has raised concerns about the adverseeffects of sugar intake above the recommended levels. There is epidemiological evidence availablethat links the consumption of added and/or free sugar and especially sugar-sweetened beverages(SSBs) with several undesirable health effects such as dental caries [1–5], insulin resistance [6],type 2 diabetes [7,8], metabolic syndrome [7,9,10], cardio-vascular disease [11–14], fatty liver [15–17],and dyslipidaemia [14,18]. Additionally, several clinical dietary intervention studies have indicatedthat diets with commonly-consumed levels of added sugars impair glucose and lipid metabolism,and increase several other risk factors associated with metabolic diseases [19,20]. However, somecontroversy remains as to whether these unfavorable health outcomes are a direct consequence ofexcessive consumption of free sugar, or rather a result of excessive energy intake [21,22].
Several governmental and public health organizations have issued recommendations to reducethe intake of free sugars. The new WHO (World Health Organization) guidelines on sugar intakepublished in 2015 recommended a reduction in free sugar intake for children and adults to less than10% of total energy intake (strong recommendation), while a further reduction of the intake of freesugar to a maximum of 5% of total energy intake was recommended conditionally for additionalhealth benefits [23]. In accordance with a recent European Society for Paediatric Gastroenterology,
Nutrients 2018, 10, 151; doi:10.3390/nu10020151 www.mdpi.com/journal/nutrients
Nutrients 2018, 10, 151 2 of 16
Hepatology and Nutrition (ESPGHAN) position paper, free sugar intake should be reduced to <5%energy intake in children and adolescents aged ≥2–18 years, and should be even lower in infantsand toddlers <2 years [24]. Similarly, The UK Scientific Advisory Committee on Nutrition (SACN)recommends a free sugar intake lower than 5% of total energy from two years old into adulthood [25],while the American Heart Association (AHA) recommends children consume ≤25 g (100 kcal) ofadded sugar per day and to avoid added sugar completely in children <2 years of age [26].
Free sugars are the prime target of potential nutrition interventions since they provide energywith little or no nutritional value. The term free sugar in this paper follows the updated WHOdefinition and refers to all monosaccharaides and disaccharides added to foods and beverages bythe manufacturer, cook, or consumer, and sugars naturally present in honey, syrups, fruit juices,and fruit concentrates [23]. This definition does not include naturally occurring or intrinsic sugars,which are stored within the cells of intact fruits, vegetables, or involve lactose in milk or unsweeteneddairy products.
The review of European-based nation-wide representative studies on added and total sugar intakeshowed that sugars represent a significant proportion of the total daily energy intake. The reportedconsumption of added sugars was especially high among children, ranging from 11.0% to almost16.8% of daily energy intake, while in adults it ranged between 7.3–11.4% [27]. However, in recentyears, the attitude of some consumers towards free/added sugar has changed. An increasing numberof consumer groups are initiating a reduction of free sugar intake in their diets [28]; however, doing somight prove difficult due to the lack of accessible information on the amount of added or free sugarin foods and beverages on the market [29]. Major progress in the EU (European Union) has beenmade with the new requirements for mandatory nutrition labelling of pre-packaged foods, which mustprovide the information about the total sugar content, as instructed by the Regulation 1169/2011 in theProvision of Food Information to Consumers [30]. This rule was enacted in December 2016; however,prior to the rule, nutrition declarations had been voluntary, except on foods carrying nutrition orhealth claims. This regulatory change has been particularly important for member states with thelowest penetration of nutrition declaration on food labels such as Slovenia [31,32]. While the nutritiondeclaration now provides information on (total) sugar content, the EU regulation does not requirelabelling of added or free sugar content. One of the major challenges encountered with potential freesugar labelling is its chemical indistinguishability from naturally-occurring sugar; therefore, there is nosimple and accurate analytical method available that would discriminate between naturally-occurringsugar and added or free sugar. Nevertheless, the US Food and Drug Administration (FDA) hasupdated the nutrition facts label requirements where all nutritional labels on food packages will haveto provide information on the amount of added sugar by 2019 [33].
In Slovenia, high sugar consumption and obesity prevalence are particularly concerning.According to the last available data, the mean intake of free sugar in Slovenian adolescents (aged15–16) was 130 g/day in boys and 110 g/day in girls (16% and 17% of the daily energy intake,respectively) [34,35]. Results of a cross-national HBSC study (Health Behavior in School-aged Children),published by WHO in 2017, showed a high prevalence of obesity among Slovenian adolescents aged11, 13, and 15 years. In 2014, 3.1% of girls and 7.8% of boys were obese, ranking Slovenia 4th amongthe 31 European countries included in the survey. The data were especially worrisome for 11 years oldboys, where the prevalence of obesity was as high as 10.4% [36]. To tackle the problem of obesity ona national level, the Slovenian Ministry of Health has issued a strategic plan to gradually diminish thepercentage of overweight and obese individuals. One of the main goals of The Slovenian Resolution onNutrition and Physical Activity for Health (SRNPAH) 2015–2025 is to reduce the intake of free sugarsby 15%, with an emphasis on soft drinks, sweets, and desserts [37].
To enable more accurate studies in monitoring the intake of total and free sugar in the Slovenianpopulation, this study aimed to establish a comprehensive database of estimated free sugar content inthe Slovenian food supply, focusing on pre-packaged foods. Using a step-by-step approach adaptedfrom Bernstein and colleagues [38], free sugar contents were calculated by combining the data from
Nutrients 2018, 10, 151 3 of 16
the nutrition declarations and ingredient lists of foods and beverages in the food supply. Such data,currently unavailable, would serve as a reference point for future studies, as well as for monitoring theefficiency of dietary recommendations and public health interventions.
2. Material and Methods
2.1. Data Collection
As a part of our previously conducted study described in Reference [39], nutritional compositiondata were collected between January and February 2015 from the supermarket stores of the three majorgrocery chains with the largest nation-wide network of shops (Spar, Mercator, and Hofer). Samplingwas performed in Ljubljana, Slovenia. In agreement with the retailers, all pre-packaged products witha unique European/International Article Number (EAN) barcode were systematically photographedand recorded in an online Composition and Labelling Information System (CLAS) database [40].Such database was first compiled in 2011 and has been described elsewhere in References [32,41].The CLAS Content Management System is supported by a specially developed mobile application,which enables the photographing of foods, data transfer to the CLAS database, and digital recognitionof EAN codes to speed up the database formation and to avoid duplicate entries. During data collectionin 2015, information on a total of 10,674 unique items were collected, including the product name,company, brand, list of ingredients, nutritional values, packaging volume, price, and EAN barcode.Flour, spices, sugar, food supplements, as well as all alcoholic beverages were excluded from thedata acquisition.
All data entered into the CLAS database was rechecked and each product assigned to one of the49 predefined food categories using a classification system developed by Dunford and colleagues [42],which was developed as part of the Global Food Monitoring Initiative. The categories used in thispaper were as follows: baby foods; biscuits, bread; breakfast cereals; butter and margarine; cakes,muffins and pastry; canned fish and seafood; cereal bars; cheese; chewing gum; chilled fish; chocolateand sweets; coffee and tea; cooking oil; cordials; couscous; cream; crisps and snacks; desserts; eggs;electrolyte drinks; frozen fish, fruits; fruit and vegetable juices; honey and syrups; ice cream and edibleices; jam and spreads; jelly; maize (corn); mayonnaise/dressings; meal replacements; meat alternatives;milk; noodles; nuts and seeds; other; other salt; pasta; pizza; pre-prepared salad and sandwiches;processed meat and derivatives; ready males; rice; sauces; soft drinks; soups; spreads; unprocessedcereals; vegetables; waters; and yogurt products.
2.2. Identifying Free Sugars within the Ingredient Lists
Following the WHO definition of free sugars [23], ingredient lists of all products weresystematically inspected for free sugar ingredients (FSI). All identified FSI and their varieties are listedin Supplementary Materials Table S1. Despite being used as food sweeteners, artificial sweeteners andsugar alcohols are neither monosaccharaides nor disaccharides and were therefore not considered asfree sugars.
2.3. Assesment of Total and Free Sugar Content
Nowadays, nutrition declarations on pre-packaged products contain information on the (total)sugar content across the entire EU. However, labelling of the sugar content on pre-packaged foods soldacross the EU market only became mandatory in 2017, despite the information having been voluntarilypresented on most pre-packaged foods by then. The CLAS database was compiled using all availableinformation from nutritional declarations on food labels. We also collected information provided inthe lists of ingredients, which included all the ingredients in a certain product, in descending order ofweight. By law, the indication of the quantity of an ingredient is required if the ingredient (a) appearsin the name of the food; (b) is emphasized on the labelling in words, pictures or graphics; or (c) isessential to characterize a food and to distinguish it from products with which it might be confused
Nutrients 2018, 10, 151 4 of 16
because of its name or appearance. Considering that nutrition declarations do not provide informationon the amount of free sugar content, such information can only be calculated or estimated based onthe ingredient list and total sugar content of each product.
The free-sugar decision algorithm was established based on the previously published algorithmdeveloped by Bernstein and colleagues for the Canadian food market analyses [38] (Table 1). In Steps 1and 2, all products that contained 0 g of total sugar (e.g., cooking oils, eggs, plain rice) or containedno ingredients that would contribute to free sugar content were assigned 0 g of free sugar. In Step 3,all products that contained no ingredients with more than 0.5 g of naturally-occurring sugar per 100 ghad all their total sugar assigned as free sugar. Among the remaining food products, those that hada complete ingredient list with percentages of FSI and/or ingredients with naturally-occurring sugarsavailable, were assigned under Step 4. The equation used for calculating free sugar content is presentedin Table 1. While Steps 1–4 were considered to be objective, the decisions for Steps 5–7 had to bemade subjectively. Thus, the confidence of the calculated/estimated free sugar value decreased witheach step. Products that could not be assigned to Steps 1–4, but had an unsweetened comparisonavailable within the same category (e.g., a fruit yogurt compared with a plain yogurt), had a free sugarvalue estimated based on the naturally-occurring sugar content of the unsweetened product (Step 5).When the unsweetened comparison was non-existent, two options remained. If a comparable productthat had already been assigned a free sugar value was available, a value reflective of the proportion offree sugar in the comparison product was assigned to the remaining product (Step 6). If an estimationof free sugar content was impossible from Steps 1–6, the free sugar values were estimated based on theorder of ingredients on the ingredient lists (Step 7). All calculations in the paper were based on foodcomposition data available from the Slovenian food composition database [43].
For certain food products such as condensed soups, the amount of total and free sugar wascalculated for the “as consumed” form of the product to enable comparison with other food productswithin the same category. The calculations were based on the preparation instructions written on theproduct, while both the dilution factor and additional ingredients were considered.
While the proportions of products containing free-sugar ingredients were calculated with the fullsample of eligible items (Figure 1, N = 10.674), estimations of the contents of free sugar were calculatedonly for products labelled with both an ingredient list and nutrition declaration (Tables 1 and 2,Figures 2–4; N = 9.405).
Table 1. The following step-by-step method was used to estimate the free sugar content of packagedfoods. The method was adapted from Bernstein and colleagues [38]. n (%) indicates the number andproportion of products calculated at each step.
Step Description n (%)
1 Products with 0 g of total sugar as declared on the nutrition facts label. Free sugar value = 0 g/100 g. 676 (7.2%)
2 Products that have no FSI listed on the ingredient list. Free sugar value = 0 g/100 g. 3759 (40%)
3 Products that contain no ingredients with naturally-occurring sugars. Free sugar value = 100 g/100 g. 1603 (17%)
4Products with detailed lists of ingredients: % of FSI and/or % of ingredients with naturally occurring
sugar available. The following formula was used to calculate free sugar content:Total sugar − Calculated naturally-occurring sugar = Free sugar
942 (10%)
5
Products that contain free sugar ingredients as well as naturally-occurring sugars and have anunsweetened alternative available in the same category (i.e., sweetened yogurt vs. plain yogurt).
The following formula was used to calculate free sugar content:100×(sugar per 100 g unsweetened−sugar per 100 g sweetened)
(sugar/100 g sweetened−100)
873 (9.3%)
6Products without unsweetened comparison but with a very similar product for which free sugar
value had already been calculated were assigned a value reflective of the proportion of free sugar inthe comparing product.
37 (0.4%)
7Products that remained after all the other steps had been performed had their free sugar values
estimated based on their lists of ingredients. The following formula was used to calculate free sugarcontent: Total sugar − Estimated naturally-occurring sugar = Free sugar
1385 (14.7%)
Nutrients 2018, 10, 151 5 of 16
2.4. Share in Free Sugar Sales
The CLAS database was further complemented with country-wide 12 months sales data. Ensuringproper data handling, we obtained sales data from retailers covering the majority of the national market.The sales data referred to the national market and presented sales of food products for the 12 monthsperiod before the data collection (January 2014–December 2014). This was arranged on the conditionthat the results would not reveal sales data of any particular retailer. In this way we were able to accesssales data for 8620 (91.7%) out of 10,674 products in the CLAS database, which were then includedinto analyses as reported in Figures 4 and 5. The sales data were given in universal form, includingEAN number, description of the product, the number of products sold per year, and the quantityof food (kg or L) per packaging. Matching foods between the databases was performed using EANnumbers. Using sales data from 2014 and the previously calculated free sugar content of each product,we evaluated the relative contribution of each food category. The final values representing shares infree sugar sales are presented as ratios between the total free sugar in all sold items in certain (sub)categories and the total free sugar in all sold items in the sample.
2.5. Sale-Weighted Total and Free Sugar Content
With the use of sales data acquired from the retailers and previously calculated free sugar content,we could analyze the correlation of total/free sugar content with sales data. Analyses were conductedusing a sample of foods for which both the total/free sugar and sales data were available (N = 6563).Sales-weighted total/free sugar contents were calculated on the food category level (in g per 100 gor mL; results provided in the Supplementary Materials Table S2). Based on the priorities of theSRNPAH 2015–2025, five different food categories were chosen for in-depth analysis: (A) yogurts;(B) biscuits; (C) breakfast cereals; (D) cakes, muffins and pastry; and (E) soft drinks. All items withineach selected food category were assigned to an appropriate group that represented a certain intervalin the free sugar range. The intervals for each category were determined based on the free sugar rangeof all items within the category. Sales factors were calculated from the total number of products sold,and corrected by the number of items per interval. The final factor was given as the proportion of theaverage sales volume of the interval.
2.6. Statistical Analysis
The data were processed and evaluated using the computer programs Microsoft SQL ServerManagement Studio V13.0, Microsoft Analysis Services Client Tools 13.0, Microsoft Data AccessComponents (MDAC) 10.0, Microsoft Excel 2016 (Redmond, WA, USA), and the program tool CLASV1.0 (Composition and Labelling Information System; Nutrition Institute, Ljubljana, Slovenia). For thepurpose of statistical analyses, products’ nutritional values from the CLAS database were exportedin the form of Microsoft Excel spreadsheets. Mean values, standard deviation (SD), and quartiles(min, 25th, 50th, 75th, max) were calculated for the total and free sugar content. Sales-weightedtotal/free sugar contents were given as an exact value and, therefore SDs are not provided.The proportion of free sugar-containing items was presented as a percentage (%) of all productswithin each category. The average amount of free sugar in an individual food category was expressedas a percentage (%) of the averaged total sugar content of the group. The impact of free sugar contenton sales was analyzed using the analysis of variance.
3. Results
3.1. Proportion of Free Sugar-Containing Products in Different Food Categories
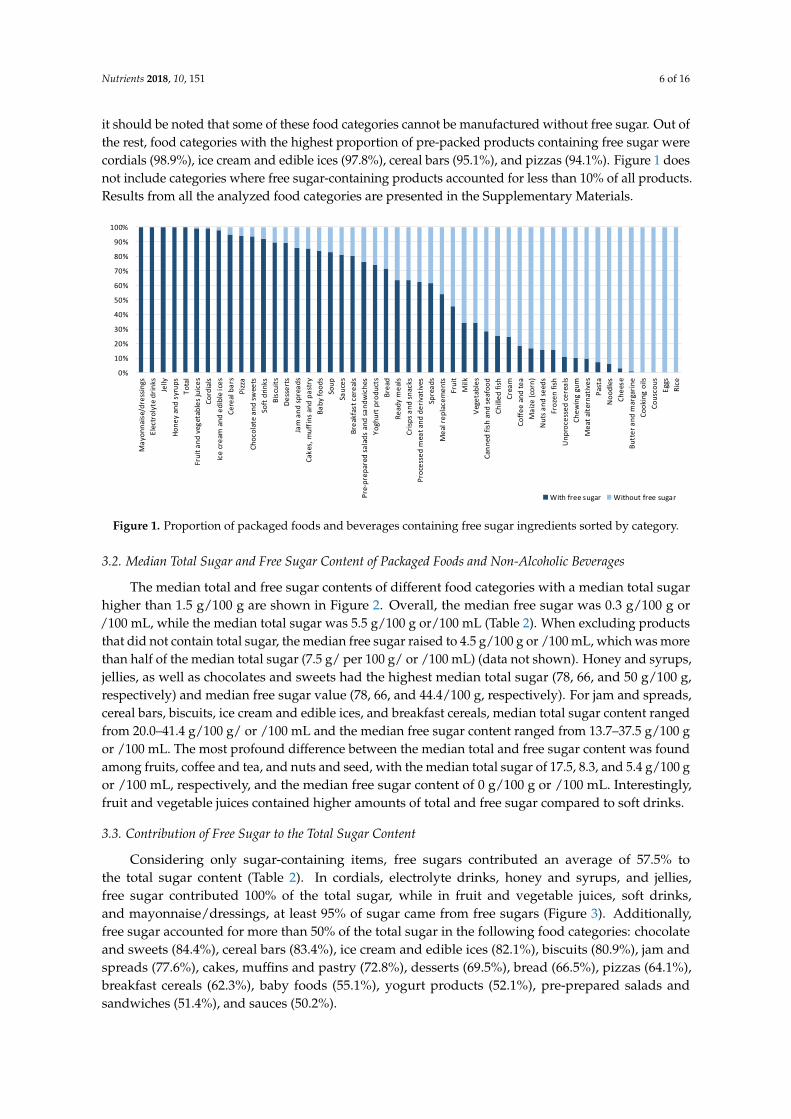
Out of 10,674 packaged foods and non-alcoholic beverages, a total of 10,563 met the inclusioncriteria for the statistical analyses. In total, 52.6% of all analyzed products contained free sugar.The highest proportion of free sugar-containing items (i.e., 100%) was found among mayonnaise/dressing, electrolyte drinks, jellies, honey and syrups, and fruit and vegetables juices (Figure 1), however,
Nutrients 2018, 10, 151 6 of 16
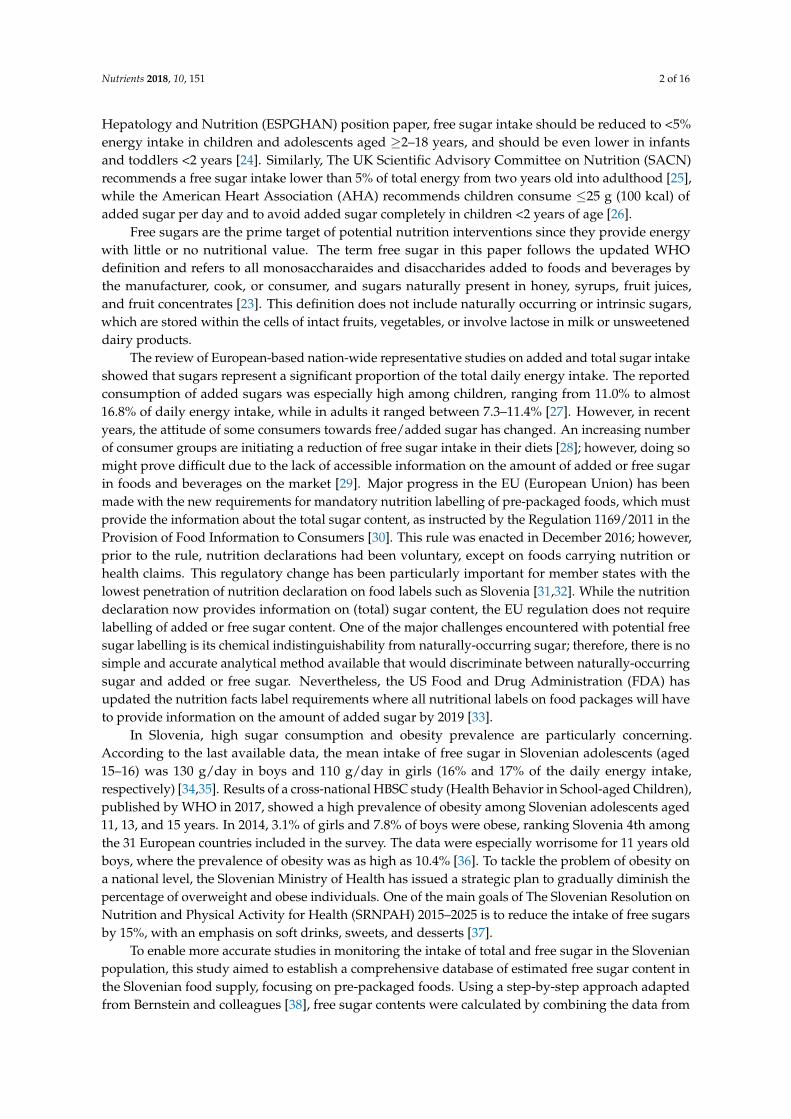
it should be noted that some of these food categories cannot be manufactured without free sugar. Out ofthe rest, food categories with the highest proportion of pre-packed products containing free sugar werecordials (98.9%), ice cream and edible ices (97.8%), cereal bars (95.1%), and pizzas (94.1%). Figure 1 doesnot include categories where free sugar-containing products accounted for less than 10% of all products.Results from all the analyzed food categories are presented in the Supplementary Materials.Nutrients 2018, 10, x FOR PEER REVIEW 6 of 16
Figure 1. Proportion of packaged foods and beverages containing free sugar ingredients sorted by category.
3.2. Median Total Sugar and Free Sugar Content of Packaged Foods and Non-Alcoholic Beverages
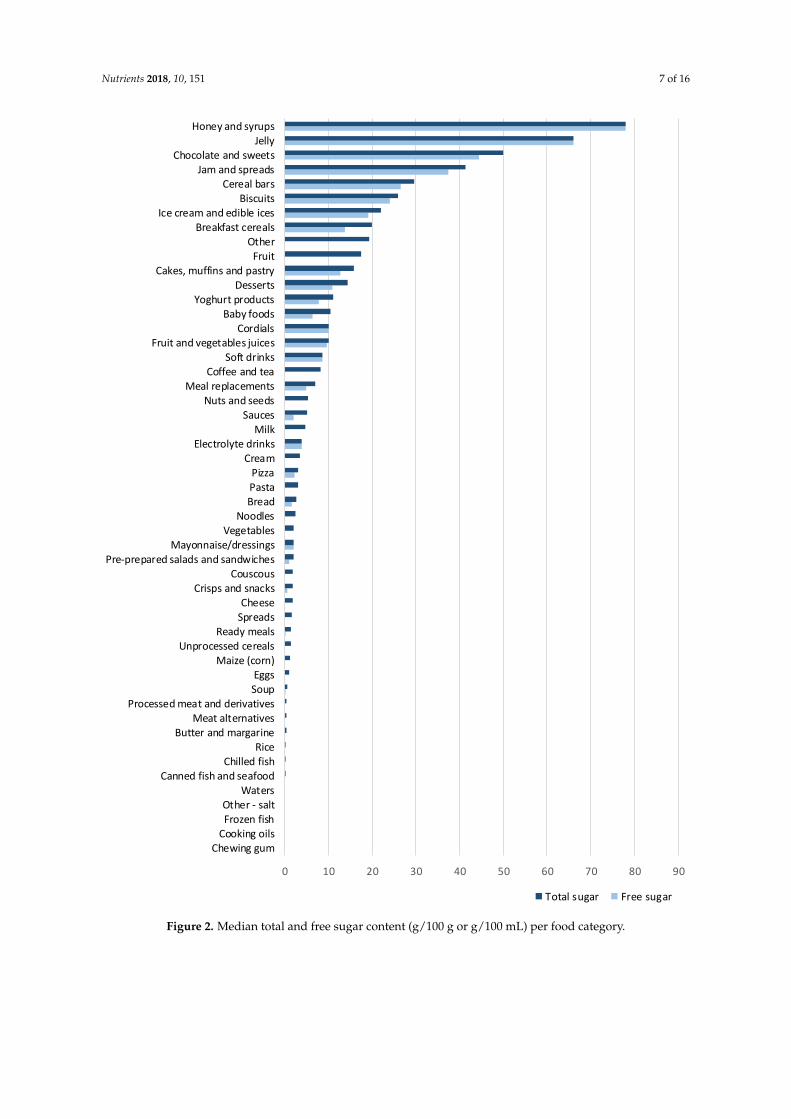
The median total and free sugar contents of different food categories with a median total sugar higher than 1.5 g/100 g are shown in Figure 2. Overall, the median free sugar was 0.3 g/100 g or /100 mL, while the median total sugar was 5.5 g/100 g or/100 mL (Table 2). When excluding products that did not contain total sugar, the median free sugar raised to 4.5 g/100 g or /100 mL, which was more than half of the median total sugar (7.5 g/ per 100 g/ or /100 mL) (data not shown). Honey and syrups, jellies, as well as chocolates and sweets had the highest median total sugar (78, 66, and 50 g/100 g, respectively) and median free sugar value (78, 66, and 44.4/100 g, respectively). For jam and spreads, cereal bars, biscuits, ice cream and edible ices, and breakfast cereals, median total sugar content ranged from 20.0–41.4 g/100 g/ or /100 mL and the median free sugar content ranged from 13.7–37.5 g/100 g or /100 mL. The most profound difference between the median total and free sugar content was found among fruits, coffee and tea, and nuts and seed, with the median total sugar of 17.5, 8.3, and 5.4 g/100 g or /100 mL, respectively, and the median free sugar content of 0 g/100 g or /100 mL. Interestingly, fruit and vegetable juices contained higher amounts of total and free sugar compared to soft drinks.
3.3. Contribution of Free Sugar to the Total Sugar Content
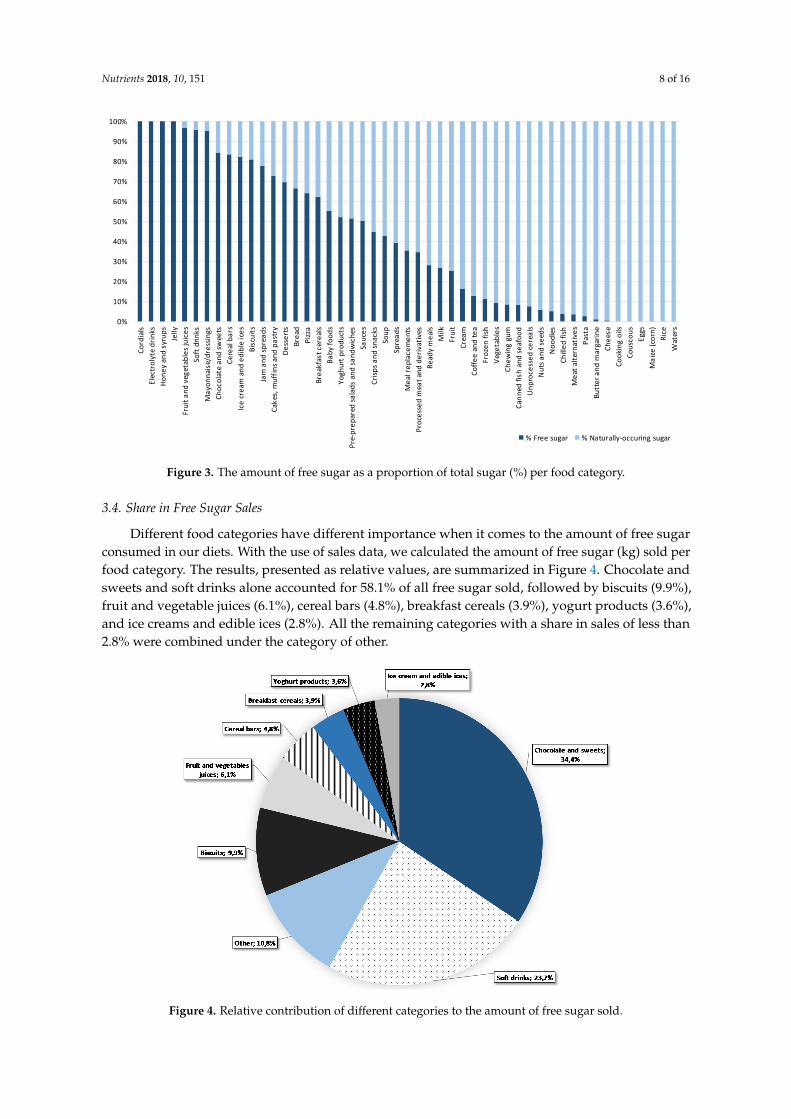
Considering only sugar-containing items, free sugars contributed an average of 57.5% to the total sugar content (Table 2). In cordials, electrolyte drinks, honey and syrups, and jellies, free sugar contributed 100% of the total sugar, while in fruit and vegetable juices, soft drinks, and mayonnaise/dressings, at least 95% of sugar came from free sugars (Figure 3). Additionally, free sugar accounted for more than 50% of the total sugar in the following food categories: chocolate and sweets (84.4%), cereal bars (83.4%), ice cream and edible ices (82.1%), biscuits (80.9%), jam and spreads (77.6%), cakes, muffins and pastry (72.8%), desserts (69.5%), bread (66.5%), pizzas (64.1%), breakfast cereals (62.3%), baby foods (55.1%), yogurt products (52.1%), pre-prepared salads and sandwiches (51.4%), and sauces (50.2%).
0%
10%
20%
30%
40%
50%
60%
70%
80%
90%
100%
May
onna
ise/
dres
sings
Elec
trol
yte
drin
ksJe
llyHo
ney
and
syru
psTo
tal
Frui
t and
veg
etab
les j
uice
sCo
rdia
lsIc
e cr
eam
and
edi
ble
ices
Cere
al b
ars
Pizz
aCh
ocol
ate
and
swee
tsSo
ft d
rinks
Bisc
uits
Dess
erts
Jam
and
spre
ads
Cake
s, m
uffin
s and
pas
try
Baby
food
sSo
upSa
uces
Brea
kfas
t cer
eals
Pre-
prep
ared
sala
ds a
nd sa
ndw
iche
sYo
ghur
t pro
duct
sBr
ead
Read
y m
eals
Crisp
s and
snac
ksPr
oces
sed
mea
t and
der
ivat
ives
Spre
ads
Mea
l rep
lace
men
tsFr
uit
Milk
Vege
tabl
esCa
nned
fish
and
seaf
ood
Chill
ed fi
shCr
eam
Coffe
e an
d te
aM
aize
(cor
n)N
uts a
nd se
eds
Froz
en fi
shU
npro
cess
ed ce
real
sCh
ewin
g gu
mM
eat a
ltern
ativ
esPa
sta
Noo
dles
Chee
seBu
tter
and
mar
garin
eCo
okin
g oi
lsCo
usco
usEg
gsRi
ce
With free sugar Without free sugar
Figure 1. Proportion of packaged foods and beverages containing free sugar ingredients sorted by category.
3.2. Median Total Sugar and Free Sugar Content of Packaged Foods and Non-Alcoholic Beverages
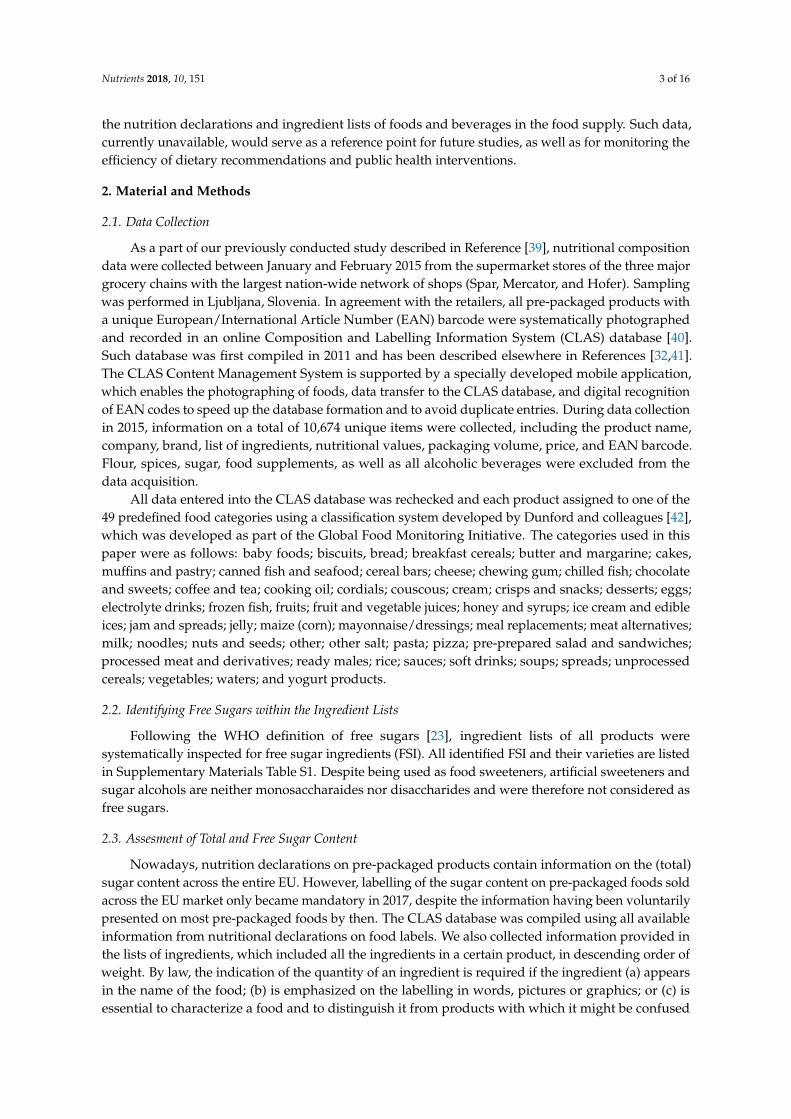
The median total and free sugar contents of different food categories with a median total sugarhigher than 1.5 g/100 g are shown in Figure 2. Overall, the median free sugar was 0.3 g/100 g or/100 mL, while the median total sugar was 5.5 g/100 g or/100 mL (Table 2). When excluding productsthat did not contain total sugar, the median free sugar raised to 4.5 g/100 g or /100 mL, which was morethan half of the median total sugar (7.5 g/ per 100 g/ or /100 mL) (data not shown). Honey and syrups,jellies, as well as chocolates and sweets had the highest median total sugar (78, 66, and 50 g/100 g,respectively) and median free sugar value (78, 66, and 44.4/100 g, respectively). For jam and spreads,cereal bars, biscuits, ice cream and edible ices, and breakfast cereals, median total sugar content rangedfrom 20.0–41.4 g/100 g/ or /100 mL and the median free sugar content ranged from 13.7–37.5 g/100 gor /100 mL. The most profound difference between the median total and free sugar content was foundamong fruits, coffee and tea, and nuts and seed, with the median total sugar of 17.5, 8.3, and 5.4 g/100 gor /100 mL, respectively, and the median free sugar content of 0 g/100 g or /100 mL. Interestingly,fruit and vegetable juices contained higher amounts of total and free sugar compared to soft drinks.
3.3. Contribution of Free Sugar to the Total Sugar Content
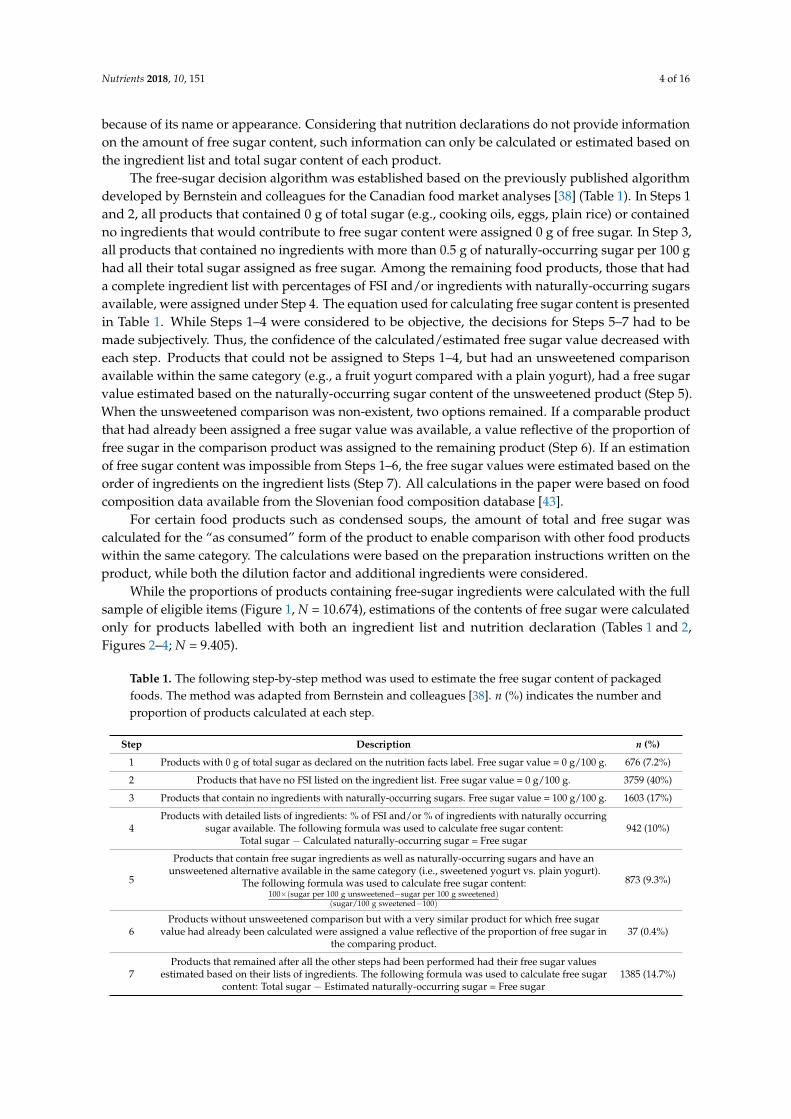
Considering only sugar-containing items, free sugars contributed an average of 57.5% tothe total sugar content (Table 2). In cordials, electrolyte drinks, honey and syrups, and jellies,free sugar contributed 100% of the total sugar, while in fruit and vegetable juices, soft drinks,and mayonnaise/dressings, at least 95% of sugar came from free sugars (Figure 3). Additionally,free sugar accounted for more than 50% of the total sugar in the following food categories: chocolateand sweets (84.4%), cereal bars (83.4%), ice cream and edible ices (82.1%), biscuits (80.9%), jam andspreads (77.6%), cakes, muffins and pastry (72.8%), desserts (69.5%), bread (66.5%), pizzas (64.1%),breakfast cereals (62.3%), baby foods (55.1%), yogurt products (52.1%), pre-prepared salads andsandwiches (51.4%), and sauces (50.2%).
Nutrients 2018, 10, 151 7 of 16Nutrients 2018, 10, x FOR PEER REVIEW 7 of 16
Figure 2. Median total and free sugar content (g/100 g or g/100 mL) per food category.
0 10 20 30 40 50 60 70 80 90
Chewing gumCooking oilsFrozen fishOther - salt
WatersCanned fish and seafood
Chilled fishRice
Butter and margarineMeat alternatives
Processed meat and derivativesSoupEggs
Maize (corn)Unprocessed cereals
Ready mealsSpreadsCheese
Crisps and snacksCouscous
Pre-prepared salads and sandwichesMayonnaise/dressings
VegetablesNoodles
BreadPastaPizza
CreamElectrolyte drinks
MilkSauces
Nuts and seedsMeal replacements
Coffee and teaSoft drinks
Fruit and vegetables juicesCordials
Baby foodsYoghurt products
DessertsCakes, muffins and pastry
FruitOther
Breakfast cerealsIce cream and edible ices
BiscuitsCereal bars
Jam and spreadsChocolate and sweets
JellyHoney and syrups
Total sugar Free sugar
Figure 2. Median total and free sugar content (g/100 g or g/100 mL) per food category.
Nutrients 2018, 10, 151 8 of 16Nutrients 2018, 10, x FOR PEER REVIEW 8 of 16
Figure 3. The amount of free sugar as a proportion of total sugar (%) per food category.
3.4. Share in Free Sugar Sales
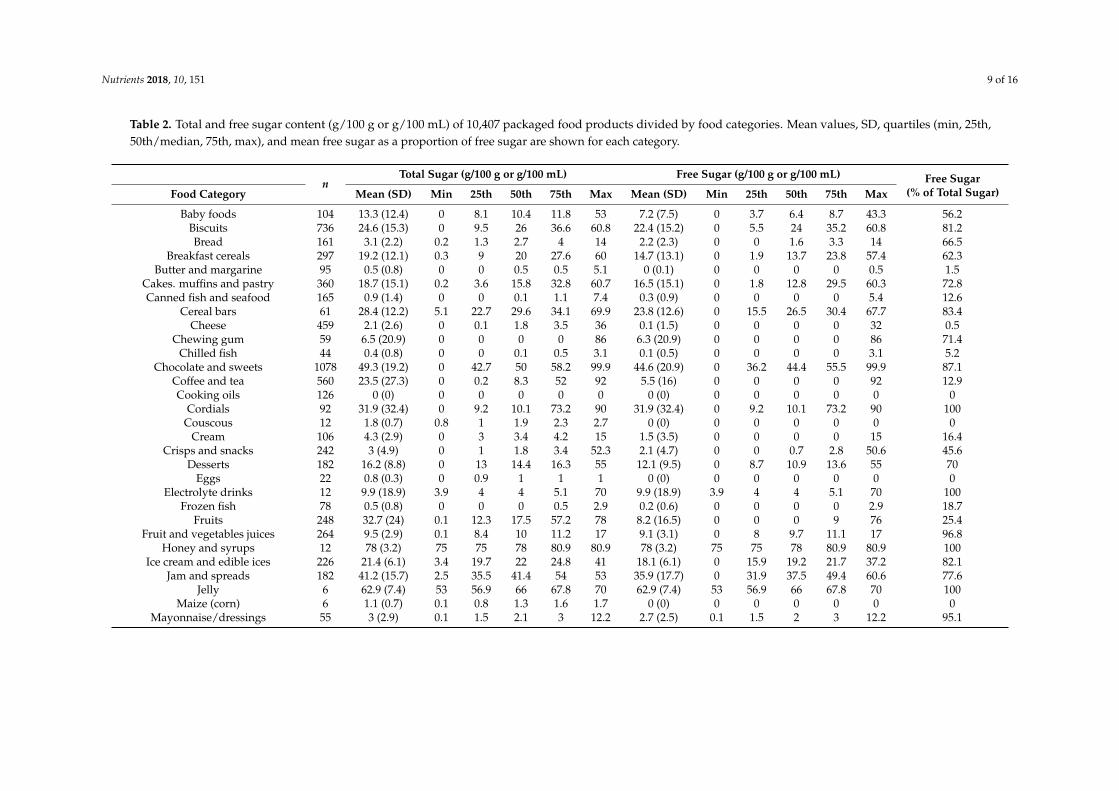
Different food categories have different importance when it comes to the amount of free sugar consumed in our diets. With the use of sales data, we calculated the amount of free sugar (kg) sold per food category. The results, presented as relative values, are summarized in Figure 4. Chocolate and sweets and soft drinks alone accounted for 58.1% of all free sugar sold, followed by biscuits (9.9%), fruit and vegetable juices (6.1%), cereal bars (4.8%), breakfast cereals (3.9%), yogurt products (3.6%), and ice creams and edible ices (2.8%). All the remaining categories with a share in sales of less than 2.8% were combined under the category of other.
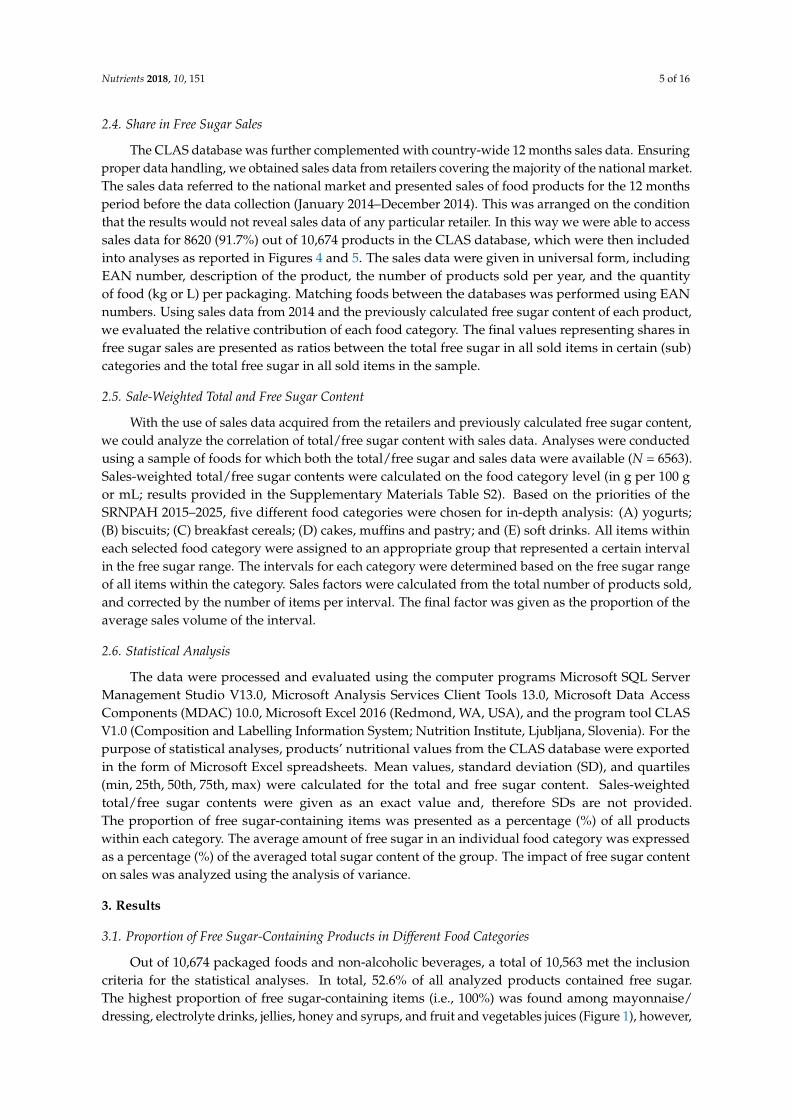
Figure 4. Relative contribution of different categories to the amount of free sugar sold.
0%
10%
20%
30%
40%
50%
60%
70%
80%
90%
100%
Cord
ials
Elec
trol
yte
drin
ksHo
ney
and
syru
psJe
llyFr
uit a
nd v
eget
able
s jui
ces
Soft
drin
ksM
ayon
nais
e/dr
essin
gsCh
ocol
ate
and
swee
tsCe
real
bar
sIc
e cr
eam
and
edi
ble
ices
Bisc
uits
Jam
and
spre
ads
Cake
s, m
uffin
s and
pas
try
Dess
erts
Brea
dPi
zza
Brea
kfas
t cer
eals
Baby
food
sYo
ghur
t pro
duct
sPr
e-pr
epar
ed sa
lads
and
sand
wic
hes
Sauc
esCr
isps a
nd sn
acks
Soup
Spre
ads
Mea
l rep
lace
men
tsPr
oces
sed
mea
t and
der
ivat
ives
Read
y m
eals
Milk
Frui
tCr
eam
Coffe
e an
d te
aFr
ozen
fish
Vege
tabl
esCh
ewin
g gu
mCa
nned
fish
and
seaf
ood
Unp
roce
ssed
cere
als
Nut
s and
seed
sN
oodl
esCh
illed
fish
Mea
t alte
rnat
ives
Past
aBu
tter
and
mar
garin
eCh
eese
Cook
ing
oils
Cous
cous
Eggs
Mai
ze (c
orn)
Rice
Wat
ers
% Free sugar % Naturally-occuring sugar
Figure 3. The amount of free sugar as a proportion of total sugar (%) per food category.
3.4. Share in Free Sugar Sales
Different food categories have different importance when it comes to the amount of free sugarconsumed in our diets. With the use of sales data, we calculated the amount of free sugar (kg) sold perfood category. The results, presented as relative values, are summarized in Figure 4. Chocolate andsweets and soft drinks alone accounted for 58.1% of all free sugar sold, followed by biscuits (9.9%),fruit and vegetable juices (6.1%), cereal bars (4.8%), breakfast cereals (3.9%), yogurt products (3.6%),and ice creams and edible ices (2.8%). All the remaining categories with a share in sales of less than2.8% were combined under the category of other.
Nutrients 2018, 10, x FOR PEER REVIEW 8 of 16
Figure 3. The amount of free sugar as a proportion of total sugar (%) per food category.
3.4. Share in Free Sugar Sales
Different food categories have different importance when it comes to the amount of free sugar consumed in our diets. With the use of sales data, we calculated the amount of free sugar (kg) sold per food category. The results, presented as relative values, are summarized in Figure 4. Chocolate and sweets and soft drinks alone accounted for 58.1% of all free sugar sold, followed by biscuits (9.9%), fruit and vegetable juices (6.1%), cereal bars (4.8%), breakfast cereals (3.9%), yogurt products (3.6%), and ice creams and edible ices (2.8%). All the remaining categories with a share in sales of less than 2.8% were combined under the category of other.
Figure 4. Relative contribution of different categories to the amount of free sugar sold.
0%
10%
20%
30%
40%
50%
60%
70%
80%
90%
100%Co
rdia
lsEl
ectr
olyt
e dr
inks
Hone
y an
d sy
rups
Jelly
Frui
t and
veg
etab
les j
uice
sSo
ft d
rinks
May
onna
ise/
dres
sings
Choc
olat
e an
d sw
eets
Cere
al b
ars
Ice
crea
m a
nd e
dibl
e ic
esBi
scui
tsJa
m a
nd sp
read
sCa
kes,
muf
fins a
nd p
astr
yDe
sser
tsBr
ead
Pizz
aBr
eakf
ast c
erea
lsBa
by fo
ods
Yogh
urt p
rodu
cts
Pre-
prep
ared
sala
ds a
nd sa
ndw
iche
sSa
uces
Crisp
s and
snac
ksSo
upSp
read
sM
eal r
epla
cem
ents
Proc
esse
d m
eat a
nd d
eriv
ativ
esRe
ady
mea
lsM
ilkFr
uit
Crea
mCo
ffee
and
tea
Froz
en fi
shVe
geta
bles
Chew
ing
gum
Cann
ed fi
sh a
nd se
afoo
dU
npro
cess
ed ce
real
sN
uts a
nd se
eds
Noo
dles
Chill
ed fi
shM
eat a
ltern
ativ
esPa
sta
Butt
er a
nd m
arga
rine
Chee
seCo
okin
g oi
lsCo
usco
usEg
gsM
aize
(cor
n)Ri
ceW
ater
s
% Free sugar % Naturally-occuring sugar
Figure 4. Relative contribution of different categories to the amount of free sugar sold.
Nutrients 2018, 10, 151 9 of 16
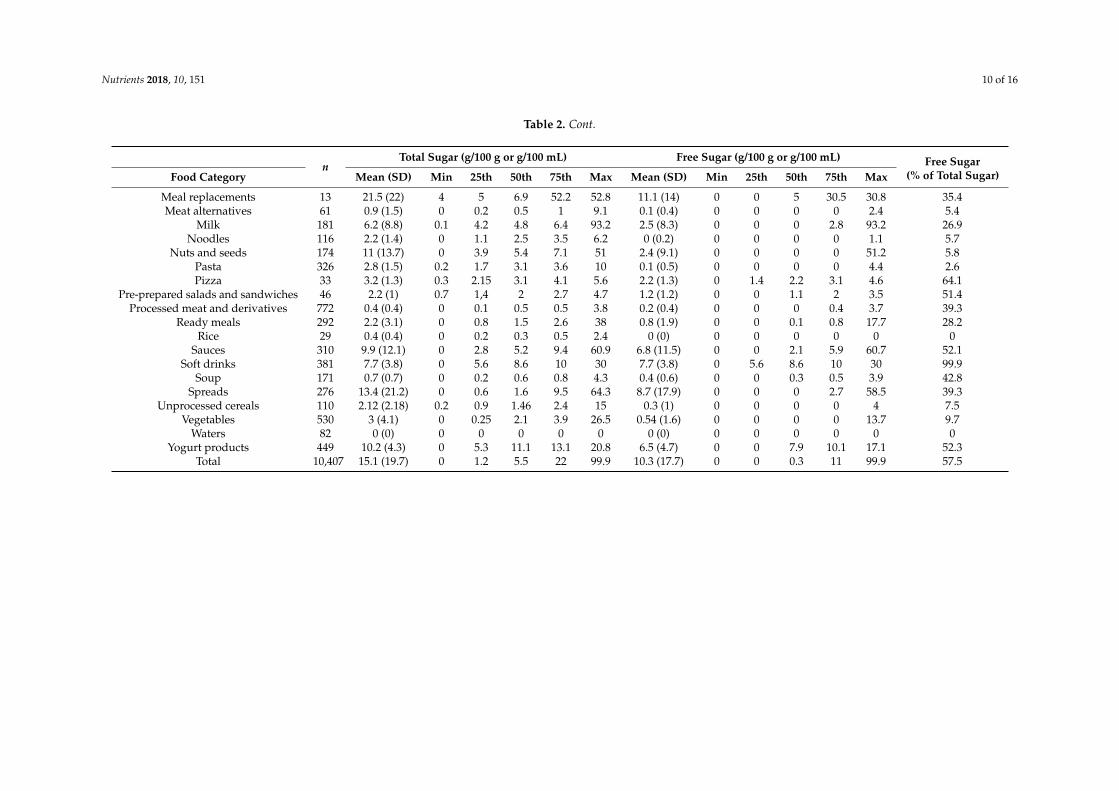
Table 2. Total and free sugar content (g/100 g or g/100 mL) of 10,407 packaged food products divided by food categories. Mean values, SD, quartiles (min, 25th,50th/median, 75th, max), and mean free sugar as a proportion of free sugar are shown for each category.
nTotal Sugar (g/100 g or g/100 mL) Free Sugar (g/100 g or g/100 mL) Free Sugar
(% of Total Sugar)Food Category Mean (SD) Min 25th 50th 75th Max Mean (SD) Min 25th 50th 75th Max
Baby foods 104 13.3 (12.4) 0 8.1 10.4 11.8 53 7.2 (7.5) 0 3.7 6.4 8.7 43.3 56.2Biscuits 736 24.6 (15.3) 0 9.5 26 36.6 60.8 22.4 (15.2) 0 5.5 24 35.2 60.8 81.2Bread 161 3.1 (2.2) 0.2 1.3 2.7 4 14 2.2 (2.3) 0 0 1.6 3.3 14 66.5
Breakfast cereals 297 19.2 (12.1) 0.3 9 20 27.6 60 14.7 (13.1) 0 1.9 13.7 23.8 57.4 62.3Butter and margarine 95 0.5 (0.8) 0 0 0.5 0.5 5.1 0 (0.1) 0 0 0 0 0.5 1.5
Cakes. muffins and pastry 360 18.7 (15.1) 0.2 3.6 15.8 32.8 60.7 16.5 (15.1) 0 1.8 12.8 29.5 60.3 72.8Canned fish and seafood 165 0.9 (1.4) 0 0 0.1 1.1 7.4 0.3 (0.9) 0 0 0 0 5.4 12.6
Cereal bars 61 28.4 (12.2) 5.1 22.7 29.6 34.1 69.9 23.8 (12.6) 0 15.5 26.5 30.4 67.7 83.4Cheese 459 2.1 (2.6) 0 0.1 1.8 3.5 36 0.1 (1.5) 0 0 0 0 32 0.5
Chewing gum 59 6.5 (20.9) 0 0 0 0 86 6.3 (20.9) 0 0 0 0 86 71.4Chilled fish 44 0.4 (0.8) 0 0 0.1 0.5 3.1 0.1 (0.5) 0 0 0 0 3.1 5.2
Chocolate and sweets 1078 49.3 (19.2) 0 42.7 50 58.2 99.9 44.6 (20.9) 0 36.2 44.4 55.5 99.9 87.1Coffee and tea 560 23.5 (27.3) 0 0.2 8.3 52 92 5.5 (16) 0 0 0 0 92 12.9Cooking oils 126 0 (0) 0 0 0 0 0 0 (0) 0 0 0 0 0 0
Cordials 92 31.9 (32.4) 0 9.2 10.1 73.2 90 31.9 (32.4) 0 9.2 10.1 73.2 90 100Couscous 12 1.8 (0.7) 0.8 1 1.9 2.3 2.7 0 (0) 0 0 0 0 0 0
Cream 106 4.3 (2.9) 0 3 3.4 4.2 15 1.5 (3.5) 0 0 0 0 15 16.4Crisps and snacks 242 3 (4.9) 0 1 1.8 3.4 52.3 2.1 (4.7) 0 0 0.7 2.8 50.6 45.6
Desserts 182 16.2 (8.8) 0 13 14.4 16.3 55 12.1 (9.5) 0 8.7 10.9 13.6 55 70Eggs 22 0.8 (0.3) 0 0.9 1 1 1 0 (0) 0 0 0 0 0 0
Electrolyte drinks 12 9.9 (18.9) 3.9 4 4 5.1 70 9.9 (18.9) 3.9 4 4 5.1 70 100Frozen fish 78 0.5 (0.8) 0 0 0 0.5 2.9 0.2 (0.6) 0 0 0 0 2.9 18.7
Fruits 248 32.7 (24) 0.1 12.3 17.5 57.2 78 8.2 (16.5) 0 0 0 9 76 25.4Fruit and vegetables juices 264 9.5 (2.9) 0.1 8.4 10 11.2 17 9.1 (3.1) 0 8 9.7 11.1 17 96.8
Honey and syrups 12 78 (3.2) 75 75 78 80.9 80.9 78 (3.2) 75 75 78 80.9 80.9 100Ice cream and edible ices 226 21.4 (6.1) 3.4 19.7 22 24.8 41 18.1 (6.1) 0 15.9 19.2 21.7 37.2 82.1
Jam and spreads 182 41.2 (15.7) 2.5 35.5 41.4 54 53 35.9 (17.7) 0 31.9 37.5 49.4 60.6 77.6Jelly 6 62.9 (7.4) 53 56.9 66 67.8 70 62.9 (7.4) 53 56.9 66 67.8 70 100
Maize (corn) 6 1.1 (0.7) 0.1 0.8 1.3 1.6 1.7 0 (0) 0 0 0 0 0 0Mayonnaise/dressings 55 3 (2.9) 0.1 1.5 2.1 3 12.2 2.7 (2.5) 0.1 1.5 2 3 12.2 95.1
Nutrients 2018, 10, 151 10 of 16
Table 2. Cont.
nTotal Sugar (g/100 g or g/100 mL) Free Sugar (g/100 g or g/100 mL) Free Sugar
(% of Total Sugar)Food Category Mean (SD) Min 25th 50th 75th Max Mean (SD) Min 25th 50th 75th Max
Meal replacements 13 21.5 (22) 4 5 6.9 52.2 52.8 11.1 (14) 0 0 5 30.5 30.8 35.4Meat alternatives 61 0.9 (1.5) 0 0.2 0.5 1 9.1 0.1 (0.4) 0 0 0 0 2.4 5.4
Milk 181 6.2 (8.8) 0.1 4.2 4.8 6.4 93.2 2.5 (8.3) 0 0 0 2.8 93.2 26.9Noodles 116 2.2 (1.4) 0 1.1 2.5 3.5 6.2 0 (0.2) 0 0 0 0 1.1 5.7
Nuts and seeds 174 11 (13.7) 0 3.9 5.4 7.1 51 2.4 (9.1) 0 0 0 0 51.2 5.8Pasta 326 2.8 (1.5) 0.2 1.7 3.1 3.6 10 0.1 (0.5) 0 0 0 0 4.4 2.6Pizza 33 3.2 (1.3) 0.3 2.15 3.1 4.1 5.6 2.2 (1.3) 0 1.4 2.2 3.1 4.6 64.1
Pre-prepared salads and sandwiches 46 2.2 (1) 0.7 1,4 2 2.7 4.7 1.2 (1.2) 0 0 1.1 2 3.5 51.4Processed meat and derivatives 772 0.4 (0.4) 0 0.1 0.5 0.5 3.8 0.2 (0.4) 0 0 0 0.4 3.7 39.3
Ready meals 292 2.2 (3.1) 0 0.8 1.5 2.6 38 0.8 (1.9) 0 0 0.1 0.8 17.7 28.2Rice 29 0.4 (0.4) 0 0.2 0.3 0.5 2.4 0 (0) 0 0 0 0 0 0
Sauces 310 9.9 (12.1) 0 2.8 5.2 9.4 60.9 6.8 (11.5) 0 0 2.1 5.9 60.7 52.1Soft drinks 381 7.7 (3.8) 0 5.6 8.6 10 30 7.7 (3.8) 0 5.6 8.6 10 30 99.9
Soup 171 0.7 (0.7) 0 0.2 0.6 0.8 4.3 0.4 (0.6) 0 0 0.3 0.5 3.9 42.8Spreads 276 13.4 (21.2) 0 0.6 1.6 9.5 64.3 8.7 (17.9) 0 0 0 2.7 58.5 39.3
Unprocessed cereals 110 2.12 (2.18) 0.2 0.9 1.46 2.4 15 0.3 (1) 0 0 0 0 4 7.5Vegetables 530 3 (4.1) 0 0.25 2.1 3.9 26.5 0.54 (1.6) 0 0 0 0 13.7 9.7
Waters 82 0 (0) 0 0 0 0 0 0 (0) 0 0 0 0 0 0Yogurt products 449 10.2 (4.3) 0 5.3 11.1 13.1 20.8 6.5 (4.7) 0 0 7.9 10.1 17.1 52.3
Total 10,407 15.1 (19.7) 0 1.2 5.5 22 99.9 10.3 (17.7) 0 0 0.3 11 99.9 57.5
Nutrients 2018, 10, 151 11 of 16
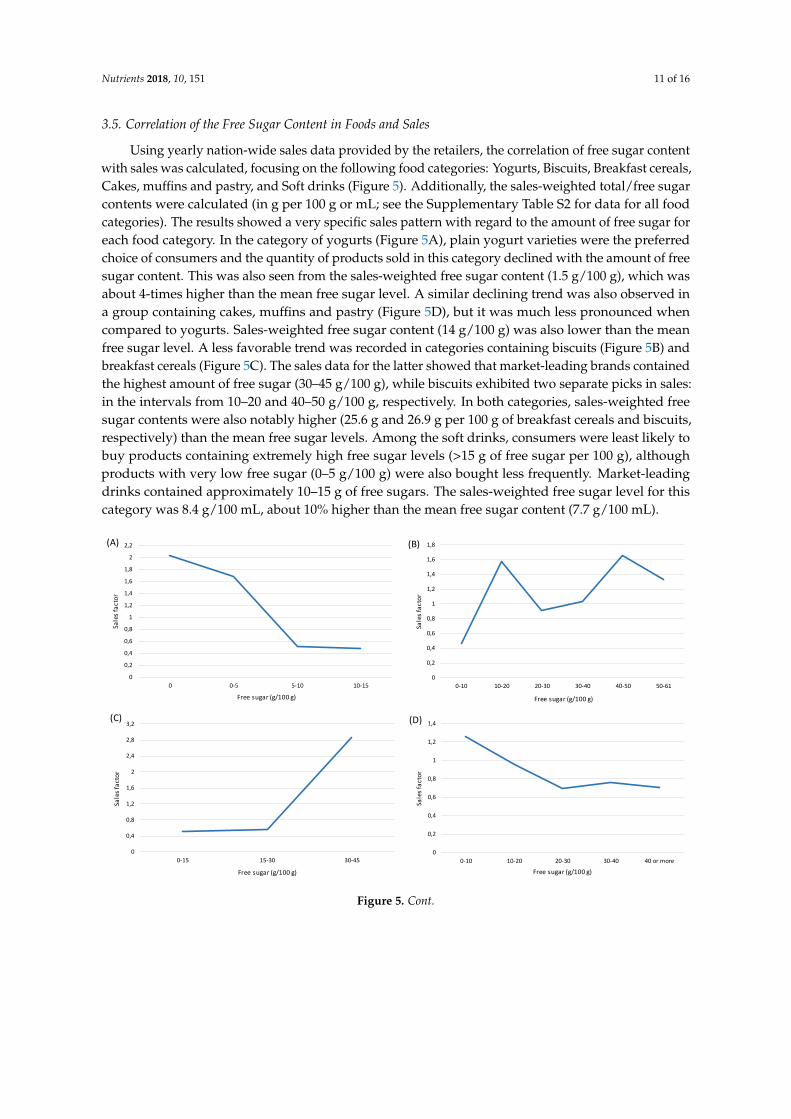
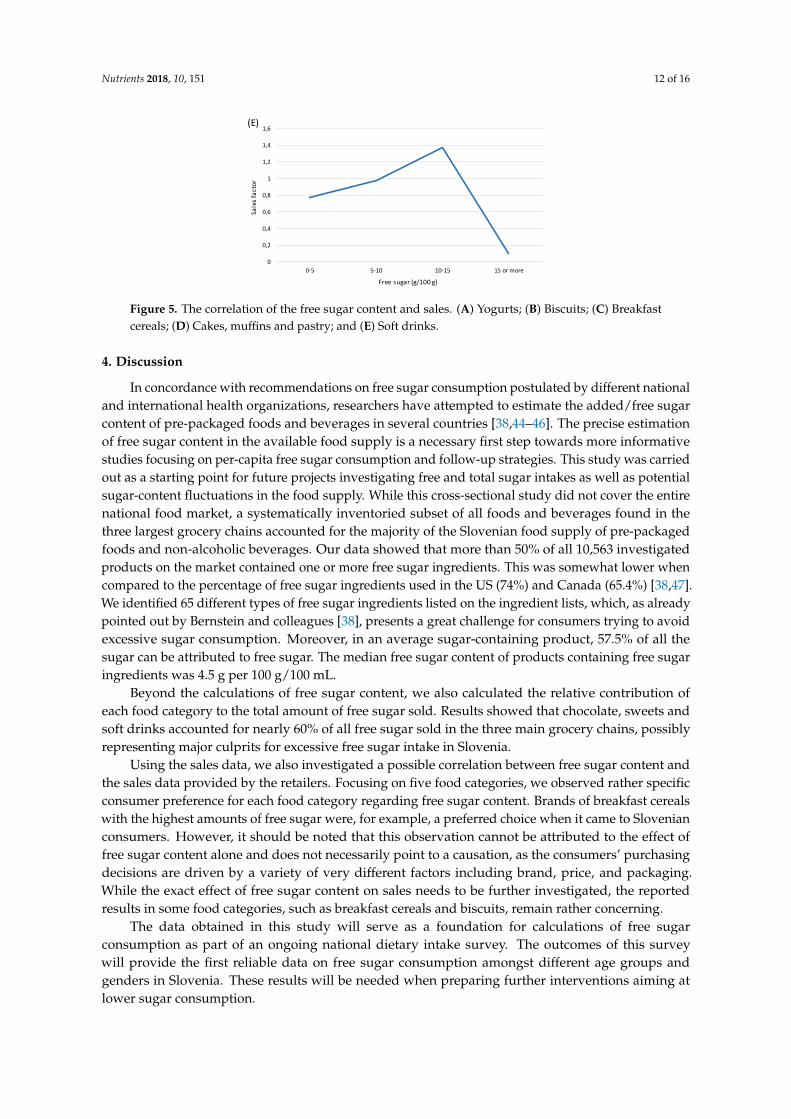
3.5. Correlation of the Free Sugar Content in Foods and Sales
Using yearly nation-wide sales data provided by the retailers, the correlation of free sugar contentwith sales was calculated, focusing on the following food categories: Yogurts, Biscuits, Breakfast cereals,Cakes, muffins and pastry, and Soft drinks (Figure 5). Additionally, the sales-weighted total/free sugarcontents were calculated (in g per 100 g or mL; see the Supplementary Table S2 for data for all foodcategories). The results showed a very specific sales pattern with regard to the amount of free sugar foreach food category. In the category of yogurts (Figure 5A), plain yogurt varieties were the preferredchoice of consumers and the quantity of products sold in this category declined with the amount of freesugar content. This was also seen from the sales-weighted free sugar content (1.5 g/100 g), which wasabout 4-times higher than the mean free sugar level. A similar declining trend was also observed ina group containing cakes, muffins and pastry (Figure 5D), but it was much less pronounced whencompared to yogurts. Sales-weighted free sugar content (14 g/100 g) was also lower than the meanfree sugar level. A less favorable trend was recorded in categories containing biscuits (Figure 5B) andbreakfast cereals (Figure 5C). The sales data for the latter showed that market-leading brands containedthe highest amount of free sugar (30–45 g/100 g), while biscuits exhibited two separate picks in sales:in the intervals from 10–20 and 40–50 g/100 g, respectively. In both categories, sales-weighted freesugar contents were also notably higher (25.6 g and 26.9 g per 100 g of breakfast cereals and biscuits,respectively) than the mean free sugar levels. Among the soft drinks, consumers were least likely tobuy products containing extremely high free sugar levels (>15 g of free sugar per 100 g), althoughproducts with very low free sugar (0–5 g/100 g) were also bought less frequently. Market-leadingdrinks contained approximately 10–15 g of free sugars. The sales-weighted free sugar level for thiscategory was 8.4 g/100 mL, about 10% higher than the mean free sugar content (7.7 g/100 mL).
Nutrients 2018, 10, x FOR PEER REVIEW 11 of 16
3.5. Correlation of the Free Sugar Content in Foods and Sales
Using yearly nation-wide sales data provided by the retailers, the correlation of free sugar content with sales was calculated, focusing on the following food categories: Yogurts, Biscuits, Breakfast cereals, Cakes, muffins and pastry, and Soft drinks (Figure 5). Additionally, the sales-weighted total/free sugar contents were calculated (in g per 100 g or mL; see the Supplementary Table S2 for data for all food categories). The results showed a very specific sales pattern with regard to the amount of free sugar for each food category. In the category of yogurts (Figure 5A), plain yogurt varieties were the preferred choice of consumers and the quantity of products sold in this category declined with the amount of free sugar content. This was also seen from the sales-weighted free sugar content (1.5 g/100 g), which was about 4-times higher than the mean free sugar level. A similar declining trend was also observed in a group containing cakes, muffins and pastry (Figure 5D), but it was much less pronounced when compared to yogurts. Sales-weighted free sugar content (14 g/100 g) was also lower than the mean free sugar level. A less favorable trend was recorded in categories containing biscuits (Figure 5B) and breakfast cereals (Figure 5C). The sales data for the latter showed that market-leading brands contained the highest amount of free sugar (30–45 g/100 g), while biscuits exhibited two separate picks in sales: in the intervals from 10–20 and 40–50 g/100 g, respectively. In both categories, sales-weighted free sugar contents were also notably higher (25.6 g and 26.9 g per 100 g of breakfast cereals and biscuits, respectively) than the mean free sugar levels. Among the soft drinks, consumers were least likely to buy products containing extremely high free sugar levels (>15 g of free sugar per 100 g), although products with very low free sugar (0–5 g/100 g) were also bought less frequently. Market-leading drinks contained approximately 10–15 g of free sugars. The sales-weighted free sugar level for this category was 8.4 g/100 mL, about 10% higher than the mean free sugar content (7.7 g/100 mL).
0
0,2
0,4
0,6
0,8
1
1,2
1,4
1,6
1,8
2
2,2
0 0-5 5-10 10-15
Sale
s fac
tor
Free sugar (g/100 g)
(A)
0
0,2
0,4
0,6
0,8
1
1,2
1,4
1,6
1,8
0-10 10-20 20-30 30-40 40-50 50-61
Sale
s fac
tor
Free sugar (g/100 g)
(B)
0
0,4
0,8
1,2
1,6
2
2,4
2,8
3,2
0-15 15-30 30-45
Sale
s fac
tor
Free sugar (g/100 g)
(C)
0
0,2
0,4
0,6
0,8
1
1,2
1,4
0-10 10-20 20-30 30-40 40 or more
Sale
s fac
tor
Free sugar (g/100 g)
(D)
Figure 5. Cont.
Nutrients 2018, 10, 151 12 of 16Nutrients 2018, 10, x FOR PEER REVIEW 12 of 16
Figure 5. The correlation of the free sugar content and sales. (A) Yogurts; (B) Biscuits; (C) Breakfast cereals; (D) Cakes, muffins and pastry; and (E) Soft drinks.
4. Discussion
In concordance with recommendations on free sugar consumption postulated by different national and international health organizations, researchers have attempted to estimate the added/free sugar content of pre-packaged foods and beverages in several countries [38,44–46]. The precise estimation of free sugar content in the available food supply is a necessary first step towards more informative studies focusing on per-capita free sugar consumption and follow-up strategies. This study was carried out as a starting point for future projects investigating free and total sugar intakes as well as potential sugar-content fluctuations in the food supply. While this cross-sectional study did not cover the entire national food market, a systematically inventoried subset of all foods and beverages found in the three largest grocery chains accounted for the majority of the Slovenian food supply of pre-packaged foods and non-alcoholic beverages. Our data showed that more than 50% of all 10,563 investigated products on the market contained one or more free sugar ingredients. This was somewhat lower when compared to the percentage of free sugar ingredients used in the US (74%) and Canada (65.4%) [38,47]. We identified 65 different types of free sugar ingredients listed on the ingredient lists, which, as already pointed out by Bernstein and colleagues [38], presents a great challenge for consumers trying to avoid excessive sugar consumption. Moreover, in an average sugar-containing product, 57.5% of all the sugar can be attributed to free sugar. The median free sugar content of products containing free sugar ingredients was 4.5 g per 100 g/100 mL.
Beyond the calculations of free sugar content, we also calculated the relative contribution of each food category to the total amount of free sugar sold. Results showed that chocolate, sweets and soft drinks accounted for nearly 60% of all free sugar sold in the three main grocery chains, possibly representing major culprits for excessive free sugar intake in Slovenia.
Using the sales data, we also investigated a possible correlation between free sugar content and the sales data provided by the retailers. Focusing on five food categories, we observed rather specific consumer preference for each food category regarding free sugar content. Brands of breakfast cereals with the highest amounts of free sugar were, for example, a preferred choice when it came to Slovenian consumers. However, it should be noted that this observation cannot be attributed to the effect of free sugar content alone and does not necessarily point to a causation, as the consumers’ purchasing decisions are driven by a variety of very different factors including brand, price, and packaging. While the exact effect of free sugar content on sales needs to be further investigated, the reported results in some food categories, such as breakfast cereals and biscuits, remain rather concerning.
The data obtained in this study will serve as a foundation for calculations of free sugar consumption as part of an ongoing national dietary intake survey. The outcomes of this survey will provide the first reliable data on free sugar consumption amongst different age groups and genders in Slovenia. These results will be needed when preparing further interventions aiming at lower sugar consumption.
0
0,2
0,4
0,6
0,8
1
1,2
1,4
1,6
0-5 5-10 10-15 15 or more
Sale
s fac
tor
Free sugar (g/100 g)
(E)
Figure 5. The correlation of the free sugar content and sales. (A) Yogurts; (B) Biscuits; (C) Breakfastcereals; (D) Cakes, muffins and pastry; and (E) Soft drinks.
4. Discussion
In concordance with recommendations on free sugar consumption postulated by different nationaland international health organizations, researchers have attempted to estimate the added/free sugarcontent of pre-packaged foods and beverages in several countries [38,44–46]. The precise estimationof free sugar content in the available food supply is a necessary first step towards more informativestudies focusing on per-capita free sugar consumption and follow-up strategies. This study was carriedout as a starting point for future projects investigating free and total sugar intakes as well as potentialsugar-content fluctuations in the food supply. While this cross-sectional study did not cover the entirenational food market, a systematically inventoried subset of all foods and beverages found in thethree largest grocery chains accounted for the majority of the Slovenian food supply of pre-packagedfoods and non-alcoholic beverages. Our data showed that more than 50% of all 10,563 investigatedproducts on the market contained one or more free sugar ingredients. This was somewhat lower whencompared to the percentage of free sugar ingredients used in the US (74%) and Canada (65.4%) [38,47].We identified 65 different types of free sugar ingredients listed on the ingredient lists, which, as alreadypointed out by Bernstein and colleagues [38], presents a great challenge for consumers trying to avoidexcessive sugar consumption. Moreover, in an average sugar-containing product, 57.5% of all thesugar can be attributed to free sugar. The median free sugar content of products containing free sugaringredients was 4.5 g per 100 g/100 mL.
Beyond the calculations of free sugar content, we also calculated the relative contribution ofeach food category to the total amount of free sugar sold. Results showed that chocolate, sweets andsoft drinks accounted for nearly 60% of all free sugar sold in the three main grocery chains, possiblyrepresenting major culprits for excessive free sugar intake in Slovenia.
Using the sales data, we also investigated a possible correlation between free sugar content andthe sales data provided by the retailers. Focusing on five food categories, we observed rather specificconsumer preference for each food category regarding free sugar content. Brands of breakfast cerealswith the highest amounts of free sugar were, for example, a preferred choice when it came to Slovenianconsumers. However, it should be noted that this observation cannot be attributed to the effect offree sugar content alone and does not necessarily point to a causation, as the consumers’ purchasingdecisions are driven by a variety of very different factors including brand, price, and packaging.While the exact effect of free sugar content on sales needs to be further investigated, the reportedresults in some food categories, such as breakfast cereals and biscuits, remain rather concerning.
The data obtained in this study will serve as a foundation for calculations of free sugarconsumption as part of an ongoing national dietary intake survey. The outcomes of this surveywill provide the first reliable data on free sugar consumption amongst different age groups andgenders in Slovenia. These results will be needed when preparing further interventions aiming atlower sugar consumption.
Nutrients 2018, 10, 151 13 of 16
A major strength of this study is the extent of the data collection and employment of yearlyproduct-specific sales data, which have provided a very interesting insight into free sugar content inmarket-leading brands. The compiled database will be useful for various purposes and will supportefficient monitoring of the changes in the food supply, and more reliable dietary assessments in thepopulation. One major limitation of our study was the use of sugar content data as reported onfood labels (rather than chemical analyses). However, there is no simple accurate analytical methodthat would enable measurements of free sugar content. Even measurements of total sugar wouldnot be feasible on such a large scale. Therefore, we had to rely on the information provided byfood manufacturers written on food labels, which is, however, a subject of regular inspection bythe food authorities. In relation to the source of the data, another limitation of the study was thatwe were not able to estimate the content of free sugar in all of the products. Some foods with freesugar (based on information provided in the mandatory list of ingredients) were not labelled withnutritional declarations and were therefore excluded from our analyses. However, less than 12% of thefoods (N = 1269) in the total sample were excluded due to missing data on sugar levels. It should bealso noted, that results on sugar content are provided in grams per 100 g, and not per portion size,because portion size measures are not standardized in Slovenia, nor in European Union. Additionally,such a presentation allows for an easier comparison of the data collected in different countries.
5. Conclusions
In conclusion, our study was the first to show the extent of free sugar ingredients used inSlovenian pre-packaged foods and beverages. Using a step-by-step methodology, we were able toestimate the free sugar content for a large representative sample of items found on the market. The dataobtained in the course of this study provided a valuable overview on the amount of sugar presentin commonly consumed food and beverages, thus supporting interventions aimed at lowering freesugar consumption.
Supplementary Materials: The following are available online at http://www.mdpi.com/2072-6643/10/2/151/s1.Supplementary Table S1: The list of all free sugar ingredients (FSI) identified during the analyses of pre-packagedproducts in the CLAS (Composition and Labelling Information System) database. Supplementary Table S2:Mean total sugar and Mean free sugar content (in g per 100 g or mL) of packaged food products divided byfood categories.
Acknowledgments: The authors would like to thank the retailers for granting access to their stores and sales data.We also acknowledge Živa Korošec and Urška Pivk Kupirovic (Nutrition Institute, Slovenia), and collaboratingstudents for their help in the data collection. The work was financially supported by the Slovenian ResearchAgency (P3-0395: Nutrition and Public Health). The funding organization had no role in the design, analysis orwriting of this article.
Author Contributions: N.Z. performed the data analyses and wrote the manuscript. K.M. coordinated the datacollection. A.K., K.Z. and N.F.M. participated in the preparation of the study design and critically reviewed themanuscript. I.P. was responsible for assuring the set-up and funding of the study, prepared the study design,collaborated in the data analyses, and in writing the manuscript.
Conflicts of Interest: The authors declare no conflicts of interest.
References
1. Bernabé, E.; Vehkalahti, M.M.; Sheiham, A.; Aromaa, A.; Suominen, A.L. Sugar-sweetened beverages anddental caries in adults: A 4-year prospective study. J. Dent. 2014, 42, 952–958. [CrossRef] [PubMed]
2. Lim, S.; Sohn, W.; Burt, B.A.; Sandretto, A.M.; Kolker, J.L.; Marshall, T.A.; Ismail, A.I. Cariogenicity of softdrinks, milk and fruit juice in low-income african-american children: A longitudinal study. J. Am. Dent. Assoc.2008, 139, 959–967. [CrossRef] [PubMed]
3. Warren, J.J.; Weber-Gasparoni, K.; Marshall, T.A.; Drake, D.R.; Dehkordi-Vakil, F.; Dawson, D.V.; Tharp, K.M.A longitudinal study of dental caries risk among very young low SES children. Commun. Dent. Oral Epidemiol.2009, 37, 116–122. [CrossRef] [PubMed]
4. Rosier, B.; van Loveren, C.; Zaura, E.; Keijser, B.; Crielaard, W.; Lagerweij, M. Caries incidence in a healthyyoung adult population in relation to diet. JDR Clin. Transl. Res. 2016, 2, 142–150. [CrossRef]
Nutrients 2018, 10, 151 14 of 16
5. Sheiham, A.; James, W.P.T. A new understanding of the relationship between sugars, dental caries andfluoride use: Implications for limits on sugars consumption. Public Health Nutr. 2014, 17, 2176–2184.[CrossRef] [PubMed]
6. Bremer, A.A.; Auinger, P.; Byrd, R.S. Sugar-sweetened beverage intake trends in US adolescents and theirassociation with insulin resistance-related parameters. J. Nutr. Metab. 2009, 2010. [CrossRef] [PubMed]
7. Malik, V.S.; Popkin, B.M.; Bray, G.A.; Després, J.-P.; Willett, W.C.; Hu, F.B. Sugar-sweetened beverages andrisk of metabolic syndrome and type 2 diabetes. Diabetes Care 2010, 33, 2477–2483. [CrossRef] [PubMed]
8. Montonen, J.; Järvinen, R.; Knekt, P.; Heliövaara, M.; Reunanen, A. Consumption of sweetened beverages andintakes of fructose and glucose predict type 2 diabetes occurrence. J. Nutr. 2007, 137, 1447–1454. [CrossRef][PubMed]
9. Perez-Pozo, S.; Schold, J.; Nakagawa, T.; Sanchez-Lozada, L.; Johnson, R.; Lillo, J.L. Excessive fructose intakeinduces the features of metabolic syndrome in healthy adult men: Role of uric acid in the hypertensiveresponse. Int. J. Obes. 2010, 34, 454–461. [CrossRef] [PubMed]
10. Te Morenga, L.; Mallard, S.; Mann, J. Dietary sugars and body weight: Systematic review and meta-analysesof randomised controlled trials and cohort studies. BMJ 2013, 346, e7492. [CrossRef] [PubMed]
11. Welsh, J.A.; Sharma, A.; Cunningham, S.A.; Vos, M.B. Consumption of added sugars and indicators ofcardiovascular disease risk among us adolescentsclinical perspective. Circulation 2011, 123, 249–257. [CrossRef][PubMed]
12. De Koning, L.; Malik, V.S.; Kellogg, M.D.; Rimm, E.B.; Willett, W.C.; Hu, F.B. Sweetened beverage consumption,incident coronary heart disease, and biomarkers of risk in menclinical perspective. Circulation 2012, 125,1735–1741. [CrossRef] [PubMed]
13. Yang, Q.; Zhang, Z.; Gregg, E.W.; Flanders, W.D.; Merritt, R.; Hu, F.B. Added sugar intake and cardiovasculardiseases mortality among US adults. JAMA Intern. Med. 2014, 174, 516–524. [CrossRef] [PubMed]
14. Te Morenga, L.A.; Howatson, A.J.; Jones, R.M.; Mann, J. Dietary sugars and cardiometabolic risk: Systematicreview and meta-analyses of randomized controlled trials of the effects on blood pressure and lipids. Am. J.Clin. Nutr. 2014, 100, 65–79. [CrossRef] [PubMed]
15. Ouyang, X.; Cirillo, P.; Sautin, Y.; McCall, S.; Bruchette, J.L.; Diehl, A.M.; Johnson, R.J.; Abdelmalek, M.F.Fructose consumption as a risk factor for non-alcoholic fatty liver disease. J. Hepatol. 2008, 48, 993–999.[CrossRef] [PubMed]
16. Assy, N.; Nasser, G.; Kamayse, I.; Nseir, W.; Beniashvili, Z.; Djibre, A.; Grosovski, M. Soft drink consumptionlinked with fatty liver in the absence of traditional risk factors. Can. J. Gastroenterol. Hepatol. 2008, 22, 811–816.[CrossRef]
17. Lírio, L.M.; Forechi, L.; Zanardo, T.C.; Batista, H.M.; Meira, E.F.; Nogueira, B.V.; Mill, J.G.; Baldo, M.P.Chronic fructose intake accelerates non-alcoholic fatty liver disease in the presence of essential hypertension.J. Diabetes Complicat. 2016, 30, 85–92. [CrossRef] [PubMed]
18. Welsh, J.A.; Sharma, A.; Abramson, J.L.; Vaccarino, V.; Gillespie, C.; Vos, M.B. Caloric sweetener consumptionand dyslipidemia among US adults. Jama 2010, 303, 1490–1497. [CrossRef] [PubMed]
19. Stanhope, K.L.; Medici, V.; Bremer, A.A.; Lee, V.; Lam, H.D.; Nunez, M.V.; Chen, G.X.; Keim, N.L.; Havel, P.J.A dose-response study of consuming high-fructose corn syrup–sweetened beverages on lipid/lipoproteinrisk factors for cardiovascular disease in young adults. Am. J. Clin. Nutr. 2015, 101, 1144–1154. [CrossRef][PubMed]
20. Aeberli, I.; Gerber, P.A.; Hochuli, M.; Kohler, S.; Haile, S.R.; Gouni-Berthold, I.; Berthold, H.K.; Spinas, G.A.;Berneis, K. Low to moderate sugar-sweetened beverage consumption impairs glucose and lipid metabolismand promotes inflammation in healthy young men: A randomized controlled trial. Am. J. Clin. Nutr. 2011,94, 479–485. [CrossRef] [PubMed]
21. Stanhope, K.L. Sugar consumption, metabolic disease and obesity: The state of the controversy. Crit. Rev.Clin. Lab. Sci. 2016, 53, 52–67. [CrossRef] [PubMed]
22. Schillinger, D.; Tran, J.; Mangurian, C.; Kearns, C. Do sugar-sweetened beverages cause obesity and diabetes?Industry and the manufacture of scientific controversy. Ann. Intern. Med. 2016, 165, 895–897. [CrossRef][PubMed]
23. World Health Organization. Guidline: Sugars Intake for Adults and Children. 2005. Available online: http://apps.who.int/iris/bitstream/10665/149782/1/9789241549028_eng.pdf (accessed on 17 January 2018).
Nutrients 2018, 10, 151 15 of 16
24. Mis, N.F.; Braegger, C.; Bronsky, J.; Campoy, C.; Domellöf, M.; Embleton, N.D.; Hojsak, I.; Hulst, J.; Indrio, F.;Lapillonne, A. Sugar in Infants, children and adolescents: A position paper of the European society forpaediatric gastroenterology, hepatology and nutrition committee on nutrition. J. Pediatr. Gastroenterol. Nutr.2017, 65, 681–696.
25. Scientific Advisory Committee on Nutrition (SACN). Carbohydrates and Health. Scientific AdvisoryCommittee on Nutrition. Available online: https://www.gov.uk/government/uploads/system/uploads/attachment_data/file/445503/SACN_Carbohydrates_and_Health.pdf (accessed on 17 January 2018).
26. Vos, M.B.; Kaar, J.L.; Welsh, J.A.; Van Horn, L.V.; Feig, D.I.; Anderson, C.A.; Patel, M.J.; Munos, J.C.;Krebs, N.F.; Xanthakos, S.A. Added sugars and cardiovascular disease risk in children: A scientific statementfrom the American Heart Association. Circulation 2017, 135, e1017–e1034. [CrossRef] [PubMed]
27. Azaïs-Braesco, V.; Sluik, D.; Maillot, M.; Kok, F.; Moreno, L.A. A review of total & added sugar intakes anddietary sources in Europe. Nutr. J. 2017, 16, 6. [PubMed]
28. Borra, S.T.; Bouchoux, A. Effects of science and the media on consumer perceptions about dietary sugars.J. Nutr. 2009, 139, 1214S–1218S. [CrossRef] [PubMed]
29. Weaver, D.; Finke, M. The relationship between the use of sugar content information on nutrition labels andthe consumption of added sugars. Food Policy 2003, 28, 213–219. [CrossRef]
30. EC. Regulation (EU) No 1169/2011 of the European Parliament and of the Council of 25 October 2011 on theProvision of Food Information to Consumers. Available online: http://eur-lex.europa.eu/legal-content/EN/TXT/PDF/?uri=CELEX:02011R1169-20140219 (accessed on 17 January 2018).
31. Genannt Bonsmann, S.S.; Celemín, L.F.; Larrañaga, A.; Egger, S.; Wills, J.M.; Hodgkins, C.; Raats, M.Penetration of nutrition information on food labels across the EU-27 plus Turkey. Eur. J. Clin. Nutr. 2010, 64,1379–1385. [CrossRef] [PubMed]
32. Pravst, I.; Kušar, A. Consumers’ exposure to nutrition and health claims on pre-packed foods: Use of salesweighting for assessing the food supply in Slovenia. Nutrients 2015, 7, 9353–9368. [CrossRef] [PubMed]
33. FDA. Changes to the Nutrition Facts Label. 2016. Available online: https://www.fda.gov/Food/GuidanceRegulation/GuidanceDocumentsRegulatoryInformation/LabelingNutrition/ucm385663.htm(accessed on 17 January 2018).
34. Mis, N.F.; Kobe, H.; Štimec, M. Dietary intake of macro-and micronutrients in Slovenian adolescents:Comparison with reference values. Ann. Nutr. Metab. 2012, 61, 305–313.
35. Kobe, H.; Štimec, M.; Ribic, C.H.; Mis, N.F. Food intake in Slovenian adolescents and adherence to theOptimized Mixed Diet: A nationally representative study. Public Health Nutr. 2012, 15, 600–608. [CrossRef][PubMed]
36. WHO. Adolescent Obesity and Related Behaviours: Trends and Inequalities in the WHO European Region,2002–2014. Available online: http://www.euro.who.int/__data/assets/pdf_file/0019/339211/WHO_ObesityReport_2017_v3.pdf (accessed on 28 August 2017).
37. Ministry of Health of Republic of Slovenia. Resolution on the National Programme on Nutrition and PhysicalActivity 2015–2025. In Slovenian: Resolucija o Nacionalnem Programu o Prehrani in Telesni Dejavnosti za Zdravje2015–2025; Ministry of Health: Ljubljana, Slovenia, 2015.
38. Bernstein, J.T.; Schermel, A.; Mills, C.M.; L’Abbé, M.R. Total and free sugar content of Canadian prepackagedfoods and beverages. Nutrients 2016, 8, 582. [CrossRef] [PubMed]
39. Pravst, I.; Lavriša, Ž.; Kušar, A.; Miklavec, K.; Žmitek, K. Changes in average sodium content of prepackedfoods in Slovenia during 2011–2015. Nutrients 2017, 9, 952. [CrossRef] [PubMed]
40. Nutrition Institute. Podatkovna Baza CLAS Kot Orodje za Vrednotenje Sprememb na Podrocju PonudbePredpakiranih Živil v Sloveniji. Available online: http://www.nutris.org/clas/ (accessed on 17 January 2018).
41. Korošec, Ž.; Pravst, I. Assessing the average sodium content of prepacked foods with nutrition declarations:The importance of sales data. Nutrients 2014, 6, 3501–3515. [CrossRef] [PubMed]
42. Dunford, E.; Webster, J.; Metzler, A.B.; Czernichow, S.; Mhurchu, C.N.; Wolmarans, P.; Snowdon, W.;L’Abbe, M.; Li, N.; Maulik, P.K. International collaborative project to compare and monitor the nutritionalcomposition of processed foods. Eur. J. Prev. Cardiol. 2012, 19, 1326–1332. [CrossRef] [PubMed]
43. Korošec, M.; Golob, T.; Bertoncelj, J.; Stibilj, V.; Seljak, B.K. The Slovenian food composition database.Food Chem. 2013, 140, 495–499. [CrossRef] [PubMed]
44. Ng, S.W.; Ostrowski, J.D.; Li, K.-P. Trends in added sugars from packaged beverages available and purchasedby US households, 2007–2012. Am. J. Clin. Nutr. 2017. [CrossRef] [PubMed]
Nutrients 2018, 10, 151 16 of 16
45. Sluik, D.; van Lee, L.; Engelen, A.I.; Feskens, E.J. Total, free, and added sugar consumption and adherenceto guidelines: The Dutch national food consumption survey 2007–2010. Nutrients 2016, 8, 70. [CrossRef][PubMed]
46. Louie, J.C.Y.; Lei, L.; Rangan, A.M. Reliability of a systematic methodology to estimate added sugars contentof foods when applied to a recent Australian food composition database. J. Food Compos. Anal. 2016, 46,36–42. [CrossRef]
47. Ng, S.W.; Slining, M.M.; Popkin, B.M. Use of caloric and noncaloric sweeteners in US consumer packagedfoods, 2005–2009. J. Acad. Nutr. Diet. 2012, 112, 1828–1834. [CrossRef] [PubMed]
© 2018 by the authors. Licensee MDPI, Basel, Switzerland. This article is an open accessarticle distributed under the terms and conditions of the Creative Commons Attribution(CC BY) license (http://creativecommons.org/licenses/by/4.0/).