Embed Size (px)
Citation preview

Total Maximum Daily Load Implementation Plan Beaver Creek – Macon County
(HUC 031300060101) Flint River Basin
Total Maximum Daily Load Implementation Plan Beaver Creek – Macon County
(HUC 031300060101) Flint River Basin
Prepared by Middle Flint Regional Development Center 228 West Lamar Street, Americus, Georgia
June 2003

Beaver Creek TMDL Implementation Plan Flint River Basin - Macon County Georgia
HUC # 031300060101 Background The State of Georgia assesses its water bodies for compliance with water quality standards criteria as required by the Federal Clean Water Act (CWA). Assessed water bodies are placed into one of three categories; supporting, partially supporting or not supporting their designated uses depending on water quality assessment results. These water bodies are placed on Georgia’s 305(b) list as required by that section of the CWA that addresses the assessment process, and are published every two years in Water Quality in Georgia. Some of the 305(b) partially supporting and not supporting water bodies are also assigned to Georgia’s 303(d) list, also named after the corresponding section of the CWA. Water bodies on the 303(d) list are required to have a Total Maximum Daily Load (TMDL) evaluation if water samples are found to exceed water quality standards for any of numerous contaminants. This segment of Beaver Creek in Macon County was one of many in the Flint River basin found to be in violation of water quality standards for fecal coliform bacteria. Based on analysis of water quality samples collected, the TMDL calls for a 90% reduction in the fecal coliform bacteria count; from 2.46E+13 to 2.57E+12. The TMDL process establishes the allowable loading of pollutants or other quantifiable parameters for a water body based on the relationship between pollution sources and in-stream water quality conditions. This allows water quality-based controls to be developed to reduce pollution and restore and maintain water quality. Water samples were collected by the Environmental Protection Division (EPD) of the Georgia Department of Natural Resources between February and October, inclusive, 2000, at trend monitoring station #11060201 located at Georgia Highway 90 (South Dooly Street) in Montezuma.1 The 303(d) listing consists of the ±7.5 linear mile segment of Beaver Creek from Spring Hill Creek to the Flint River.2 With this listing, all of Beaver Creek in Macon County has been placed on the 303(d) list. The 4.2 mile segment upstream of Spring Hill was listed as the result of water quality sampling performed in 1992. The collection methodology employed at that time was not nearly as rigorous as the 2000 methodology, and did not conform to commonly accepted standards concerning fecal coliform sampling of recreational waters. The Flint River Basin Management Plan 1997 included a statement acknowledging the previous sampling was not conducted at a sufficient frequency to enable a definitive determination of whether the monthly geometric mean criterion specified in the state water quality
1 The trend monitoring station is described as located at state road 49 near Montezuma. Beaver Creek does not cross SR 49 near Montezuma; it crosses SR 90 (South Dooly Street) in Montezuma. 2 The TMDL describes this segment as being four miles. The segment of Beaver Creek between Spring Hill and the Flint River is longer than stated in the TMDL.
1

standard had actually been violated. Nevertheless, the creek segment was listed and an implementation plan was prepared in 2001. The implementation plan proposed more extensive testing to validate the previous high fecal coliform bacteria count. Funding was secured later to perform the recommended testing, and during the summer months of 2002 samples were collected and analyzed in accord with commonly accepted procedures for fecal coliform bacteria. Geometric means were determined based on samples taken at three sites. Results of the 2002 Fecal Coliform Study - Beaver Creek, Macon, County, Georgia are provided in the attachment. Specific analysis can be found on page A-5. Environmental Parameter Fecal coliform bacteria are indicators of a potential public health risk, and not an actual cause of disease. They have been traditionally used by public health authorities to indicate health risk from a wide range of living organisms too small to see with the naked eye (microbes), and to set water quality standards for drinking water, shellfish consumption and water contact recreation. Fecal coliform bacteria suggest the co-presence of bacterial pathogens (disease-causing microbes) which can cause dysentery, gastrointestinal illness, cholera, typhoid fever and Astaph@ infections. The actual risk of contracting a disease from a pathogen depends on a host of factors, such as the method of exposure or transmission, pathogen concentration, incubation period and the age and health status of the infected party. Fecal coliform are an imperfect indicator of water safety, and regulators continually debate whether other bacterial species are better indicators of potential health problems. The debate remains largely academic; however, as over 90% of states still rely on fecal coliform, in whole or in part, as their recreational water quality standard.3 The water safety standard used by the State of Georgia for fecal coliform bacteria is based on a 30-day geometric mean (at least four samples collected during a thirty day period at intervals of not less than twenty-four hours) of 200 cfu/100 ml4 for water samples collected during the six month period May through October, inclusive, and a 30-day geometric mean of 1,000 cfu/100 ml (with a maximum of 4,000 cfu/100 ml) for water samples collected during the months of November through April, inclusive. The geometric mean is a statistical method used to adjust for great variability in sample values; quite characteristic of fecal coliform bacteria. As data in the following table reveals, the last three of the four geometric means exceed the applicable standard (200cfu/100ml). Consequently, this segment of Beaver Creek was classified as not supporting the creek’s designated use of fishing. 3 Watershed Protection Techniques, vol..3, no.1, April, 1999 4 coliform units/100 milliliters
2
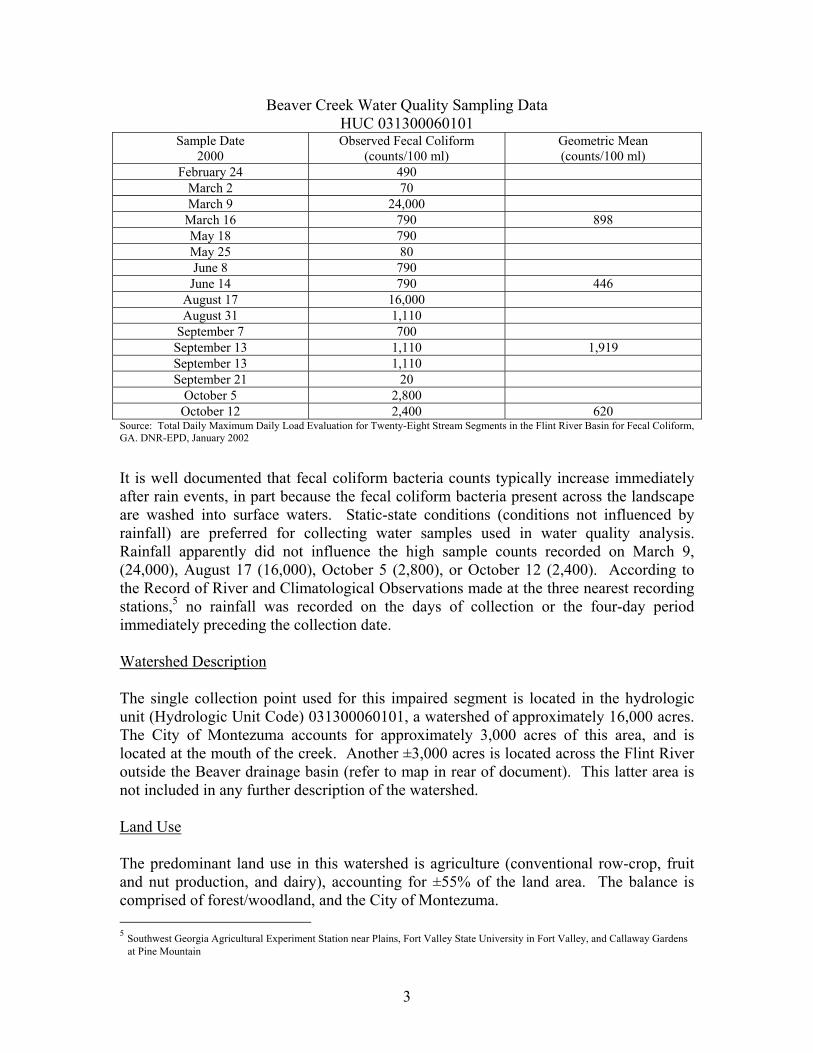
Beaver Creek Water Quality Sampling Data HUC 031300060101
Sample Date 2000
Observed Fecal Coliform (counts/100 ml)
Geometric Mean (counts/100 ml)
February 24 490 March 2 70 March 9 24,000
March 16 790 898 May 18 790 May 25 80 June 8 790
June 14 790 446 August 17 16,000 August 31 1,110
September 7 700 September 13 1,110 1,919 September 13 1,110 September 21 20
October 5 2,800 October 12 2,400 620
Source: Total Daily Maximum Daily Load Evaluation for Twenty-Eight Stream Segments in the Flint River Basin for Fecal Coliform, GA. DNR-EPD, January 2002 It is well documented that fecal coliform bacteria counts typically increase immediately after rain events, in part because the fecal coliform bacteria present across the landscape are washed into surface waters. Static-state conditions (conditions not influenced by rainfall) are preferred for collecting water samples used in water quality analysis. Rainfall apparently did not influence the high sample counts recorded on March 9, (24,000), August 17 (16,000), October 5 (2,800), or October 12 (2,400). According to the Record of River and Climatological Observations made at the three nearest recording stations,5 no rainfall was recorded on the days of collection or the four-day period immediately preceding the collection date. Watershed Description The single collection point used for this impaired segment is located in the hydrologic unit (Hydrologic Unit Code) 031300060101, a watershed of approximately 16,000 acres. The City of Montezuma accounts for approximately 3,000 acres of this area, and is located at the mouth of the creek. Another ±3,000 acres is located across the Flint River outside the Beaver drainage basin (refer to map in rear of document). This latter area is not included in any further description of the watershed. Land Use The predominant land use in this watershed is agriculture (conventional row-crop, fruit and nut production, and dairy), accounting for ±55% of the land area. The balance is comprised of forest/woodland, and the City of Montezuma. 5 Southwest Georgia Agricultural Experiment Station near Plains, Fort Valley State University in Fort Valley, and Callaway Gardens at Pine Mountain
3

This watershed has not experienced development in the past decade. Total estimated population is ±3,225; 93% of whom are residents of Montezuma. Housing units (single-family with septic systems) in the unincorporated area total approximately 100 with no concentrations and no residential development along the water’s edge. Housing in the City of Montezuma is connected to the municipal wastewater treatment system. Source Assessment Pollution originates from two broad sources; point sources and nonpoint sources. A point source is defined as a discernable, confined, and discrete point or site from which pollutants are discharged into surface waters. Examples of point sources are municipal and industrial wastewater treatment plants. These sources have been addressed through the federal Clean Water Act National Pollutant Discharge Elimination System (NPDES) permit program and are not the subject of this implementation plan. The second broad category of pollution is nonpoint sources. These are diffuse and generally involve accumulation of fecal coliform bacteria on land surfaces that wash off as a result of rain events. In general, nonpoint sources cannot be identified as discharging wastewater into a water body at a single location. Typical nonpoint sources of fecal coliform bacteria include: Wildlife Agricultural Livestock Urban Development Animal grazing/confinement Leaking septic systems Animal access to streams Land application systems Use of manure on crop/pasture Landfills Storm sewers Wildlife The importance of wildlife as a source of fecal coliform bacteria in streams varies considerably, depending on the animal species present in the watershed. Animals that spend a large portion of their time in or around aquatic habitats are considered to be the most significant wildlife contributors of fecal coliform bacteria. A feral hog population of unknown size has been reported in the watershed. Feral hogs are adaptable to almost any habitat, but prefer wooded areas close to water. Lacking sweat glands they regulate body temperature by lying in water or mud and cannot survive in hot climates without a plentiful supply of water. Areas elsewhere with significant feral hog populations have recorded high concentrations of fecal coliform bacteria. Their ability to thrive on a very diverse diet gives them a distinct survival advantage over other species. Because they are so prolific, adaptable, tenacious, and have no natural predators, it is difficult to control their population. According to 2000 deer census data of the Wildlife Resources Division of the Georgia Department of Natural Resources, there are approximately 35 deer in Macon County per
4

square mile. On the basis of this information it is assumed there are approximately 550 deer in the study area, equivalent to approximately one deer for every eighteen acres of land area. Although deer are generally considered to be one of the less significant contributors of fecal coliform bacteria, the feces they deposit on the land surface can result in the introduction of fecal coliform to streams during runoff (rain) events. It should be noted that between rain events considerable decomposition of the fecal matter should occur, resulting in a decrease in the associated fecal coliform numbers. This also holds true for other terrestrial mammals such as squirrel, rabbit and terrestrial birds. Agricultural Livestock Agricultural livestock are potential sources of fecal coliform bacteria whether on open pasture or in confinement. Cattle, sheep, horses, and goats grazing on pasture deposit feces onto land surfaces from where it can be transported to nearby streams during rain events. Livestock on open grazing also often have direct access to streams that pass through pastures, and as such can impact water quality in a more direct manner. Confined animal feeding operations (CAFO), such as beef cattle in feedlots, poultry houses and confined dairy cattle and swine, generate large quantities of fecal material within a limited area with potential for significant bacterial runoff. According to 2000 agricultural statistics there were 3,000 beef cattle in Macon County. Small numbers of beef cattle grazing open pasture are believed to be present in the watershed, but it is not known how many, if any, have direct access to Beaver Creek or its tributaries. There are not any beef cattle CAFOs in the watershed. With 9,600 head, Macon County may have the state’s largest dairy herd. Approximately 3000 of these are located on a single dairy farm in the watershed. Agricultural statistics indicate only 25 head of swine in the county, none of which are believed to be in the study area. 2000 agriculture statistics indicate seventeen million chickens were raised in 170 poultry houses distributed across the county. Some of these houses are located on the watershed boundary, but none are believed to be located in the drainage basin. However; it is assumed poultry litter was applied to farm land within the watershed. Unless the poultry farmer also row-crops, litter applied to cropland must be purchased, just as any other soil enhancer. Also like any other fertilizer, it must be incorporated soon after application to achieve maximum benefit. In recent years the poultry industry has been promoting the use of nutrient management planning; matching nutritional value of poultry litter with the nutritional needs of any given application site. This refinement to an existing best management practice further reduces the potential for bacterial runoff.
5

Urban Development For TMDL purposes, septic tanks are considered an “urban” development. After solids are trapped in a septic tank, wastewater is distributed through a subsurface drain field and allowed to percolate through the soil. If the septic system is properly located, installed and maintained, bacteria are effectively removed by filtering and straining water through the soil profile. A large number of septic systems fail, however, when wastewater breaks out or passes through the soil profile without adequate treatment. The causes of septic system failure are numerous; inadequate soils, poor design, siting, testing or inspection, hydraulic overloading, tree growth in the drain field, old age, and failure to clean out. Among the factors officials should consider when investigating whether septic systems are likely to be a major bacteria source are age (systems older than twenty years) and small lots. The design life of most septic systems is 15-30 years, at which point major rehabilitation or replacement is often needed. There are approximately 100 single-family housing units (with septic systems) in the study area with no significant concentrations, and no units proximate to the creek. No problems with malfunctioning septic systems have been reported in the county. The balance of residences are tied onto the City of Montezuma wastewater treatment system at the southern extremity of the basin. The wastewater from this facility is not discharged into Beaver Creek. Land Application Systems Many smaller communities use a land application system (LAS) for treatment of sanitary wastewater. These facilities are required through state-issued LAS permits to treat wastewater by land application and to have zero discharge. However, runoff during rain events may carry surface residual containing fecal coliform bacteria to nearby streams. After undergoing treatment in one of Montezuma’s plants, wastewater from a vegetable processor is applied to land in an unincorporated area of the watershed. This wastewater should not contain any fecal bacteria. This LAS site is located on the eastern boundary of the watershed. Landfills Leachate from landfills may contain fecal coliform bacteria and may at some point discharge into surface waters. Sanitary (municipal) landfills are the most likely type of landfills to serve as a source of fecal coliform bacteria. These receive household wastes, animal manure, offal, hatchery and poultry processing plant wastes, dead animals, and other types of wastes. Older sanitary landfills were not lined and those that remain active operate as construction/demolition landfills. Newer sanitary landfills are lined and have leachate collection systems. All landfills, except inert landfills, are now required to install environmental monitoring systems for groundwater sampling.
6

No such waste facility presently operates or is known to have operated in the watershed. Macon County closed an unlined, municipal solid waste landfill in the mid-1990s which was located immediately across the watershed boundary. At this location state road 49 comprises the boundary between watersheds, and the natural hydrology of the landfill site is a westward flow to the Flint River. Property adjoining the vacated landfill, and also across the watershed boundary, is owned by a regional landfill authority which has plans to operate a (lined) sanitary landfill in the future. Storm Sewers Municipalities typically collect storm water flow (runoff) via a storm sewer system, and discharge it through distinct outlet structures into creeks and streams. Documented sources of nonhuman fecal coliform in urban watersheds include dogs, cats, raccoons, rats, beaver, gulls, geese, pigeons. Dogs in particular appear to be a major source of coliform bacteria and other microbes, because of their population density, daily defecation rate, and pathogen infection rates. There are not any storm water treatment requirements applicable to the City of Montezuma. The city’s storm water collection system is a collection of unpaved drainage ditches. Only about 40% of Montezuma’s land area drains into Beaver Creek. The balance drains into the Flint River or Spring Creek on the south side of the city. Stakeholder Involvement Owners of land contiguous to the impaired segment of Beaver Creek were identified from courthouse tax records. Local government officials, Farm Bureau officers, health department and forestry officials, and agricultural experts from the County Extension Office and National Resources and Conservation Service were also identified. Thirty-three invitations were mailed to property owners and other stakeholders, and block ads were published in local newspapers inviting public participation in development of this document. Sixteen attended the Beaver Creek meeting. Potential Funding Sources Georgia EPD Watershed Assistance Grants Volunteer Activities (Adopt-A-Stream) Water Quality Cooperative Agreements Nonpoint Source Implementation Grants (319)
7

8
Beaver Creek Water Quality Sampling/Monitoring Plan HUC 031300060101
(refer to accompanying map)
Additional water sampling and analysis is proposed to help identify areas where efforts to locate possible contributors of fecal coliform loading are likely to be most beneficial. Additional sample collections are proposed for the following sites: Collection site 1 Junction of Tom Adams Road and Spring Hill Creek,
approximately 1,000 feet upstream of the confluence with Beaver Creek. This confluence marks the beginning of the impairment for this segment of Beaver Creek. Sampling at this site is considered important to determining whether wildlife from this creek, natural impoundments and/or wastewater from the City of Marshallville could be influencing fecal counts in Beaver Creek. From this confluence the other impaired segment of Beaver continues north. The northern segment was the subject of additional sampling in the summer of 2002, the results of which are included in the apppendix.
Collection site 2 Tom Adams Road and unnamed tributary to Beaver Creek. This
location is approximately 4,000 feet downstream of the creek’s head waters on a 3,000 head dairy farm, and approximately 4,000 feet upstream of Beaver Creek. This site provides easy public access to a sample site immediately downstream of the dairy. This creek has a relatively narrow wooded buffer between the proposed sample site and Beaver Creek.
Collection site 3 Barron’s Lane Road – This location provides easy access to a
Beaver Creek site downstream of the unnamed, northernmost reach of HUC 031300060101. (This site is approximately 3.5 linear miles downstream of Winchester Road where samples were collected in the summer of 2002-see appendix.)
Collection site 4 East Railroad Street – The four linear mile segment of Beaver
Creek downstream of site 3 is characterized by agriculture with a wide, forested buffer. This is the creek’s last accessible site which is not affected by development activity in the City of Montezuma.
Collection site 5 State road 90 (South Dooly Street) – Approximately two linear
miles downstream of site 4, this is the collection site used at the time of the 2000 sampling. Although Beaver flows through the heart of the city, it is the basin for ±40% of the incorporated area.


STATE OF GEORGIA TMDL IMPLEMENTATION PLAN FOR: __BEAVER CREEK____FECAL COLIFORM RIVER BASIN: __FLINT______________ (STREAM) (PARAMETER) PLAN DATE: June 30, 2003 Prepared by: Gerald Mixon___ _ Middle Flint Regional Development Center Address: _ 228 West Lamar______ ____ ___ City:___ _ Americus_____ _____ State: _ GA. _ Zip:____ _ 31709_ e-mail:[email protected] __ Date Submitted to EPD: ______June 30, 2003__ ___ __
Or Prepared By: ____________________________________________________ Address: _____________________________________________ City:____________________________State: __________ Zip: _____________ e-mail: _________________________________ Date Submitted to EPD:
General Information
Obtain this information from the TMDL document or other information. When completed, this document will be a self-contained report independent of the TMDL document.
Significant Stakeholders Identify local governments, agricultural organizations or significant landholders, commercial forestry organizations, businesses and industries, and local organizations including environmental groups with a major interest in this water body.
Additional stakeholders identified on page 16 TMDL ID (to be entered by EPD) Name/Organization Macon County Board of Commissioners Water body name Beaver Creek Address P. O. Box 297 HUC basin name Flint River City Oglethorpe State GA Zip 31068HUC number 031300060101 Phone 478-472-7040 e-mail Primary county Macon Name/Organization City of Oglethorpe Secondary county Address P. O. Box 425 Primary RDC Middle Flint City Oglethorpe State GA Zip 31068Secondary RDC Phone 478-472-6485 e-mail
Spring Hill Cr. to Flint River Name/Organization City of Montezuma Water body location Montezuma-Marshallville Address P. O. Box 388
Miles or area impacted 4 miles (per TMDL) City Montezuma State GA Zip 31063Parameter addressed in plan Fecal coliform Phone 478-472-8144 e-mail Water use classification fishing Name/Organization Macon County Farm Bureau
Partially supporting use Address P. O. Box 314 Degree of impairment Not supporting use X City Oglethorpe State GA Zip 31068
Date TMDL approved by EPA Phone 478-472-7588 e-mail Point sources Name/Organization Macon County Health Department Nonpoint sources X Address 100 Sumter Street
Impairment due to
Both City Oglethorpe State GA Zip 31068Point source-Form A; Nonpoint source-Form B; Both-Form A+B+C Phone 478-472-8121 e-mail
9
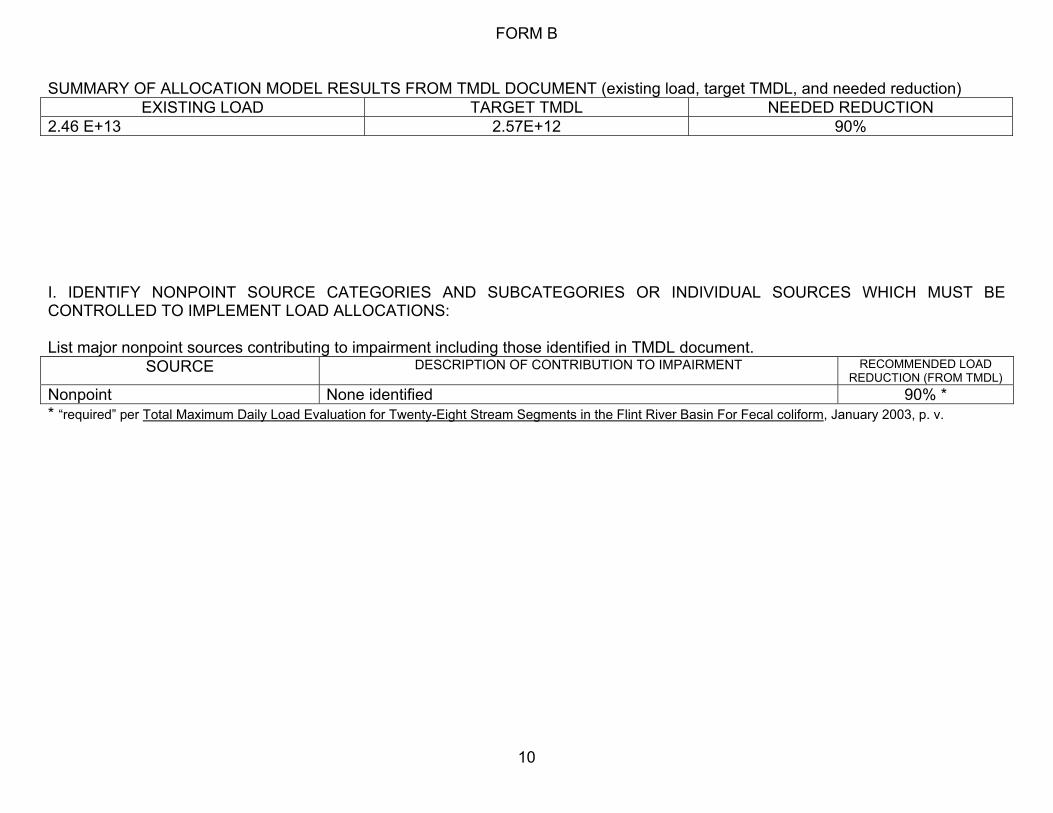
FORM B SUMMARY OF ALLOCATION MODEL RESULTS FROM TMDL DOCUMENT (existing load, target TMDL, and needed reduction)
EXISTING LOAD TARGET TMDL NEEDED REDUCTION 2.46 E+13 2.57E+12 90% I. IDENTIFY NONPOINT SOURCE CATEGORIES AND SUBCATEGORIES OR INDIVIDUAL SOURCES WHICH MUST BE CONTROLLED TO IMPLEMENT LOAD ALLOCATIONS: List major nonpoint sources contributing to impairment including those identified in TMDL document.
SOURCE DESCRIPTION OF CONTRIBUTION TO IMPAIRMENT RECOMMENDED LOAD REDUCTION (FROM TMDL)
Nonpoint None identified 90% * * “required” per Total Maximum Daily Load Evaluation for Twenty-Eight Stream Segments in the Flint River Basin For Fecal coliform, January 2003, p. v.
10

II. DESCRIBE ANY REGULATORY OR VOLUNTARY ACTIONS INCLUDING MANAGEMENT MEASURES OR OTHER CONTROLS BY GOVERNMENTS OR INDIVIDUALS THAT WILL HELP ACHIEVE THE LOAD ALLOCATIONS IN THE TMDL: Existing or required regulatory actions RESPONSIBLE GOVERNMENT, ORGANIZATION OR ENTITY
NAME OF REGULATION/ORDINANCE
DESCRIPTION ENACTED OR PROJECTED DATE (mm/yy)
STATUS
Macon County Board of Comm. Wetland protection ord. Prohibits development in wetland areas 02-99 active Macon County Board of Comm. Groundwater Recharge Regulates development in recharge areas 02-99 active Macon County Board of Comm. Poultry ordinance Regulates development of poultry houses 03-94 active Macon County Board of Comm. Zoning Ordinance Regulates location of development 09-02 Macon County Health Dept. State Rules and Regs.
For On-site Sewage Management Systems
Regulates installation of septic tanks 01-98 active
GA EPD Concentrated Animal Feedlot Operations
Enforcement of wastewater treatment regulations applicable to feedlot operations
09-74 enforced asneeded
Existing voluntary actions RESPONSIBLE ORGANIZATION OR ENTITY
NAME OF ACTION
DESCRIPTION ENACTED OR PROJECTED DATE (mm/yy)
STATUS
Ag producers Best Management Practices
Maximizing production without causing deleterious effects on other resources
1990s active
Landowners Wild game hunting Hunting feral hogs for recreational purposes
2000 active
Landowners Wild game hunting and trapping
Hunting and trapping feral hogs for property protection
2000 active
Soil and Water Conservation District
Promote voluntary adoption of agricultural best management practices
Provide leadership in the protection, conservation, and improvement of soil, water and related resources
1937 active
USDA Natural Resources Conservation Service (NRCS)
Environmental Quality Incentives Program and other T/A
Develop standards and specification regarding conservation practices, animal waste management systems, grazing activities, et.al. – implements state priorities
1997 Needsfunding
11

Cooperative Extension Service and Experiment Stations
Disseminate information
Consultative assistance, information on nonpoint-related impacts on water quality, water quality monitoring, analysis of nutrients and other constituents in animal waste, nutrient management plans
1914 active
Farm Services Agency (FSA) water quality improvement practices (Conservation Reserve Program)
Administration of cost-sharing and incentive programs for practices that improve environmental quality of farms. Funds targeted for high-priority watersheds with water quality problems.
1985 active
Georgia Department of Agriculture disease control Provides guidance in location of animal waste facilities and disposal of dead animals.
1874 as needed
USDA Agricultural Research Service (ARS)
agriculture research and monitoring
Research on grazing land systems and irrigation methods relevant to watershed-scale monitoring projects and nutrient movement in surface water and groundwater.
as needed
Resource Conservation and Development Council
Volunteer activism Citizen activism in conservation of natural resources
1962 as needed
12

Additional recommended regulatory or other measures which should be implemented to reduce the loads of the TMDL parameter ENTITY/ORGANIZATION RESPONSIBLE
NAME OF PROPOSED REGULATION/ORDINANCE/ OTHER
DESCRIPTION ENACTED OR PROJECTED DATE (mm/yy)
STATUS
GA DNR Hunter education Educate hunters of the environmental harm of disposing wild game entrails in waterways
Years 1-5 Pending plan approval and funding
GA DNR Wildlife survey Survey impaired creek segment to determine whether wildlife are present in numbers sufficient to be major contributors to any unsafe fecal coliform levels, and develop necessary plan to address any problems identified
Year 2 Pending plan approval and funding
Cooperative Extension Service, et. al.
Spot-check BMP applications
Visits to selected sites to assess proper implementation of agricultural BMPs pending results of additional testing
Year 2-3 Pending plan approval and funding
GA DNR, et. al. Assess condition of natural impoundment downstream of Marshallville WPCP
Assess quality of water impounded by beaver dam immediately downstream of Marshallville WPCP
Pendingplan approval and funding
13
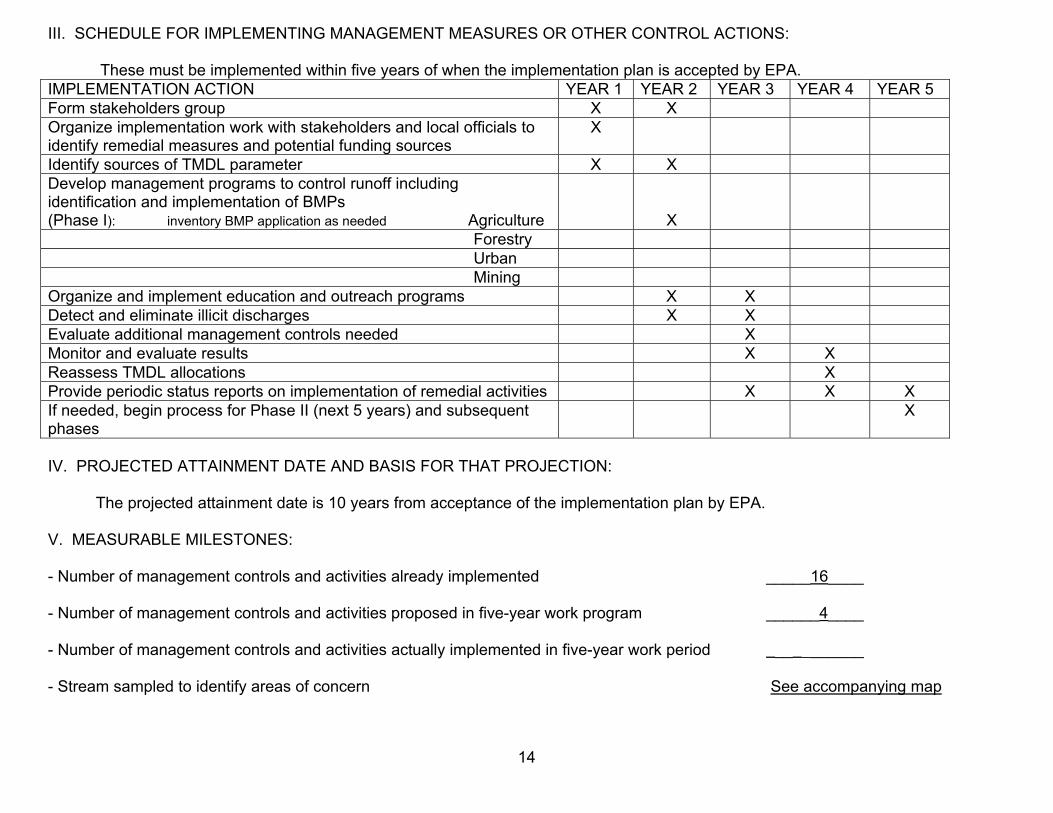
III. SCHEDULE FOR IMPLEMENTING MANAGEMENT MEASURES OR OTHER CONTROL ACTIONS:
These must be implemented within five years of when the implementation plan is accepted by EPA. IMPLEMENTATION ACTION YEAR 1 YEAR 2 YEAR 3 YEAR 4 YEAR 5 Form stakeholders group X X Organize implementation work with stakeholders and local officials to identify remedial measures and potential funding sources
X
Identify sources of TMDL parameter X X Develop management programs to control runoff including identification and implementation of BMPs (Phase I): inventory BMP application as needed Agriculture
X
Forestry Urban Mining Organize and implement education and outreach programs X X Detect and eliminate illicit discharges X X Evaluate additional management controls needed X Monitor and evaluate results X X Reassess TMDL allocations X Provide periodic status reports on implementation of remedial activities X X XIf needed, begin process for Phase II (next 5 years) and subsequent phases
X
IV. PROJECTED ATTAINMENT DATE AND BASIS FOR THAT PROJECTION: The projected attainment date is 10 years from acceptance of the implementation plan by EPA. V. MEASURABLE MILESTONES: - Number of management controls and activities already implemented _____16____ - Number of management controls and activities proposed in five-year work program ______4____ - Number of management controls and activities actually implemented in five-year work period __ _______ - Stream sampled to identify areas of concern See accompanying map
14

VI. MONITORING PLAN: Describe previous or current sampling activities or other surveys to detect sources or to measure effectiveness of management measures or other controls.
ORGANIZATION TIME FRAME PARAMETERS PURPOSE STATUSDNR-EPD Watershed Planning & Monitoring Program
Feb-Oct, 2000 Fecal Coliform Quality Assessment (TMDL Development)
completed
Describe any planned or proposed sampling activities or other surveys. (Scheduled EPD sampling can be found in the Basin Planning document.)
ORGANIZATION TIME FRAME PARAMETERS PURPOSE STATUSGeorgia Southwestern State University 2004
Fecal coliform verify presence of fecal and if
necessary perform alternative bacteriological testing to distinguish between possible source(s)
Implementa-tion pending plan approval and funding
GA EPD 2005 Fecal coliform basin planning Scheduled VII. CRITERIA TO DETERMINE WHETHER SUBSTANTIAL PROGRESS IS BEING MADE: - % concentration or load change 90% reduction in loading and/or resultant concentrations - Categorical change in classification of the stream
delisting is the goal - Regulatory controls or activities installed
four new activities proposed
- Best management practices installed selective survey of agriculture BMP applications pending results of additional water quality testing
15
16
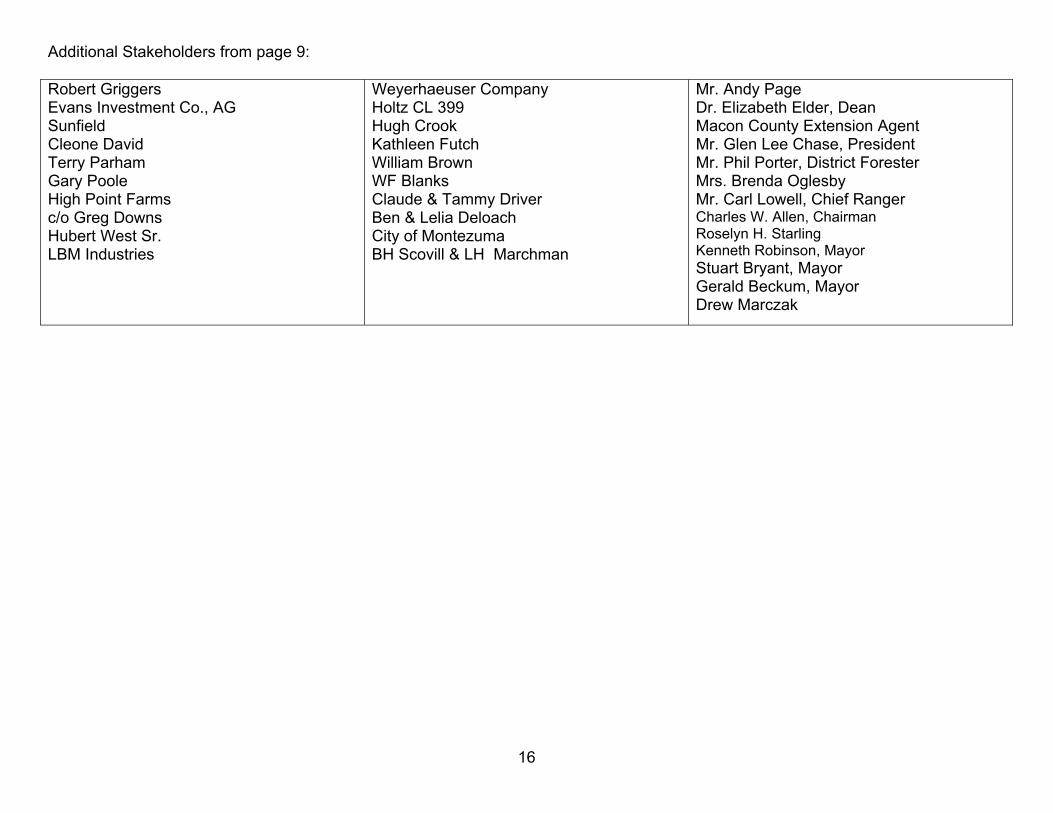
Additional Stakeholders from page 9: Robert Griggers Evans Investment Co., AG Sunfield Cleone David Terry Parham Gary Poole High Point Farms c/o Greg Downs Hubert West Sr. LBM Industries
Weyerhaeuser Company Holtz CL 399 Hugh Crook Kathleen Futch William Brown WF Blanks Claude & Tammy Driver Ben & Lelia Deloach City of Montezuma BH Scovill & LH Marchman
Mr. Andy Page Dr. Elizabeth Elder, Dean Macon County Extension Agent Mr. Glen Lee Chase, President Mr. Phil Porter, District Forester Mrs. Brenda Oglesby Mr. Carl Lowell, Chief Ranger Charles W. Allen, Chairman Roselyn H. Starling Kenneth Robinson, Mayor Stuart Bryant, Mayor Gerald Beckum, Mayor Drew Marczak

2002 FECAL COLIFORM STUDY BEAVER CREEK
MACON COUNTY, GEORGIA
The preparation of this report was financed in part through a grant from the U.S. Environmental Protection Agency under the Provisions of Section 604(b) of the Federal Water Pollution Control Act, as amended, for the Environmental Protection Division of the Department of Natural Resources, State of Georgia, and the Middle Flint Regional Development Center. This report was prepared by Dr. Elizabeth Elder, Biology Department, Georgia Southwestern State University, 800 Wheatley Street, Americus, Georgia 31709.
September, 2002

2002 FECAL COLIFORM STUDY BEAVER CREEK
MACON COUNTY, GEORGIA
SAMPLE LOCATIONS: Samples were collected from three locations within Beaver Creek. The sample locations were: Site 1: Beaver Creek at Winchester Road (Macon County Road #38) Site 2: Beaver Creek accessed across Glenn Johnson property (additional
site not identified in TMDL Implementation Plan) Site 3: Beaver Creek at Georgia Highway 49 TMDL Implementation Site #2) Site 1 was located at the down-stream end of the impaired segment of Beaver Creek. Site 2 was located in the middle of the impaired segment. Site 3 was at the up-stream end of the impaired segment. The flow in Beaver Creek was om Site 3 through Site 2 through Site 1. fr
SAMPLE DATES AND TIMES:
Table 1: Collection Dates and Times
DATES (2002) TIMES
May 22, 24, 28, 31 June 3, 5, 10, 17 July 1, 8, 16, 29, August 2, 6, 16
Site 1: 9:00 am Site 2: 8:00 am Site 3: 8:30 am
August 22 Site 1: 3:00 pm Site 2: 2:00 pm Site 3: 2:30 pm
PERSONNEL: The principal investigator involved in the project was Dr. Elisabeth D. Elder, a Professor of Biology on the Faculty of Georgia Southwestern State University. Dr. Elder has a PhD in microbiology from Texas A&M University, a MS in microbiology from Stephen F. Austin State University, and a BS in biology from Southern Methodist University. Research for both the MS and PhD were field studies which included fecal coliform analysis of water samples. Subsequent experience in fecal coliform work was gained through a water quality study on Spring Creek and Warren Slough, portions of Lake Blackshear, Georgia, and through 22 years as an academic microbiologist. A resume for Dr. Elder is attached. Dr. Elder was responsible for all sample work including collection, handling, and processing plus all data collection and analyses. Dr. Elder was assisted by Ms. Theresa Wieszalski, an undergraduate student at Georgia Southwestern State University. Ms. Wieszalksi has microbiology lab experience through an course taken at Georgia Southwestern. Dr. Elder was also assisted by Ms. Chelsea Carter, an undergraduate student at the State University of West Georgia in Carrollton, Georgia. Ms. Carter has previous experience on a research team studying fecal coliforms in west Georgia watersheds. Both students were supervised by Dr. Elder during the project.
1

SAMPLE COLLECTIONS METHODS: The study was undertaken in compliance with the procedures required by the Georgia Department of Natural Resources, Environmental Protection Division in Title 40 CFR 136 which was updated in 1999 and downloaded from the web in January 2001. The use of these procedures was verified with Ms. Vickie A. Yarbrough, Environmental Outreach Coordinator with the Georgia Department of Natural Resources, prior to initiating the project and again prior to data analysis. Samples, composed of at least 100 mL of water, were collected in sterile bottles with lids that did not have liners. All samples were collected in mid-stream and at mid-depth by a grab technique which involved:
1. Opening the sterile bottle under the water surface, 2. Holding the open mouth of the bottle upstream, 3. Filling the bottle to within 1 inch of the mouth, 4. Closing the bottle under the surface, and 5. Immediately placing the bottle on ice for transport.
All samples were processed on the same days they were collected, immediately upon return to the lab. The processing of the samples utilized the approved membrane filtration technique with 3 portions (10.0, 1.0, and 0.1 mL) filtered for each water sample. These portions were selected to provide colony counts within the desired range while utilizing portions that would flow through the filters without clogging. To evenly disperse the bacterial cells over the membranes all portions were mixed with 50.0 mL of sterile buffer prior to filtration. A control was run with each set of samples by filtering 50.0 mL of sterile buffer. Filters were incubated for 24+ 2 hours in a 44.5o C circulating water bath. Blue colonies, indicative of fecal coliforms, were counted with the aid of a Quebec colony counter. The characteristic blue color of fecal coliforms was verified by filtering buffer inoculated with a diluted Escherichia coli culture obtained from Presque Isle Cultures in Presque Isle, PA. DATA:
Table 2: Fecal Coliform Counts
Site 1 Site 2 Site 3
Date Portion (mL)
Colony Count
Portion (mL)
Colony Count
Portion (mL)
Colony Count
5/22 10.0 2 10.0 7 10.0 2
1.0 2 1.0 2 1.0 0
0.1 0 0.1 0 0.1 0
5/24 10.0 7 10.0 2 10.0 54
1.0 3 1.0 0 1.0 03
0.1 0 0.1 0 0.1 0
5/28 10.0 5 10.0 3 10.0 43
1.0 1 1.0 0 1.0 4
0.1 0 0.1 0 0.1 2
2

5/31 10.0 14 10.0 9 10.0 TNTC
1.0 1 1.0 1 1.0 39
0.1 0 0.1 0 0.1 6
6/3 10.0 4 10.0 5 10.0 43
1.0 1 1.0 0 1.0 5
0.1 0 0.1 1 0.1 0
6/5 10.0 8 10.0 1 10.0 89
1.0 0 1.0 0 1.0 7
0.1 0 0.1 0 0.1 0
6/10 10.0 22 10.0 7 10.0 20
1.0 3 1.0 0 1.0 1
0.1 1 0.1 0 0.1 0
6/17 10.0 8 10.0 1 10.0 18
1.0 0 1.0 0 1.0 3
0.1 0 0.1 0 0.1 0
7/1 10.0 10 10.0 0 10.0 22
1.0 2 1.0 0 1.0 5
0.1 0 0.1 0 0.1 1
7/8 10.0 23 10.0 5 10.0 112
1.0 2 1.0 0 1.0 5
0.1 0 0.1 0 0.1 0
7/23 10.0 29 10.0 47 10.0 19
1.0 1 1.0 5 1.0 0
0.1 0 0.1 0 0.1 0
7/29 10.0 105 10.0 25 10.0 12
1.0 19 1.0 1 1.0 1
0.1 1 0.1 0 0.1 0
8/2 10.0 44 10.0 36 10.0 49
1.0 3 1.0 1 1.0 7
0.1 0 0.1 1 0.1 0
8/6 10.0 15 10.0 31 10.0 TNTC
3

1.0 1 1.0 1 1.0 8
0.1 0 0.1 0 0.1 1
8/16 10.0 12 10.0 14 10.0 63
1.0 3 1.0 1 1.0 3
0.1 0 0.1 0 0.1 0
8/22 10.0 18 10.0 2 10.0 44
1.0 2 1.0 1 1.0 9
0.1 0 0.1 0 0.1 0
Table 3: Geometric Means Fecal Coliforms/100 mL
Month Site 1 Site 2 Site 3
May 69 43 201
June 85 23 347
July 295 48 265
August 198 142 577
NOTE: The sample collected at Site 2 on July 1, 2002, resulted in no fecal coliform colonies for the portions filtered. By convention, a 0 in a geometric mean calculation results in a geometric mean of 0. Since the remainder of the July samples collected and portions filtered resulted in countable fecal coliforms, recording a 0 for the month was thought to be inappropriate. To facilitate the calculation of the geometric mean, the 0 was replaced with 1. With the resulting geometric mean of 48, the substitution did impact compliance of the area with Georgia or EPD requirements.
4

BEAVER CREEK DISCUSSION: Within the segment tested for Beaver Creek, Site 2 consistently met the Georgia and DNR limits for fecal coliforms. Site 1 met the limits in May, June, and August. July counts were slightly out of the limits. Site 3 routinely did not meet the Georgia and DNR limits for fecal coliforms. Several factors may have lead to the high fecal coliform counts: 1. The ongoing drought greatly decreased the flow through the stream. (See
rainfall table chart below these comments.) The rainfall was low and very spotty.
2. The ongoing drought resulted in less water being available for wildlife, therefore more animals were coming to the stream to drink. Prints of canines, felines, raccoons, rabbits, pigs, and deer were routinely seen in the areas where samples were collected. Live foxes, deer, and bobcats were seen in the areas. Several dead pigs were seen in the areas sampled.
3. The placement of the third sampling site may have also been a factor. Throughout the study Site 3 had lower dissolved oxygen levels than the other 2 sites. During the July 29, 2002, sampling flow through the area was restricted by mud and debris blocking the culvert under Highway 49. A telephone conversation with the Americus Office of the Department of Transportation resulted in the removal of the debris by a maintenance crew from the Perry Office of the Department of Transportation. This removal, undertaken between July 29 and August 2, may have contributed to the lower the quality of the water. (See the physical data table below this discussion.)
4. Site 3 was located adjacent to a chicken facility. Runoff could have carried bacteria from the facility into the upper reaches of Beaver Creek. However, the “higher” rainfalls don’t appear to correlate with the higher fecal coliform counts.
5. Although the area is heavily used in agricultural practices, no domesticated animals were seen in the creek.
5

Rainfall Data Source May Total June Total July Total August Total (inches) (inches) (inches) (inches) Georgia Forestry 2.55 1.49 2.39 1.15 Commission, Oglethorpe Cordele 2.42 3.94 5.62 4.55 Airport Flint River 1.13 3.20 4.99 4.07 Nursery Catahoula 0.8 2.46 3.89 1.78* Farm, Cordele Experiment1.09 2.64 5.27 3.04 Station, Plains
6

Beaver Creek Physical Data
Date Site 1 Site 2* Site 3* 5/22 Air 13.0 12.5 12.4 Water 20.3 19.6 16.0 DO 8.2 7.2 5.0 pH 7.5 7.6 7.5 Cond 42 58 76 5/24 Air 14.3 13.8 14.3 Water 20.9 22.5 20.9 DO 7.8 6.02 7.8 pH 7.5 7.4 7.5 Cond 48 58 ' 48 5/28 Air 20.6 20.8 20.5 Water 25.1 27.5 24.5 DO 6.0 6.0 3.0 pH 7.5 7.1 7.4 Cond 52 65 74 5/31 Air 20.4 21.1 20.4 Water 25.9 26.9 22.7 DO 7.2 6.6 3.8 pH 7.7 7.8 7.8 Cond 51 65 62 6/3 Air 24.1 26.4 24.9 Water 28.2 30.5 25.6 DO 6.3 7.0 8.0 pH 7.3 7.5 7.3 Cond 58 67 6.6 6/5 Air 22.6 22.6 22.9 Water 26.9 29.0 28.3 DO 6.2 3.94 2.1 pH 7.6 7.6 7.6 Cond 58 72 70 6/10 Air 20.9 21.4 20.8 Water 25.5 27.8 24.0 DO NA NA NA pH 7.4 7.6 7.2 Cond 52 70 88 6/17 Air 19.8 22.7 20.6 Water 25.3 26.5 22.6 DO 7.8 8.6 4.2 pH 7.4 7.5 7.4 Cond 55 68 7.8 7/8 Air 23.3 24.9 25.3 Water 27.7 28.3 25.6 Do 6.8 6.2 3.0 pH 7.4 6.9 7.1 Cond 54 72 82 7/11 Air 22.7 22.8 22.9 Water 26.7 26.7 24.0 DO 7.6 7.7 4.4 pH 7.1 7.3 6.9 Cond 52 71 75 * Site 2 is an additional site not identified in the Beaver Creek TMDL Implementation Plan
7* Site 3 is identified as site 2 in the Beaver Creek TMDL Implementation Plan

8
Date Site 1 Site 2* Site 3* 7/23 Air 23.0 24.6 26.2 Water 27.8 28.5 26.0 DO 7.0 7.0 4.2 pH 7.2 7.4 7.1 Cond 55 75 106 7/29 Air 22.7 24.8 23.5 Water 25.9 29.2 26.3 DO 5.8 7.3 3.2 pH 7.8 7.9 7.6 Cond 61 75 118 8/2 Air 24.0 22.9 23.0 Water 27.3 28.0 26.2 DO 8.4 7.0 1.9 pH 8.1 7.8 8.0 Cond 51 74 125 8/6 Air 23.8 25.4 23.6 Water 27.9 9.4 28.0 DO 8.1 7.7 5.6 pH 8.0 7.6 7.8 Cond 55 75 105 8/16 Air 23.4 23.9 23.8 Water 26.2 7.7 25.7 DO 5.8 6.7 2.8 pH 8.0 8.0 7.8 Cond 56 79 102 8/22 Air 32.2 35.2 32.0 Water 28.5 30.9 28.3 DO 7.6 7.6 4.8 pH 8.0 8.0 7.8 Cond 58 82 118 * Site 2 is an additional site not identified in the Beaver Creek TMDL Implementation Plan * Site 3 is identified as site 2 in the Beaver Creek TMDL Implementation Plan

![Z V VÅáZ ID - Ahmadiyya · 2004. 8. 2. · (1) Y2004 Bâ #20@*Yâ2004 B #14 (1 Z)DÚZ¯ DTL EVØnñ]†‰]ô oße —] ÷ç» Ûöv»Ú$ ^Ú÷ ^ÏøÚø Ôø e% ø Ôø %øÃø](https://img.pdfslide.net/doc/110x75/60a57c461027540cac1791f2/z-v-vz-id-ahmadiyya-2004-8-2-1-y2004-b-20y2004-b-14-1-zdz.jpg)