Embed Size (px)
Citation preview
Total Non-Methane OrganicCarbon
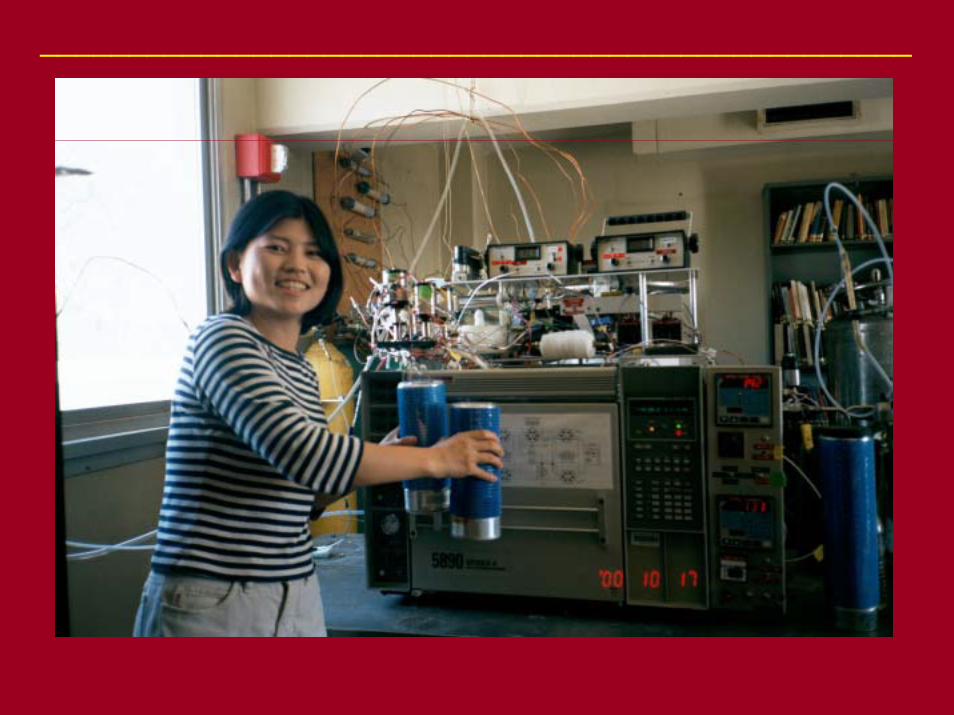
Christophe Maris, Myeong Chung,Udo Krischke, Richard Meller
and Suzanne PaulsonDepartment of Atmospheric Sciences
University of California at Los Angeles
Total Non-Methane OrganicCarbon
Funding Provided by • California AirResources Board • UC Campus-Laboratory
Collaboration • California Space Institute
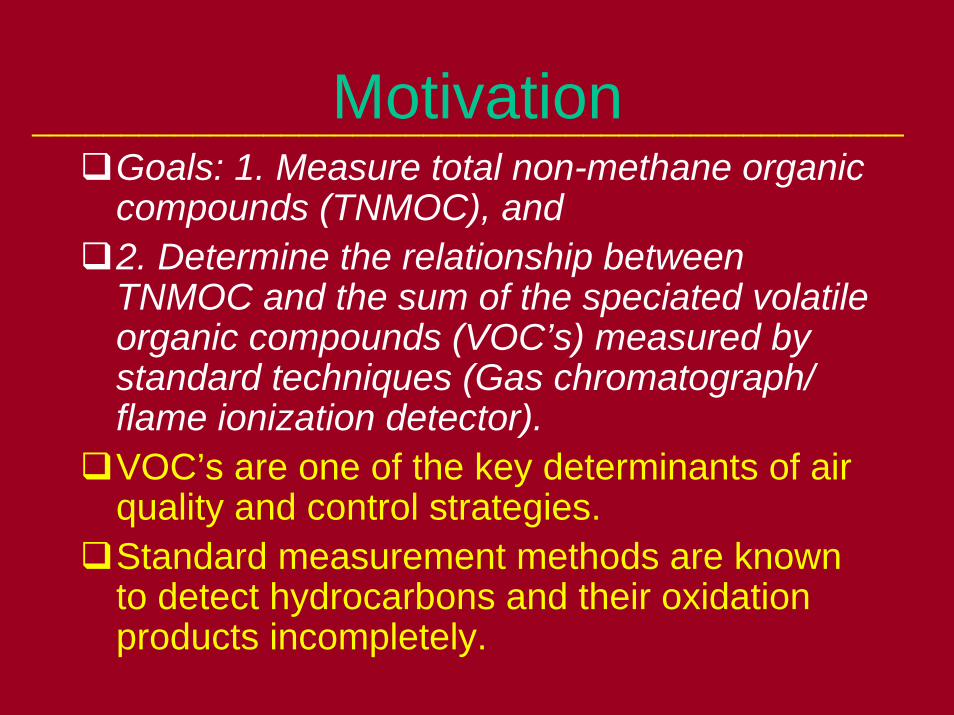
Motivation!Goals: 1. Measure total non-methane organic
compounds (TNMOC), and!2. Determine the relationship between
TNMOC and the sum of the speciated volatileorganic compounds (VOC’s) measured bystandard techniques (Gas chromatograph/flame ionization detector).
!VOC’s are one of the key determinants of airquality and control strategies.
!Standard measurement methods are knownto detect hydrocarbons and their oxidationproducts incompletely.
_________________________________________________
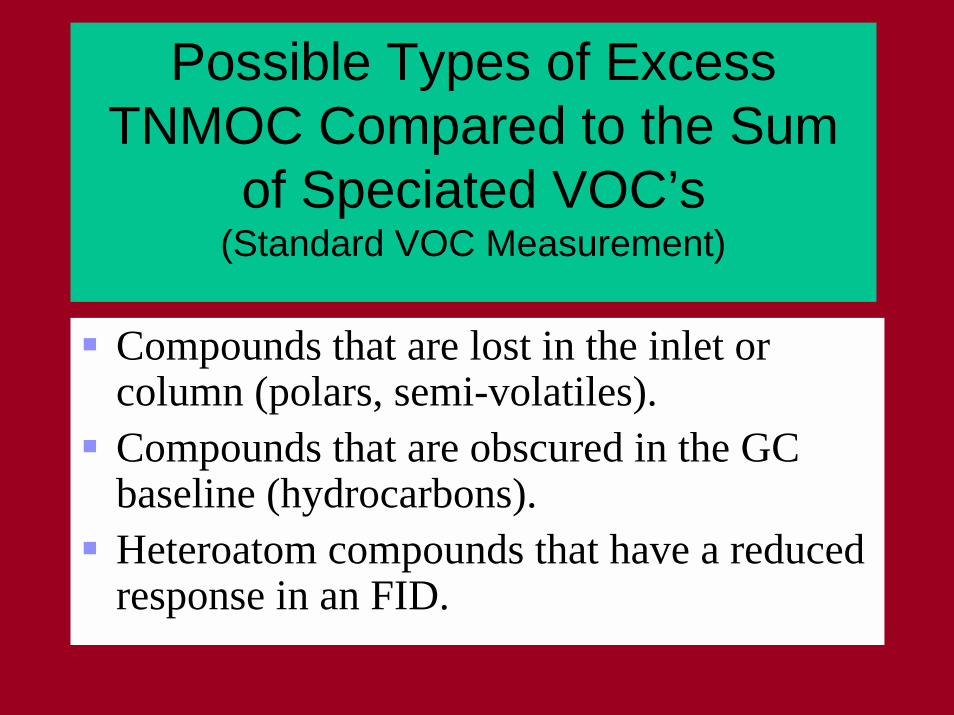
Possible Types of ExcessTNMOC Compared to the Sum
of Speciated VOC’s(Standard VOC Measurement)
" Compounds that are lost in the inlet orcolumn (polars, semi-volatiles).
" Compounds that are obscured in the GCbaseline (hydrocarbons).
" Heteroatom compounds that have a reducedresponse in an FID.
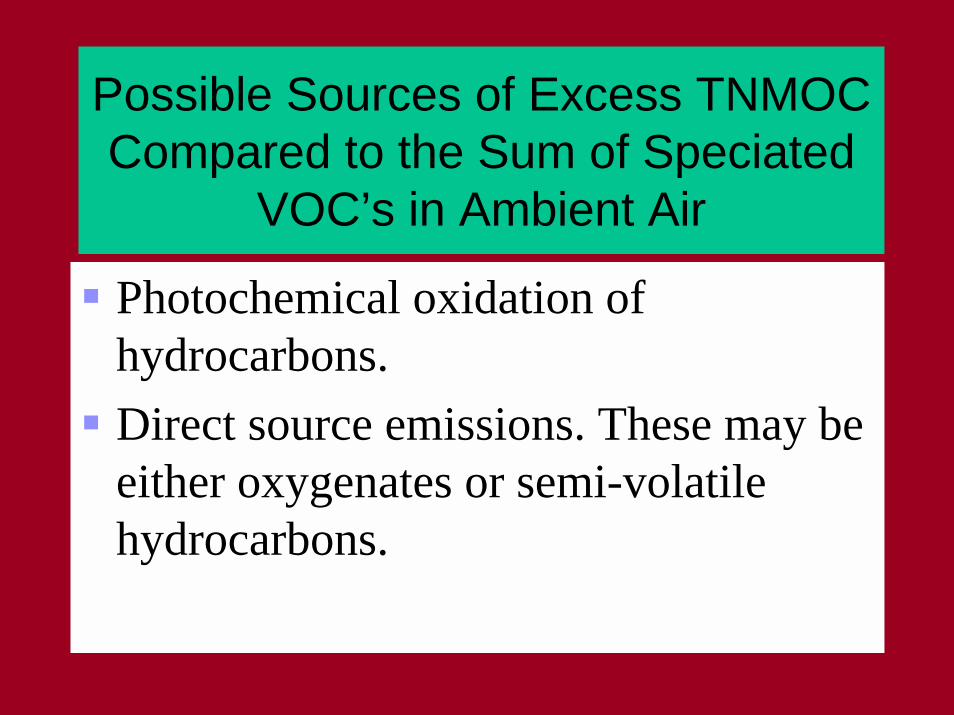
Possible Sources of Excess TNMOCCompared to the Sum of Speciated
VOC’s in Ambient Air
" Photochemical oxidation ofhydrocarbons.
" Direct source emissions. These may beeither oxygenates or semi-volatilehydrocarbons.
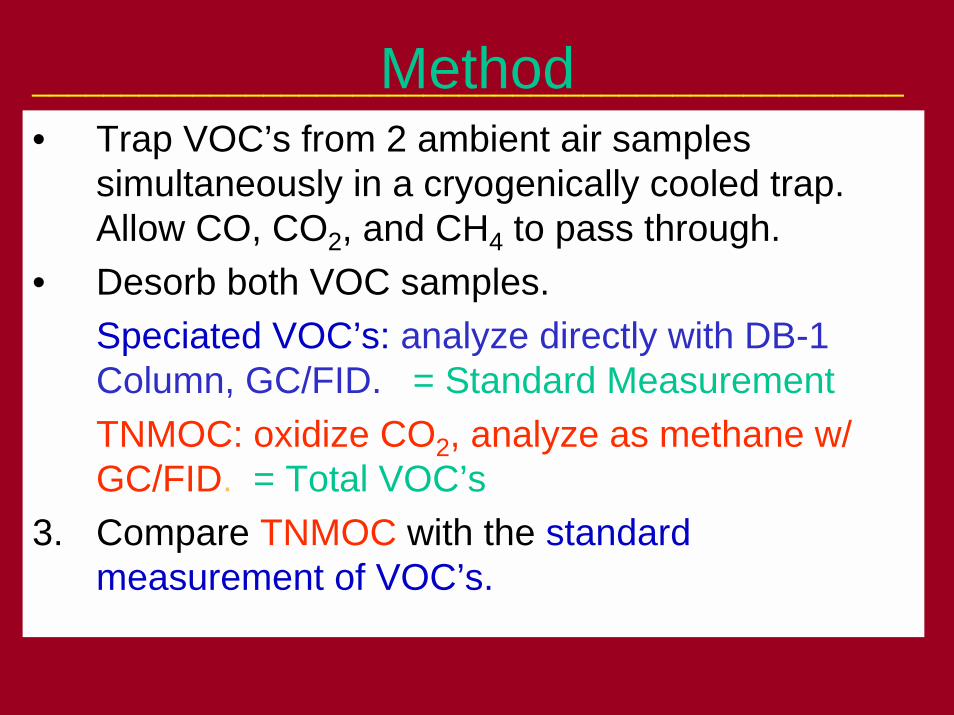
Method• Trap VOC’s from 2 ambient air samples
simultaneously in a cryogenically cooled trap.Allow CO, CO2, and CH4 to pass through.
• Desorb both VOC samples.Speciated VOC’s: analyze directly with DB-1Column, GC/FID. = Standard MeasurementTNMOC: oxidize CO2, analyze as methane w/GC/FID. = Total VOC’s
3. Compare TNMOC with the standardmeasurement of VOC’s.
_________________________________________________
_________________________________________________
FCFC
FC
4
Trap 1
2 1
6
5 6 5
1
2 3
4
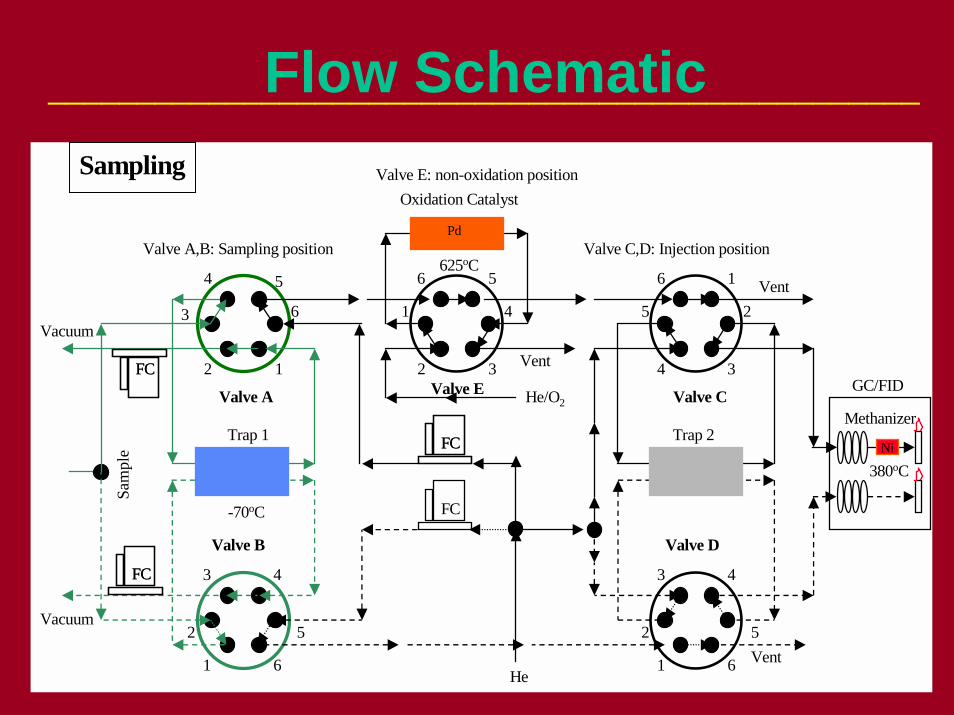
Oxidation Catalyst
Vent
Sam
ple
6
5
4 3
2
1 Vent
Trap 2Ni
GC/FID
Methanizer
1
2
3 4
5
6 1
2
3 4
5
6 Vent
FCFC
FCFC
He/O2
He
Vacuum
Vacuum
-70oC
625oC
380oC
Pd
Sampling
3
Valve A
Valve B
Valve C
Valve D
Valve E
Valve A,B: Sampling position Valve C,D: Injection position
Valve E: non-oxidation position
Flow Schematic_________________________________________________

Trap I Design
Screws
Grooves for thermocouples
D.: 1mm
Groove s for tra p tubingD.: 6.2mm
Liquid nitrogen
30 mm
30 mm
100 mm
20 mm 60 mm
Liquid nitrogen vent
Liquid nitrogen vent
Qua rtz wool plug
Fused silicaBeads
140 mm
O.D.: 6 mmI.D.: 5.3 mm
_________________________________________________
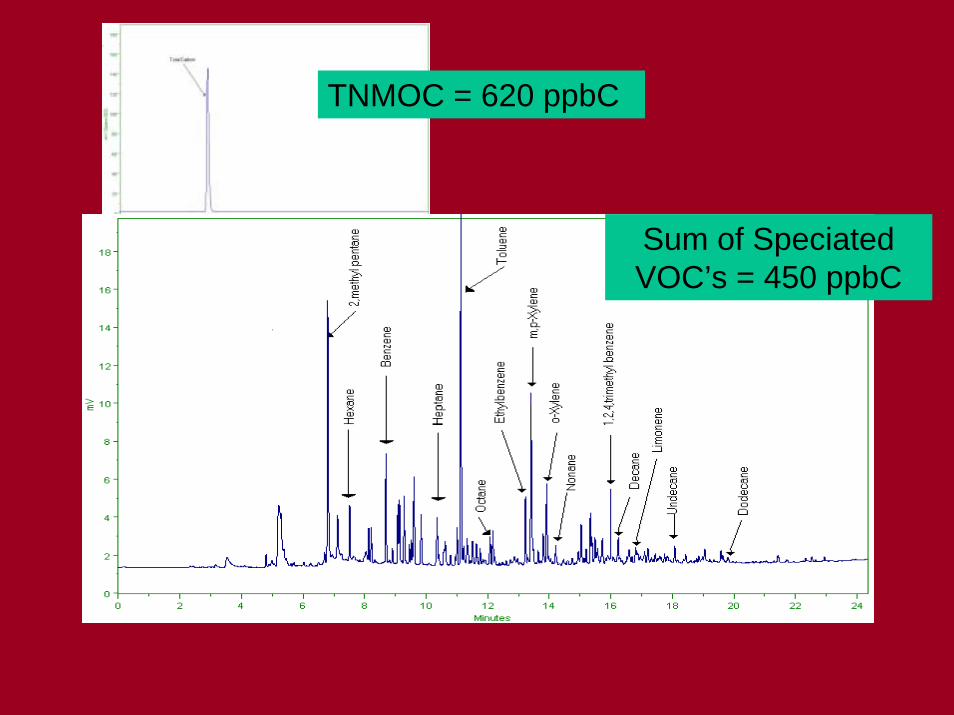
Sum of SpeciatedVOC’s = 450 ppbC
TNMOC = 620 ppbC
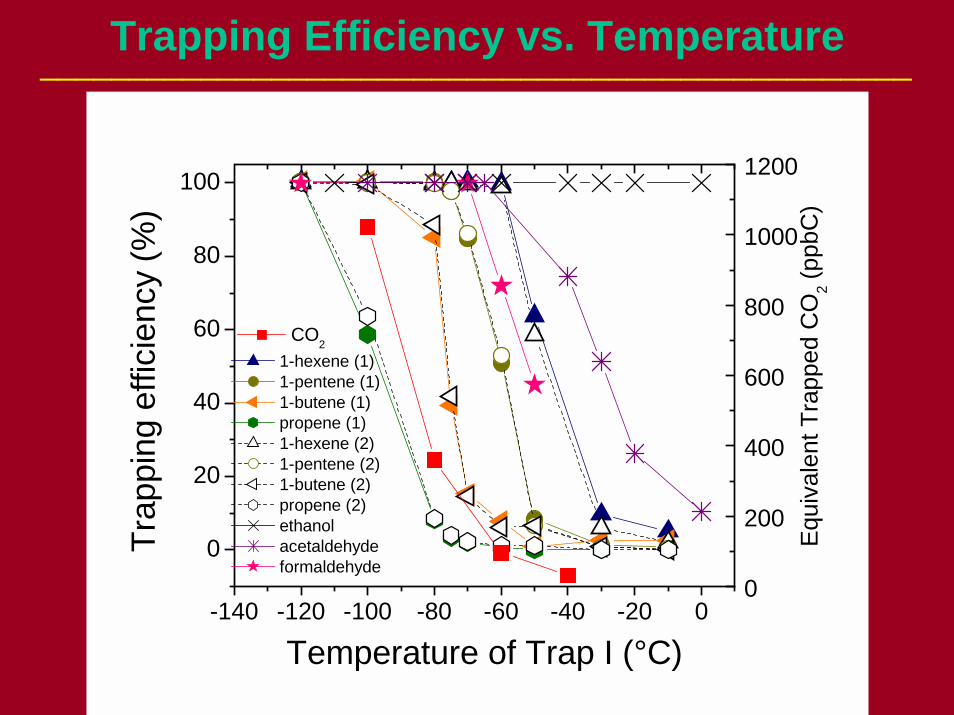
Trapping Efficiency vs. Temperature_________________________________________________
-140 -120 -100 -80 -60 -40 -20 0
0
20
40
60
80
100
Tr
appi
ng e
ffici
ency
(%)
Temperature of Trap I (°C)
1-hexene (1) 1-pentene (1) 1-butene (1) propene (1) 1-hexene (2) 1-pentene (2) 1-butene (2) propene (2) ethanol acetaldehyde formaldehyde
0
200
400
600
800
1000
1200
Equ
ival
ent T
rapp
ed C
O2 (
ppbC
)
CO2
_________________________________________________Correction for Light Hydrocarbons
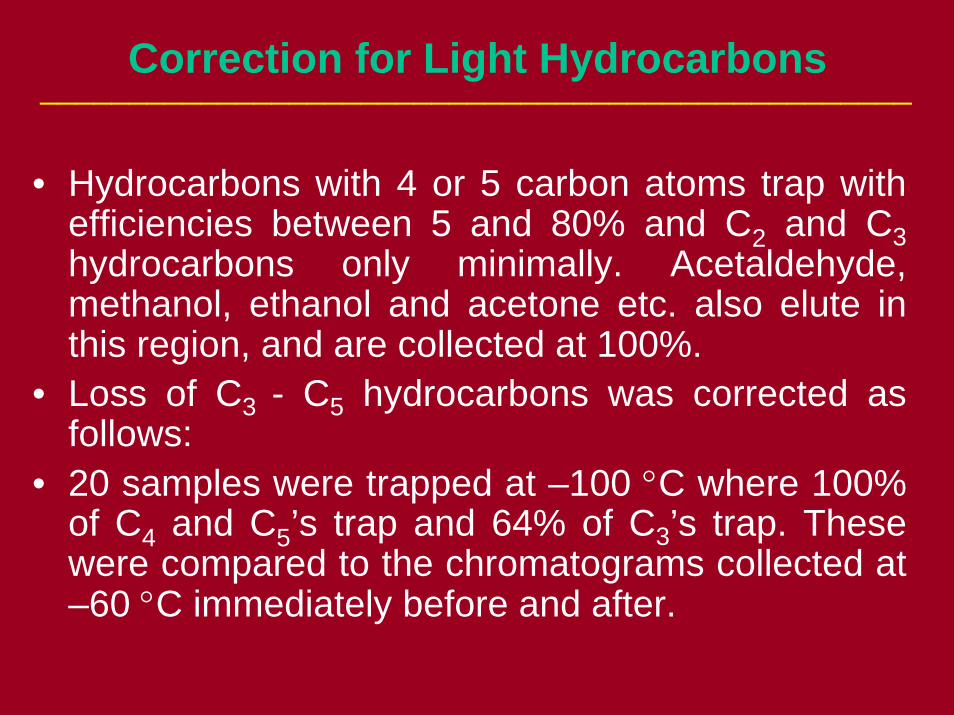
• Hydrocarbons with 4 or 5 carbon atoms trap withefficiencies between 5 and 80% and C2 and C3hydrocarbons only minimally. Acetaldehyde,methanol, ethanol and acetone etc. also elute inthis region, and are collected at 100%.
• Loss of C3 - C5 hydrocarbons was corrected asfollows:
• 20 samples were trapped at –100 °C where 100%of C4 and C5’s trap and 64% of C3’s trap. Thesewere compared to the chromatograms collected at–60 °C immediately before and after.
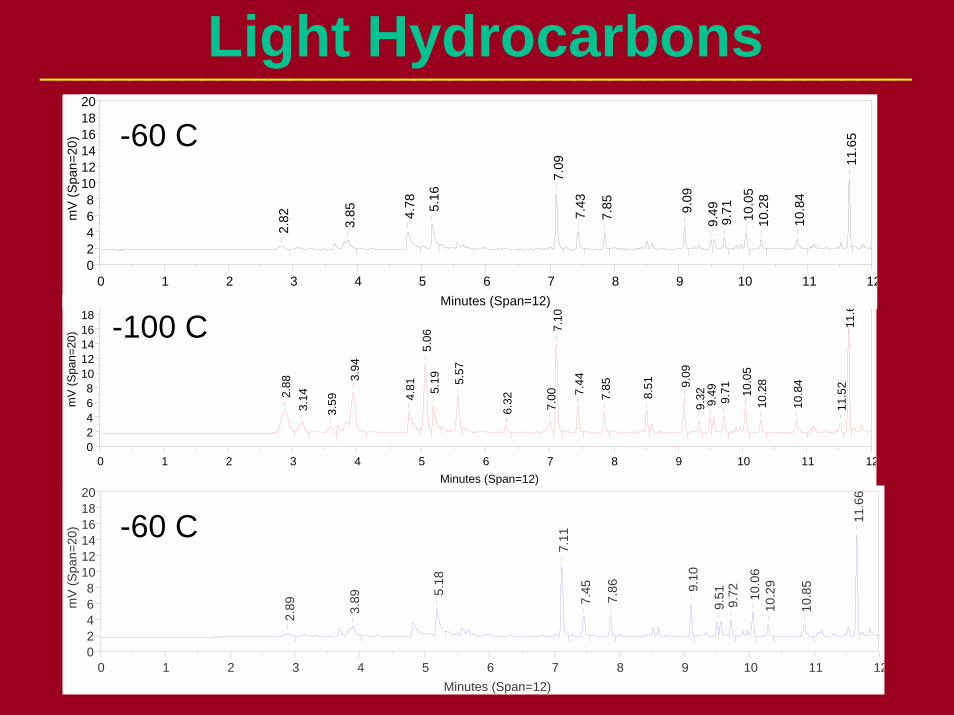
Light Hydrocarbons
02468
101214161820
mV
(Spa
n=20
)
0 1 2 3 4 5 6 7 8 9 10 11 12Minutes (Span=12)
2.89 3.
89 5.18
7.11
7.45
7.86 9.
10
9.51 9.72 10
.06
10.2
9
10.8
5
11.6
6
02468
101214161820
mV
(Spa
n=20
)
0 1 2 3 4 5 6 7 8 9 10 11 12Minutes (Span=12)
2.88
3.14
3.59
3.94
4.81
5.06
5.19 5.
57
6.32 7.00
7.10
7.44
7.85
8.51 9.
099.
32 9.49 9.71 10
.05
10.2
8
10.8
4
11.5
211
.65
02468
101214161820
mV
(Spa
n=20
)
0 1 2 3 4 5 6 7 8 9 10 11 12Minutes (Span=12)
2.82 3.85 4.
78 5.16
7.09
7.43
7.85 9.09
9.49
9.71 10
.05
10.2
8
10.8
4
11.6
5-60 C
-100 C
-60 C
_________________________________________________
_________________________________________________Correction for Light Hydrocarbons
• C3 concentrations were corrected using theirtrapping efficiencies.
• Peaks eluting between C3 and C5 were normalizedto the sum of spec. VOC’s at –100 °C.
• The result was compared to the –60 °C chrom-atograms, also normalized.
• The difference, equal to the lost C3-C5hydrocarbons at –60 °C, averaged 12.5% of thesum of speciated VOC’s at –60 °C.
• 6.5% was added to account for untrapped C2’s,based on SCOS-97 Azusa data (McCauley, 1999).
_________________________________________________Correction for Light Hydrocarbons
• Because the lost light hydrocarbons are added toboth the TNMOC and the Sum of Speciated VOC's,they have a minor effect on the ratio of the two:
• This correction shifts the average TNMOC/sum ofspeciated VOC’s ratio from 1.37, 1.77 and 1.1 to1.30, 1.65 and 1.1 for UCLA 2000 summer clear,cloudy, and winter.
• A similar peak-by-peak correction for the Azusadata shifted the that average ratio from 1.29 to1.25.
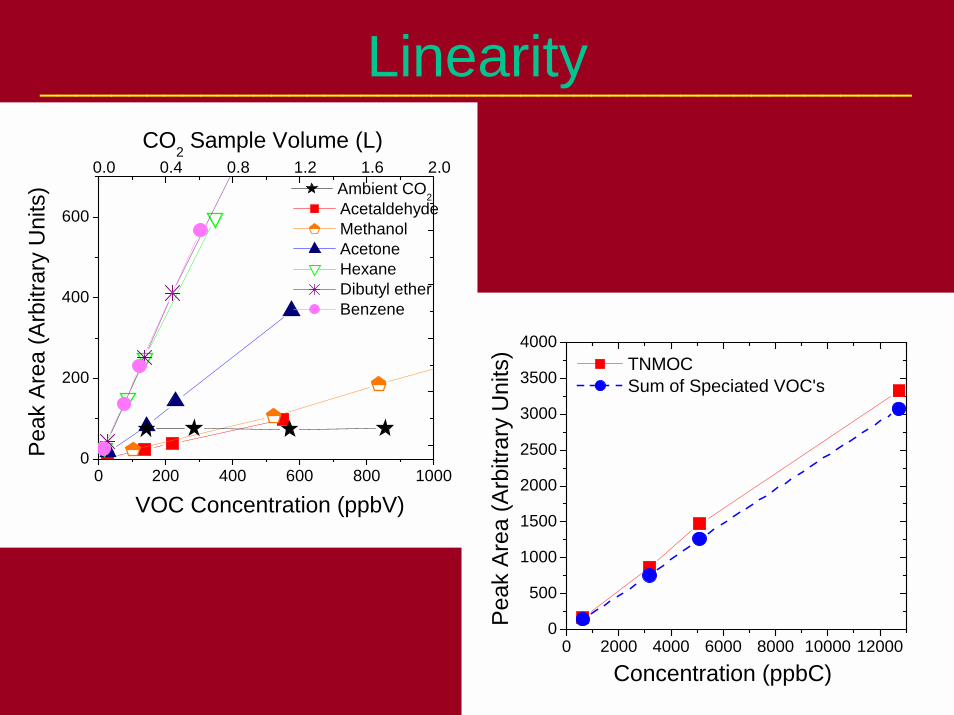
Linearity
0 2000 4000 6000 8000 10000 120000
500
1000
1500
2000
2500
3000
3500
4000
TNMOC Sum of Speciated VOC's
Concentration (ppbC)
Peak
Are
a (A
rbitr
ary
Uni
ts)
_________________________________________________
0 200 400 600 800 10000
200
400
600
VOC Concentration (ppbV)
Peak
Are
a (A
rbitr
ary
Uni
ts)
Acetaldehyde Methanol Acetone Hexane Dibutyl ether Benzene
0.0 0.4 0.8 1.2 1.6 2.0CO2 Sample Volume (L)
Ambient CO2
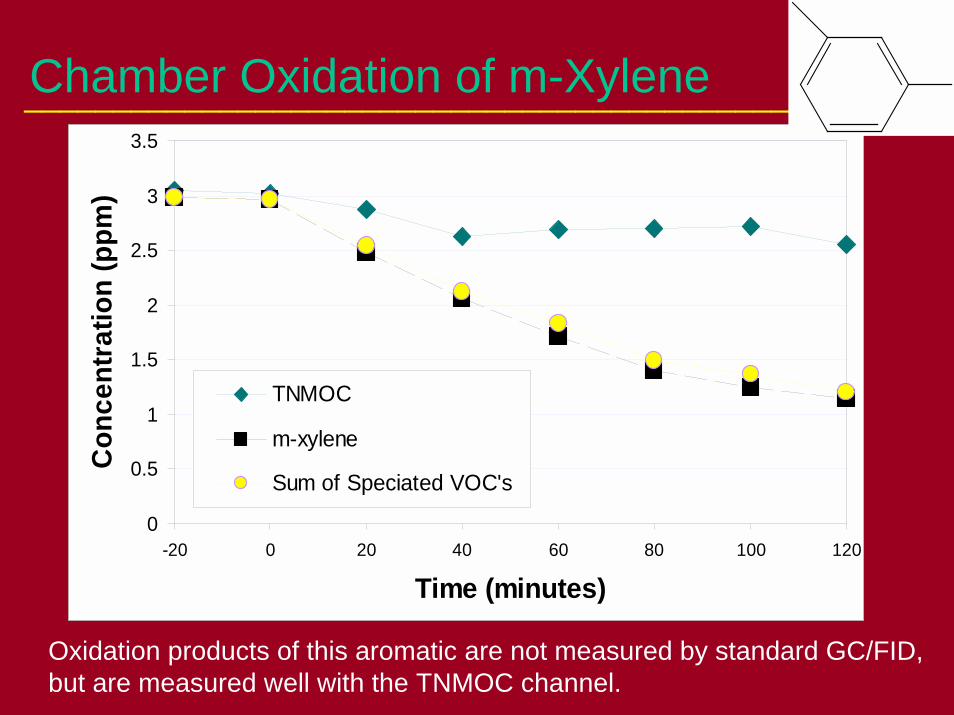
Chamber Oxidation of m-Xylene
0
0.5
1
1.5
2
2.5
3
3.5
-20 0 20 40 60 80 100 120
Time (minutes)
Con
cent
ratio
n (p
pm)
TNMOC
m-xylene
Sum of Speciated VOC's
_________________________________________________
Oxidation products of this aromatic are not measured by standard GC/FID,but are measured well with the TNMOC channel.
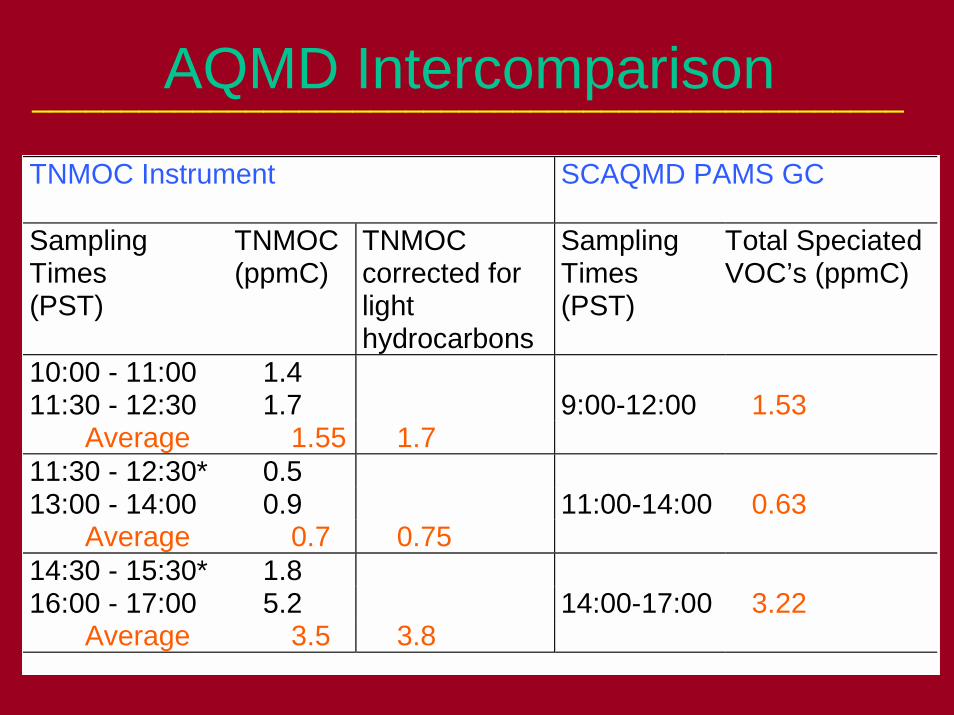
AQMD IntercomparisonTNMOC Instrument
SCAQMD PAMS GC
Sampling Times (PST)
TNMOC (ppmC)
TNMOC corrected for light hydrocarbons
Sampling Times (PST)
Total Speciated VOC’s (ppmC)
10:00 - 11:00 1.4 11:30 - 12:30 1.7 9:00-12:00 1.53 Average 1.55 1.7 11:30 - 12:30* 0.5 13:00 - 14:00 0.9 11:00-14:00 0.63 Average 0.7 0.75 14:30 - 15:30* 1.8 16:00 - 17:00 5.2 14:00-17:00 3.22 Average 3.5 3.8
_________________________________________________

Trapped Ambient CO2_________________________________________________
Period Sample Volume (mL)
n [CO2]* Average± SD (ppbC)
[CO2] min. (ppbC)
[CO2] max. (ppbC)
[TC] Average±SD (ppbC)
[TC] min. (ppbC)
[TC] max. (ppbC)
1140 15 49±14 36 86 Sunny 09/12/00- 10/09/00
570
5
129±8
121
142
329±178 91 835
1140 10 54±8 41 64 Cloudy 09/12/00- 10/09/00
570
8
115±13
84
126
205±120 68 620
1140 11 59±5 50 69 11/30/00- 12/20/00
570
2
126±16
115
137
269±172 35 889

Detection Limits and Uncertainties_________________________________________________
Data Type Detection Limit
Uncertainty
TNMOC channel
35 ppbC ±10 –20 ppbC; ± 8% at concentrations over 200 ppbC, increasing below
Sum of Speciated VOC’s Channel
1 ppbC + 3-5% - 10-30%
Individual VOC’s 10 pptC ± 3-20%, depending on
separation
TNMOC/Sum of Speciated VOC’s Ratio
__ ± 0.05 to ± 0.10 for ratios between 1 and 2, depending on concentration, - 0.1, + 0.5 for ratios above 2

Field Measurements
• Sources• Ambient air
– Azusa– Burbank– UCLA
• Winter• Summer
_________________________________________________
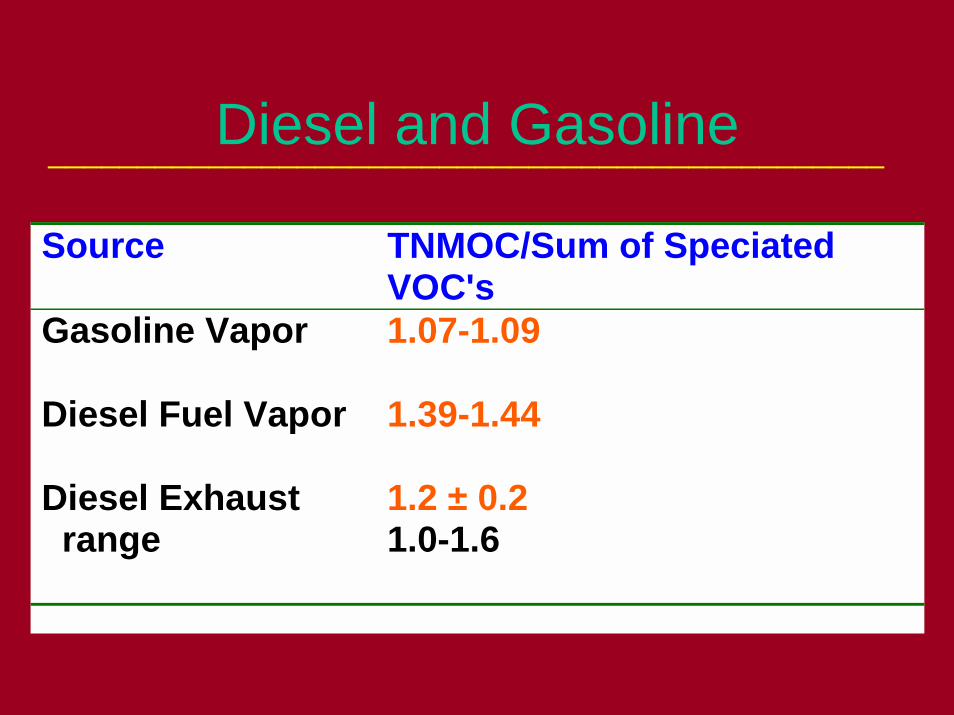
Diesel and Gasoline_______________________________________________
Source TNMOC/Sum of Speciated VOC's
Gasoline Vapor 1.07-1.09
Diesel Fuel Vapor 1.39-1.44
Diesel Exhaust range
1.2 ± 0.2 1.0-1.6

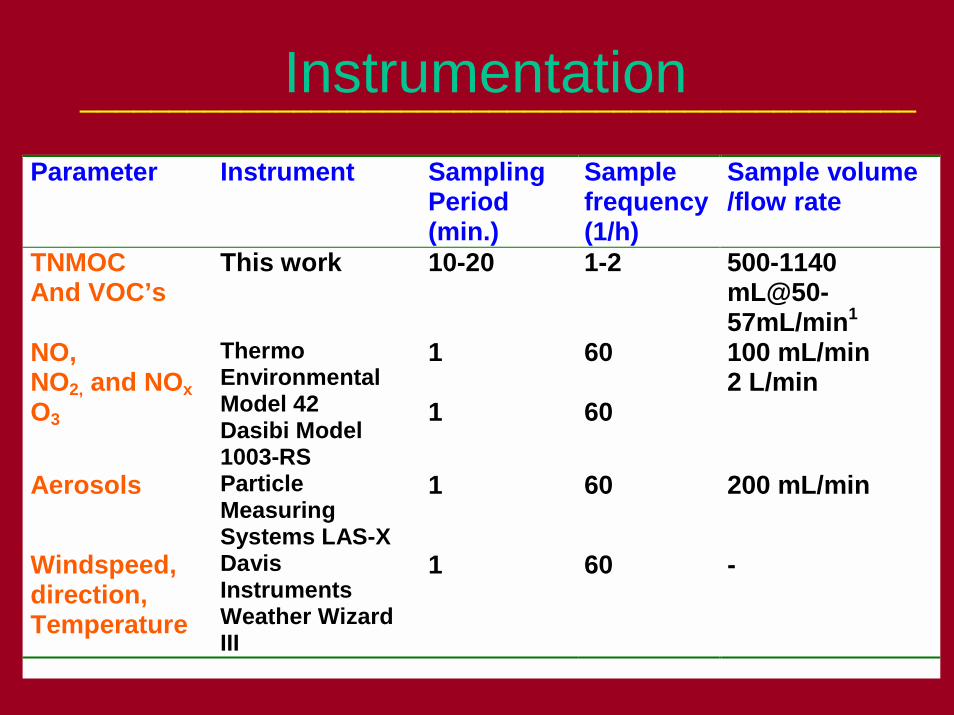
Instrumentation_______________________________________________
Parameter Instrument Sampling Period (min.)
Sample frequency(1/h)
Sample volume /flow rate
TNMOC And VOC’s
This work 10-20 1-2 500-1140 mL@50- 57mL/min1
NO, NO2, and NOx O3
Thermo Environmental Model 42 Dasibi Model 1003-RS
1 1
60 60
100 mL/min 2 L/min
Aerosols Particle Measuring Systems LAS-X
1 60 200 mL/min
Windspeed, direction, Temperature
Davis Instruments Weather Wizard III
1
60 -
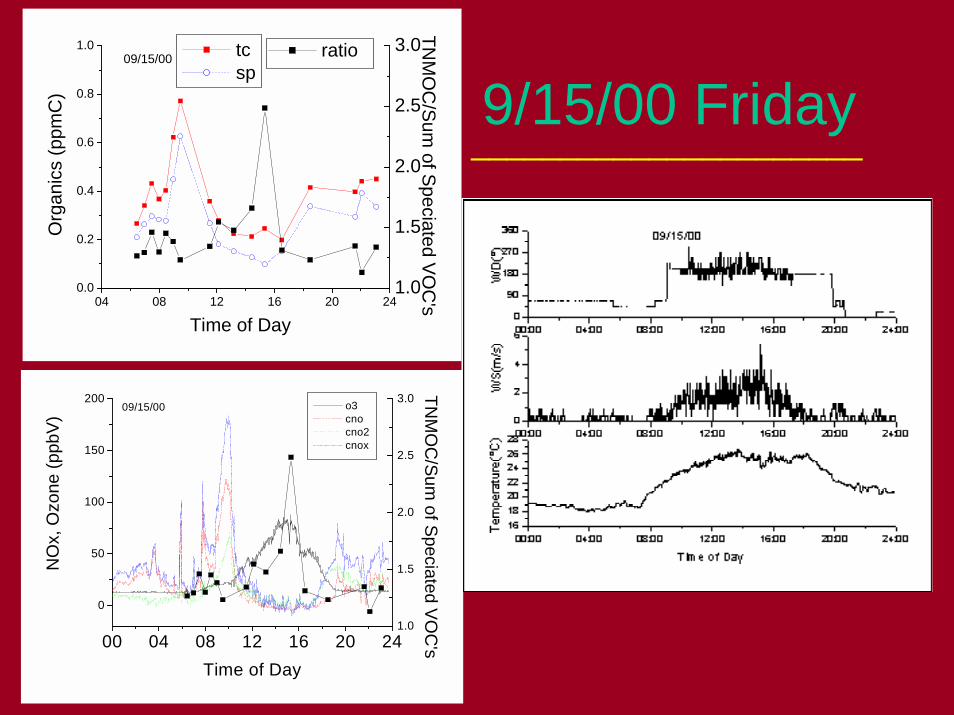
9/15/00 Friday
04 08 12 16 20 240.0
0.2
0.4
0.6
0.8
1.009/15/00
TNM
OC
/Sum of Speciated VO
C's
Org
anic
s (p
pmC
)
Time of Day
tc sp
1.0
1.5
2.0
2.5
3.0 ratio
00 04 08 12 16 20 24
0
50
100
150
20009/15/00
NO
x, O
zone
(ppb
V)
Time of Day
o3 cno cno2 cnox
1.0
1.5
2.0
2.5
3.0
TNM
OC
/Sum of Speciated VO
C's
______________________
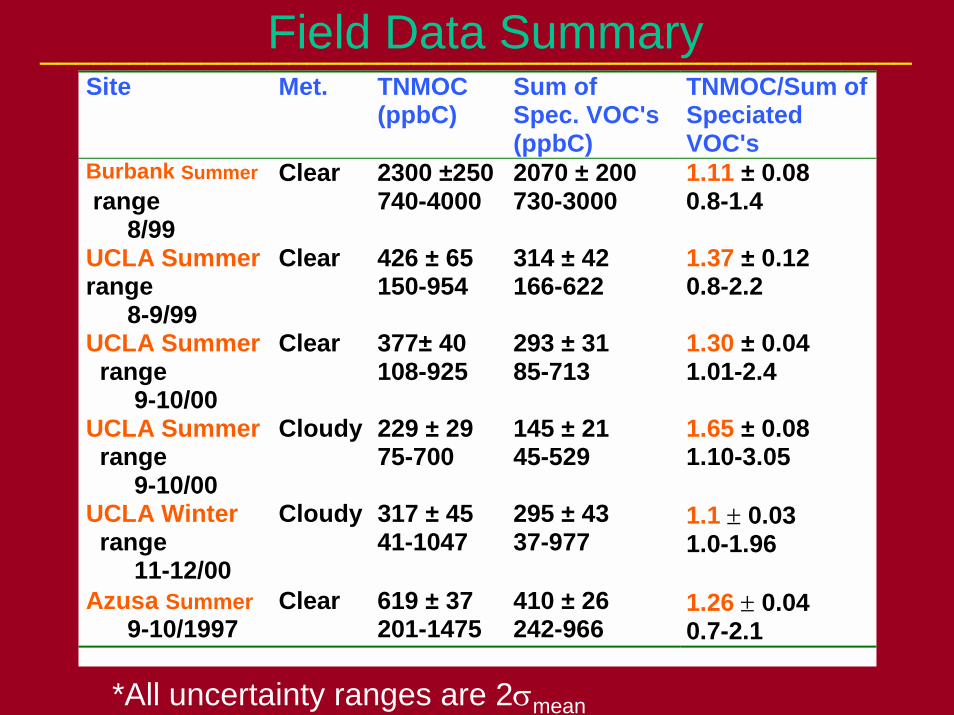
Field Data Summary_________________________________________________Site Met. TNMOC
(ppbC) Sum of Spec. VOC's (ppbC)
TNMOC/Sum of Speciated VOC's
Burbank Summer Clear 2300 ±250 2070 ± 200 1.11 ± 0.08 range 8/99
740-4000 730-3000 0.8-1.4
UCLA Summer range 8-9/99
Clear 426 ± 65 150-954
314 ± 42 166-622
1.37 ± 0.12 0.8-2.2
UCLA Summer range 9-10/00
Clear 377± 40 108-925
293 ± 31 85-713
1.30 ± 0.04 1.01-2.4
UCLA Summer range 9-10/00
Cloudy 229 ± 29 75-700
145 ± 21 45-529
1.65 ± 0.08 1.10-3.05
UCLA Winter range 11-12/00
Cloudy 317 ± 45 41-1047
295 ± 43 37-977
1.1 ± 0.03 1.0-1.96
Azusa Summer 9-10/1997
Clear 619 ± 37 201-1475
410 ± 26 242-966
1.26 ± 0.04 0.7-2.1
*All uncertainty ranges are 2σmean

Literature “TNMOC”• Other measurements indicate there is a significant additional pool of
VOC’s.• Roberts et al. (1998) measured TNMOC/sum of speciated VOC’s
ratios of 1.16 –1.36 in rural Nova Scotia using a related approach, inreasonable agreement with our results.
• Alastair et al. (2000) used 2-D GC to find hundreds of additionalorganics in the chromatogram baseline, with a T/S ratio of ~1.67 inMelbourne, Australia.
• Because their measurement used a GC column, it may have missedmany compounds that we measure in our TNMOC channel.
• The cause for this discrepancy may be the selection of the speciatedbaseline.
• We set our baseline conservatively (low) to avoid overestimating theT/S ratio. With auto integrations, we get higher T/S ratios.
• Comparing TNMOC measurements to conventional GC data is tricky.
_________________________________________________
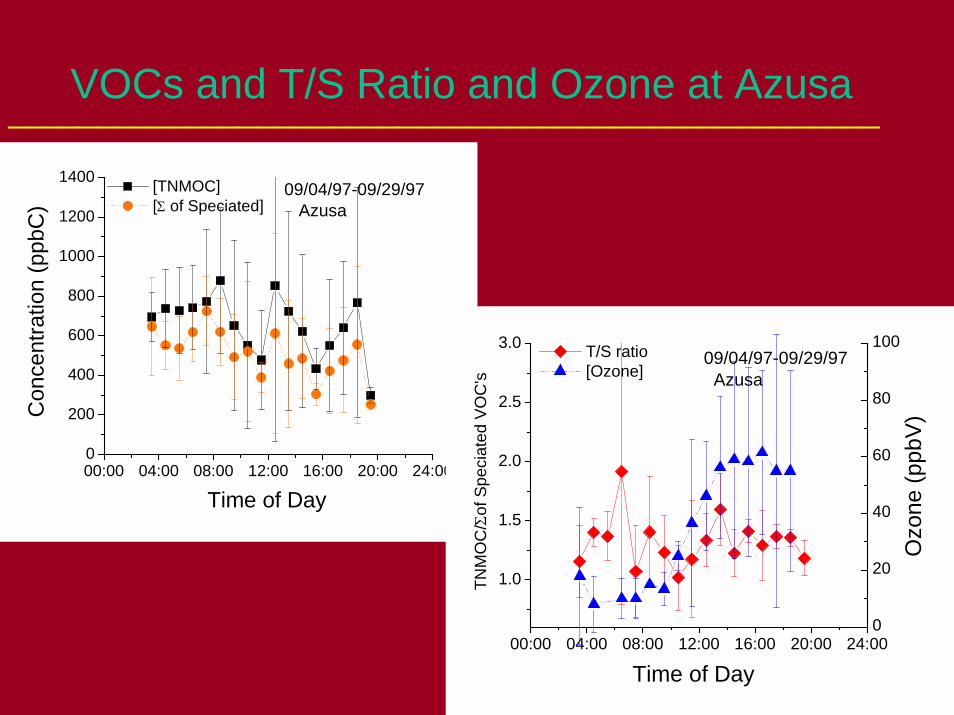
VOCs and T/S Ratio and Ozone at Azusa
00:00 04:00 08:00 12:00 16:00 20:00 24:000
200
400
600
800
1000
1200
140009/04/97-09/29/97 Azusa
Con
cent
ratio
n (p
pbC
)
[TNMOC] [Σ of Speciated]
Time of Day
_________________________________________________
00:00 04:00 08:00 12:00 16:00 20:00 24:00
1.0
1.5
2.0
2.5
3.0 T/S ratio
TNM
OC
/Σof
Spe
ciat
ed V
OC
's
Time of Day
0
20
40
60
80
100
[Ozone]09/04/97-09/29/97 Azusa
Ozo
ne (p
pbV)

VOCs and TNMOC/Sum ofSpeciated VOC’s at Burbank
_________________________________________________
04:00 08:00 12:00 16:00 20:00
BurbankAverage of [TC](ppmC) = 2.27 +/- 0.65Average of [ ΣSP](ppmC) = 2.06 +/- 0.51
TNMOC
Time(hour)
0
1
2
3
4
5
0
1
2
3
4
5
Con
cent
ratio
ns(p
pmC
)
ΣSP
00:00 04:00 08:00 12:00 16:00 20:00 24:000.6
0.8
1.0
1.2
1.4
1.6 Burbank(09/15/99-10/12/99)
[TN
MO
C]/[Σo
f Spe
ciat
ed V
OC
's]
Time of Day
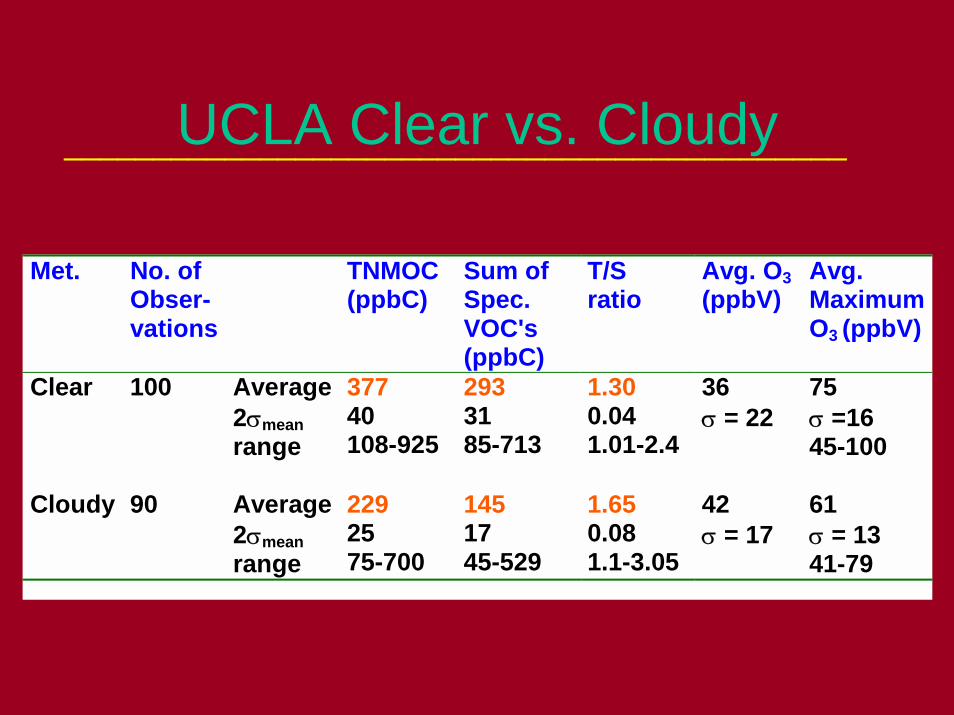
UCLA Clear vs. Cloudy
Met. No. of Obser-vations
TNMOC (ppbC)
Sum of Spec. VOC's (ppbC)
T/S ratio
Avg. O3 (ppbV)
Avg.MaximumO3 (ppbV)
Clear 100 Average2σmean range
377 40 108-925
293 31 85-713
1.30 0.04 1.01-2.4
36 σ = 22
75 σ =16 45-100
Cloudy 90 Average2σmean range
229 25 75-700
145 17 45-529
1.65 0.08 1.1-3.05
42 σ = 17
61 σ = 13 41-79
____________________________________________
00:00 04:00 08:00 12:00 16:00 20:00 24:000
45
90
135
180
225
270
315
360
Win
d D
irect
ion
(Deg
rees
)
Time of Day (PST)
00:00 04:00 08:00 12:00 16:00 20:00 24:000
45
90
135
180
225
270
315
360
Win
d D
irect
ion
Time (PST)
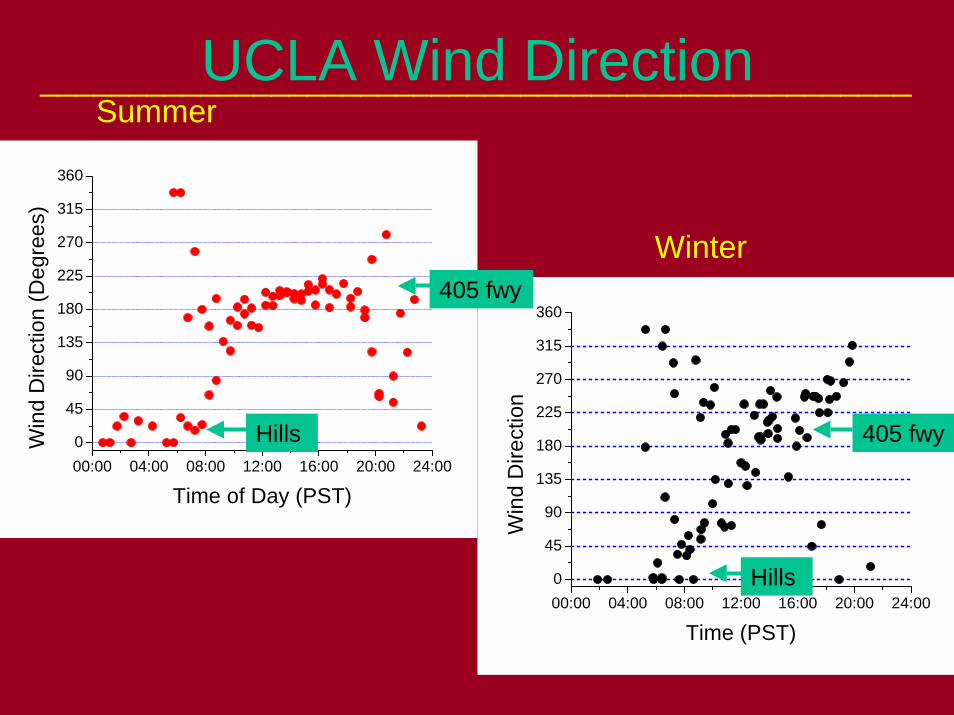
UCLA Wind DirectionSummer
Winter405 fwy
405 fwyHills
Hills
_________________________________________________
8 10 12 14 16 18 20 220
400
800
1200
1600
2000
128
801
1088 11541259
15161678
1885
1215
789946
10401183
13691508
Hei
ght (
m)
Temperature(°C)
0928
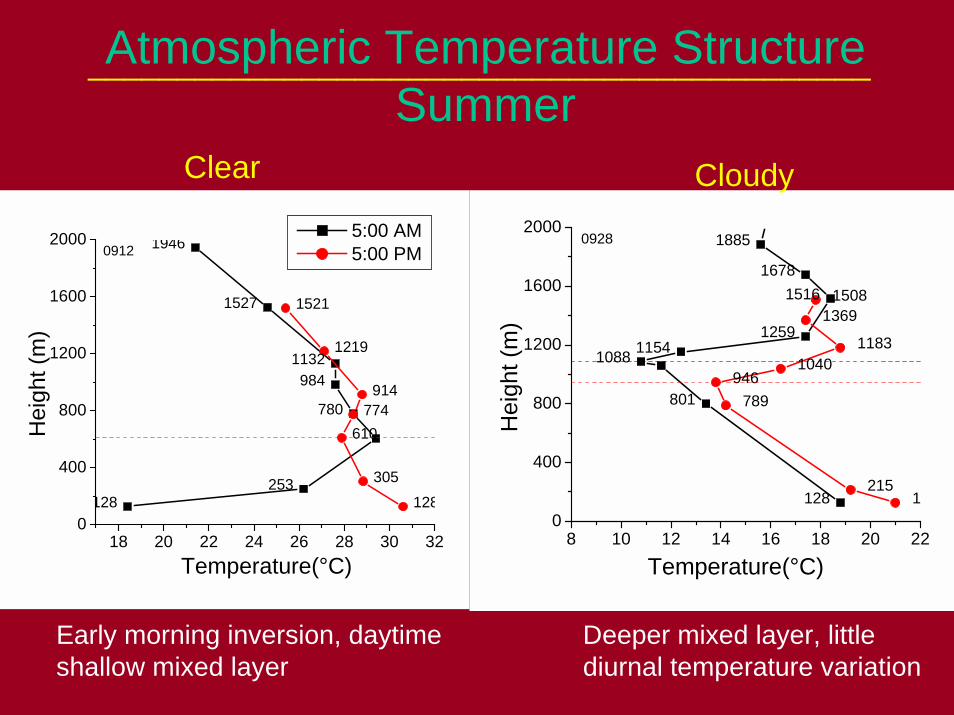
Atmospheric Temperature StructureSummer
____________________________________________
18 20 22 24 26 28 30 320
400
800
1200
1600
2000
128253
780
9841132
1527
1946
128305
610774
914
1219
1521
Hei
ght (
m)
Temperature(°C)
0912 5:00 AM 5:00 PM
Clear Cloudy
Early morning inversion, daytimeshallow mixed layer
Deeper mixed layer, littlediurnal temperature variation
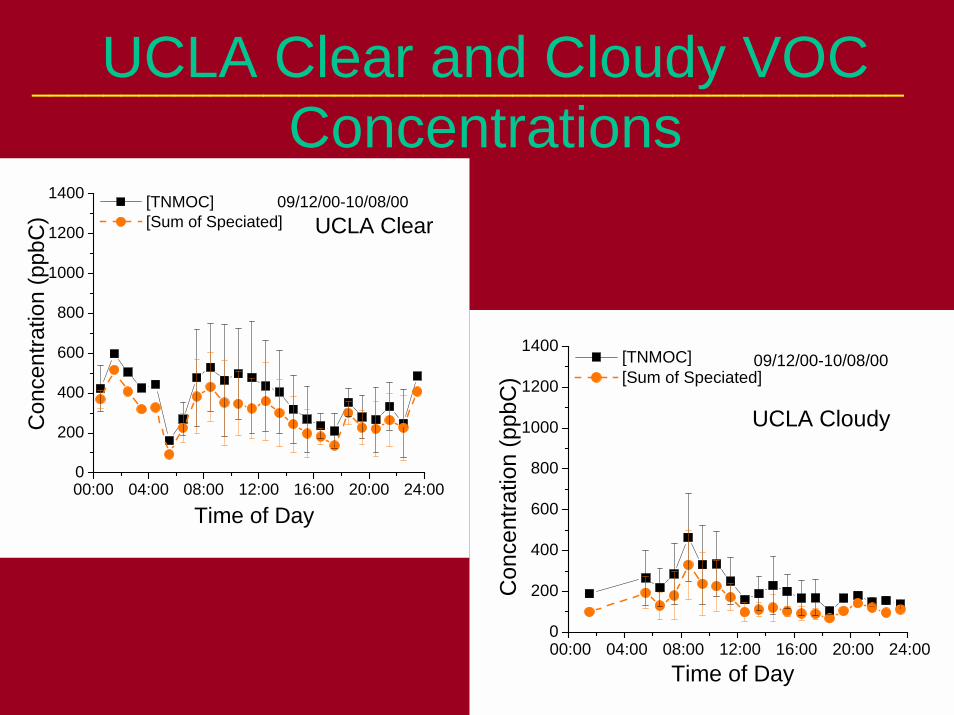
UCLA Clear and Cloudy VOCConcentrations
00:00 04:00 08:00 12:00 16:00 20:00 24:000
200
400
600
800
1000
1200
1400 [TNMOC] [Sum of Speciated]
Con
cent
ratio
n (p
pbC
)
Time of Day
UCLA Clear09/12/00-10/08/00
_________________________________________________
00:00 04:00 08:00 12:00 16:00 20:00 24:000
200
400
600
800
1000
1200
1400 [TNMOC] [Sum of Speciated]
Con
cent
ratio
n (p
pbC
)
UCLA Cloudy
09/12/00-10/08/00
Time of Day

TNMOC/Sum of SpeciatedVOC’s UCLA Clear and Cloudy
_________________________________________________
00:00 04:00 08:00 12:00 16:00 20:00 24:00
1.0
1.5
2.0
2.5
UCLA Clear09/12/00-10/08/00 T/S ratio
Time of Day
Ozo
ne (p
pbV)
TNM
OC
/Σof
Spe
ciat
ed V
OC
's
0
20
40
60
80
100
[Ozone]
00:00 04:00 08:00 12:00 16:00 20:00 24:00
1.0
1.5
2.0
2.5
UCLA Cloudy09/12/00-10/08/00
Ozo
ne (p
pbV)
Time of Day
T/S ratio
TNM
OC
/Σof
Spe
ciat
ed V
OC
's
0
20
40
60
80
100
[Ozone]
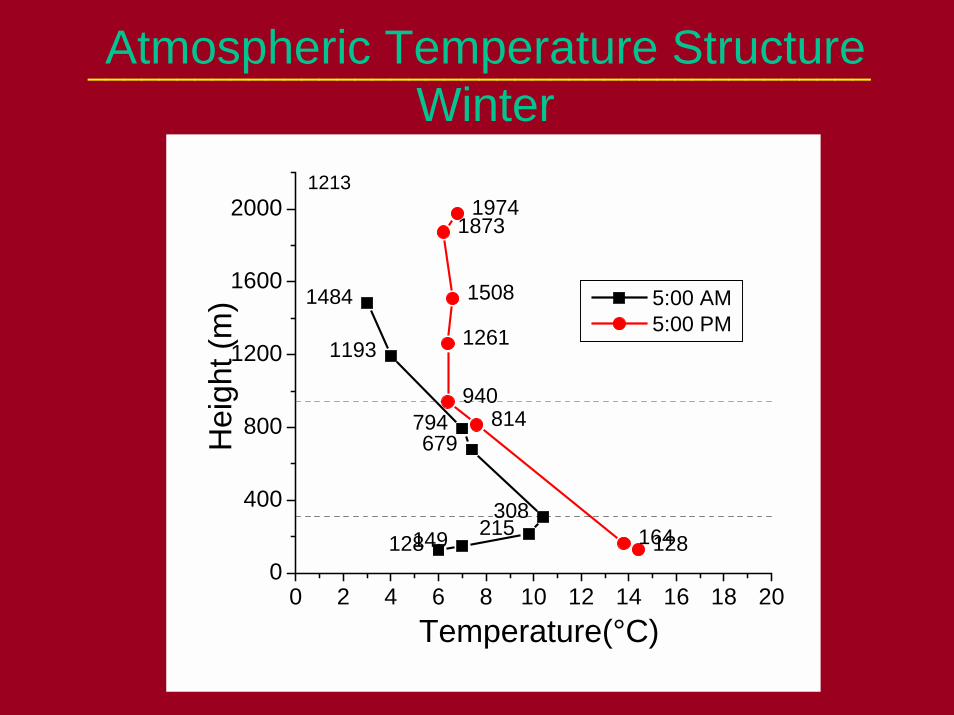
0 2 4 6 8 10 12 14 16 18 200
400
800
1200
1600
2000
128149 215308
679794
1193
1484
128164
814940
1261
1508
18731974
Hei
ght (
m)
Temperature(°C)
1213
5:00 AM 5:00 PM
Atmospheric Temperature StructureWinter
____________________________________________
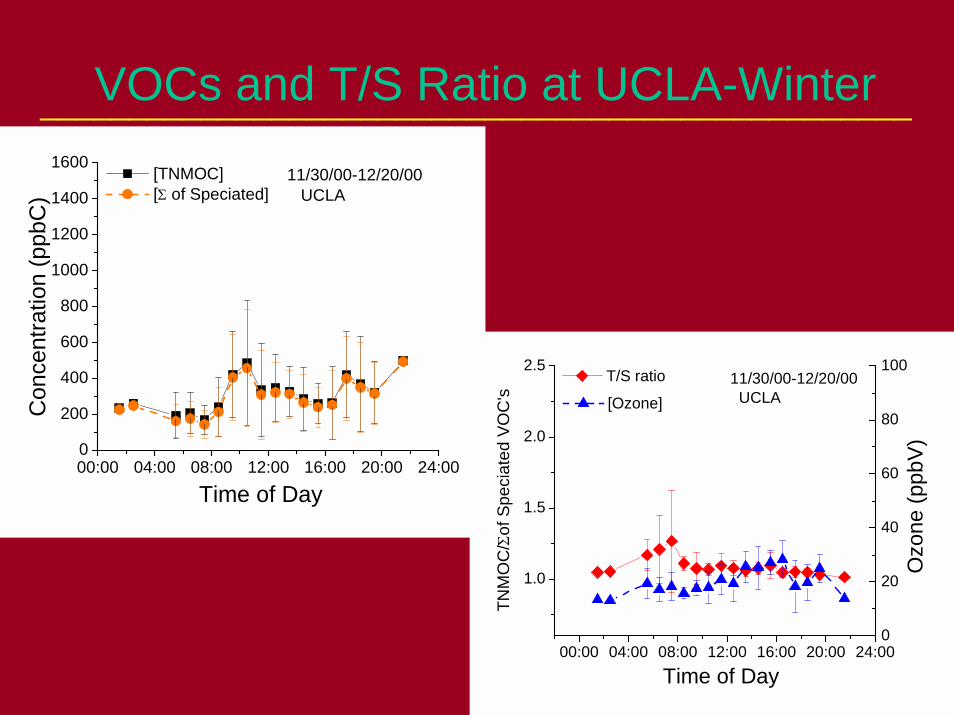
VOCs and T/S Ratio at UCLA-Winter_________________________________________________
00:00 04:00 08:00 12:00 16:00 20:00 24:00
1.0
1.5
2.0
2.5
Ozo
ne (p
pbV)
Time of Day
T/S ratio
TNM
OC
/Σof
Spe
ciat
ed V
OC
's
0
20
40
60
80
10011/30/00-12/20/00 UCLA [Ozone]
00:00 04:00 08:00 12:00 16:00 20:00 24:000
200
400
600
800
1000
1200
1400
1600
Con
cent
ratio
n (p
pbC
)
11/30/00-12/20/00 UCLA
[TNMOC] [Σ of Speciated]
Time of Day

Correlations
TNMOC/Sum of Speciated VOC’s is notcorrelated with:
• O3
• relative humidity• wind speed or direction• or for the most part time of day or day of
week (“weekend effect”).• Weakly correlated with VOC concentration
_________________________________________________

0 40 80 120 1601.0
1.5
2.0
2.5
TNM
OC
/Sum
of S
peci
ated
VO
C's
NO (ppb)
0 40 80 120 1601.0
1.5
2.0
2.5
3.0
TNM
OC
/Sum
of S
peci
ated
VO
C's
NO (ppb)
TNMOC/Sum of Speciated VOC’s and NO_________________________________________________
Sunny
Cloudy
High TNMOC/sum of speciatedVOC’s are associated with lowNO concentrations.
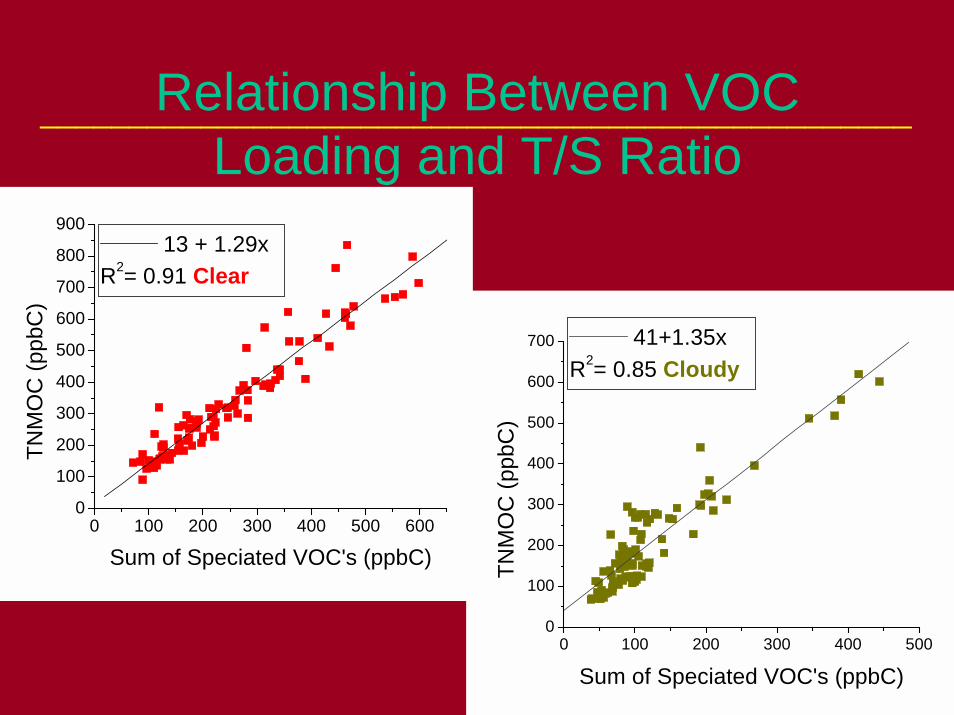
Relationship Between VOCLoading and T/S Ratio
_________________________________________________
0 100 200 300 400 500 6000
100
200
300
400
500
600
700
800
900
TNM
OC
(ppb
C)
Sum of Speciated VOC's (ppbC)
13 + 1.29xR2= 0.91 Clear
0 100 200 300 400 5000
100
200
300
400
500
600
700
TNM
OC
(ppb
C)
Sum of Speciated VOC's (ppbC)
41+1.35xR2= 0.85 Cloudy
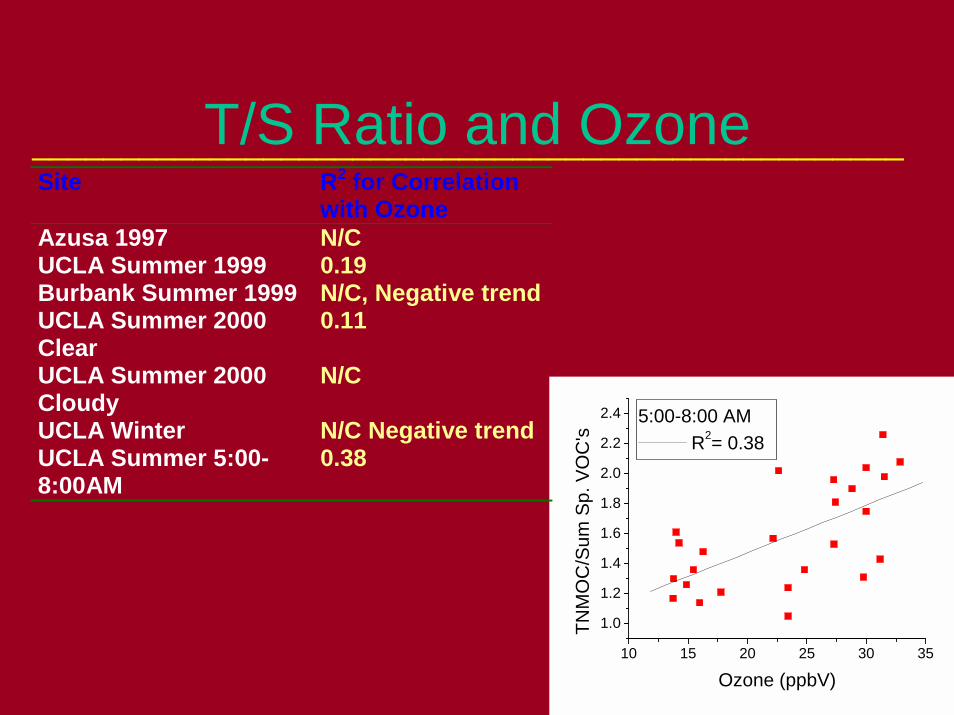
T/S Ratio and Ozone_________________________________________________
10 15 20 25 30 35
1.0
1.2
1.4
1.6
1.8
2.0
2.2
2.4
TNM
OC
/Sum
Sp.
VO
C's
Ozone (ppbV)
5:00-8:00 AM R2= 0.38
Site R2 for Correlation with Ozone
Azusa 1997 N/C UCLA Summer 1999 0.19 Burbank Summer 1999 N/C, Negative trendUCLA Summer 2000 Clear
0.11
UCLA Summer 2000 Cloudy
N/C
UCLA Winter N/C Negative trend UCLA Summer 5:00-8:00AM
0.38

Photochemical Processing:Estimating Photochemical Age
-Pairs of aromatics with different lifetimes can beused as markers of photochemical processing.
-The best are aromatics that are emitted in constantratios regardless of source.
-m,p-Xylene and ethylbenzene are typicallycorrelated with R2 < 0.95.
_________________________________________________
Compound KOH Lifetime (hrs)
Benzene 1.23 75 Toluene 5.96 15 Ethylbenzene 7.1 13 m-Xylene 23.6 4 p-Xylene 14.3 6.5 o-Xylene 13.7 6.8
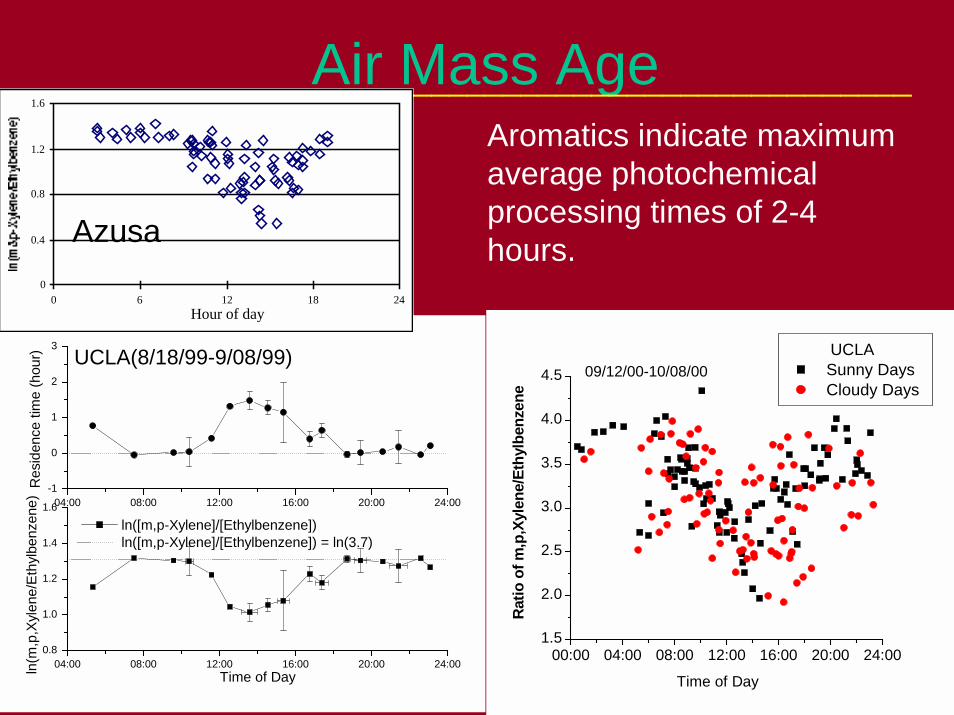
Air Mass Age_________________________________________________
00:00 04:00 08:00 12:00 16:00 20:00 24:001.5
2.0
2.5
3.0
3.5
4.0
4.5
Ratio
of m
,p,X
ylen
e/Et
hylb
enze
ne
Time of Day
09/12/00-10/08/00 UCLA
Sunny Days Cloudy Days
04:00 08:00 12:00 16:00 20:00 24:000.8
1.0
1.2
1.4
1.6
Res
iden
ce ti
me
(hou
r)
UCLA(8/18/99-9/08/99)
ln([m,p-Xylene]/[Ethylbenzene]) ln([m,p-Xylene]/[Ethylbenzene]) = ln(3.7)
ln(m
,p,X
ylen
e/Et
hylb
enze
ne)
Time of Day
04:00 08:00 12:00 16:00 20:00 24:00-1
0
1
2
3
0
0.4
0.8
1.2
1.6
0 6 12 18 24Hour of day
Aromatics indicate maximumaverage photochemicalprocessing times of 2-4hours.Azusa
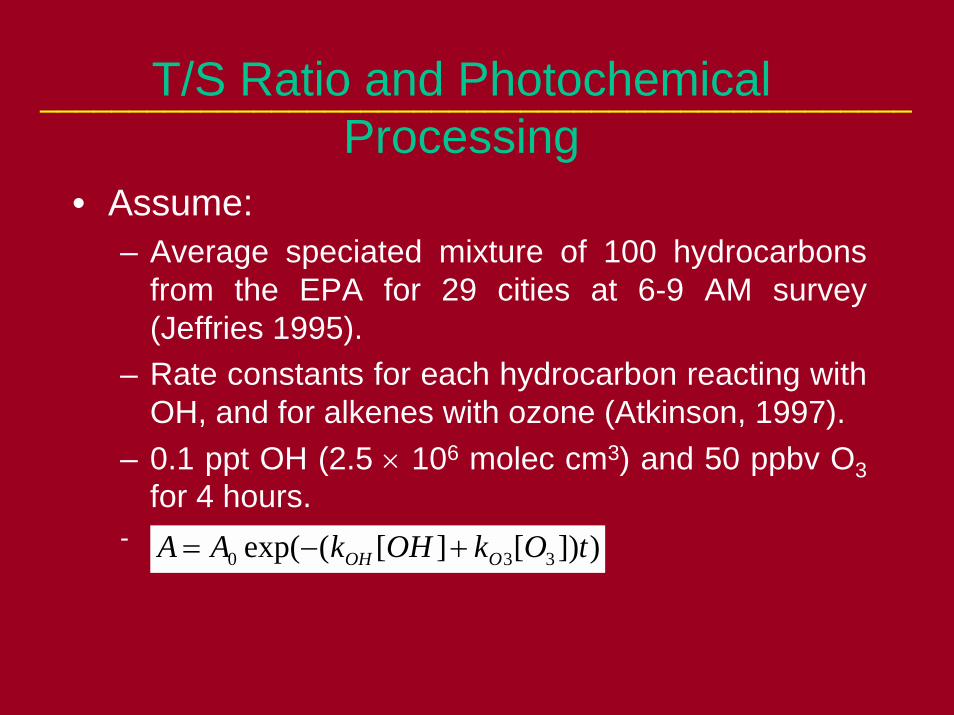
T/S Ratio and PhotochemicalProcessing
• Assume:– Average speciated mixture of 100 hydrocarbons
from the EPA for 29 cities at 6-9 AM survey(Jeffries 1995).
– Rate constants for each hydrocarbon reacting withOH, and for alkenes with ozone (Atkinson, 1997).
– 0.1 ppt OH (2.5 × 10⁶ molec cm3) and 50 ppbv O3for 4 hours.
-
_________________________________________________
)])[][(exp( 330 tOkOHkAA OOH +−=
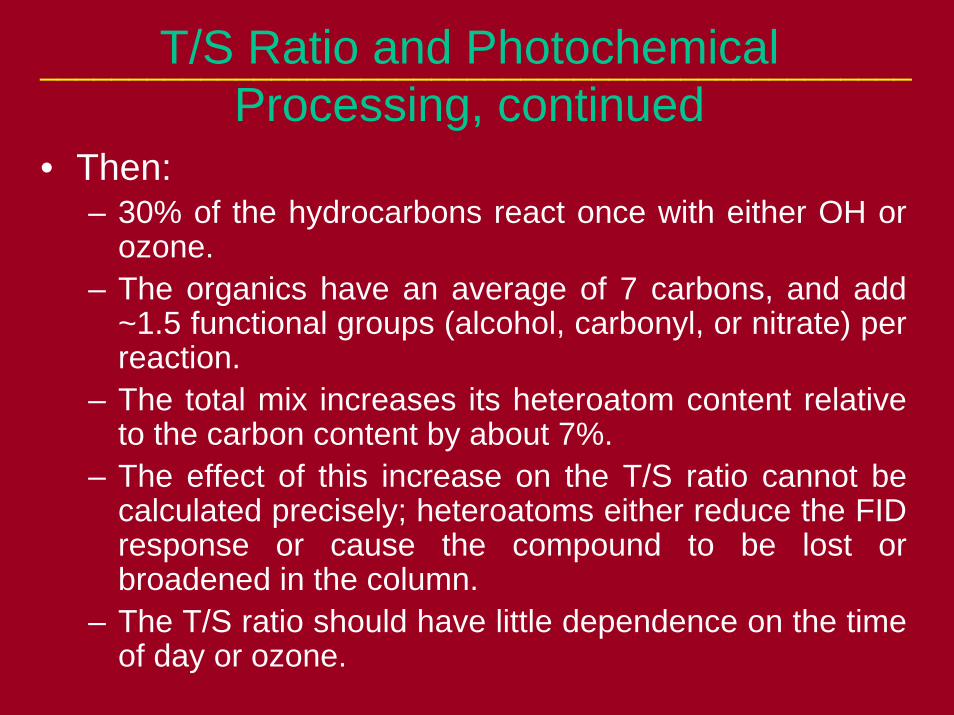
T/S Ratio and PhotochemicalProcessing, continued
• Then:– 30% of the hydrocarbons react once with either OH or
ozone.– The organics have an average of 7 carbons, and add
~1.5 functional groups (alcohol, carbonyl, or nitrate) perreaction.
– The total mix increases its heteroatom content relativeto the carbon content by about 7%.
– The effect of this increase on the T/S ratio cannot becalculated precisely; heteroatoms either reduce the FIDresponse or cause the compound to be lost orbroadened in the column.
– The T/S ratio should have little dependence on the timeof day or ozone.
_________________________________________________

UCLA Aromatic Correlations
0.0 0.2 0.4 0.6 0.8 1.0 1.2-4.5
-4.0
-3.5
-3.0
-2.5
-2.0
-1.5
-1.0
-0.5
0.0
Y = -0.87-2.08*xR2 = 0.40
09/12/00-10/08/00 Clear Cloudy
ln([TNMOC]/[Sum of Speciated VOC])
ln([E
thyl
benz
ene]
/[Ben
zene
])
_________________________________________________
Compound KOH Lifetime
(hrs) Benzene 1.23 75 Toluene 5.96 15 Ethylbenzene 7.1 13 m-Xylene 23.6 4 p-Xylene 14.3 6.5 o-Xylene 13.7 6.8
Period UCLA2000 Aromatic Ratio R2 w/
self R2 w/ O3
R2 w/ T/S
ln(Ethylbenzene/Benzene) 0.48 0.13 0.40 ln(Toluene/Benzene) 0.46 0.19 0.36 ln(o-Xylene/Benzene) 0.48 0.23 0.34 ln(m,p-Xylene/ Ethylbenzene)
0.99 0.49 0.03
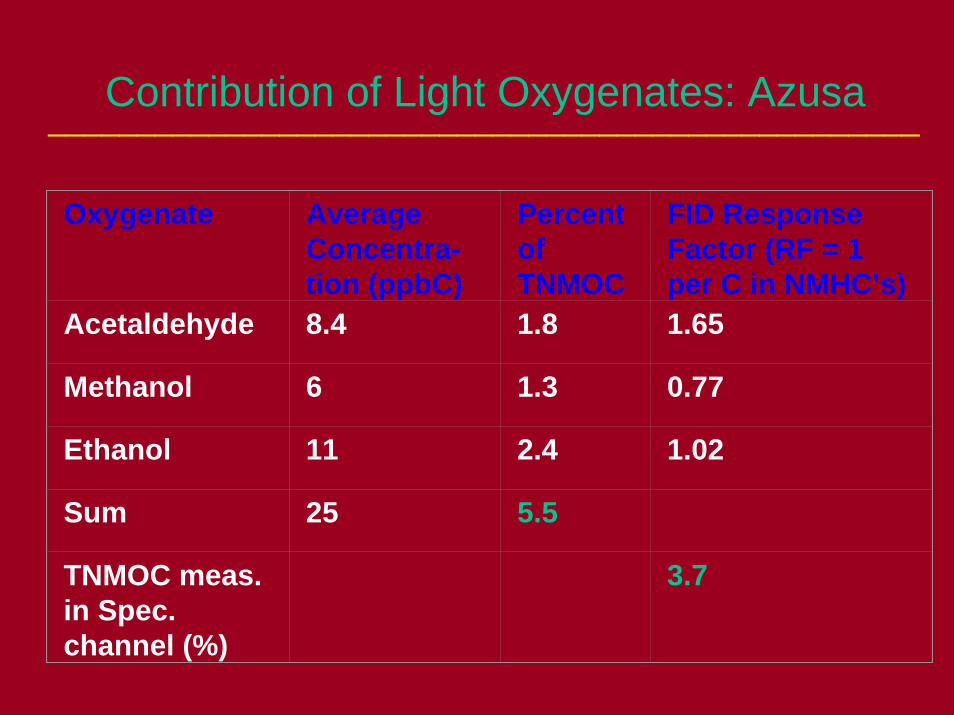
Contribution of Light Oxygenates: Azusa_________________________________________________
Oxygenate AverageConcentra-tion (ppbC)
PercentofTNMOC
FID ResponseFactor (RF = 1per C in NMHC’s)
Acetaldehyde 8.4 1.8 1.65
Methanol 6 1.3 0.77
Ethanol 11 2.4 1.02
Sum 25 5.5
TNMOC meas.in Spec.channel (%)
3.7
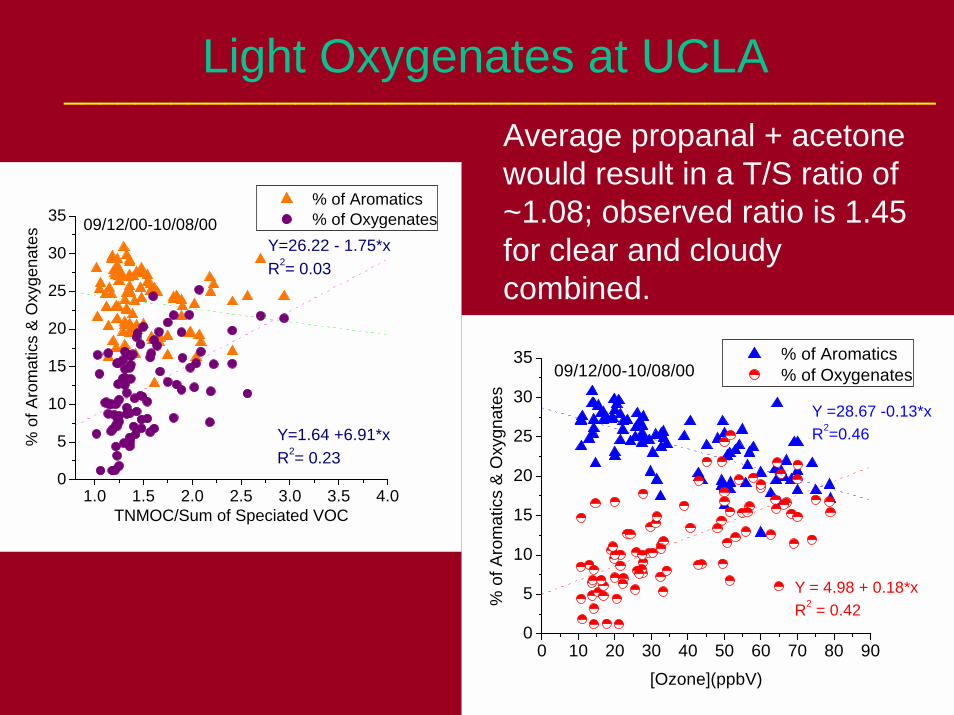
Light Oxygenates at UCLA_________________________________________________
1.0 1.5 2.0 2.5 3.0 3.5 4.00
5
10
15
20
25
30
35
Y=26.22 - 1.75*xR2= 0.03
Y=1.64 +6.91*xR2= 0.23
% of Aromatics % of Oxygenates09/12/00-10/08/00
% o
f Aro
mat
ics
& O
xyge
nate
s
TNMOC/Sum of Speciated VOC
0 10 20 30 40 50 60 70 80 900
5
10
15
20
25
30
35
Y =28.67 -0.13*xR2=0.46
Y = 4.98 + 0.18*xR2 = 0.42
09/12/00-10/08/00
% o
f Aro
mat
ics
& O
xygn
ates
[Ozone](ppbV)
% of Aromatics % of Oxygenates
Average propanal + acetonewould result in a T/S ratio of~1.08; observed ratio is 1.45for clear and cloudycombined.

Conclusions" Standard VOC measurement underestimates VOC
level typically by 10-60%, total can be up to 3x higherthan the sum of speciated VOC’s.
" Excess varies strongly with location, day of week andmeteorology.
" At UCLA, large excess TNMOC is stronglyassociated with either high mixing heights (summer)or strong nighttime inversions coupled with lessinfluence from sources.
" Reduced FID response of oxygenates does notaccount for much of the excess organics.
" Excess organics appear to be associated withphotochemical activity and with mixing from aloft.
" Chemical identity and source of excess VOC’s is stillto be determined.
_________________________________________________

AcknowledgementsAt CARB: Bart Croes, Drs. Eileen McCauley,
Leo Zafonte, Randy Pasek, Alberto Ayalaand Dongmin Luo
At SCAQMD Steve Barbosa and Phil O’Belland Rudy Eden
At UCLA, Drs. Jill Fenske and Alam Hassonand Andy Ho, Grazyna Orzechowska andEric Ernstner
At NCAR, Rich Leub
_________________________________________________