Embed Size (px)
Citation preview

1
Touchless and Always-on Cloud Analytics as a Service S. Suneja, C. Isci, R. Koller, E. de Lara
Despite modern advances in automation and managed services, many end users of cloud services remain concerned with regards to the lack of visibility into their operational environments. The underlying principles of existing approaches employed to aid users gain transparency into their runtimes, do not apply to today’s dynamic cloud environment where virtual machines (VMs) and containers operate as processes of the cloud operating system (OS). We present Near Field Monitoring (NFM), a cloud-native framework for monitoring cloud systems and providing operational analytics services. With NFM, we employ cloud, virtualization, and containerization abstractions to provide complete visibility into running entities in the cloud, in a touchless manner, i.e., without modifying, instrumenting or accessing inside the end user context. Operating outside the context of the target systems enables always-on monitoring independent of their health. Using an NFM implementation on OpenStack, we demonstrate the capabilities of NFM, as well as its monitoring accuracy and efficiency. NFM is highly practical and general, supporting more than 1000 different system distributions, allowing instantaneous monitoring as soon as a guest system gets hosted on the cloud, without any setup prerequisites or enforced cooperation.
1. Introduction Emerging cloud services enable end users to define and provision complex, distributed applications and their compute resources with unprecedented simplicity and agility. Entire stacks of software can be instantiated within minutes with various configurations and customizations of the runtime environments. Various management and automation services further simplify the entire lifecycle management of the modern born-on-the-cloud applications including their continuous integration, delivery and testing; however, despite these great advances in automation and managed services, visibility into the operational environments of the guest systems remains a persistent concern for many end users.
To address these users’ desire for maintaining higher control and deeper visibility into their operational environment [1], cloud service providers typically embed various kinds of agents or software components inside both their infrastructure as well as the end-user systems. These components facilitate extracting various metrics (i.e., resource use monitoring) and events (i.e., application and operational logs) from these systems, and expose these to the end users. Example services include Amazon CloudWatch and CloudTrail [2], Dell Foglight [3], and VMware vShield endpoint [4]. A comprehensive description of cloud monitoring platforms and services can be found in [5].
A revised version of this draft features in IBM Journal of Research and Development, vol. 60, no. 2-3, pp. 11:1-11:10, March-May 2016. doi: 10.1147/JRD.2016.2518438 Copyright 2016 by International Business Machines Corporation. Copying in printed form for private use is permitted without payment of royalty provided that (1) each reproduction is done without alteration and (2) the Journal reference and IBM copyright notice are included on the first page. The title and abstract, but no other portions, of this paper may be copied by any means or distributed royalty free without further permission by computer-based and other information-service systems. Permission to republish any other portion of this paper must be obtained from the Editor. 0018-8646/16 B 2016 IBM

2
Unfortunately, the defining principles of these approaches are borrowed from a different era of computing that no longer applies, with long-running, dedicated systems that can tolerate ample configuration times and resource overheads. In contrast, in today's cloud environments, the building blocks of the end user environments, VMs and containers, are very much like the processes of the cloud OS. They are strictly specified and controlled slices of resources that are scheduled, descheduled, created and destroyed at unprecedented speed [6]. Existing approaches become increasingly heavyweight and sluggish (in terms of resource consumption and functionality initialization) relative to the highly dynamic and ephemeral nature of cloud instances, with emerging lightweight virtualization and containerization trends. Many cloud consumers already voice concerns regarding not getting a complete share of what they are charged for in the fixed price per capacity of pay-as-you-go models [7]. While many end users begin to expect services beyond operational visibility---operational insights and intelligence---existing schemes still struggle to provide even basic monitoring, event detection, and alerting capabilities.
In this work, we present Near Field Monitoring (NFM), a cloud-native framework for providing systems monitoring and operational analytics services in the cloud. In NFM, we employ cloud, virtualization and containerization abstractions to provide visibility into running entities in IaaS (Infrastructure as a Service) clouds, without modifying, instrumenting or accessing inside the end user context. We demonstrate how VM introspection and container namespace mapping techniques can be used to monitor "processes" of the cloud OS in a "touchless" out-of-band manner, i.e., without requiring any custom software components to be built in the guest system. Specifically, to extract in-VM runtime state from outside, we use and extend VM introspection techniques to traverse kernel data structures in exposed VM memory views. As for containers, we use the namespace mapping functionality provided in the host kernel to extract the container’s runtime state through standard OS exported functions.
We demonstrate an additional dimension of monitoring enabled by our framework, which we refer to as "always on monitoring". A fundamental limitation of traditional monitoring services is that rely on a functional system environment to perform their tasks. As they operate from the context of the system they observe, once the target system is compromised, hung or even disconnected from the network, many monitoring services become ineffective or inaccessible, which ironically is precisely the circumstance when such visibility is most valuable [8]. As we decouple monitoring from target system context (and therefore system health) in NFM, our approach is inherently always on, regardless of system state.
Using an NFM implementation on OpenStack [9], we show that we can immediately start inspecting an arbitrary, unmodified instance provisioned from the cloud, with no prerequisite knowledge of the instance, making NFM practical to apply. Our approach is very general as highlighted by the fact that we can support more than 1000 different system distributions ranging across 10 years worth of Linux kernel versions, without requiring any manual configuration setup for target systems. Our evaluation shows that monitoring with NFM can operate with high accuracy and with negligible performance impact on guest systems. We demonstrate how we use NFM today to provide basic cloud analytics services.
The rest of the paper is organized as follows. In Section 2, we describe the architecture of NFM, the techniques employed to extract the runtime state from guest VMs and containers, and the
3
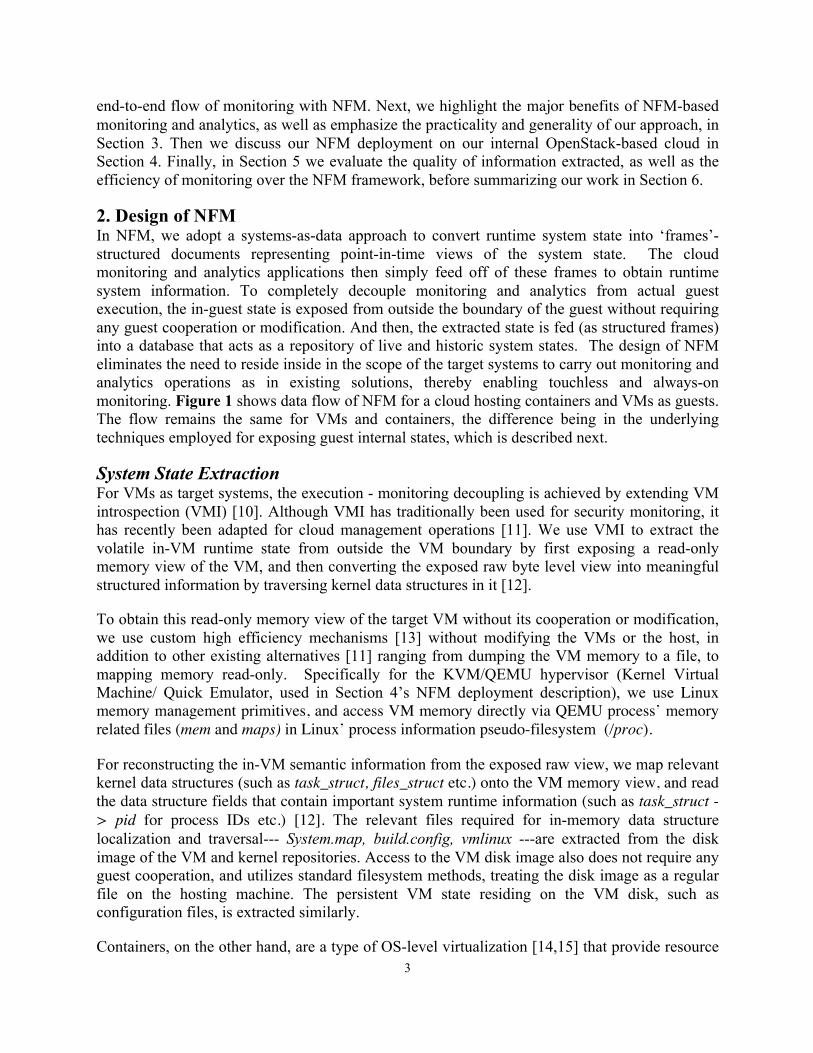
end-to-end flow of monitoring with NFM. Next, we highlight the major benefits of NFM-based monitoring and analytics, as well as emphasize the practicality and generality of our approach, in Section 3. Then we discuss our NFM deployment on our internal OpenStack-based cloud in Section 4. Finally, in Section 5 we evaluate the quality of information extracted, as well as the efficiency of monitoring over the NFM framework, before summarizing our work in Section 6.
2. Design of NFM In NFM, we adopt a systems-as-data approach to convert runtime system state into ‘frames’- structured documents representing point-in-time views of the system state. The cloud monitoring and analytics applications then simply feed off of these frames to obtain runtime system information. To completely decouple monitoring and analytics from actual guest execution, the in-guest state is exposed from outside the boundary of the guest without requiring any guest cooperation or modification. And then, the extracted state is fed (as structured frames) into a database that acts as a repository of live and historic system states. The design of NFM eliminates the need to reside inside in the scope of the target systems to carry out monitoring and analytics operations as in existing solutions, thereby enabling touchless and always-on monitoring. Figure 1 shows data flow of NFM for a cloud hosting containers and VMs as guests. The flow remains the same for VMs and containers, the difference being in the underlying techniques employed for exposing guest internal states, which is described next.
System State Extraction For VMs as target systems, the execution - monitoring decoupling is achieved by extending VM introspection (VMI) [10]. Although VMI has traditionally been used for security monitoring, it has recently been adapted for cloud management operations [11]. We use VMI to extract the volatile in-VM runtime state from outside the VM boundary by first exposing a read-only memory view of the VM, and then converting the exposed raw byte level view into meaningful structured information by traversing kernel data structures in it [12].
To obtain this read-only memory view of the target VM without its cooperation or modification, we use custom high efficiency mechanisms [13] without modifying the VMs or the host, in addition to other existing alternatives [11] ranging from dumping the VM memory to a file, to mapping memory read-only. Specifically for the KVM/QEMU hypervisor (Kernel Virtual Machine/ Quick Emulator, used in Section 4’s NFM deployment description), we use Linux memory management primitives, and access VM memory directly via QEMU process’ memory related files (mem and maps) in Linux’ process information pseudo-filesystem (/proc).
For reconstructing the in-VM semantic information from the exposed raw view, we map relevant kernel data structures (such as task_struct, files_struct etc.) onto the VM memory view, and read the data structure fields that contain important system runtime information (such as task_struct -> pid for process IDs etc.) [12]. The relevant files required for in-memory data structure localization and traversal--- System.map, build.config, vmlinux ---are extracted from the disk image of the VM and kernel repositories. Access to the VM disk image also does not require any guest cooperation, and utilizes standard filesystem methods, treating the disk image as a regular file on the hosting machine. The persistent VM state residing on the VM disk, such as configuration files, is extracted similarly.
Containers, on the other hand, are a type of OS-level virtualization [14,15] that provide resource
4
isolation similar to traditional VMs. The key difference between containers and VMs is that with the former, the same kernel instance is shared by all containers as well as the host. This property makes them convenient to monitor, as there is no semantic gap. Given that all processes are visible from the host, the only missing information is the mapping between resources as seen from inside the container and the outside, for example, each container can have an init process with pid=1. In order to monitor the processes in this virtualized system, all we need is a list of all the processes associated with it, and the mapping between PIDs of processes as seen from inside the container and from the host. This mapping (namespaces) is maintained by the kernel for accounting purposes, and is easily accessible from the host. For example, in Linux it is accessible from the /proc file system [16].
End-to-end flow We now illustrate the end-to-end flow starting from a fresh guest system deployment to its runtime state collection and subsequent monitoring/analytics over the NFM framework. If the new instance is a container, then it can be directly monitored with host OS-exported functionality without any detection, as the kernel of the guest container is the same as the host. For the case of VMs, let’s say a cloud user downloads the latest Ubuntu image from the Ubuntu cloud public repository, instantiates the image as a VM and runs it. This user wants his VM automatically monitored, without any intervention or configuration. There are 4 steps to do so. First, we detect the kernel version. One way is to get it from the file system of the current image, but a better one is to detect it from memory state. The Linux kernel stores a string with the kernel version in memory. We found that the range in memory where this version can be placed is 4.5MBs for all kernels between 2.6.11 and 3.19, taking about 10ms for a scan and search. After detecting the version, the second step is to reconstruct the semantic information for the specific kernel version. Notice that this not only refers to the version of the kernel source code, but to the actual build. The semantic information is extracted from the debugging information-enabled kernel build image (vmlinux) corresponding to the guest kernel, and can be downloaded from public repositories. The rules used to extract the information from the vmlinux file refer to global symbols (System.map) and data structure field names for the kernel. For example, the hostname is stored at a known global variable name (init_uts_ns -> name). The third step is then to use this semantic information to read the guest memory, and parse it to extract information like the list of processes. Finally, in the fourth step, this information is packaged into a frame, representing a point-in-time view of the guest state, and sent over a data bus for storage and eventual querying by monitoring and analytics applications.
3. Benefits of NFM We now discuss the salient features of NFM, specifically two major benefits of NFM-based monitoring and analytics, as well as the practicality and generality of our approach.
Analytics-as-a-Service With NFM, we enable monitoring and analytics services to be instantly initiated in similar fashion as cloud automation and managed services. Instead of requiring any custom hooks, i.e., software components to be installed inside the guest systems, services are now built on top of NFM, feeding off of the extracted structured guest-state frames. With NFM, we enable cloud analytics-as-a-service, where both the cloud service users and providers can seamlessly subscribe and unsubscribe to various monitoring and analytics services with no impact on their execution

5
environments, development or deployment workflows. Figure 1 highlights some typical services that can be built atop NFM, such as out-of-band resource monitoring, compliance or system inspection, post-mortem system diagnostics, security analysis, as well as across-time and across-systems analytics for anomaly detection and misconfiguration analysis, etc. To demonstrate the capability of NFM to enable cloud-wide analytics specifically for containerized guests, Figure 2 shows an example analytics for a set of 200 containers running in our private cloud. It shows memory usage clustered by host. This type of resource analytics is interesting for doing smart placement of instances. An administrator could gather the data to generate this figure by only querying the database. Compare this to the traditional approach of having to keep track of memory usage based on deploy time allocations, or having to login into each host and take the measurements manually or via scripts requiring guest cooperation (login credentials).
Always-on Monitoring NFM based monitoring is capable of observing the target systems (i.e., containers or VMs) from birth to death, including post-mortem as well dysfunctional system inspection. With NFM, since there is no need to install any agent inside the target systems, the systems can be monitored immediately as soon as they are created-- they do not need to be fully functional. To highlight the always-on monitoring capability with our NFM framework, we measured the end-to-end time for a fresh VM boot until termination, as well as in-guest monitoring agent installation and initiation. We then compared the times and runtime states during which a guest VM gets actively monitored with current in-guest techniques and NFM based monitors. We use a popular open source monitoring agent- collectd v4.10 [17].
For a sample Ubuntu VM (version 12.04 / kernel 3.2), it takes about 5 seconds for it to boot up (upto sshd up and running), and another 5-15 seconds for agent initiation. If the agent isn’t already installed and configured, it takes an extra 5-10 seconds of package installation (depending upon just the core package installation (collectd-core) as opposed to a full installation (collectd) of the daemon including the configuration, and also upon the amount of dependent packages already installed on the system). And this is when collectd does not emit data to a backend, which can add further delays before remote monitoring can initiate. All values were confirmed with system logs, package installer logs, and bootchart logs. On the other hand, an NFM based monitor does not have such initiation overheads, with only a negligible one-time per-guest automatic configuration, useful across all services unlike per-agent configuration. It is thus able to monitor the guest throughout its lifespan, even in its bootup, starting right after the initial image load (initrd).
We further divide the lifetime of a guest system into three phases and show the limitation of current in-guest monitoring techniques. These include (i) bootup / init, (ii) normal operation, (iii) reboot / shutdown / unexpected termination. There have been several accounts of scenarios in each of these phases where the guest as well as its in-guest monitoring agents became inaccessible (either no remote login, or agent not emitting data to backend) or incapable of troubleshooting, leaving the user searching for answers from cloud admins. Scenarios during phase I include VM taking long to boot due to network driver or dhcp issues, or not booting up altogether due to filesystem mounting errors- for example misconfigured file systems table (/etc/fstab) or missing modules after system upgrade. After the initial bootup phase, the guest and the in-guest monitors might become inaccessible or incapable due to (i) network misconfiguration on host or guest IP change (due to dhcp), (ii) a fork bomb in a buggy code

6
preventing a remote login after reaching the maximum admissible process count, (iii) the root filesystem remounting into read-only mode due to some bug, again preventing remote login, (iv) a (rootkit) compromised guest showing high network transfer statistics without the user initiating any network heavy process. Finally, there are cases where the guest does not terminate smoothly or encounters an unexpected termination, and the guest ends up in a hung state with neither remote-login nor in-guest monitors active or available. These include cases where the VM crashes due to kernel panic caused by a buggy or malicious process or module, or the VM being stuck at unmounting filesystems (real, network or pseudo).
On the other hand, the NFM based monitor can actively inspect the guest in all these scenarios by decoupling monitoring from the context of the guest system, and providing users with a pseudo console to carry out standard troubleshooting via utilities such as lsmod, ps, ifconfig, netstat etc. In fact, we have employed such a console to troubleshoot in quite a few such cases during routine VM use.
Practicality and Generality For easy deployability, we aim to provide monitoring and analytics functionality without modifying or specializing the guests for monitoring, as well as without requiring any guest cooperation such as login credentials. For generality, we aim to be able to monitor any type of guest, that is, any version or type of OS running on VMs or containers. While we focus on Linux VMs and containers as target systems, our approach is equally applicable for Mac and Windows OSes as well, because although these OSes are closed source, researchers have been successful in reverse engineering their kernel data structures, while in some cases their debugging information enabled packages or symbol packages are also publically available [18,19,20,21]. Furthermore, their versions are few and change very slowly as compared to Linux.
Containers by virtue of their design have a convenient feature- they share the same kernel with the host. So, if the host is running Linux, all containers must be running Linux as well. Furthermore, the same system calls or other OS exported functionality used to query system information from the host, can be used as is for its containers as well. Using this feature enables us to monitor any container, irrespective of the OS version running inside the container. We tested this with monitors running in Ubuntu and Redhat hosts monitoring a range of distributions running in containers: Redhat, Ubuntu, Centos, and even hello-world containers that only have a single executable [22]. Additionally, the container monitoring technique in NFM is easily extensible to other operating systems like Solaris and Freebsd [15].
VMs on the other hand present a much harder problem. Monitoring of VMs with NFM relies on kernel data structures and theoretically requires configuration effort per guest-OS version, but studies [23] show small variations in the relevant data structures across major Linux versions. Furthermore, the standardization trends in enterprise clouds also work in favor of this approach, limiting the OS-version variability. We can now support more than 1000 different system distributions to operate over the NFM framework (including distribution patches on top of official vanilla kernels), without requiring any manual configuration setup for target systems. Currently, it is possible to detect and monitor all the Linux kernel versions between 2.6.11 and 3.19 (years 2005 to 2015). Such a wide range of supported systems allows providing monitoring and analytics to a large guest population, and that too instantaneously as soon as a guest system gets hosted on the cloud infrastructure, without requiring any installation inside the guest or

7
enforcing any sort of guest cooperation, modification or specialization. This makes the NFM framework practically applicable.
Our state extraction technique for VMs is based on source-code analysis, and is a type of rule hand-crafting. The idea is that the rules reference source code structure and fields, and are mainly used to extract field offset information (for example, the offset of state in struct task_struct {volatile long state; … } is 0). These offsets are then combined with the location of relevant structure instances in kernel memory (for example, the location of ‘struct task_struct init_task;’ in memory). The interesting observation we made for the Linux kernel is that the changes to core data structures related to runtime system state---like processes, connections, modules, files opened and cached data, loaded libraries, and some metrics---are very rare. More specifically, the number of rules for which there is more than one option was 5 out of 96 (versions 2.6.11 to 3.19). Most of our tests focused on recent Ubuntu and Redhat servers (kernels 3.x), but we generated the metadata needed to monitor 610 Ubuntu guests, 112 Redhat guests, 30 Fedora guests, and 47 Ubuntu servers with vanilla kernels.
4. NFM on OpenStack We have implemented the NFM framework to interface with a higher-level platform layer such as OpenStack [9]. We have integrated NFM to an OpenStack-based cloud made of KVM/QEMU (Kernel Virtual Machine/Quick Emulator) VMs [24] and Docker [14] containers. The current implementation is limited to Linux only. Figure 1 shows the details of the deployment. Using OpenStack Nova API, guest VMs and containers are instantiated over nova compute hosts that have NFM monitors running as host daemons. Similar to how the details about deploying a VM or container are hidden by using OpenStack Nova, monitoring these systems is automatically and transparently managed by using NFM. Monitors run in all of the docker and KVM hosts polling for new containers and VMs. Based upon state extraction policies, the runtime state of the containers and VMs is extracted, packaged as frames, and pushed into a Kafka scalable data bus [25]. Asynchronous reads on these frames, via consumer applications, pushes them into a database that provides an interface to query live as well as historic system state (frames). The search server is implemented in ElasticSearch [26], and uses a distributed/sharded architecture where each shard is a Lucene index [27].
5. Evaluation In this section, we evaluate the quality of information extracted in terms of accuracy and consistency, as well as the efficiency of monitoring over the NFM framework in terms of scalability and guest performance impact. The evaluation deals only with VMs as target guest systems. Since the containers share the same kernel as the host, directly using standard host OS-exported functionality itself enables high quality container state extraction and high efficiency monitoring.
Accuracy To quantify the accuracy of information that gets extracted by using the NFM framework, we ran a custom workload in a target VM, with time varying CPU and memory demands, configured to stress the full range of available CPU and memory resources allocated to the VM. We then captured multiple 10s-interval samples of the resource utilizations of the test process, using the standard in-VM top utility as well as a remote monitor built on top of NFM. The remote monitor

8
correlates successive state frames to extracts process level resource usage without accessing the VM itself at all. While comparing the average sample variation between the metrics captured by both techniques, the remote monitor was confirmed to be accurate with only 1% and 2% measurement differences for CPU and memory utilization metrics respectively, across the whole sample set. The slight variation in measurements is because of unsynchronized sampling time points across both techniques.
Furthermore, since monitoring with NFM is performed from outside the guest boundary, we can observe state that might be concealed from in-guest monitoring components. To highlight the better quality monitoring information that can be extracted with NFM, we employ a simple security monitor to run on top of it. We introduced an open source rootkit [28] in a guest VM that installs as a kernel module and hides itself by taking over kernel function hooks. Since standard in-VM Linux utilities like ps, lsmod and netstat interface with OS exported functions that have been compromised by the rootkit, they cannot discover a malicious process started (and hidden from the OS) by the rootkit, as well as an unauthorized listener connection initiated by it. However, since the security monitor, built on top of NFM, operates against the state frames extracted by traversing kernel data structures, the security monitor can detect this rootkit module, process, and network connection. This is only a simple example of how monitoring the guests from outside their runtime can circumvent some of the issues that in-guest solutions are susceptible to. More sophisticated attacks and VMI based defenses can be found in literature [29,30].
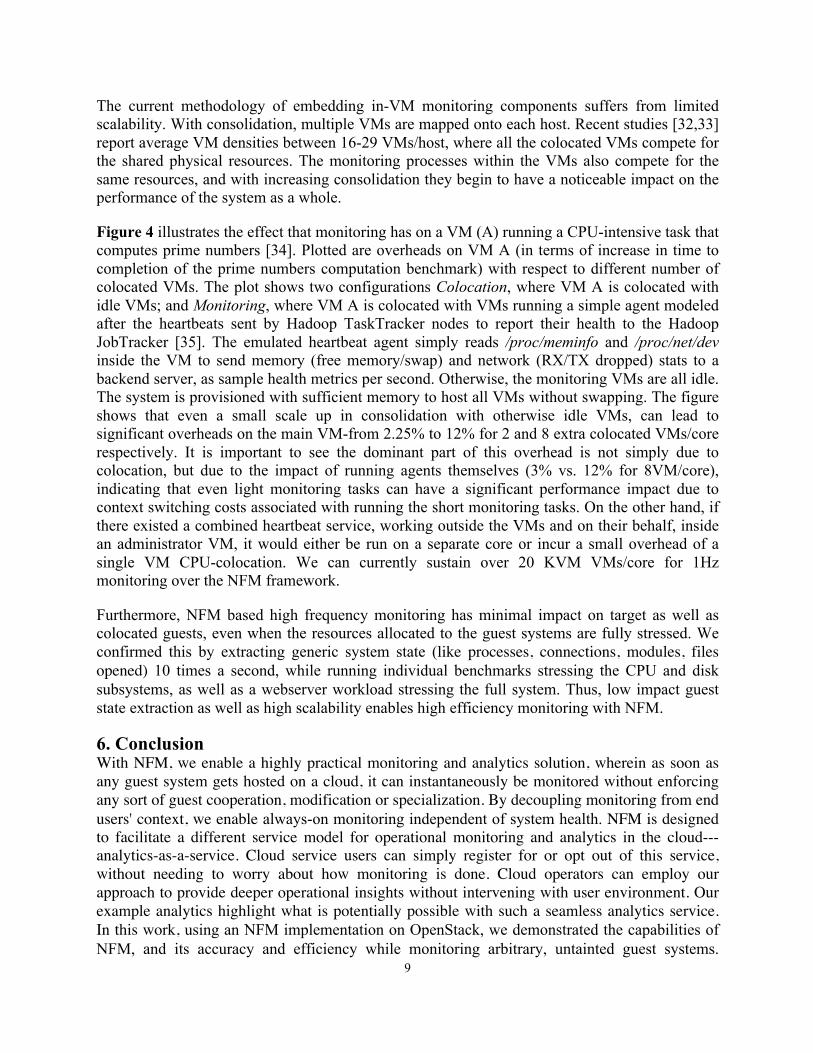
Consistency We use VMI in NFM to reconstruct in-VM state from outside, and VMI has its own consistency issues. Specifically, since VMI operates outside the guest context, in an asynchronous manner, there can be inconsistencies in observed data structures while traversing them as the VM continues to run. These inconsistencies can be intrinsic to the OS and occur while traversing kernel data structures for freshly created processes or those in different stages of their decay (zombie, dying, dead but not reaped). Another kind of inconsistencies---extrinsic---are an artifact of live introspection and occur while interpreting data structures of tasks that either die or change their attributes (open files, network connections) during introspection. Figure 3 shows the percentage of iterations where a runtime state extractor encounters errors due to the different inconsistency categories, while reading in-VM process state for a fork heavy workload. The occurrence rate of inconsistencies is independent of the state extraction frequency. As shown in the figure, these inconsistencies occur very rarely. They can be reduced even further if the guest can tolerate minor pauses during the state extraction (introspection) cycle-- about 50ms for a full system crawl that involves extracting runtime information regarding processes, connections, modules, files opened, etc. However, the impact of periodic guest halting can be prohibitive for high frequency state extraction—as high as 35% hit on the guest workload for 10Hz monitoring. Additionally, this can eliminate only the extrinsic inconsistencies that occur due to live introspection, while the intrinsic ones still remain. Otherwise, a hardware-assisted approach [31] for consistent introspection can be adopted to improve the reliability of NFM.
Efficiency We use two metrics to discuss the efficiency of monitoring with NFM- (high) scalability and (low) guest performance impact.
9
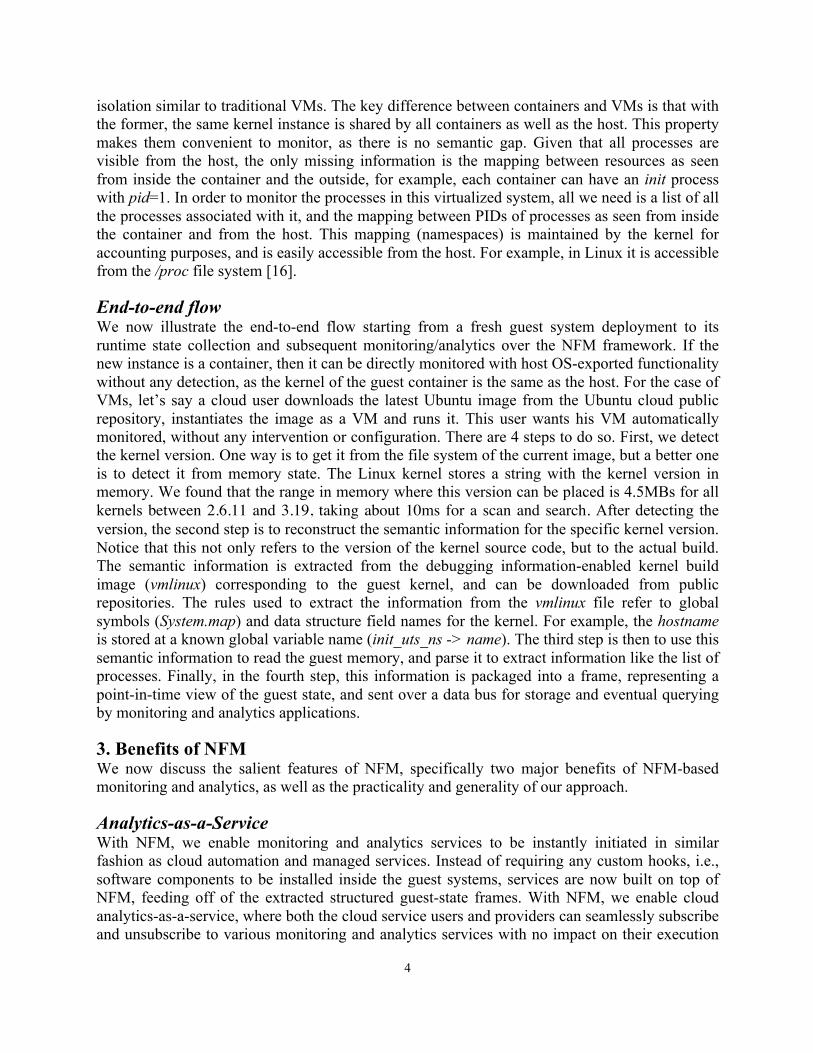
The current methodology of embedding in-VM monitoring components suffers from limited scalability. With consolidation, multiple VMs are mapped onto each host. Recent studies [32,33] report average VM densities between 16-29 VMs/host, where all the colocated VMs compete for the shared physical resources. The monitoring processes within the VMs also compete for the same resources, and with increasing consolidation they begin to have a noticeable impact on the performance of the system as a whole.
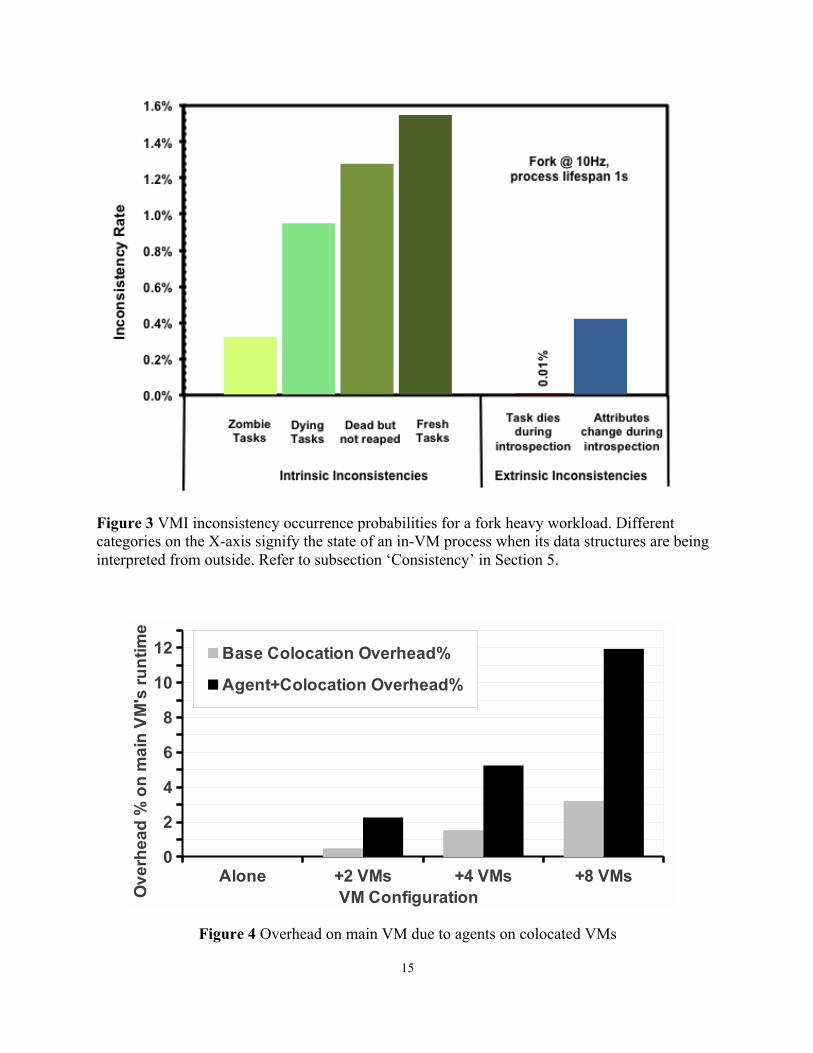
Figure 4 illustrates the effect that monitoring has on a VM (A) running a CPU-intensive task that computes prime numbers [34]. Plotted are overheads on VM A (in terms of increase in time to completion of the prime numbers computation benchmark) with respect to different number of colocated VMs. The plot shows two configurations Colocation, where VM A is colocated with idle VMs; and Monitoring, where VM A is colocated with VMs running a simple agent modeled after the heartbeats sent by Hadoop TaskTracker nodes to report their health to the Hadoop JobTracker [35]. The emulated heartbeat agent simply reads /proc/meminfo and /proc/net/dev inside the VM to send memory (free memory/swap) and network (RX/TX dropped) stats to a backend server, as sample health metrics per second. Otherwise, the monitoring VMs are all idle. The system is provisioned with sufficient memory to host all VMs without swapping. The figure shows that even a small scale up in consolidation with otherwise idle VMs, can lead to significant overheads on the main VM-from 2.25% to 12% for 2 and 8 extra colocated VMs/core respectively. It is important to see the dominant part of this overhead is not simply due to colocation, but due to the impact of running agents themselves (3% vs. 12% for 8VM/core), indicating that even light monitoring tasks can have a significant performance impact due to context switching costs associated with running the short monitoring tasks. On the other hand, if there existed a combined heartbeat service, working outside the VMs and on their behalf, inside an administrator VM, it would either be run on a separate core or incur a small overhead of a single VM CPU-colocation. We can currently sustain over 20 KVM VMs/core for 1Hz monitoring over the NFM framework.
Furthermore, NFM based high frequency monitoring has minimal impact on target as well as colocated guests, even when the resources allocated to the guest systems are fully stressed. We confirmed this by extracting generic system state (like processes, connections, modules, files opened) 10 times a second, while running individual benchmarks stressing the CPU and disk subsystems, as well as a webserver workload stressing the full system. Thus, low impact guest state extraction as well as high scalability enables high efficiency monitoring with NFM.
6. Conclusion With NFM, we enable a highly practical monitoring and analytics solution, wherein as soon as any guest system gets hosted on a cloud, it can instantaneously be monitored without enforcing any sort of guest cooperation, modification or specialization. By decoupling monitoring from end users' context, we enable always-on monitoring independent of system health. NFM is designed to facilitate a different service model for operational monitoring and analytics in the cloud---analytics-as-a-service. Cloud service users can simply register for or opt out of this service, without needing to worry about how monitoring is done. Cloud operators can employ our approach to provide deeper operational insights without intervening with user environment. Our example analytics highlight what is potentially possible with such a seamless analytics service. In this work, using an NFM implementation on OpenStack, we demonstrated the capabilities of NFM, and its accuracy and efficiency while monitoring arbitrary, untainted guest systems.

10
Finally, we highlighted the generality of our approach by supporting more than 1000 different system distributions ranging across 10 years worth of Linux kernel versions, without requiring any manual configuration setup for target systems.
References 1. HP Blogs, Are your application owners satisfied with data protection?. [Online]. Available: http://h30507.www3.hp.com/t5/Around-the-Storage-Block-Blog/Are-your-application-owners-satisfied-with-data-protection-Think/ba-p/179446#.VU5njdpViko 2. Amazon CloudWatch. [Online]. Available: http://aws.amazon.com/cloudwatch/ 3. Dell Foglight. [Online]. Available: http://software.dell.com/products/foglight-application-performance-monitoring/ 4. VMware vShield endpoint. [Online]. Available: http://www.vmware.com/products/vsphere/features/endpoint
5. Giuseppe Aceto, Alessio Botta, Walter De Donato, and Antonio Pescapè. 2013. Cloud monitoring: A survey. Computer Networks. 57, 9 (June 2013), 2093-2115.
6. Jack of all clouds, Recounting EC2 One Year Later. [Online]. Available: http://www.jackofallclouds.com/2010/12/recounting-ec2/
7. B. Farley, A. Juels, V. Varadarajan, T. Ristenpart, K. D. Bowers, and M. M. Swift. More for your money: exploiting performance heterogeneity in public clouds. In Proceedings of the Third ACM Symposium on Cloud Computing, SoCC ’12, pp. 20:1–20:14, 2012.
8. C. Colohan. The Scariest Outage Ever. CMU SDI/ISTC Seminar Series, 2012. [Online]. Available: http://www.pdl.cmu.edu/SDI/2012/083012b.html
9. OpenStack Cloud Computing Software. [Online]. Available: https://www.openstack.org/
10. T. Garfinkel, M. Rosenblum. "A Virtual Machine Introspection Based Architecture for Intrusion Detection." In NDSS, vol. 3, pp. 191-206. 2003.
11. S. Suneja, C. Isci, E. Lara, and V. Bala. "Exploring VM Introspection: Techniques and Trade-offs." In Proceedings of the 11th ACM SIGPLAN/SIGOPS International Conference on Virtual Execution Environments, pp. 133-146. ACM, 2015.
12. Mariusz Burdach. Digital forensics of the physical memory. 2005. [Online]. Available: http://forensic.seccure.net/pdf/mburdach_digital_forensics_of_physical_memory.pdf.
13. S. Suneja, C. Isci, E. Lara, T. Mummert, and V. Bala, “Non-intrusive, Out-of-band and Out-of-the-box Systems Monitoring in the Cloud,” The 2014 ACM international conference on Measurement and modeling of computer systems (SIGMETRICS), pp. 249-261. 2014.
14. Docker. [Online]. Available: http://www.docker.com

11
15. FreeBSD Jails. [Online]. Available: https://www.freebsd.org/doc/en/books/handbook/jails.html
16. Linux namespaces. [Online]. Available: http://man7.org/linux/manpages/man7/namespaces.7.html
17. Collectd, The system statistics collection daemon. [Online]. Available: https://collectd.org/
18. M. Auty, A. Case, M. Cohen, B. Dolan-Gavitt, M. H. Ligh, J. Levy, and A. Walters. Volatility - An advanced memory forensics framework. [Online]. Available: http://code.google.com/p/volatility.
19. Nirsoft. Windows Vista Kernel Structures. [Online]. Available: http://www.nirsoft.net/kernel_struct/vista/
20. Docker. Mac OS X Docker Documentation. [Online]. Available: https://docs.docker.com/installation/mac/
21. Docker. Microsoft Windows Docker Documentation. [Online]. Available: https://docs.docker.com/installation/windows/
22. Docker registry, hello-world image. [Online]. Available: https://registry.hub.docker.com/u/library/hello-world/
23. Y. Padioleau, J. L. Lawall, and G. Muller. Understanding collateral evolution in linux device drivers. In Proceedings of the 1st ACM SIGOPS/EuroSys European Conference on Computer Systems. pp. 59-71.
24. KVM. [Online]. Available: http://www.linux-kvm.org/page/Main_Page
25. J. Kreps, N. Narkhede, and J. Rao. "Kafka: A distributed messaging system for log processing." In Proceedings of 6th International Workshop on Networking Meets Databases (NetDB), Athens, Greece. 2011.
26. ElasticSearch. RESTful, distributed search and analystics. [Online]. Available: https://www.elastic.co/products/elasticsearch
27. A. Białecki, R. Muir, and G. Ingersoll. "Apache lucene 4." In SIGIR 2012 workshop on open source information retrieval, pp. 17-24. 2012.
28. M. F. Linux Rootkit Implementation. [Online]. Available: http://average- coder.blogspot.com/2011/12/linux- rootkit.html
29. S. Bahram, X. Jiang, Z. Wang, M. Grace, J. Li, D. Srinivasan,J. Rhee, and D. Xu. DKSM: Subverting Virtual Machine Introspection for Fun and Profit. In SRDS, pages 82 –91, 2010.
30. S. Vogl. A bottom-up Approach to VMI-based Kernel-level Rootkit Detection. PhD Thesis, Technische Unversitat, Munchen, 2010.

12
31. Y. Liu, Y. Xia, H. Guan, B. Zang, and H. Chen. Concurrent and consistent virtual machine introspection with hardware transactional memory. In High Performance Computer Architecture (HPCA), 2014 IEEE 20th International Symposium on , vol., no., pp.416,427, 15-19 Feb. 2014.
32. Dell VKernel. Virtualization Management Index. [Online]. Available: http: //www.vkernel.com/files/docs/white-papers/ virtualization-management-index-report.pdf
33. VMWare. [Online]. Available: Get Low Total-Cost-of-Ownership (TCO) with Maximum Virtual Machine Density. http://www.vmware.com/virtualization/ advantages/total-cost.
34. A. Kopytov. SysBench: System performance benchmark. [Online]. Available: http://sysbench.sourceforge.net.
35. K. Shvachko, H. Kuang, S. Radia, and R. Chansler. The Hadoop Distributed File System. In Proceedings of the 2010 IEEE 26th Symposium on Mass Storage Systems and Technologies (MSST), pp. 1–10, 2010.
Bios Sahil Suneja University of Toronto, CANADA ([email protected]). Mr. Suneja is a Ph.D. student working with Dr. Eyal de Lara in the Computer Science Department at University of Toronto. He received his B.Tech and M. Tech degrees from Indian Institute of Technology Kanpur in 2010. In the past, he has interned at Microsoft Research Redmond in 2008 (Networking Research Group), Microsoft Research India in 2011 (Mobility, Networks and Systems Group), and IBM Research T.J. Watson NY in 2012 and 2013 (Virtualization Runtime & Tools Group). Canturk Isci IBM Research Division, Thomas J. Watson Research Center, Yorktown Heights, NY 10598 USA ([email protected]). Dr. Isci is a Research Staff Member in the Cloud Computing Division at the IBM T. J. Watson Research Center, where he leads the Scalable Data Center Analytics team in Research and the Operational Analytics Squad within IBM Cloud Services. His research interests are cloud computing, operational and devops analytics, novel monitoring techniques based on virtualization and containerization, and energy-efficient computing techniques at various computing abstractions, from microarchitectures to data centers. He received a B.S. degree in electrical engineering from Bilkent University, an M.Sc. degree with distinction in VLSI System Design from University of Westminster, and a Ph.D. degree in computer engineering from Princeton University. Ricardo Koller IBM Research T.J. Watson, NY ([email protected]). Dr. Koller is a Research Staff Member at IBM interested in systems in general, and currently working on system monitoring and analytics. He received his Ph.D. from Florida International University under the guidance of Dr. Raju Rangaswami, where he worked on storage systems optimizations. After graduating in 2012, he worked for 2 years at VMware in the live migration team, specially focusing on long distance migrations. Eyal de Lara University of Toronto, CANADA ([email protected]). Dr. de Lara is a Professor in the Department of Computer Science at the University of Toronto. He received his

13
Ph.D. and M.Sc. from Rice University in 2002 and 1999, and a B.Sc. from Tecnologico de Monterrey in 1995. His research interests include distributed systems and mobile computing. His research has been recognized with an IBM Faculty Award and the Canadian Association of Computer Science Outstanding Young Computer Science Researcher Prize. Figures and Tables
Figure 1 Near Field Monitoring (NFM) architecture. The red arrows represent the deployment flow, and the blue ones show the monitored data flow. Refer to Section 4 for details.

14
Figure 2 Memory utilization by containers clustered by host for a set of 200 containers running in 5 cloud hosts. Container IDs are shown as ‘cxxx’ when space permits.
15
Figure 3 VMI inconsistency occurrence probabilities for a fork heavy workload. Different categories on the X-axis signify the state of an in-VM process when its data structures are being interpreted from outside. Refer to subsection ‘Consistency’ in Section 5.
the strength of agentless VM monitoring: Topology Dis-covery, which illustrates the potential for cloud analyticsby mapping the network flows between applications run-ning on different VMs; RConsole, a shell-like tool thatsupport realtime fine grain resource and security moni-toring; a system that monitors VM integrity over time;and, a paging-aware virus scanner that greatly outper-forms its in-VM counterpart.
2 Motivation: Challenges with Agent Ap-proach in Cloud
In addition to running customer workloads, datacenteroperation requires the execution of a variety of manage-ment, monitoring and analytics tasks that track the healthof the system and ensure the efficient operation of the in-frastructure. Some examples include:• Resource Monitoring- Runtime tracking of system-wide and per-process VM’s resources - CPU, memory,network and disk.
• Compliance Conformity- Ensuring policy compli-ance such as patch levels, network and security con-figurations, detecting blacklisted applications, etc.
• VM Sizing and Consolidation- Tracking and cross-mapping application-level resource demands with VMconfiguration and demand to detect VM resizing re-quirements or opportunities, and guiding VM consoli-dation with application-level resource requirements.
• Anomaly Detection- Monitoring to detect (i) Rougeprocesses, (ii) System thrashing, such as via process’memory usage patterns or swap daemon’s activity, (iii)Bottleneck nodes or spurious connections.
• Cluster Patch Management- Identifying tightly cou-pled clusters for parallel patching to minimize overallservice for distributed applications.
• Inter-VM Network Topology- Cluster-level analyt-ics for discovering communicating VMs, which canbe used to guide VM placement to optimize networkutilization.
• Security Scanning- Searching for signatures ofknown viruses or malware.
Even in modern virtualized data centers, the main-tenance methodology employed is still the traditionalagent-based approach, requiring installation of multiplemonitoring agents within each VM, with the agents usu-ally being re-purposed versions of those originally de-veloped for managing physical systems. Unfortunately,these traditional monitoring techniques face several chal-lenges in the modern virtualized setting:Availability: Many of the monitoring solutions rely onVMs to be online, networked and to have passed certainconfiguration and compliance prerequisites. As VMs be-
Figure 1: Overhead on main VM due to agents on colocated VMs
have more like transient processes in the cloud, the tradi-tional techniques are left only with intermittent observa-tions leading to incomplete system views and incorrectdeductions.Manageability: With increasing VM proliferation andapplication diversity, the provisioning and continuousmaintenance and update of the in-VM components forthe wide range of solutions poses a major challenge foradministrators.Inaccurate Knowledge: In-VM techniques are furthersusceptible to potentially unreliable and inaccurate viewof the system and its resource use characteristics, asthe guest view of its environment and resources candeviate substantially from reality. For example, priorstudies [13, 21] show that different ”identical” smallEC2 instances have different CPU and IO characteristics.This unpredictable variability affects the reliability of aguest’s and an agent’s view of resource availability. Thisinaccuracy of traditional tools for VM resource monitor-ing is also demonstrated in [4] that proposes alternativecloud monitoring, such as Amazon’s CloudWatch [2].Limited Knowledge: An agent running inside a VMhas limited knowledge about the status of the system.For example, ‘Compliance storms’ are sometimes pos-sible, when large numbers of VMs simultaneously be-gin their conformity-check processes, swamping the pos-sibly already heavily utilized hardware resources underhigh consolidation scenarios.Security Vulnerability: Agents introduce securitymonoculture vulnerability in data centers owing to VMhomogeneity. Also, prior work [26] shows that a cloudprovider cannot trust the guest VMs to install its securitysolutions inside them.Limited Scalability: With consolidation, multiple VMsare mapped onto each host. Recent studies [42, 15] reportaverage VM densities between 16-29 VMs/host, whereall the colocated VMs compete for the shared physicalresources. The monitoring processes within the VMsalso compete for the same resources, and with increas-ing consolidation, they begin to have a noticeable impacton the performance of the system as a whole.Figure 1 illustrates the effect that monitoring has on
a VM (A) running a CPU-intensive task that computesprime numbers [31]. The plot shows two configurations:
2
Figure 4 Overhead on main VM due to agents on colocated VMs