Embed Size (px)
DESCRIPTION
Tourism Comfort Indexes: from observations to RCMs. Ghislain Dubois Roma, 9 July 2013. http://www.climrun.eu. - - TCI, a common concern of tourism case studies - On going activities -Reporting and dissemination activities. TCI, a common concern for WP5. - PowerPoint PPT Presentation
Citation preview

Tourism Comfort Indexes: from observations to RCMs
Ghislain DuboisRoma, 9 July 2013
http://www.climrun.eu

-
- TCI, a common concern of tourism case studies
- On going activities
-Reporting and dissemination activities

TCI, a common concern for WP5
The only specific tourism climate product
Reference definition by Mieczkowski (1985)
TCI = 2 x [(4 x CID) + CIA + (2 x P) + (2 x S) + W]
Where CID: index of thermal comfort during the day (° C). CIA: daily thermal comfort index (° C). P: Total monthly rainfall (mm). S: sunshine (h / day). W: wind speed (km / h).
Many other definitions and formula ! (beach TCI, urban HCI…)
Highlighted by WP5 workshops and interviews as a common, topic of interest, dedicated workshop in Marseille, September 2012

Tunisia : survey (new formula) + calculation (station data)Ongoing activities
0
20
40
60
80
100
J F M A M J J A S O N D
%
Monastir (Balnéaire)
pays froids Europe de l'ouest Maghreb
0
20
40
60
80
100
J F M A M J J A S O N D
%
Jerba (Balnéaire)
pays froids Europe de l'ouest Maghreb
Tozeur (Saharien)
0102030405060708090
100
J F M A M J J A S O N D
%
Kébili (Saharien)
0102030405060708090
100
J F M A M J J A S O N D
%
0
20
40
60
80
100
J F M A M J J A S O N D
%
Tunis (Balnéaire)
pays froid Europe occidentale Maghreb
0
20
40
60
80
100
J F M A M J J A S O N D
%
Nabeul (Balnéaire)
pays froid Europe occidentale Maghreb
Tabarka (Balnéaire)
0102030405060708090
100
J F M A M J J A S O N D
%
Figure 1 : Monthly frequency comfortable and very comfortable days for Saharan and beach tourism (For the beach, the colors represent the origin of tourists by groups of emitters)
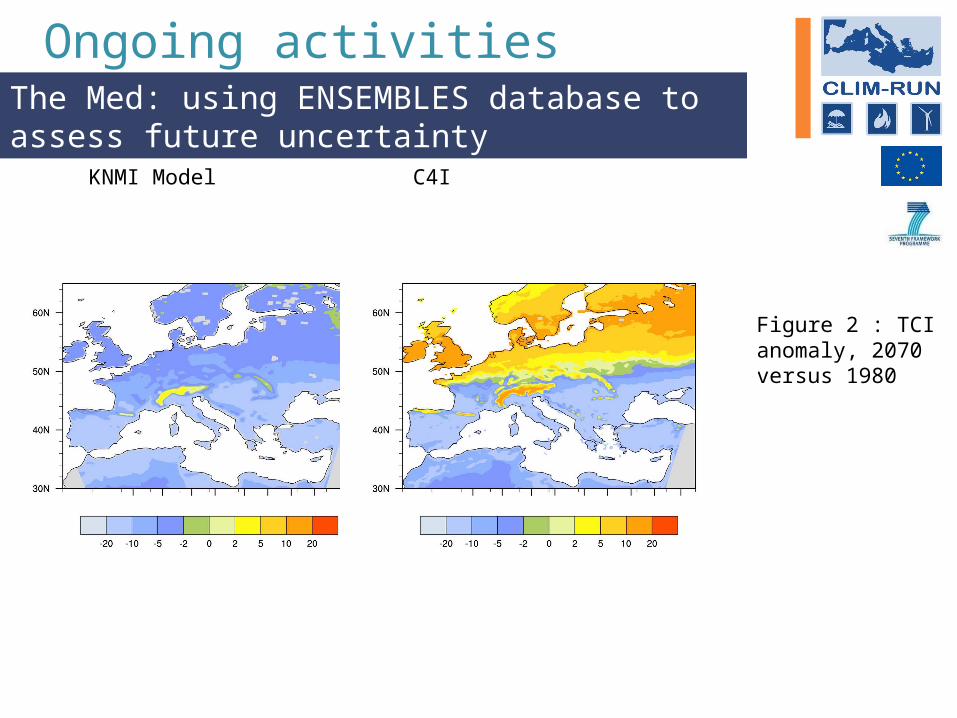
The Med: using ENSEMBLES database to assess future uncertainty
Ongoing activities
Figure 2 : TCI anomaly, 2070 versus 1980
KNMI Model C4I

Savoie : downscaling TCIOngoing activities
Part of D3.5 « Downscaling non typical climate parameters »
Interest for a better presentation of geographical differences (altitude, ?)
Computation of TCI using SAFRAN. Several methods Monthly data (reference year ?) Daily data averaged per month (reference year ?) Monthly data, average of 1980-2009 period
Downscaling using station data
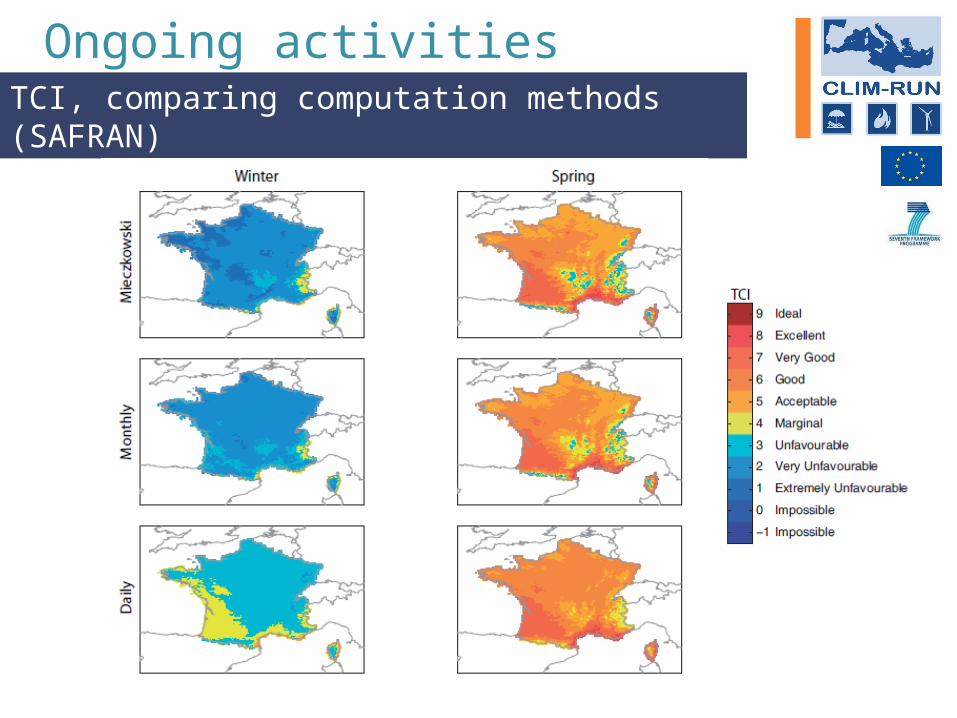
TCI, comparing computation methods (SAFRAN)
Ongoing activities

Reporting and dissemination
Will be part of D5.3 (WP5 report)
A common paper in preparation