Embed Size (px)
Citation preview
1
Tourism Kelowna Visitor Intercept Survey Findings by Season FINAL DRAFT REPORT January 17, 2017
2
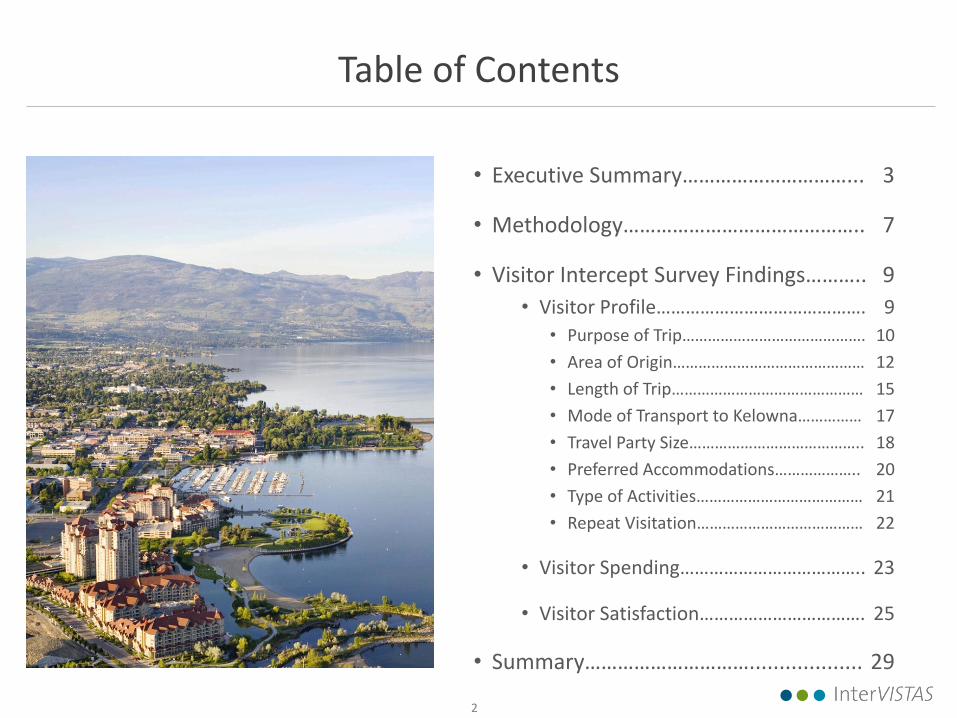
Table of Contents
• Executive Summary…………………………... 3
• Methodology…………………………………….. 7
• Visitor Intercept Survey Findings……….. 9
• Visitor Profile……………………………………. 9
• Purpose of Trip……………………………………. 10
• Area of Origin……………………………………… 12
• Length of Trip……………………………………… 15
• Mode of Transport to Kelowna…………… 17
• Travel Party Size………………………………….. 18
• Preferred Accommodations……………….. 20
• Type of Activities………………………………… 21
• Repeat Visitation………………………………… 22
• Visitor Spending……………………………….. 23
• Visitor Satisfaction……………………………. 25
• Summary…………………………................... 29
3
Executive Summary
4
Executive Summary
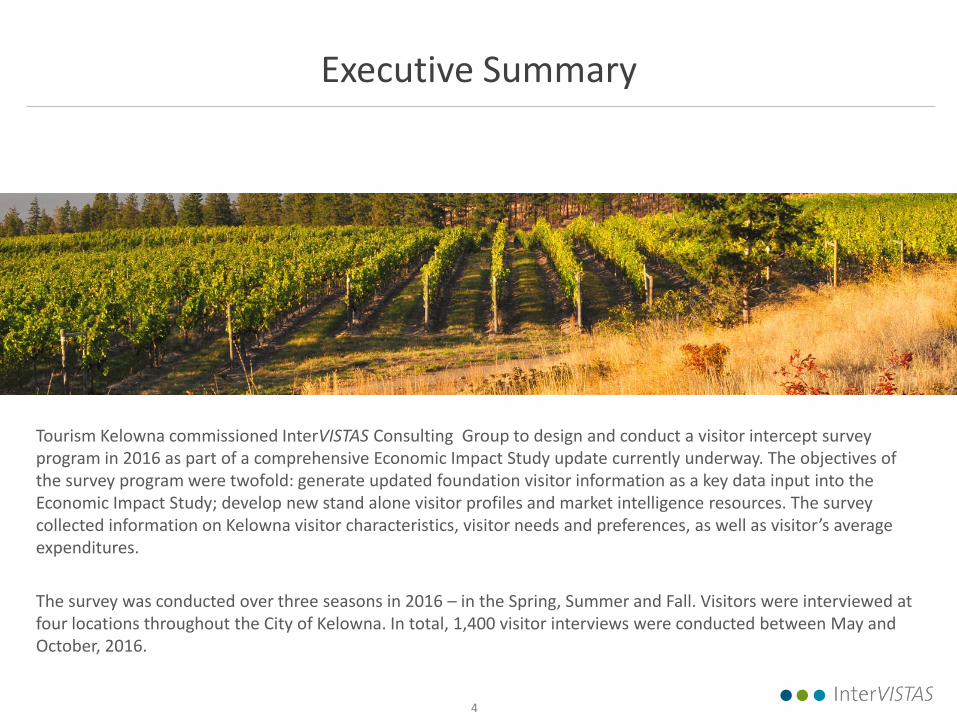
Tourism Kelowna commissioned InterVISTAS Consulting Group to design and conduct a visitor intercept survey program in 2016 as part of a comprehensive Economic Impact Study update currently underway. The objectives of the survey program were twofold: generate updated foundation visitor information as a key data input into the Economic Impact Study; develop new stand alone visitor profiles and market intelligence resources. The survey collected information on Kelowna visitor characteristics, visitor needs and preferences, as well as visitor’s average expenditures.
The survey was conducted over three seasons in 2016 – in the Spring, Summer and Fall. Visitors were interviewed at four locations throughout the City of Kelowna. In total, 1,400 visitor interviews were conducted between May and October, 2016.
5
Executive Summary
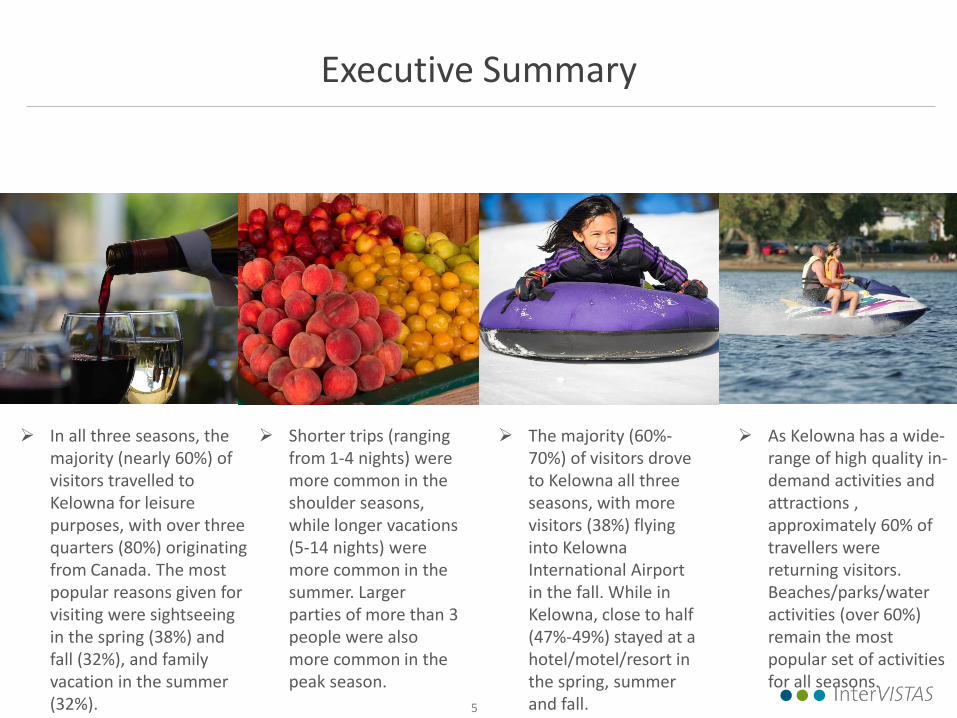
In all three seasons, the majority (nearly 60%) of visitors travelled to Kelowna for leisure purposes, with over three quarters (80%) originating from Canada. The most popular reasons given for visiting were sightseeing in the spring (38%) and fall (32%), and family vacation in the summer (32%).
Shorter trips (ranging from 1-4 nights) were more common in the shoulder seasons, while longer vacations (5-14 nights) were more common in the summer. Larger parties of more than 3 people were also more common in the peak season.
The majority (60%-70%) of visitors drove to Kelowna all three seasons, with more visitors (38%) flying into Kelowna International Airport in the fall. While in Kelowna, close to half (47%-49%) stayed at a hotel/motel/resort in the spring, summer and fall.
As Kelowna has a wide-range of high quality in-demand activities and attractions , approximately 60% of travellers were returning visitors. Beaches/parks/water activities (over 60%) remain the most popular set of activities for all seasons.
6
Executive Summary
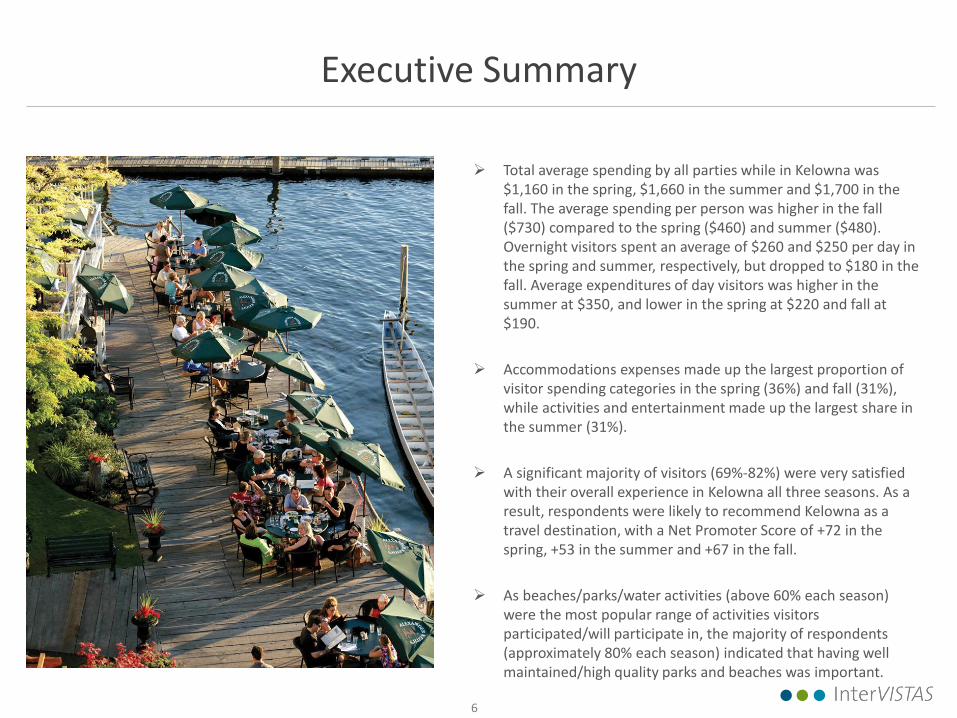
Total average spending by all parties while in Kelowna was $1,160 in the spring, $1,660 in the summer and $1,700 in the fall. The average spending per person was higher in the fall ($730) compared to the spring ($460) and summer ($480). Overnight visitors spent an average of $260 and $250 per day in the spring and summer, respectively, but dropped to $180 in the fall. Average expenditures of day visitors was higher in the summer at $350, and lower in the spring at $220 and fall at $190.
Accommodations expenses made up the largest proportion of visitor spending categories in the spring (36%) and fall (31%), while activities and entertainment made up the largest share in the summer (31%).
A significant majority of visitors (69%-82%) were very satisfied with their overall experience in Kelowna all three seasons. As a result, respondents were likely to recommend Kelowna as a travel destination, with a Net Promoter Score of +72 in the spring, +53 in the summer and +67 in the fall.
As beaches/parks/water activities (above 60% each season) were the most popular range of activities visitors participated/will participate in, the majority of respondents (approximately 80% each season) indicated that having well maintained/high quality parks and beaches was important.
7
Methodology
8
Methodology
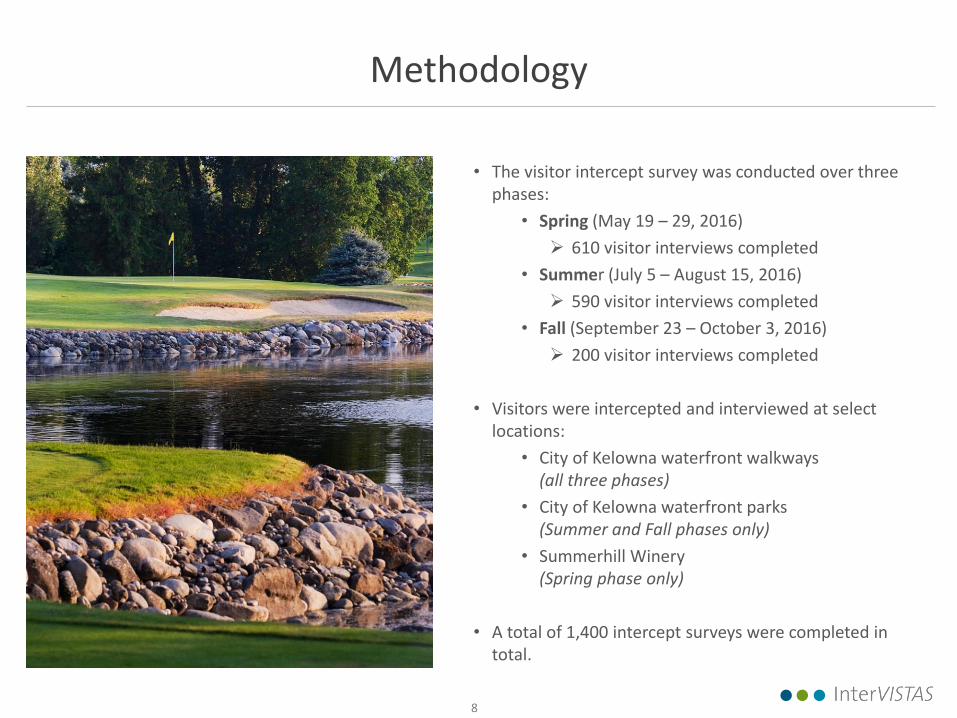
• The visitor intercept survey was conducted over three phases:
• Spring (May 19 – 29, 2016)
610 visitor interviews completed
• Summer (July 5 – August 15, 2016)
590 visitor interviews completed
• Fall (September 23 – October 3, 2016)
200 visitor interviews completed
• Visitors were intercepted and interviewed at select locations:
• City of Kelowna waterfront walkways (all three phases)
• City of Kelowna waterfront parks (Summer and Fall phases only)
• Summerhill Winery (Spring phase only)
• A total of 1,400 intercept surveys were completed in total.

9
Visitor Intercept Survey Findings: Visitor Profile
10
Purpose of Trip
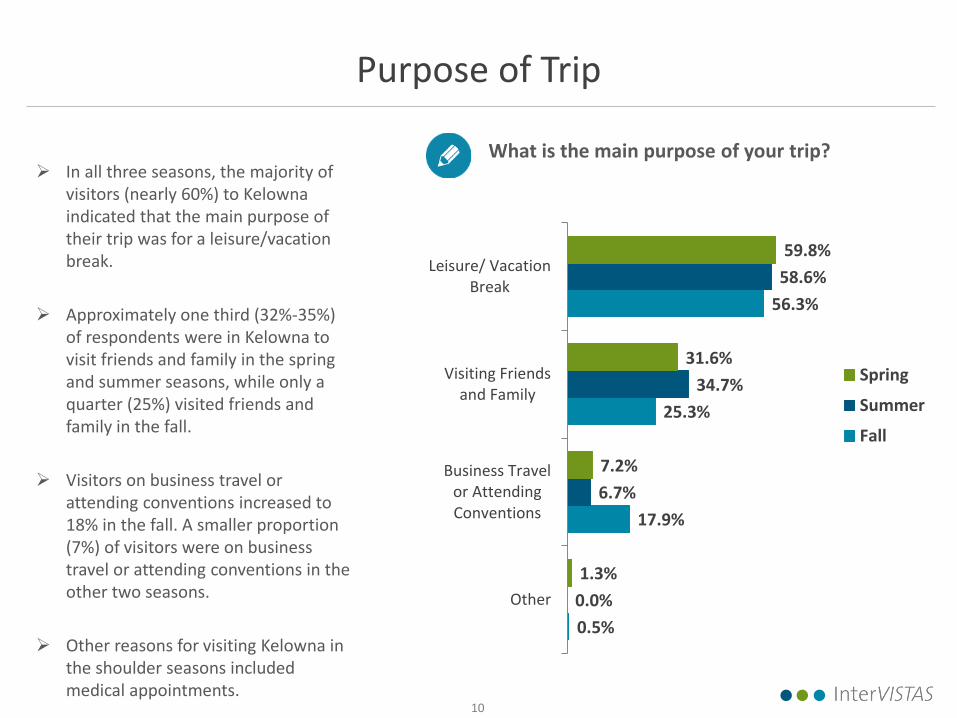
In all three seasons, the majority of visitors (nearly 60%) to Kelowna indicated that the main purpose of their trip was for a leisure/vacation break.
Approximately one third (32%-35%) of respondents were in Kelowna to visit friends and family in the spring and summer seasons, while only a quarter (25%) visited friends and family in the fall.
Visitors on business travel or attending conventions increased to 18% in the fall. A smaller proportion (7%) of visitors were on business travel or attending conventions in the other two seasons.
Other reasons for visiting Kelowna in the shoulder seasons included medical appointments.
0.5%
17.9%
25.3%
56.3%
0.0%
6.7%
34.7%
58.6%
1.3%
7.2%
31.6%
59.8%
Other
Business Travelor AttendingConventions
Visiting Friendsand Family
Leisure/ VacationBreak
Spring
Summer
Fall
What is the main purpose of your trip?
11
Purpose of Trip
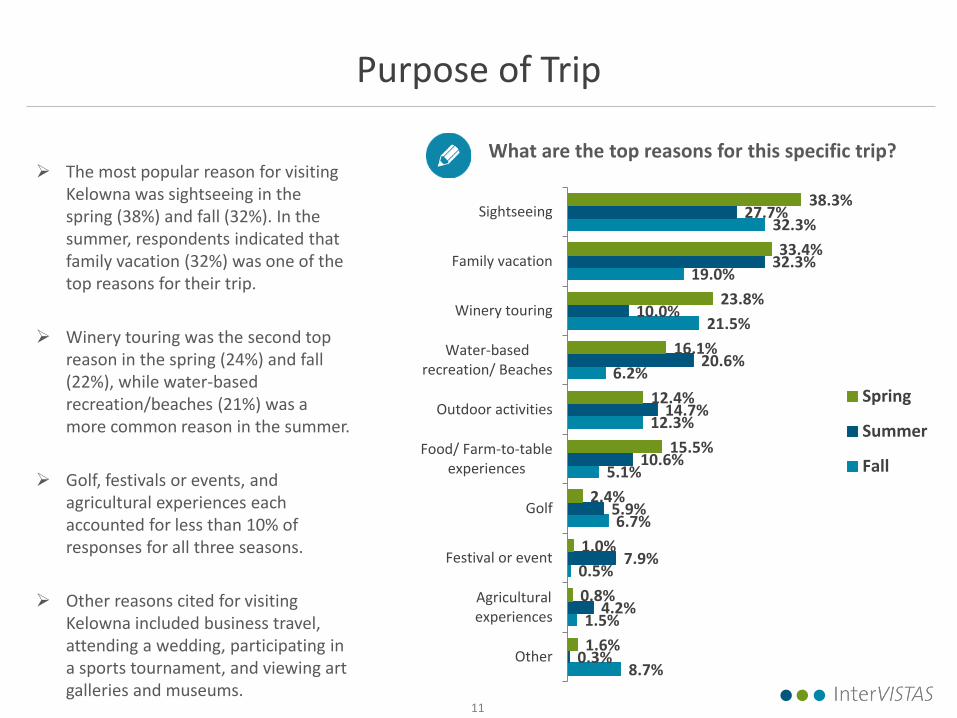
The most popular reason for visiting Kelowna was sightseeing in the spring (38%) and fall (32%). In the summer, respondents indicated that family vacation (32%) was one of the top reasons for their trip.
Winery touring was the second top reason in the spring (24%) and fall (22%), while water-based recreation/beaches (21%) was a more common reason in the summer.
Golf, festivals or events, and agricultural experiences each accounted for less than 10% of responses for all three seasons.
Other reasons cited for visiting Kelowna included business travel, attending a wedding, participating in a sports tournament, and viewing art galleries and museums.
8.7%
1.5%
0.5%
6.7%
5.1%
12.3%
6.2%
21.5%
19.0%
32.3%
0.3%
4.2%
7.9%
5.9%
10.6%
14.7%
20.6%
10.0%
32.3%
27.7%
1.6%
0.8%
1.0%
2.4%
15.5%
12.4%
16.1%
23.8%
33.4%
38.3%
Other
Agriculturalexperiences
Festival or event
Golf
Food/ Farm-to-tableexperiences
Outdoor activities
Water-basedrecreation/ Beaches
Winery touring
Family vacation
Sightseeing
Spring
Summer
Fall
What are the top reasons for this specific trip?
12
Area of Origin
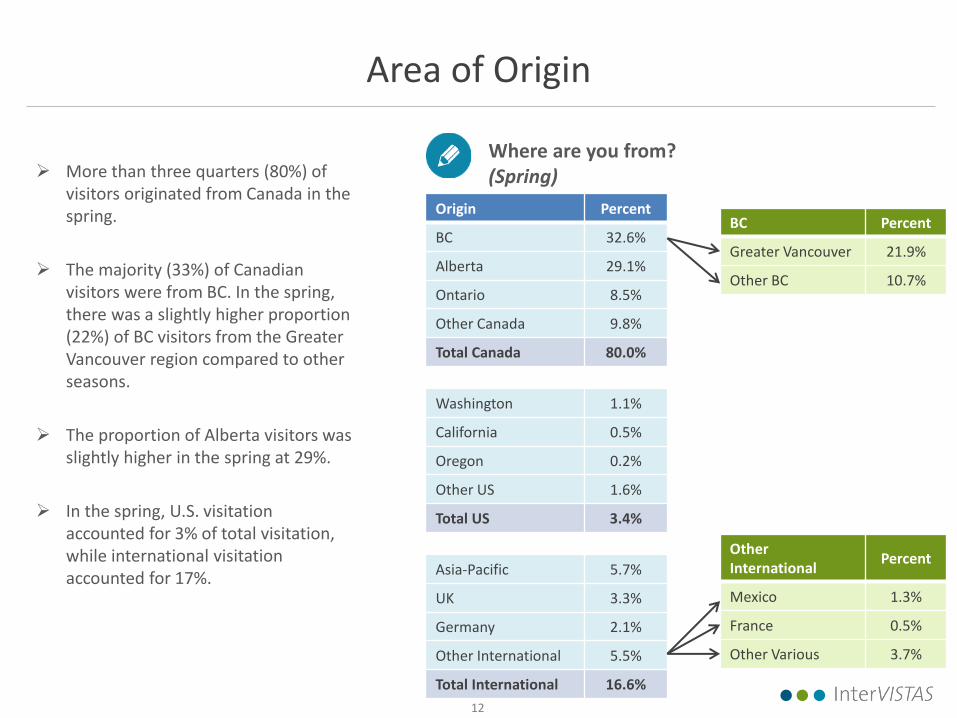
More than three quarters (80%) of visitors originated from Canada in the spring.
The majority (33%) of Canadian visitors were from BC. In the spring, there was a slightly higher proportion (22%) of BC visitors from the Greater Vancouver region compared to other seasons.
The proportion of Alberta visitors was slightly higher in the spring at 29%.
In the spring, U.S. visitation accounted for 3% of total visitation, while international visitation accounted for 17%.
Origin Percent
BC 32.6%
Alberta 29.1%
Ontario 8.5%
Other Canada 9.8%
Total Canada 80.0%
Washington 1.1%
California 0.5%
Oregon 0.2%
Other US 1.6%
Total US 3.4%
Asia-Pacific 5.7%
UK 3.3%
Germany 2.1%
Other International 5.5%
Total International 16.6%
Where are you from? (Spring)
BC Percent
Greater Vancouver 21.9%
Other BC 10.7%
Other International
Percent
Mexico 1.3%
France 0.5%
Other Various 3.7%
13
Area of Origin
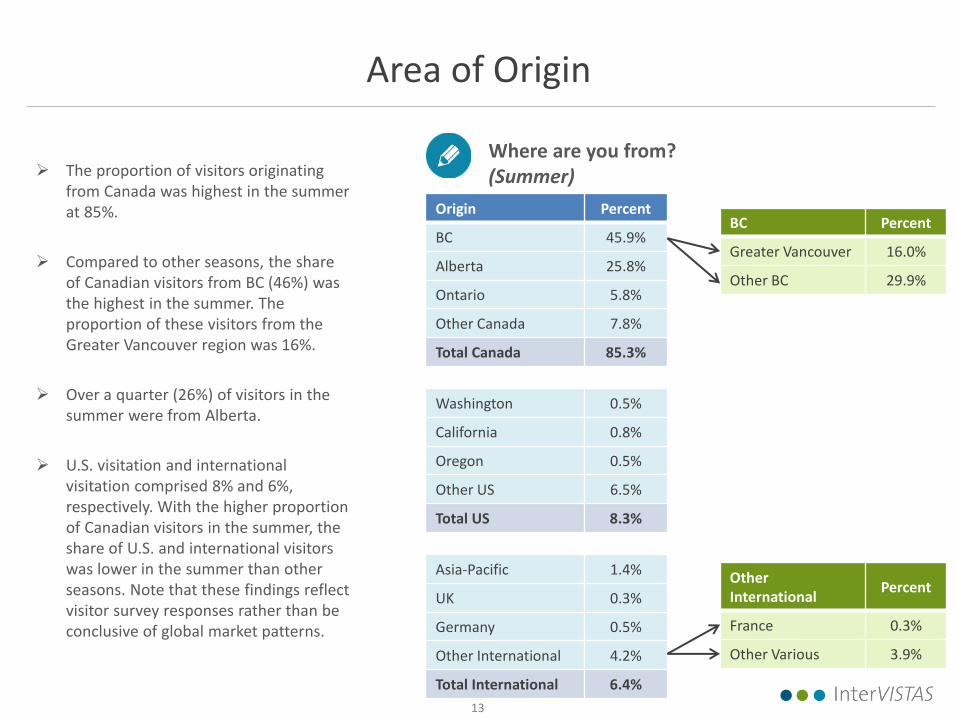
The proportion of visitors originating from Canada was highest in the summer at 85%.
Compared to other seasons, the share of Canadian visitors from BC (46%) was the highest in the summer. The proportion of these visitors from the Greater Vancouver region was 16%.
Over a quarter (26%) of visitors in the summer were from Alberta.
U.S. visitation and international visitation comprised 8% and 6%, respectively. With the higher proportion of Canadian visitors in the summer, the share of U.S. and international visitors was lower in the summer than other seasons. Note that these findings reflect visitor survey responses rather than be conclusive of global market patterns.
Origin Percent
BC 45.9%
Alberta 25.8%
Ontario 5.8%
Other Canada 7.8%
Total Canada 85.3%
Washington 0.5%
California 0.8%
Oregon 0.5%
Other US 6.5%
Total US 8.3%
Asia-Pacific 1.4%
UK 0.3%
Germany 0.5%
Other International 4.2%
Total International 6.4%
Where are you from? (Summer)
BC Percent
Greater Vancouver 16.0%
Other BC 29.9%
Other International
Percent
France 0.3%
Other Various 3.9%
14
Area of Origin
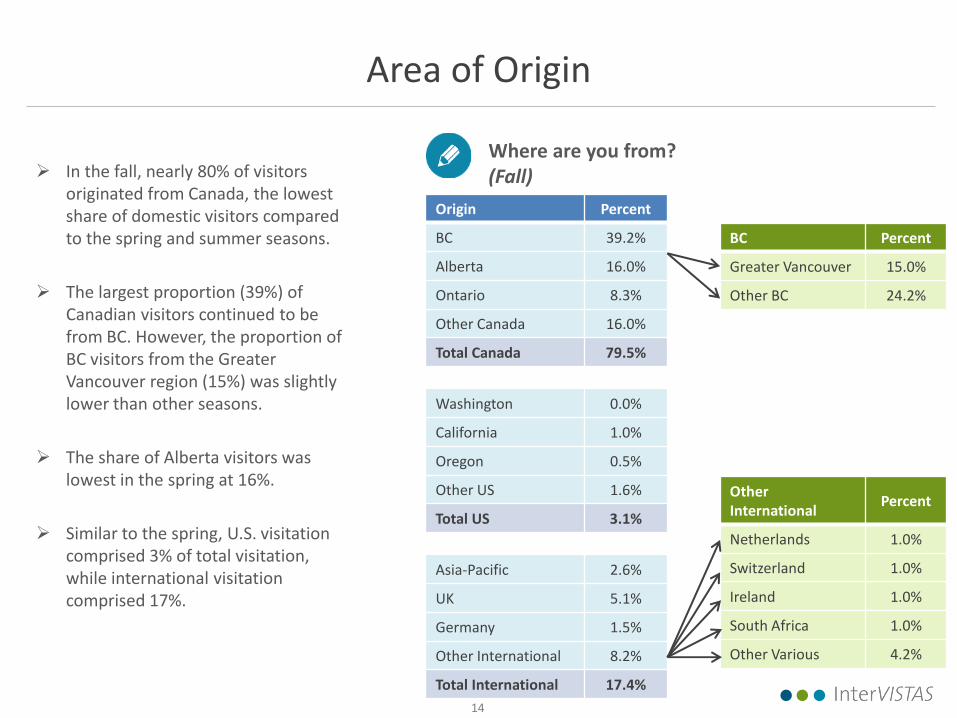
In the fall, nearly 80% of visitors originated from Canada, the lowest share of domestic visitors compared to the spring and summer seasons.
The largest proportion (39%) of Canadian visitors continued to be from BC. However, the proportion of BC visitors from the Greater Vancouver region (15%) was slightly lower than other seasons.
The share of Alberta visitors was lowest in the spring at 16%.
Similar to the spring, U.S. visitation comprised 3% of total visitation, while international visitation comprised 17%.
Origin Percent
BC 39.2%
Alberta 16.0%
Ontario 8.3%
Other Canada 16.0%
Total Canada 79.5%
Washington 0.0%
California 1.0%
Oregon 0.5%
Other US 1.6%
Total US 3.1%
Asia-Pacific 2.6%
UK 5.1%
Germany 1.5%
Other International 8.2%
Total International 17.4%
Where are you from? (Fall)
BC Percent
Greater Vancouver 15.0%
Other BC 24.2%
Other International
Percent
Netherlands 1.0%
Switzerland 1.0%
Ireland 1.0%
South Africa 1.0%
Other Various 4.2%
15
Length of Trip: Overall Time Away
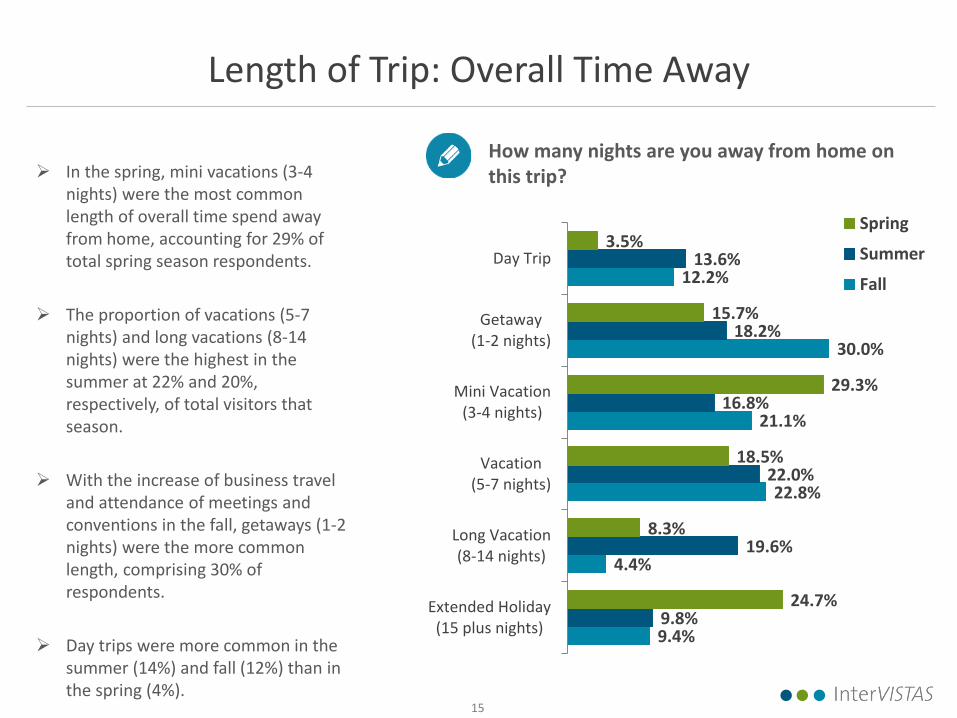
In the spring, mini vacations (3-4 nights) were the most common length of overall time spend away from home, accounting for 29% of total spring season respondents.
The proportion of vacations (5-7 nights) and long vacations (8-14 nights) were the highest in the summer at 22% and 20%, respectively, of total visitors that season.
With the increase of business travel and attendance of meetings and conventions in the fall, getaways (1-2 nights) were the more common length, comprising 30% of respondents.
Day trips were more common in the summer (14%) and fall (12%) than in the spring (4%).
9.4%
4.4%
22.8%
21.1%
30.0%
12.2%
9.8%
19.6%
22.0%
16.8%
18.2%
13.6%
24.7%
8.3%
18.5%
29.3%
15.7%
3.5%
Extended Holiday(15 plus nights)
Long Vacation(8-14 nights)
Vacation(5-7 nights)
Mini Vacation(3-4 nights)
Getaway(1-2 nights)
Day Trip
Spring
Summer
Fall
How many nights are you away from home on this trip?
16
Length of Trip: Nights in Kelowna
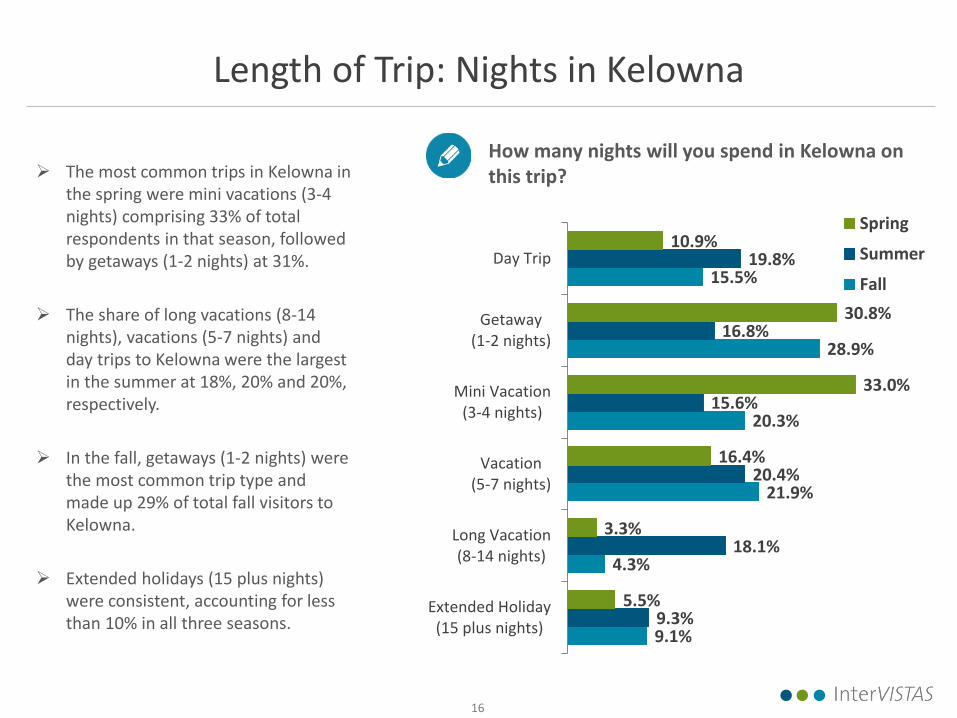
The most common trips in Kelowna in the spring were mini vacations (3-4 nights) comprising 33% of total respondents in that season, followed by getaways (1-2 nights) at 31%.
The share of long vacations (8-14 nights), vacations (5-7 nights) and day trips to Kelowna were the largest in the summer at 18%, 20% and 20%, respectively.
In the fall, getaways (1-2 nights) were the most common trip type and made up 29% of total fall visitors to Kelowna.
Extended holidays (15 plus nights) were consistent, accounting for less than 10% in all three seasons.
9.1%
4.3%
21.9%
20.3%
28.9%
15.5%
9.3%
18.1%
20.4%
15.6%
16.8%
19.8%
5.5%
3.3%
16.4%
33.0%
30.8%
10.9%
Extended Holiday(15 plus nights)
Long Vacation(8-14 nights)
Vacation(5-7 nights)
Mini Vacation(3-4 nights)
Getaway(1-2 nights)
Day Trip
Spring
Summer
Fall
How many nights will you spend in Kelowna on this trip?
17
Mode of Transport to Kelowna
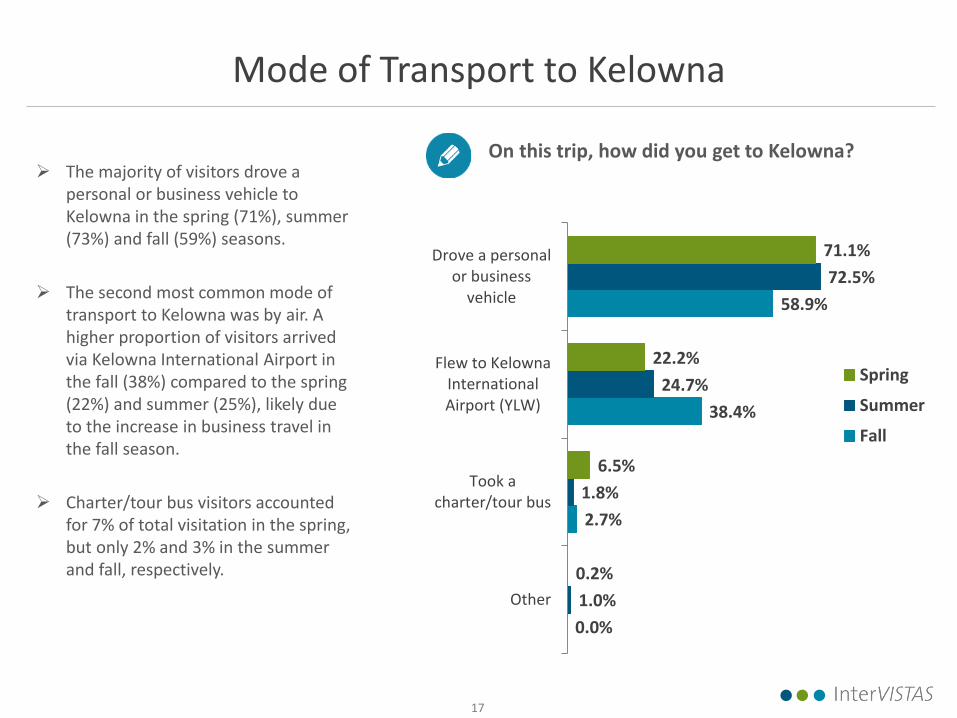
The majority of visitors drove a personal or business vehicle to Kelowna in the spring (71%), summer (73%) and fall (59%) seasons.
The second most common mode of transport to Kelowna was by air. A higher proportion of visitors arrived via Kelowna International Airport in the fall (38%) compared to the spring (22%) and summer (25%), likely due to the increase in business travel in the fall season.
Charter/tour bus visitors accounted for 7% of total visitation in the spring, but only 2% and 3% in the summer and fall, respectively.
0.0%
2.7%
38.4%
58.9%
1.0%
1.8%
24.7%
72.5%
0.2%
6.5%
22.2%
71.1%
Other
Took acharter/tour bus
Flew to KelownaInternationalAirport (YLW)
Drove a personalor business
vehicle
Spring
Summer
Fall
On this trip, how did you get to Kelowna?
18
Travel Party Size
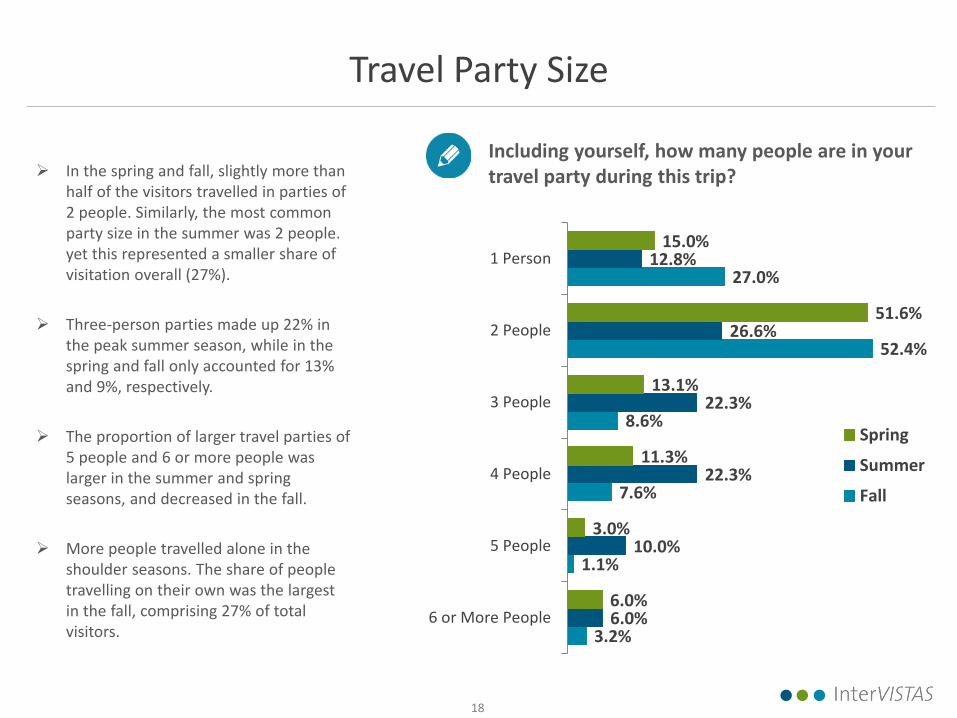
In the spring and fall, slightly more than half of the visitors travelled in parties of 2 people. Similarly, the most common party size in the summer was 2 people. yet this represented a smaller share of visitation overall (27%).
Three-person parties made up 22% in the peak summer season, while in the spring and fall only accounted for 13% and 9%, respectively.
The proportion of larger travel parties of 5 people and 6 or more people was larger in the summer and spring seasons, and decreased in the fall.
More people travelled alone in the shoulder seasons. The share of people travelling on their own was the largest in the fall, comprising 27% of total visitors.
3.2%
1.1%
7.6%
8.6%
52.4%
27.0%
6.0%
10.0%
22.3%
22.3%
26.6%
12.8%
6.0%
3.0%
11.3%
13.1%
51.6%
15.0%
6 or More People
5 People
4 People
3 People
2 People
1 Person
Spring
Summer
Fall
Including yourself, how many people are in your travel party during this trip?
19
Travel Party Type
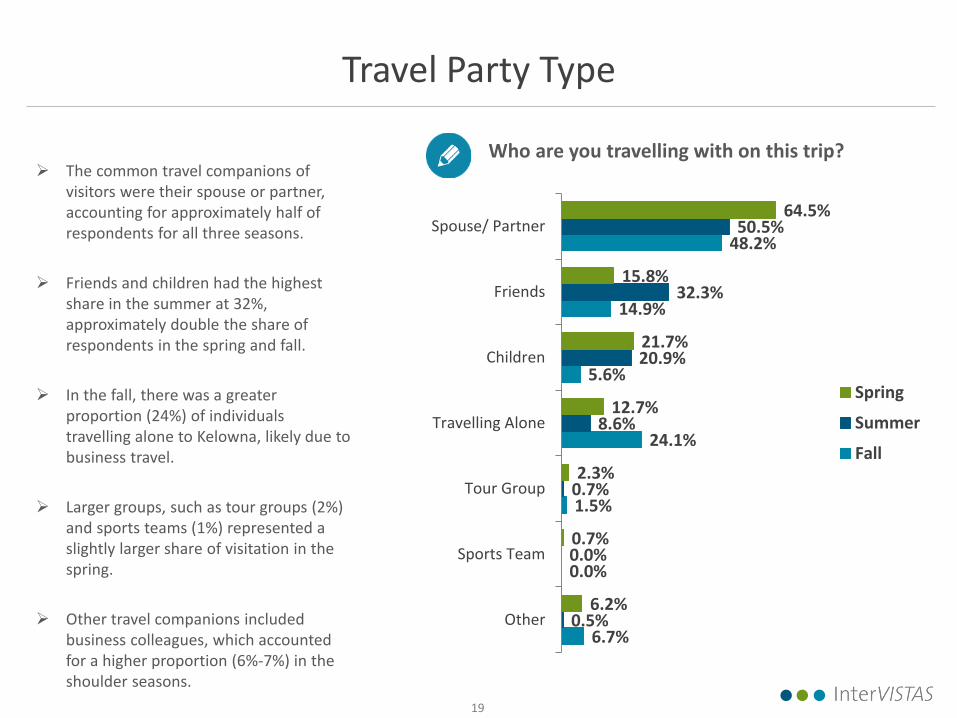
The common travel companions of visitors were their spouse or partner, accounting for approximately half of respondents for all three seasons.
Friends and children had the highest share in the summer at 32%, approximately double the share of respondents in the spring and fall.
In the fall, there was a greater proportion (24%) of individuals travelling alone to Kelowna, likely due to business travel.
Larger groups, such as tour groups (2%) and sports teams (1%) represented a slightly larger share of visitation in the spring.
Other travel companions included business colleagues, which accounted for a higher proportion (6%-7%) in the shoulder seasons.
6.7%
0.0%
1.5%
24.1%
5.6%
14.9%
48.2%
0.5%
0.0%
0.7%
8.6%
20.9%
32.3%
50.5%
6.2%
0.7%
2.3%
12.7%
21.7%
15.8%
64.5%
Other
Sports Team
Tour Group
Travelling Alone
Children
Friends
Spouse/ Partner
Spring
Summer
Fall
Who are you travelling with on this trip?
20
Preferred Accommodations
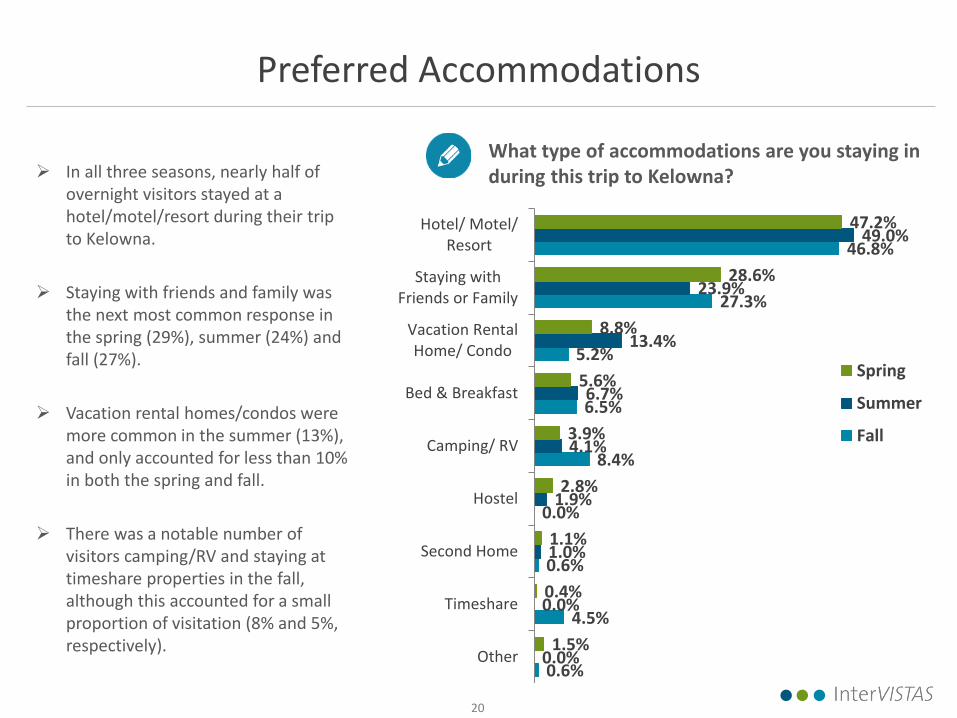
In all three seasons, nearly half of overnight visitors stayed at a hotel/motel/resort during their trip to Kelowna.
Staying with friends and family was the next most common response in the spring (29%), summer (24%) and fall (27%).
Vacation rental homes/condos were more common in the summer (13%), and only accounted for less than 10% in both the spring and fall.
There was a notable number of visitors camping/RV and staying at timeshare properties in the fall, although this accounted for a small proportion of visitation (8% and 5%, respectively).
0.6%
4.5%
0.6%
0.0%
8.4%
6.5%
5.2%
27.3%
46.8%
0.0%
0.0%
1.0%
1.9%
4.1%
6.7%
13.4%
23.9%
49.0%
1.5%
0.4%
1.1%
2.8%
3.9%
5.6%
8.8%
28.6%
47.2%
Other
Timeshare
Second Home
Hostel
Camping/ RV
Bed & Breakfast
Vacation RentalHome/ Condo
Staying withFriends or Family
Hotel/ Motel/Resort
Spring
Summer
Fall
What type of accommodations are you staying in during this trip to Kelowna?
21
Type of Activities Planned/Participated In
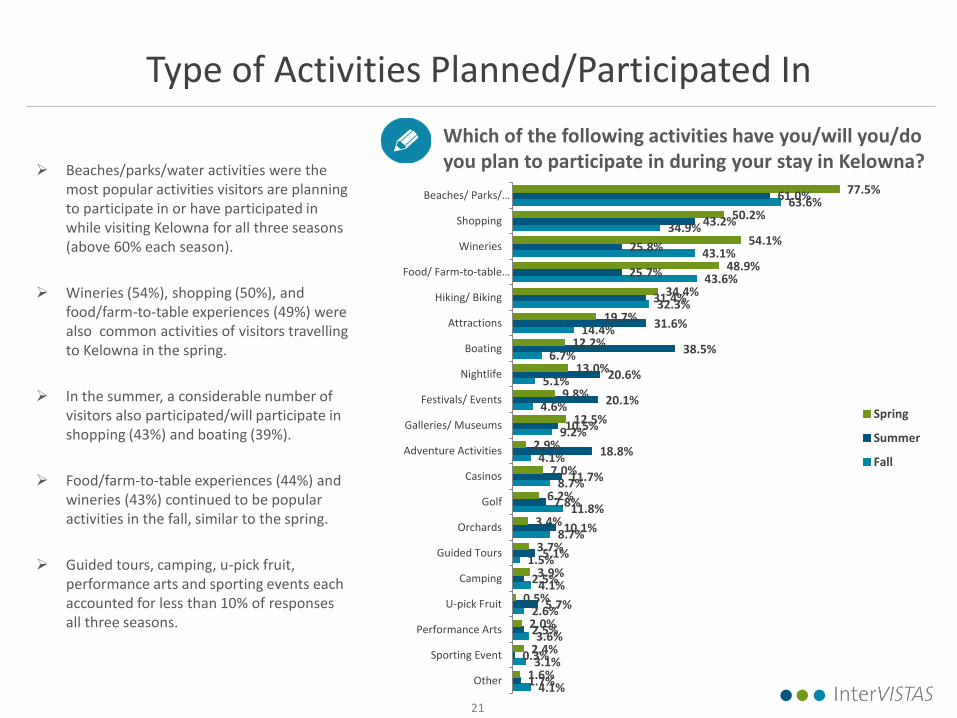
Beaches/parks/water activities were the most popular activities visitors are planning to participate in or have participated in while visiting Kelowna for all three seasons (above 60% each season).
Wineries (54%), shopping (50%), and food/farm-to-table experiences (49%) were also common activities of visitors travelling to Kelowna in the spring.
In the summer, a considerable number of visitors also participated/will participate in shopping (43%) and boating (39%).
Food/farm-to-table experiences (44%) and wineries (43%) continued to be popular activities in the fall, similar to the spring.
Guided tours, camping, u-pick fruit, performance arts and sporting events each accounted for less than 10% of responses all three seasons.
4.1%
3.1%
3.6%
2.6%
4.1%
1.5%
8.7%
11.8%
8.7%
4.1%
9.2%
4.6%
5.1%
6.7%
14.4%
32.3%
43.6%
43.1%
34.9%
63.6%
1.7%
0.3%
2.5%
5.7%
2.5%
5.1%
10.1%
7.8%
11.7%
18.8%
10.5%
20.1%
20.6%
38.5%
31.6%
31.4%
25.7%
25.8%
43.2%
61.0%
1.6%
2.4%
2.0%
0.5%
3.9%
3.7%
3.4%
6.2%
7.0%
2.9%
12.5%
9.8%
13.0%
12.2%
19.7%
34.4%
48.9%
54.1%
50.2%
77.5%
Other
Sporting Event
Performance Arts
U-pick Fruit
Camping
Guided Tours
Orchards
Golf
Casinos
Adventure Activities
Galleries/ Museums
Festivals/ Events
Nightlife
Boating
Attractions
Hiking/ Biking
Food/ Farm-to-table…
Wineries
Shopping
Beaches/ Parks/…
Spring
Summer
Fall
Which of the following activities have you/will you/do you plan to participate in during your stay in Kelowna?
22
Repeat Visitation
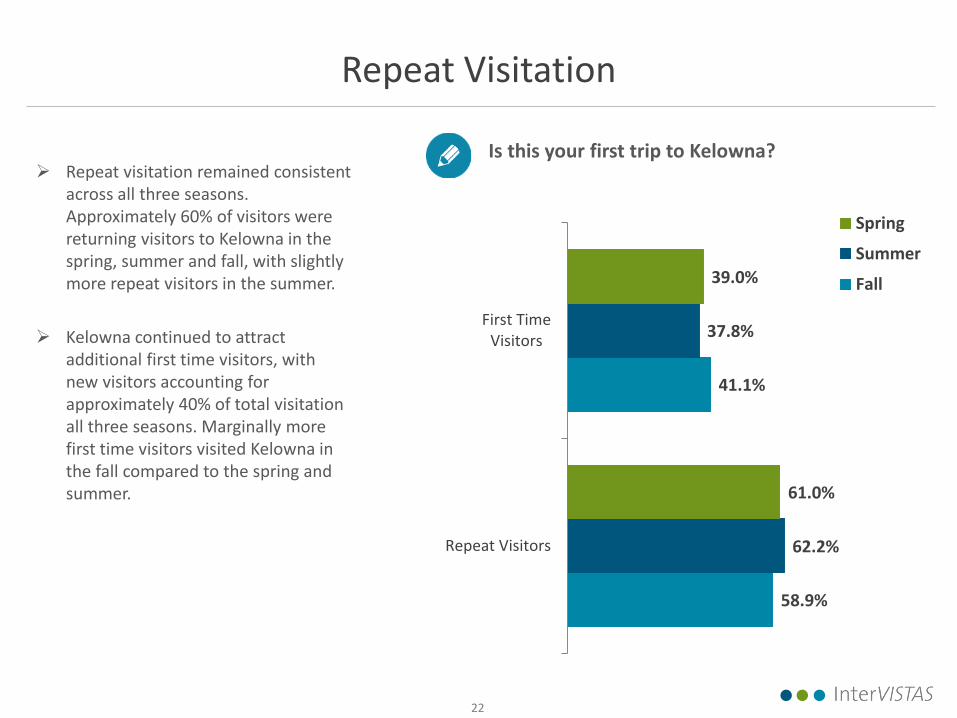
Repeat visitation remained consistent across all three seasons. Approximately 60% of visitors were returning visitors to Kelowna in the spring, summer and fall, with slightly more repeat visitors in the summer.
Kelowna continued to attract additional first time visitors, with new visitors accounting for approximately 40% of total visitation all three seasons. Marginally more first time visitors visited Kelowna in the fall compared to the spring and summer.
58.9%
41.1%
62.2%
37.8%
61.0%
39.0%
Repeat Visitors
First TimeVisitors
Spring
Summer
Fall
Is this your first trip to Kelowna?

23
Visitor Intercept Survey Findings: Visitor Spending
24
Average per Trip Spending per Party
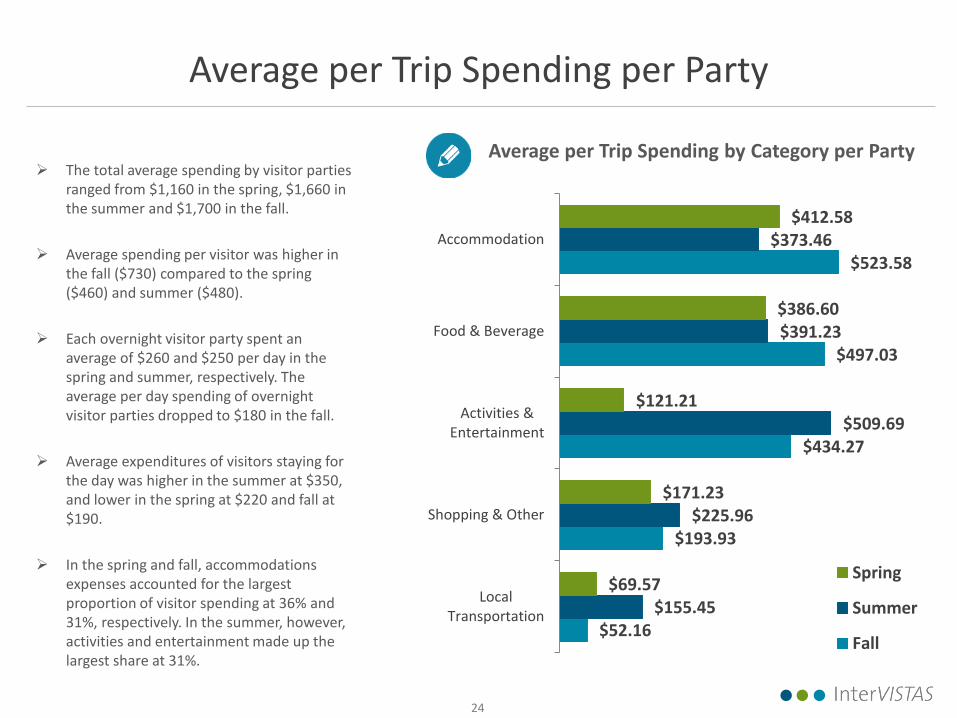
The total average spending by visitor parties ranged from $1,160 in the spring, $1,660 in the summer and $1,700 in the fall.
Average spending per visitor was higher in the fall ($730) compared to the spring ($460) and summer ($480).
Each overnight visitor party spent an average of $260 and $250 per day in the spring and summer, respectively. The average per day spending of overnight visitor parties dropped to $180 in the fall.
Average expenditures of visitors staying for the day was higher in the summer at $350, and lower in the spring at $220 and fall at $190.
In the spring and fall, accommodations expenses accounted for the largest proportion of visitor spending at 36% and 31%, respectively. In the summer, however, activities and entertainment made up the largest share at 31%.
$52.16
$193.93
$434.27
$497.03
$523.58
$155.45
$225.96
$509.69
$391.23
$373.46
$69.57
$171.23
$121.21
$386.60
$412.58
LocalTransportation
Shopping & Other
Activities &Entertainment
Food & Beverage
Accommodation
Spring
Summer
Fall
Average per Trip Spending by Category per Party
25
Visitor Intercept Survey Findings: Visitor Satisfaction
26
Visitor Satisfaction: Overall Experience
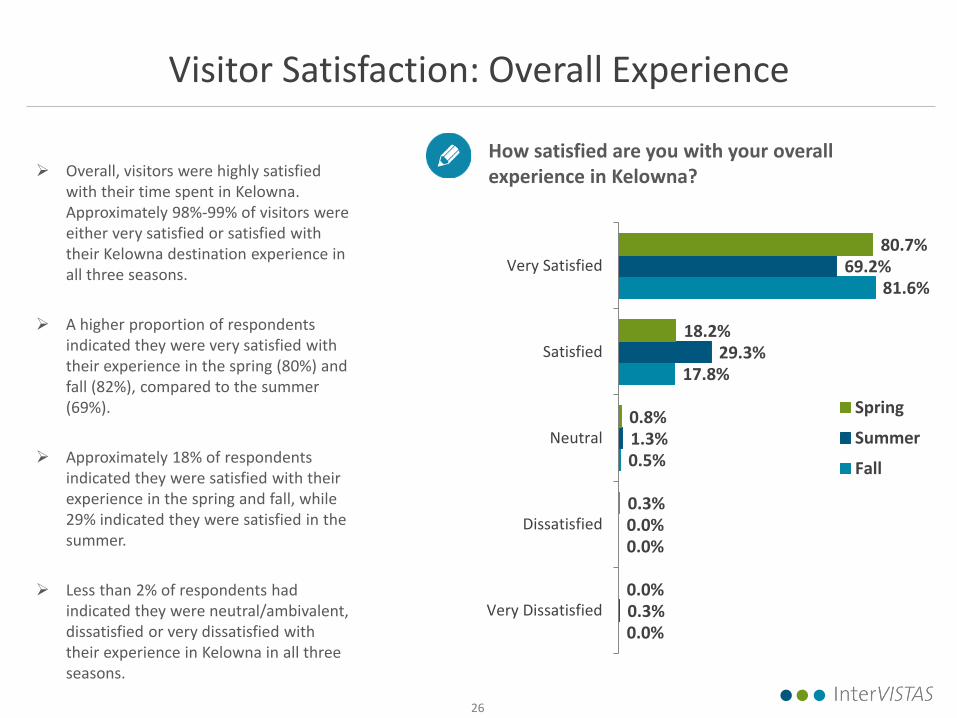
Overall, visitors were highly satisfied with their time spent in Kelowna. Approximately 98%-99% of visitors were either very satisfied or satisfied with their Kelowna destination experience in all three seasons.
A higher proportion of respondents indicated they were very satisfied with their experience in the spring (80%) and fall (82%), compared to the summer (69%).
Approximately 18% of respondents indicated they were satisfied with their experience in the spring and fall, while 29% indicated they were satisfied in the summer.
Less than 2% of respondents had indicated they were neutral/ambivalent, dissatisfied or very dissatisfied with their experience in Kelowna in all three seasons.
0.0%
0.0%
0.5%
17.8%
81.6%
0.3%
0.0%
1.3%
29.3%
69.2%
0.0%
0.3%
0.8%
18.2%
80.7%
Very Dissatisfied
Dissatisfied
Neutral
Satisfied
Very Satisfied
Spring
Summer
Fall
How satisfied are you with your overall experience in Kelowna?
27
2.5%
27.8%
69.8%
6.0%
35.2%
58.8%
3.7%
21.0%
75.3%
Detractors(0 - 6)
Passives(7 - 8)
Promoters(9 - 10)
Spring
Summer
Fall
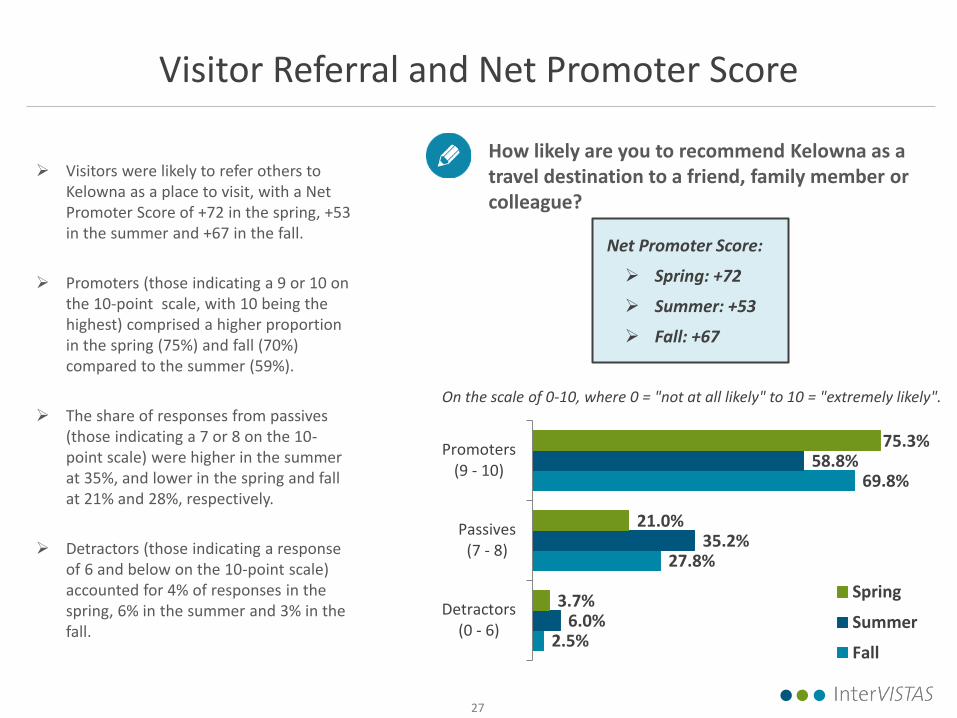
Visitor Referral and Net Promoter Score
Visitors were likely to refer others to Kelowna as a place to visit, with a Net Promoter Score of +72 in the spring, +53 in the summer and +67 in the fall.
Promoters (those indicating a 9 or 10 on the 10-point scale, with 10 being the highest) comprised a higher proportion in the spring (75%) and fall (70%) compared to the summer (59%).
The share of responses from passives (those indicating a 7 or 8 on the 10-point scale) were higher in the summer at 35%, and lower in the spring and fall at 21% and 28%, respectively.
Detractors (those indicating a response of 6 and below on the 10-point scale) accounted for 4% of responses in the spring, 6% in the summer and 3% in the fall.
How likely are you to recommend Kelowna as a travel destination to a friend, family member or colleague?
On the scale of 0-10, where 0 = "not at all likely" to 10 = "extremely likely".
Net Promoter Score:
Spring: +72
Summer: +53
Fall: +67
28
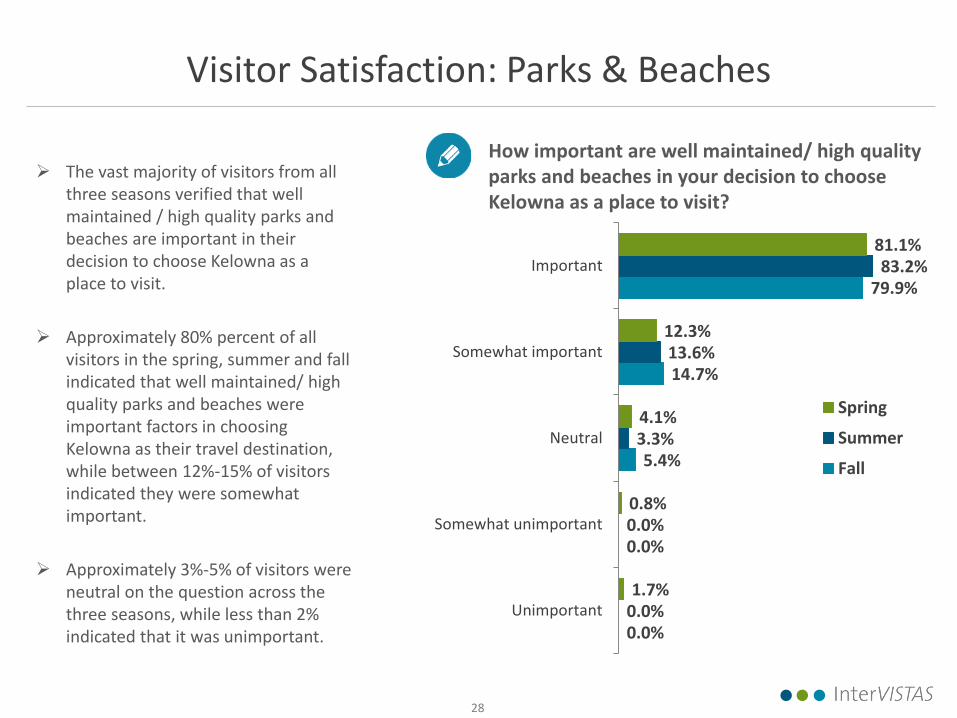
Visitor Satisfaction: Parks & Beaches
The vast majority of visitors from all three seasons verified that well maintained / high quality parks and beaches are important in their decision to choose Kelowna as a place to visit.
Approximately 80% percent of all visitors in the spring, summer and fall indicated that well maintained/ high quality parks and beaches were important factors in choosing Kelowna as their travel destination, while between 12%-15% of visitors indicated they were somewhat important.
Approximately 3%-5% of visitors were neutral on the question across the three seasons, while less than 2% indicated that it was unimportant. 0.0%
0.0%
5.4%
14.7%
79.9%
0.0%
0.0%
3.3%
13.6%
83.2%
1.7%
0.8%
4.1%
12.3%
81.1%
Unimportant
Somewhat unimportant
Neutral
Somewhat important
Important
Spring
Summer
Fall
How important are well maintained/ high quality parks and beaches in your decision to choose Kelowna as a place to visit?
29
Summary
30
Summary
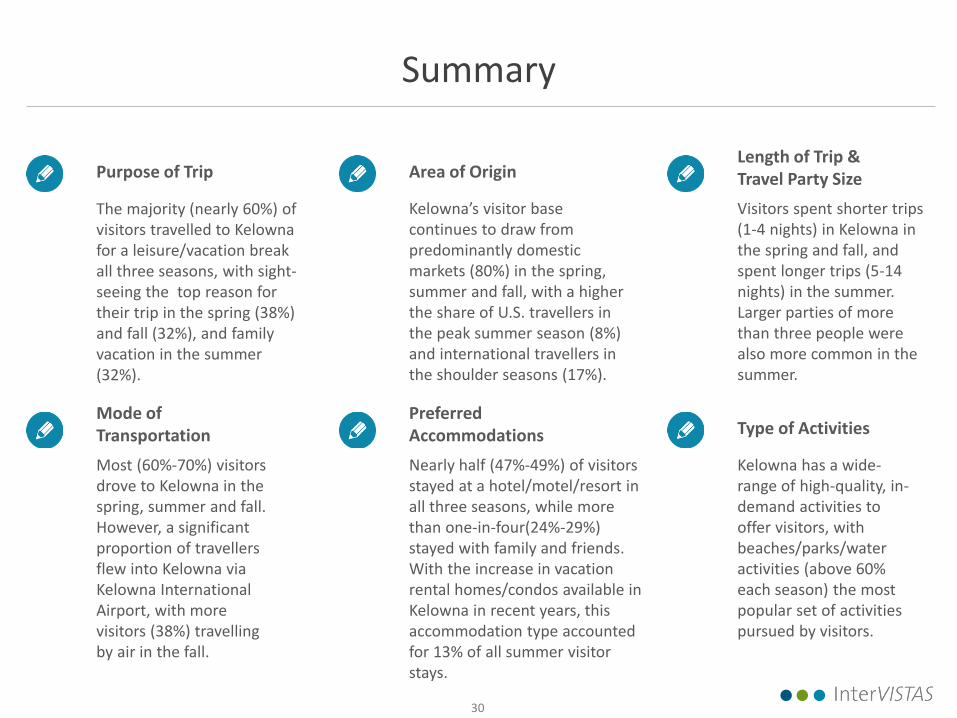
Purpose of Trip
The majority (nearly 60%) of visitors travelled to Kelowna for a leisure/vacation break all three seasons, with sight-seeing the top reason for their trip in the spring (38%) and fall (32%), and family vacation in the summer (32%).
Mode of Transportation
Most (60%-70%) visitors drove to Kelowna in the spring, summer and fall. However, a significant proportion of travellers flew into Kelowna via Kelowna International Airport, with more visitors (38%) travelling by air in the fall.
Area of Origin
Kelowna’s visitor base continues to draw from predominantly domestic markets (80%) in the spring, summer and fall, with a higher the share of U.S. travellers in the peak summer season (8%) and international travellers in the shoulder seasons (17%).
Preferred Accommodations
Nearly half (47%-49%) of visitors stayed at a hotel/motel/resort in all three seasons, while more than one-in-four(24%-29%) stayed with family and friends. With the increase in vacation rental homes/condos available in Kelowna in recent years, this accommodation type accounted for 13% of all summer visitor stays.
Length of Trip & Travel Party Size
Visitors spent shorter trips (1-4 nights) in Kelowna in the spring and fall, and spent longer trips (5-14 nights) in the summer. Larger parties of more than three people were also more common in the summer.
Type of Activities
Kelowna has a wide-range of high-quality, in-demand activities to offer visitors, with beaches/parks/water activities (above 60% each season) the most popular set of activities pursued by visitors.

31
Total average spending by all parties while in Kelowna was $1,160 in the spring, $1,660 in the summer and $1,700 in the fall. The average spending per person was higher in the fall ($730) compared to the spring ($460) and summer ($480). Accommodations expenses made up the largest proportion of visitor spending categories in the spring (36%) and fall (31%), while activities and entertainment made up the largest share in the summer (31%).
Summary
Overall, visitors were highly satisfied with their experience in Kelowna in all three seasons (69%-72% very satisfied and 18%-29% satisfied). As a result, approximately 60% of visitors were returning visitors to Kelowna in the spring, summer and fall. Visitors were also likely to recommend Kelowna as a travel destination, with a Net Promoter Score of +72 in the spring, +53 in the summer and +67 in the fall.
Visitor Spending Visitor Satisfaction
32
Tourism Kelowna Visitor Intercept Survey Findings by Season – FINAL DRAFT REPORT November 25, 2016