Embed Size (px)
Citation preview
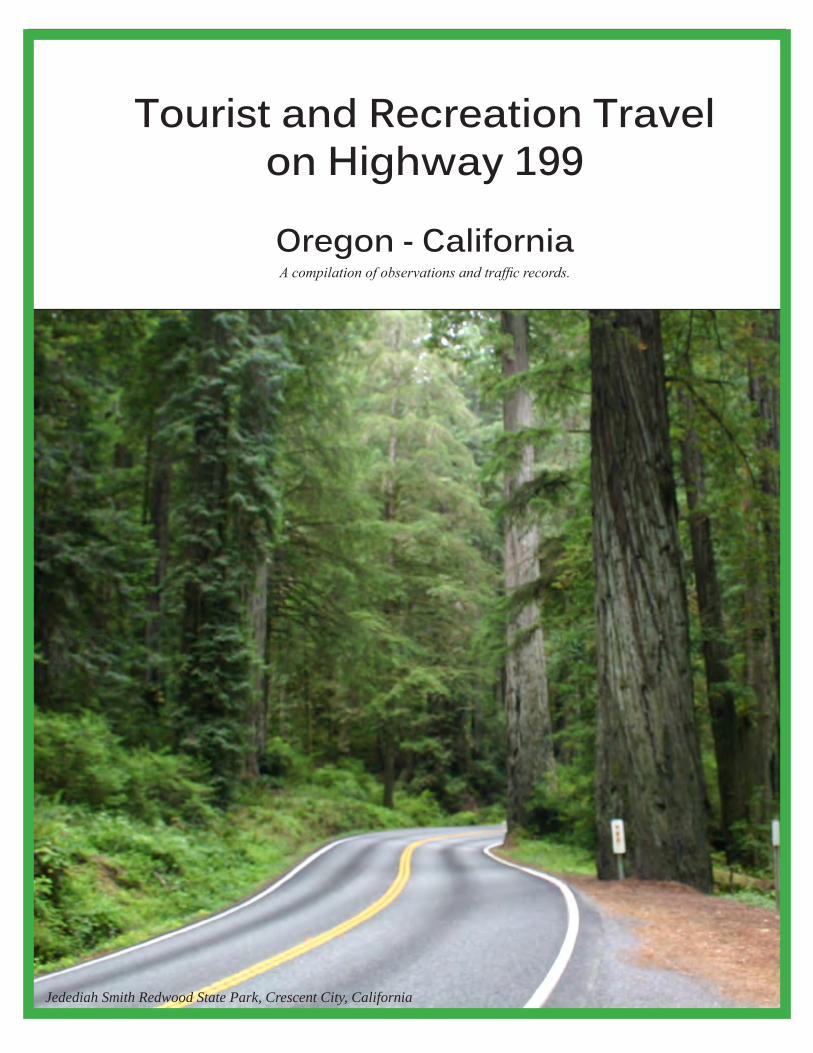
Tourist and Recreation Travel on Highway 199
Oregon - CaliforniaA compilation of observations and traffic records.
Jedediah Smith Redwood State Park, Crescent City, California
2 Tourist and Recreation Travel on Highway 199
California Agriculture Inspection StationCollier Tunnel Rest Area
CalTrans Maint Stn at Idyllwild
Patrick Creek Campground
Automatic Traffic Counter Station 17-003
Automatic Traffic Counter Station 17-005Redwood Avenue
Rogue River Loop Highway
Hayes Hill Summit
Illinois River RoadDeer Creek Bridge
Finch Road
Westside Road
Waldo Road
Fish Hatchery Rd
Old Hwy 99Demaray Road
Draper Valley Loop north intersection
5th Street, Kerby
Laurel Road
Rockydale Road
Collier Tunnel Jefferson State Byway
Oregon Caves
OREGONCALIFORNIA
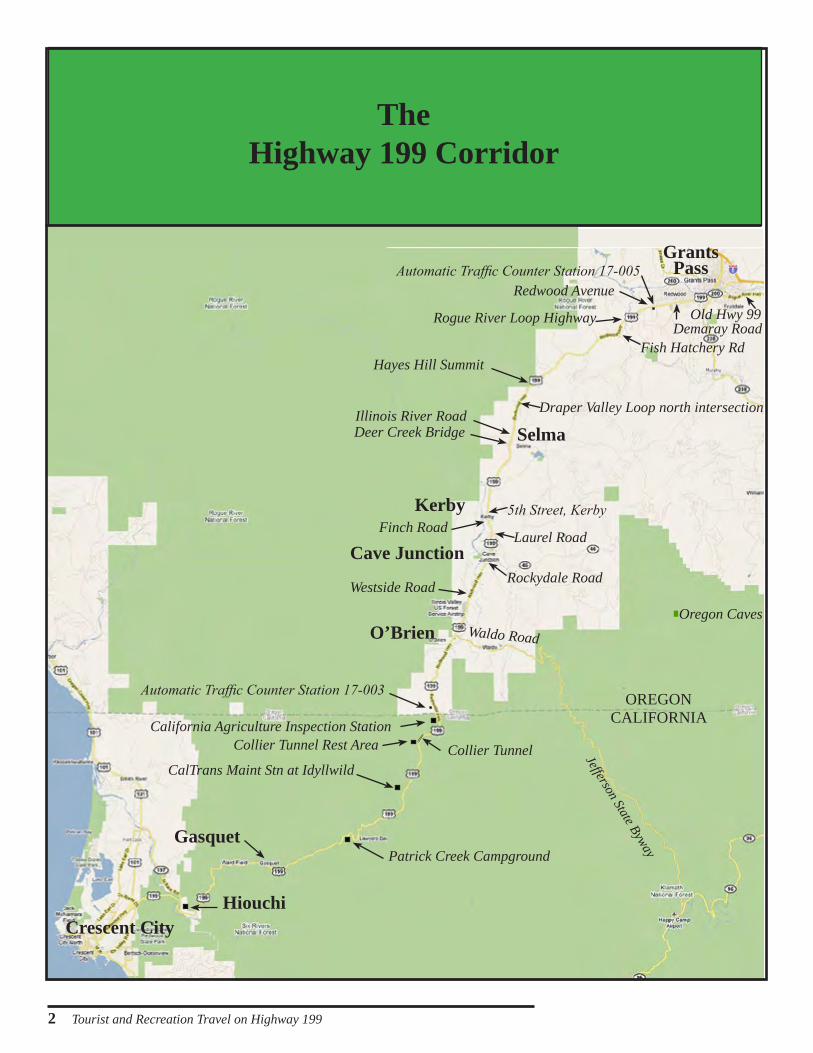
The Highway 199 Corridor
Crescent City
Cave Junction
Kerby
Grants Pass
Selma
O’Brien
Hiouchi
Gasquet
Tourist and Recreation Travel on Highway 199 3
IntroductionHighway 199, the Redwood Highway, is located in the southwest corner of Oregon and cuts diagonally from Interstate 5 at Grants Pass to Highway 101 near Crescent City, California. The total length of the road is about 80 miles and has traditionally been the main travel corridor between Crater Lake National Park and Redwood State and National Parks.
The route plays an essential role in making this region of Oregon and California competitive in the global tourism market because it has the potential of serving as the east west turn-around point for loop routes from San Francisco/Sacramento or Portland/Seattle. These loops follow the scenic coast to Redwood State and National Parks and then inland to Crater Lake National Park and the Cascade Mountains where they return to their origin.
There has been no formal assessment of traffic on Highway 199 to determine the approximate number of vehicles that are using the corridor for tourist or recreational travel. For this reason, it has been difficult to provide accurate evaluations of the potential income that tourism and recreation can bring to the local economy. This report will not completely resolve this lack of information but will serve as a first step in understanding what this travel corridor might currently contribute as an economic resource for southern Oregon and northern California.
PurposeThis document was compiled with the intention of establishing a baseline of data that will be useful to communities on Highway 199 that want to develop marketing strategies for attracting tourist spending as well as attract business development that can help create jobs in the low income communities of southwest Oregon.
MethodsAll of the data compiled in this report are from official state traffic counts taken at the Oregon-California border. The Oregon-California border was selected as the focus of this study because commuter traffic at this location is considered to be minimal. For this reason, the Oregon-California border offers the best site in the corridor to assess tourist and recreation travel in the Highway 199 corridor.
ContentsIntroduction ............................................................................3
Oregon State Traffic Volume Records ....................................6
Oregon State Automated Traffic Counter Stations .................26
California State Traffic Volume Records ................................46
California Agriculture Station Records ..................................54
Visual Traffic Observations ....................................................56
Concluding Remarks ..............................................................66
4 Tourist and Recreation Travel on Highway 199
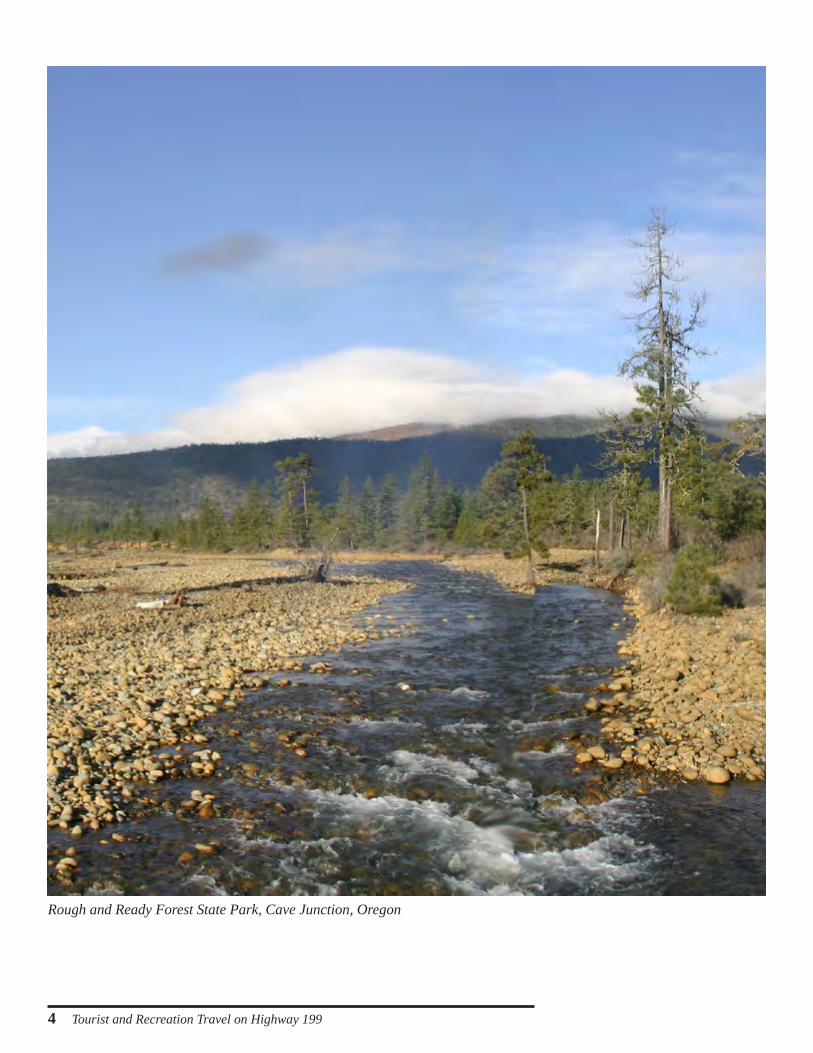
Rough and Ready Forest State Park, Cave Junction, Oregon
Tourist and Recreation Travel on Highway 199 5
All information in this summary regards traffic volume and composition at the Oregon-California border. This location on Highway 199 is the focal point for all of the information compiled in this document.
Traffic volumesTotal vehicles: 1,047,500 per year. Traffic volume has been at this
approximate level for the past decade.
Tourist traffic: Leisure and recreational travel make up about 30% of the total travel volume. It may be as high as 50% (see comments on page 66).
Traffic direction: The volume of traffic is about the same in both directions including the number of motor homes and vehicles pulling travel trailers.
Types of vehicles as a percentage of total traffic88% Cars/pickups- These can be subdivided into the following groups
90% Vehicles with no visible indicator of recreational or leisure travel
5% Towing trailers: 24% boat, 5% horse, 2% misc recreational (jet ski, quad, motorcycle, raft, camping gear), 69% misc enclosed, covered, or empty trailer
2% With rooftop cargo racks
3% Rec equipment (vehicles carrying bicycles, kayaks, surfboards, etc)
4% Recreational vehicles - these can be subdivided into three groups
10% Campers
50% Travel trailer
40% Motor homes with about 34% of these towing vehicles
1.5% Motorcycles
6% Trucks with single or double trailers
.5% Bus (scheduled shuttle bus, tour vans, school bus, tour bus)
Summary
6 Tourist and Recreation Travel on Highway 199
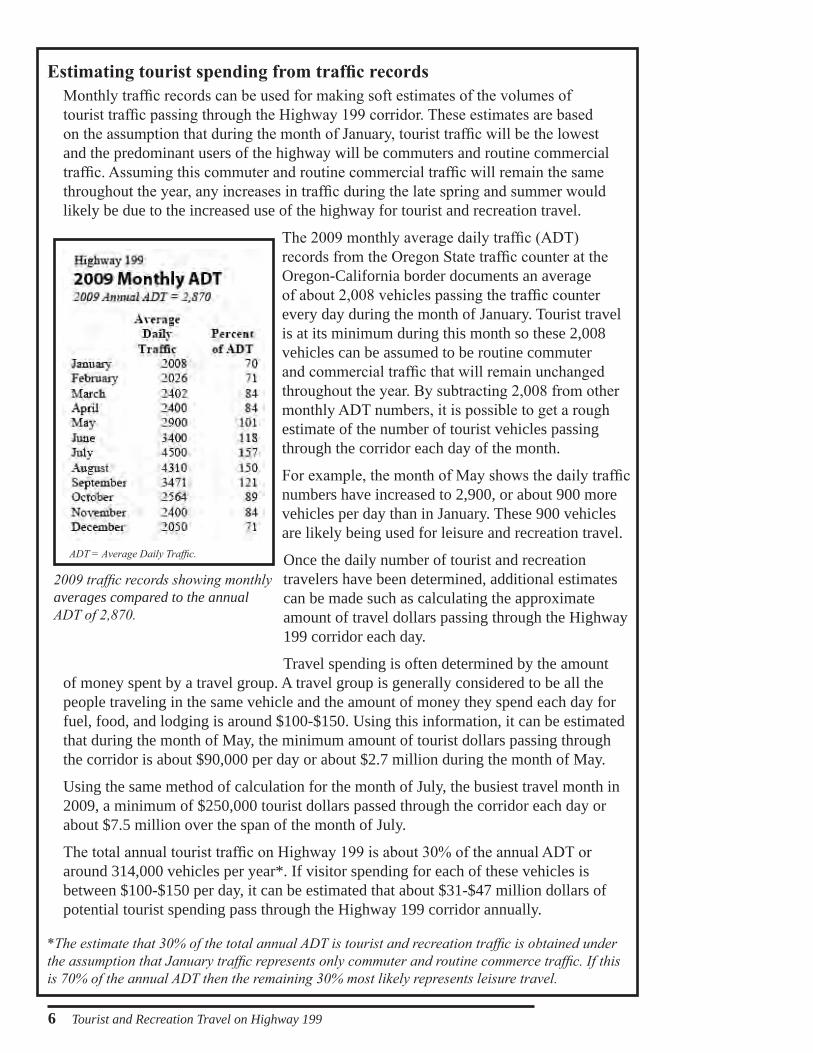
ADT = Average Daily Traffic.
Estimating tourist spending from traffic recordsMonthly traffic records can be used for making soft estimates of the volumes of tourist traffic passing through the Highway 199 corridor. These estimates are based on the assumption that during the month of January, tourist traffic will be the lowest and the predominant users of the highway will be commuters and routine commercial traffic. Assuming this commuter and routine commercial traffic will remain the same throughout the year, any increases in traffic during the late spring and summer would likely be due to the increased use of the highway for tourist and recreation travel.
The 2009 monthly average daily traffic (ADT) records from the Oregon State traffic counter at the Oregon-California border documents an average of about 2,008 vehicles passing the traffic counter every day during the month of January. Tourist travel is at its minimum during this month so these 2,008 vehicles can be assumed to be routine commuter and commercial traffic that will remain unchanged throughout the year. By subtracting 2,008 from other monthly ADT numbers, it is possible to get a rough estimate of the number of tourist vehicles passing through the corridor each day of the month.
For example, the month of May shows the daily traffic numbers have increased to 2,900, or about 900 more vehicles per day than in January. These 900 vehicles are likely being used for leisure and recreation travel.
Once the daily number of tourist and recreation travelers have been determined, additional estimates can be made such as calculating the approximate amount of travel dollars passing through the Highway 199 corridor each day.
Travel spending is often determined by the amount of money spent by a travel group. A travel group is generally considered to be all the people traveling in the same vehicle and the amount of money they spend each day for fuel, food, and lodging is around $100-$150. Using this information, it can be estimated that during the month of May, the minimum amount of tourist dollars passing through the corridor is about $90,000 per day or about $2.7 million during the month of May.
Using the same method of calculation for the month of July, the busiest travel month in 2009, a minimum of $250,000 tourist dollars passed through the corridor each day or about $7.5 million over the span of the month of July.
The total annual tourist traffic on Highway 199 is about 30% of the annual ADT or around 314,000 vehicles per year*. If visitor spending for each of these vehicles is between $100-$150 per day, it can be estimated that about $31-$47 million dollars of potential tourist spending pass through the Highway 199 corridor annually.
*The estimate that 30% of the total annual ADT is tourist and recreation traffic is obtained under the assumption that January traffic represents only commuter and routine commerce traffic. If this is 70% of the annual ADT then the remaining 30% most likely represents leisure travel.
2009 traffic records showing monthly averages compared to the annual ADT of 2,870.
Tourist and Recreation Travel on Highway 199 7
SummaryThis section provides a comparative record of traffic activity on the 40 miles of Highway 199 located on the Oregon side of the border. Traffic is lowest at the Oregon-California border where commuter traffic is minimal and increases dramatically as the road approaches Grants Pass and commuter traffic accumulates from residential areas along the corridor.
Traffic volumes listed in the following annual data sheets were determined by taking the total annual traffic that passes each of the data collection points and dividing by 365. If you want to know the total cars that pass any of the data points during a one year period, multiply the number by 365.
The target area for this document is the Oregon-California border where the average daily traffic (ADT) for the past decade has been around 2,800 vehicles per day or about one million vehicles annually. Near Grants Pass where commuter traffic is more intense, the annual ADT is about 34,000 vehicles daily or about twelve million vehicles annually.
Oregon State Traffic Volume Records
8 Tourist and Recreation Travel on Highway 199
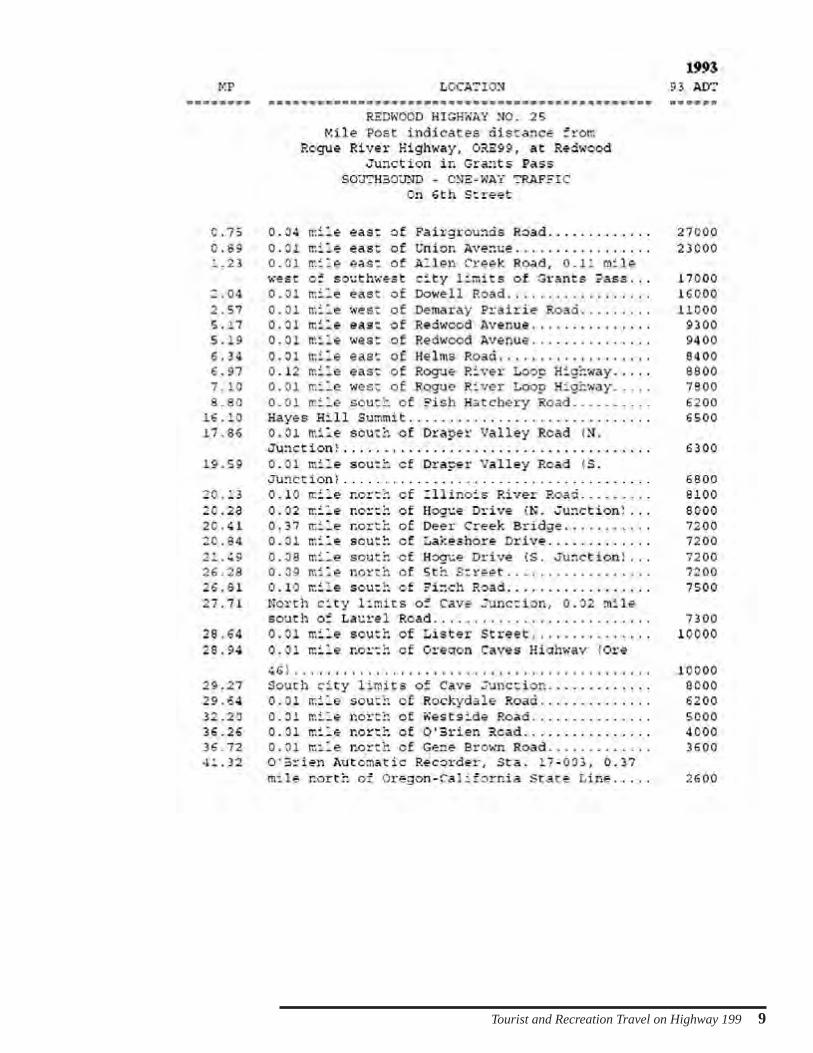
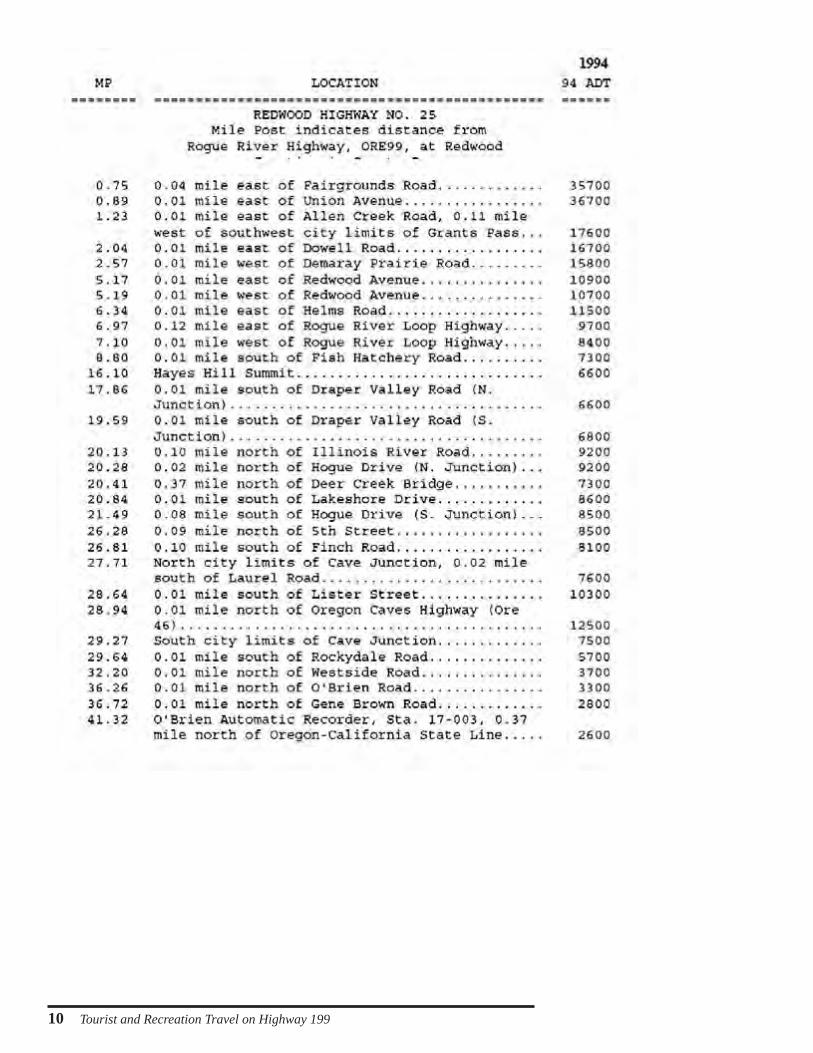
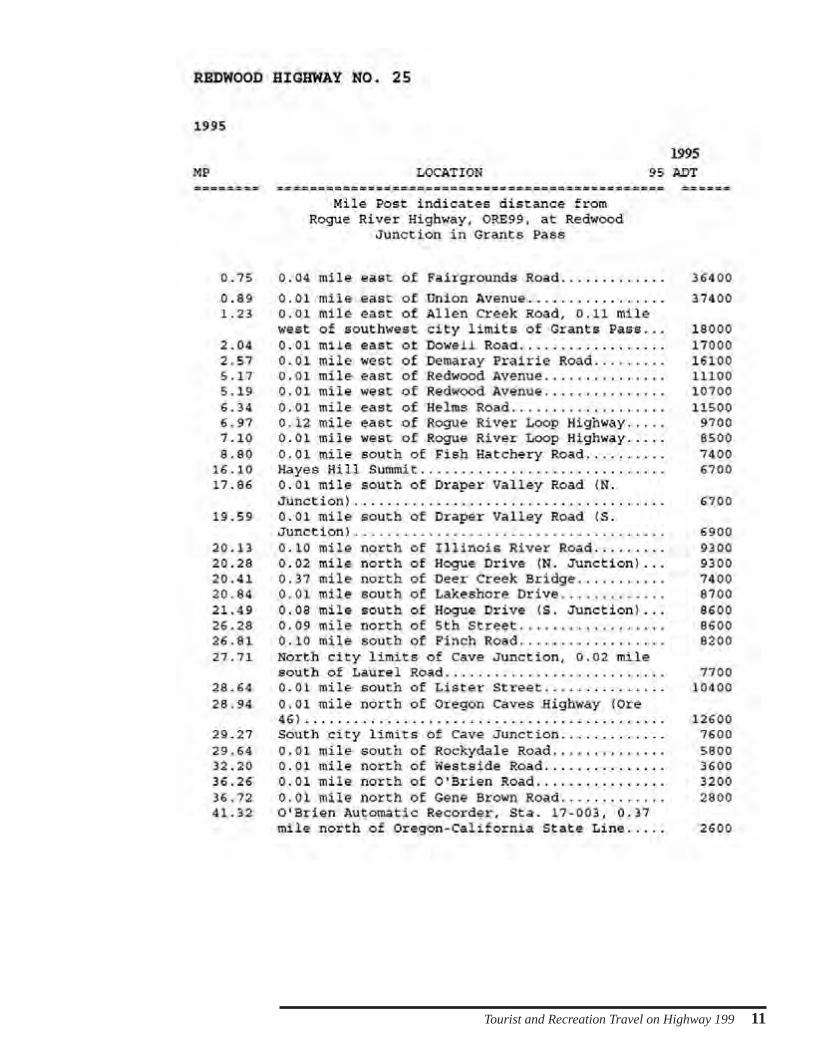
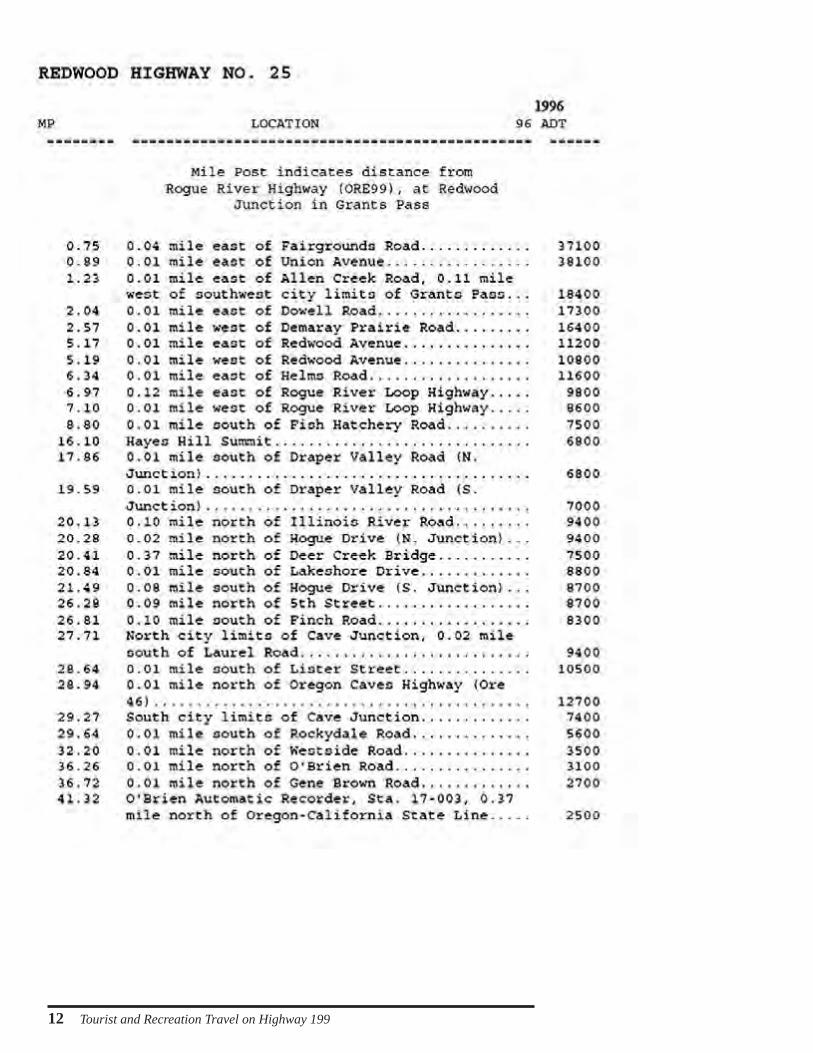
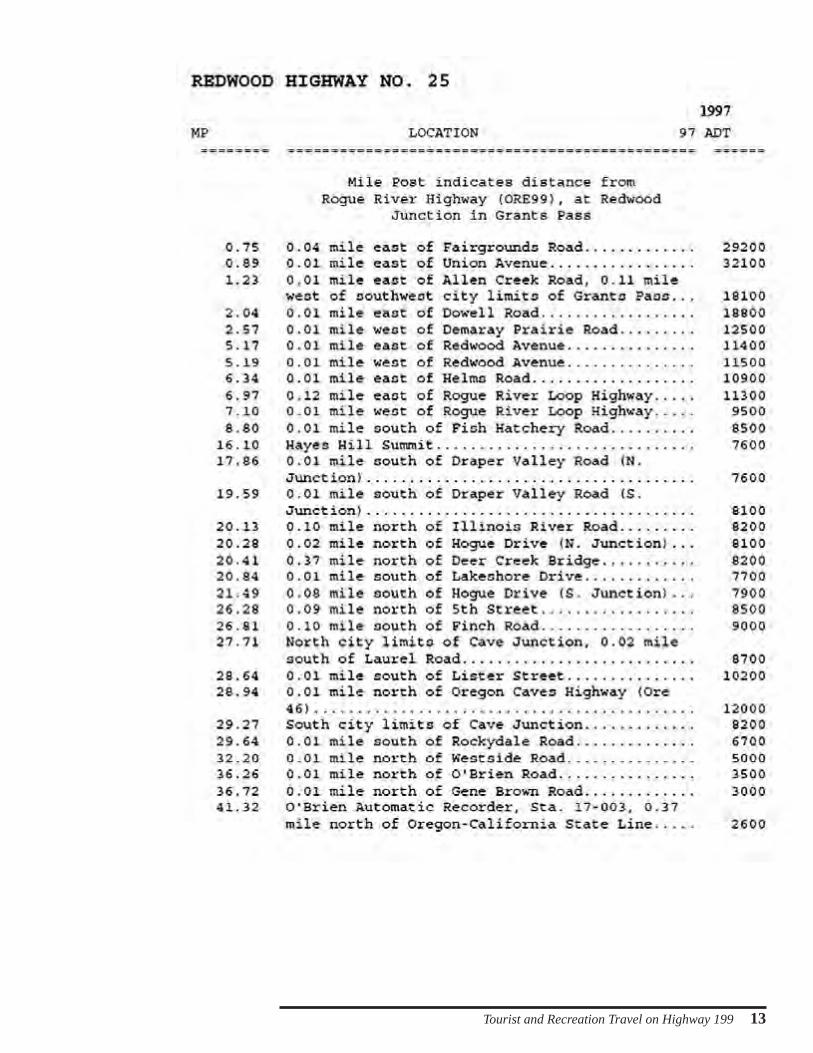
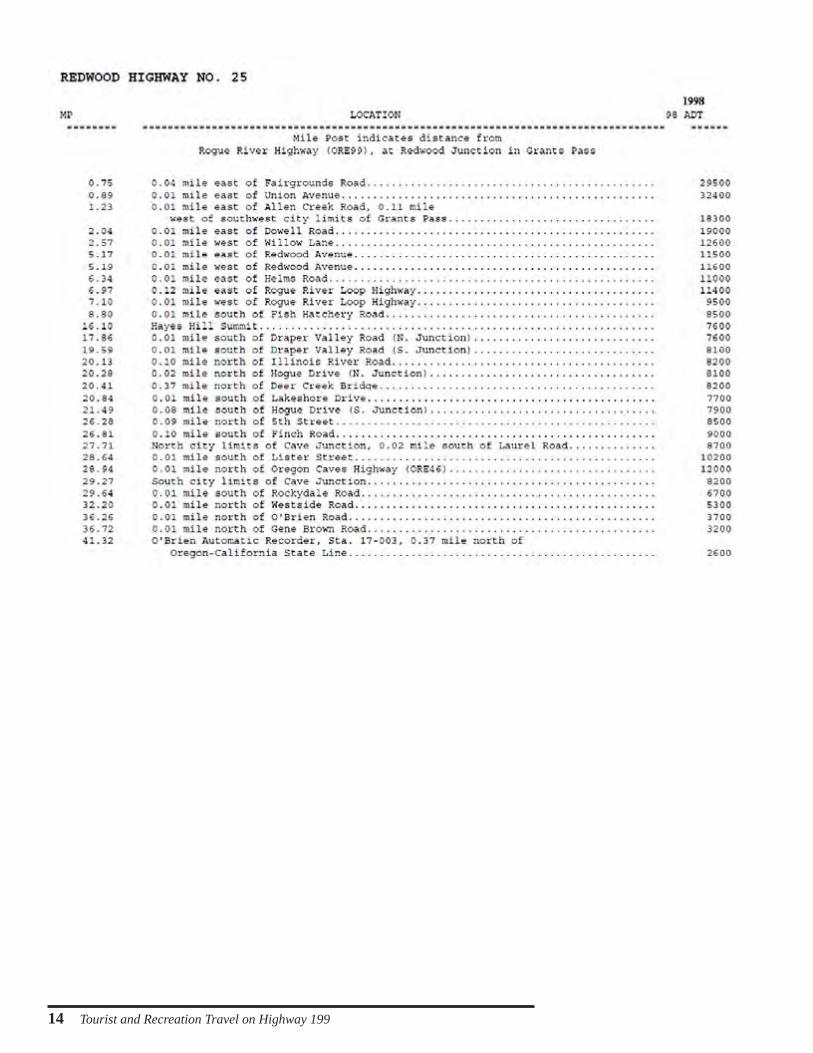
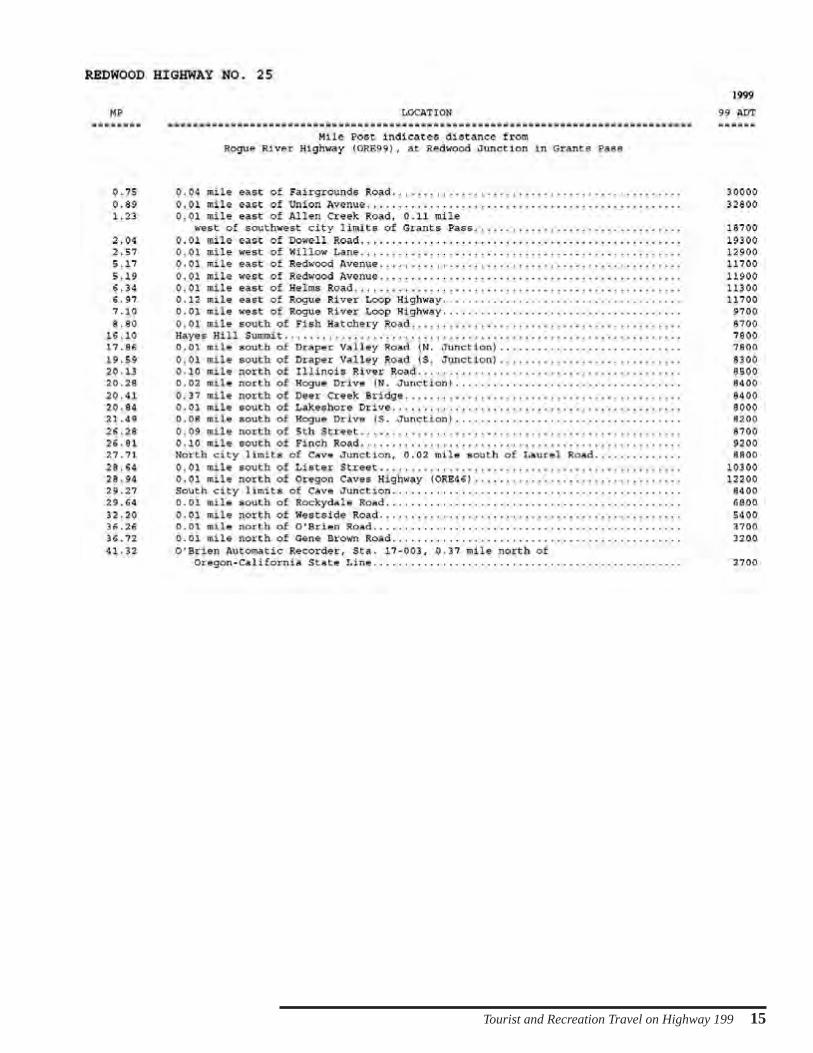
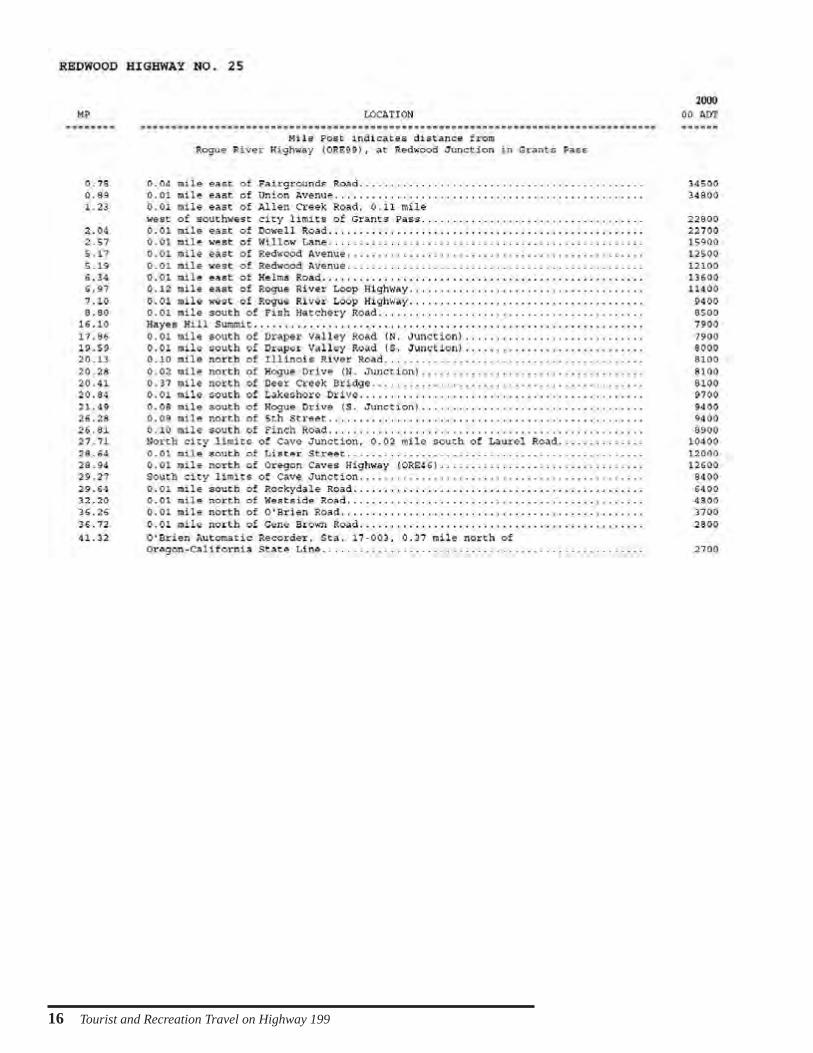
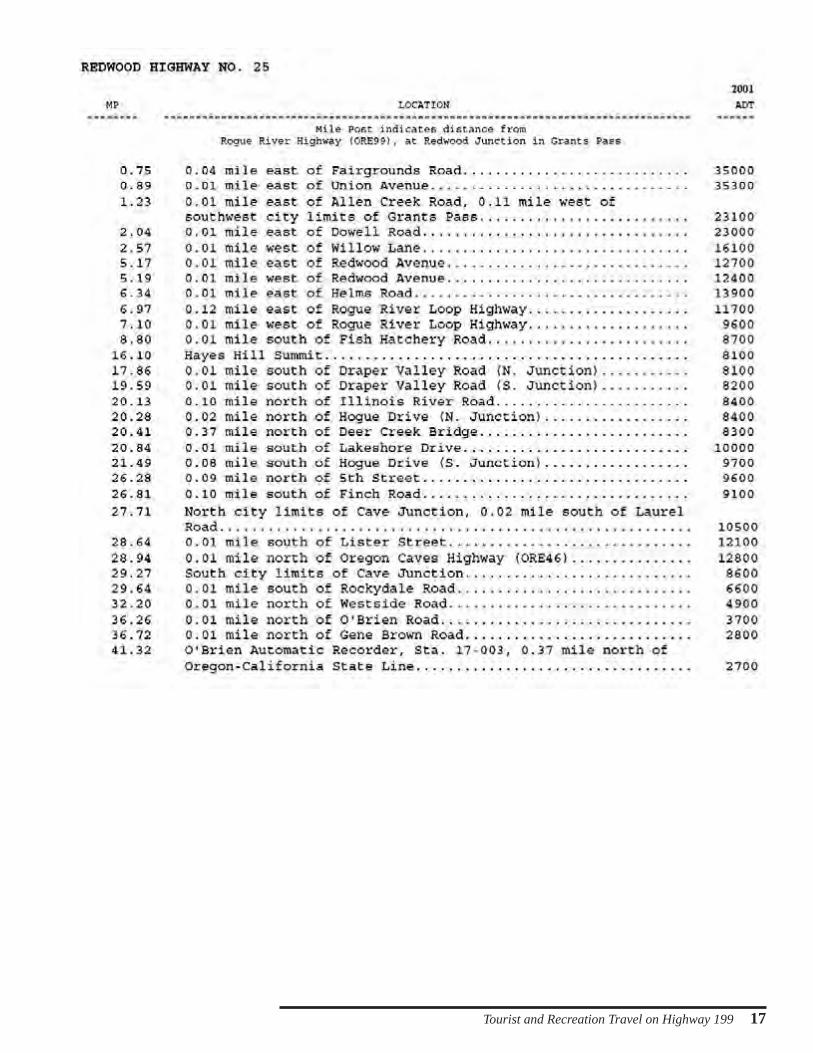
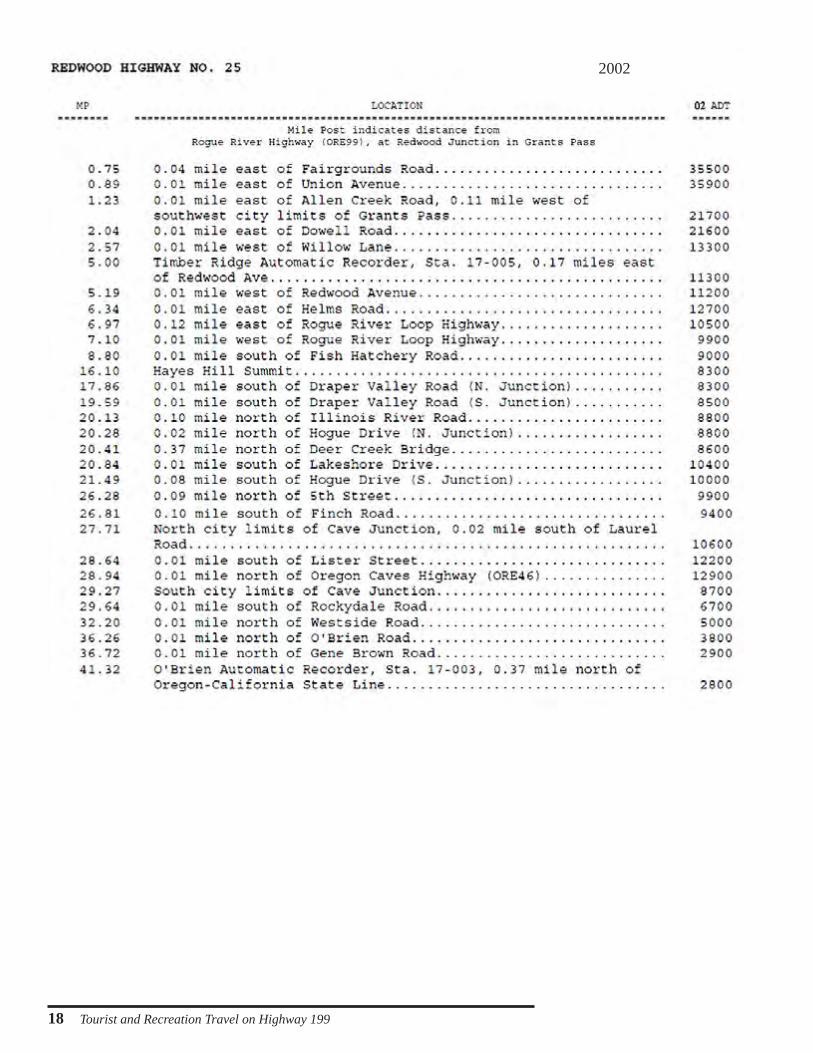
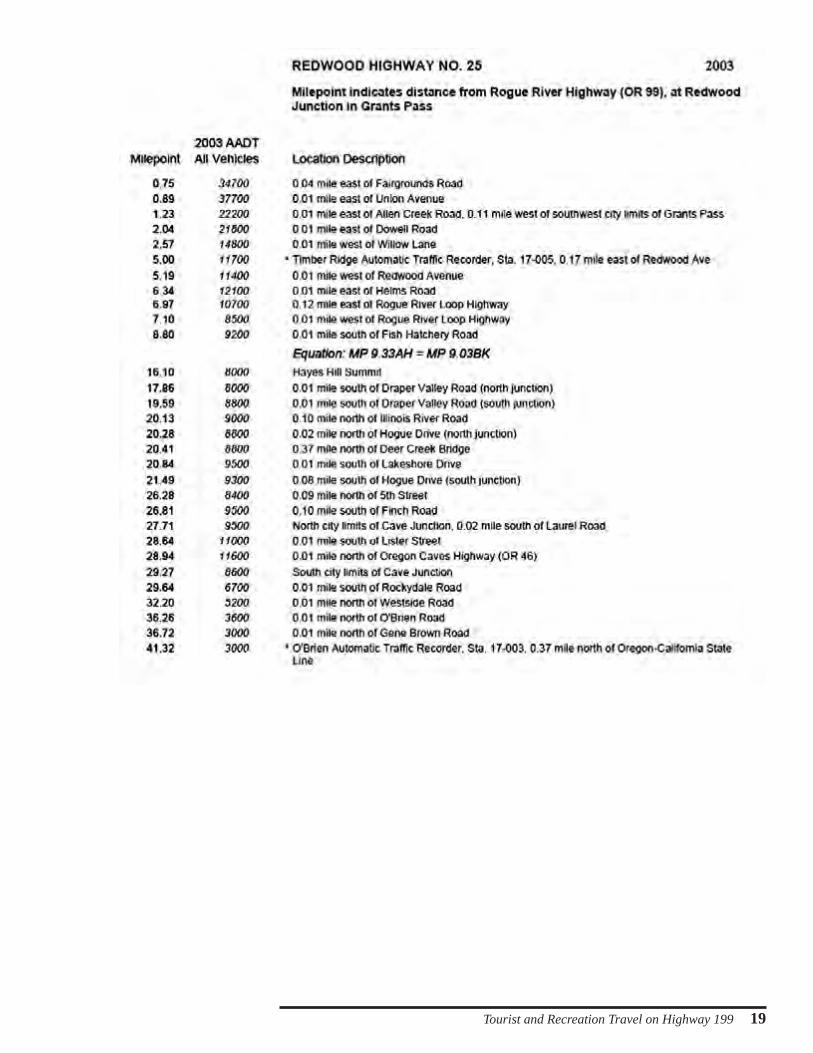
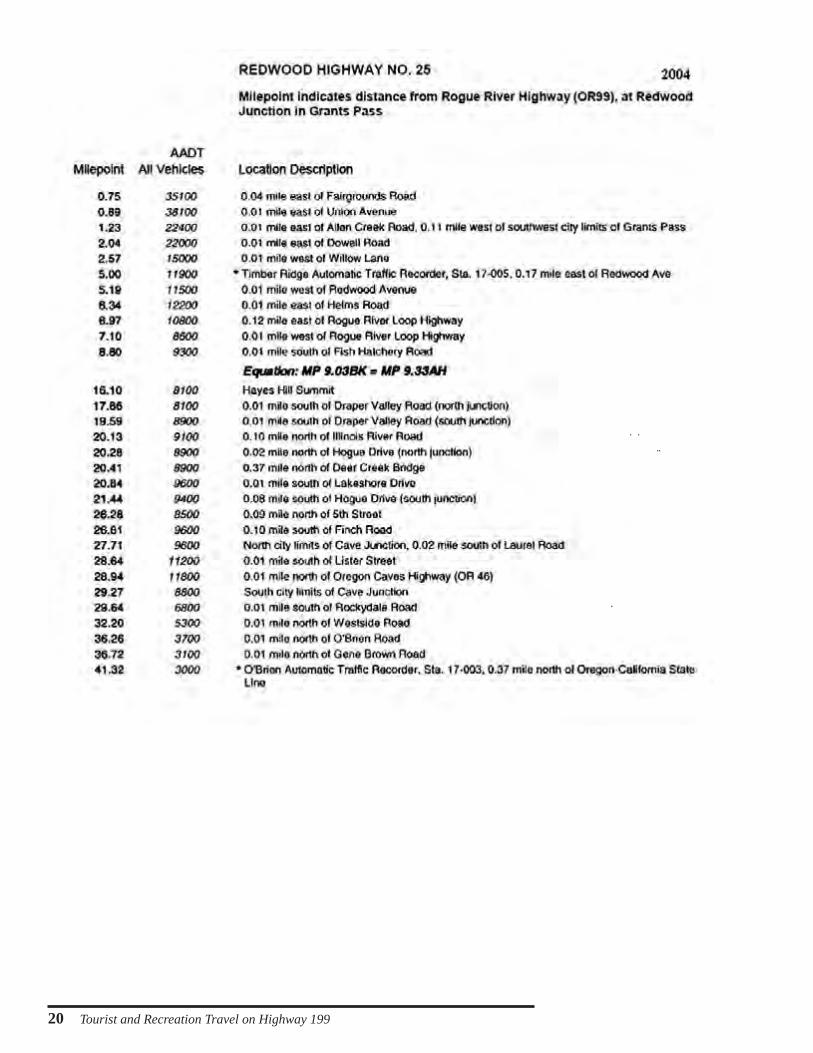
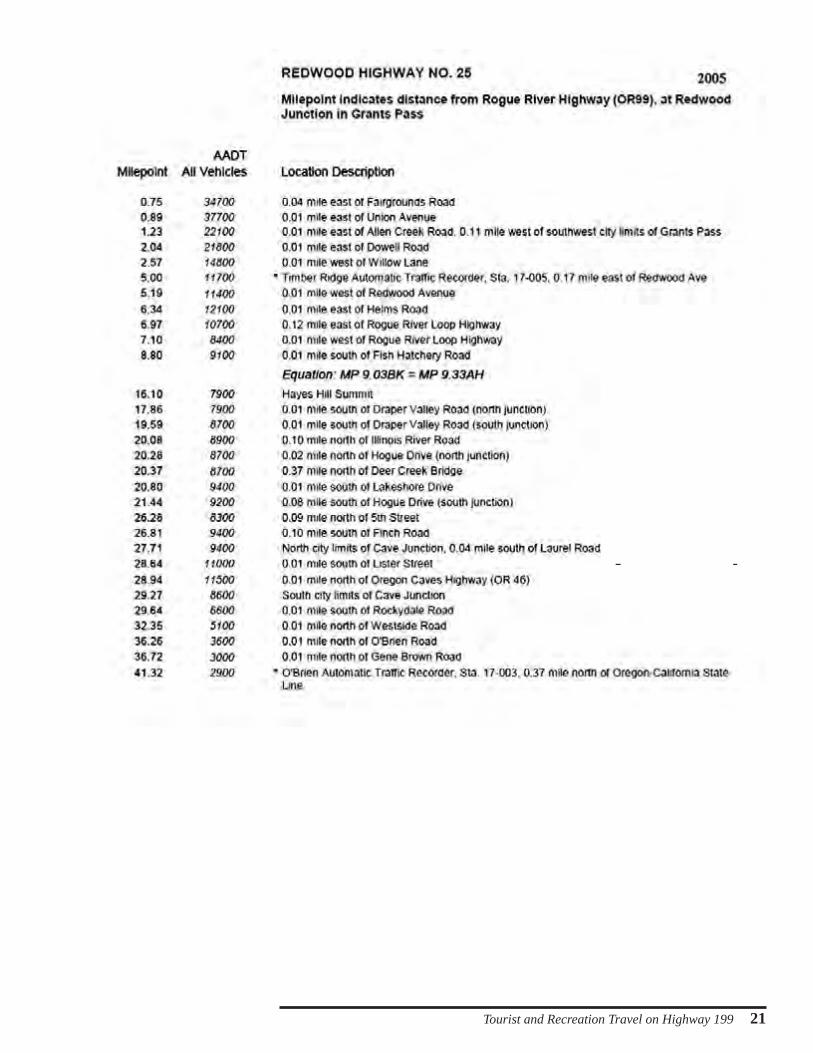
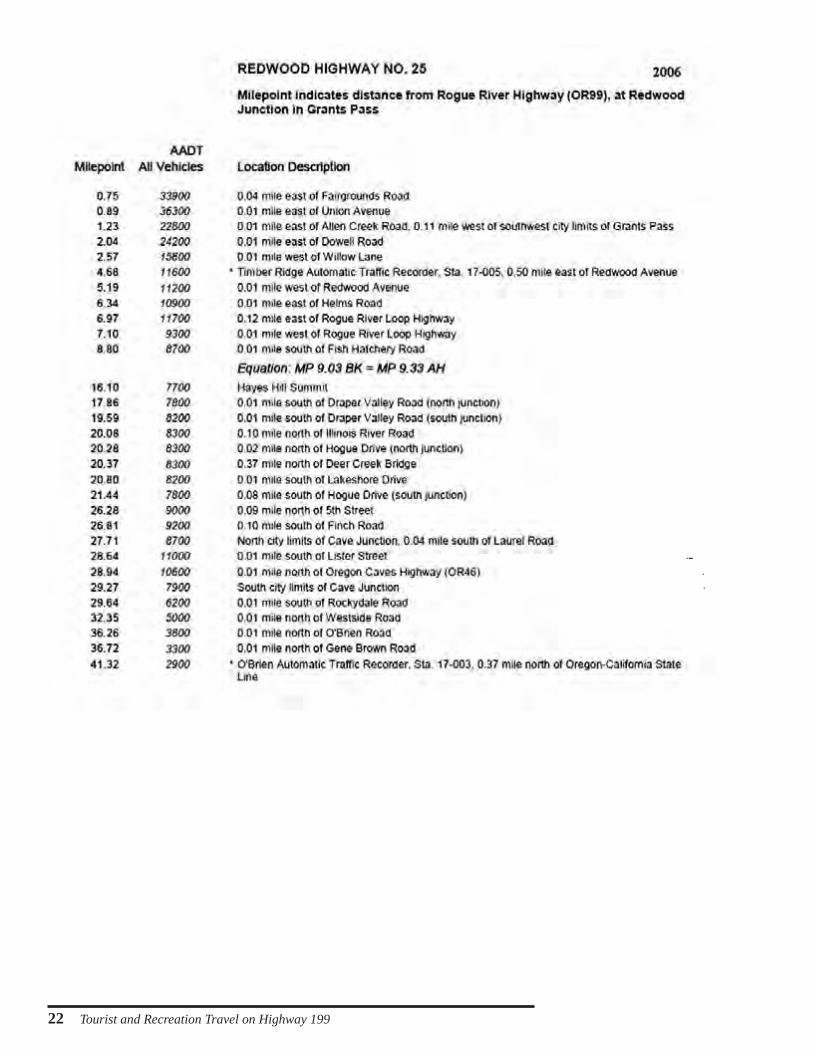
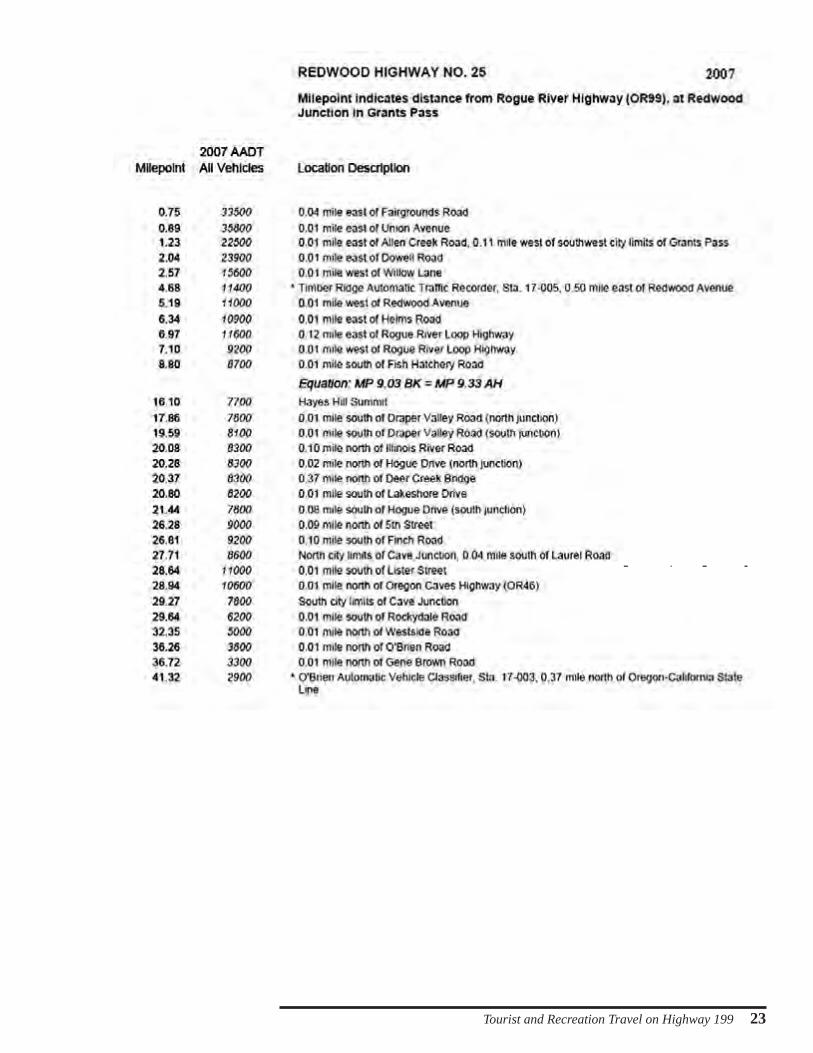
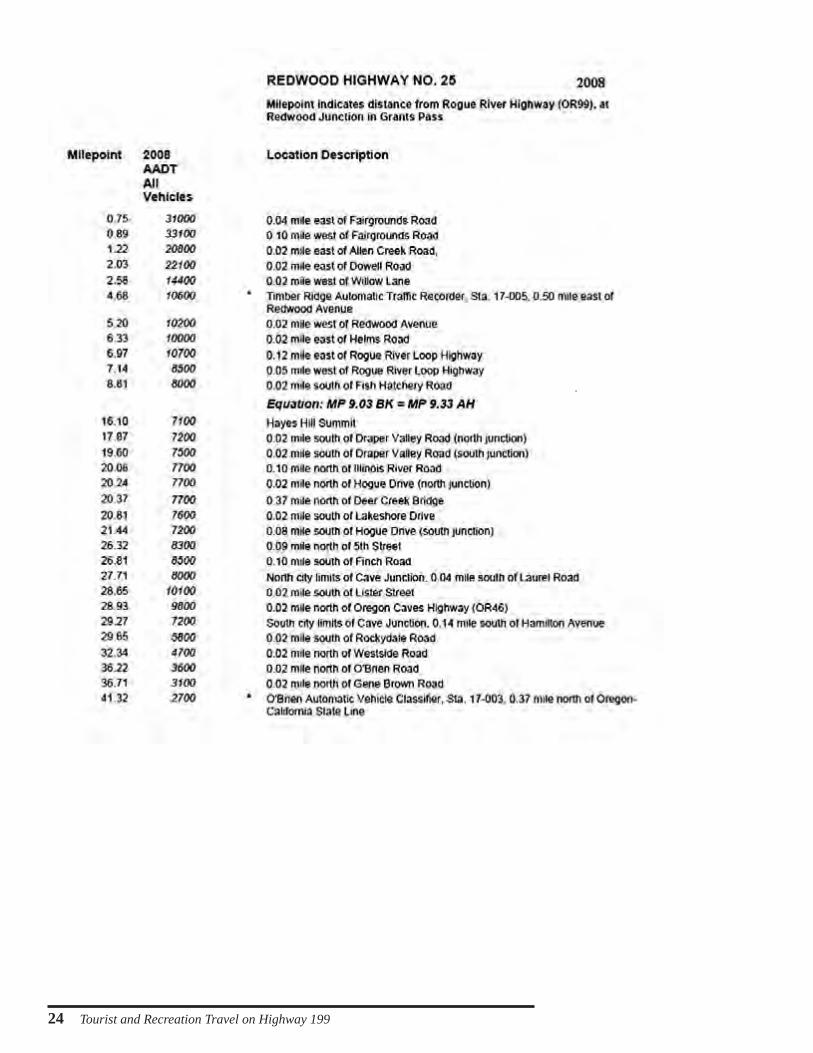
IntroductionThe Oregon State traffic volume records provide an annual summary of the amount of traffic passing reference points along Highway 199 each day. The values are determined by taking the total number of vehicles counted during the year and dividing by 365. Hence, if you want to know the total number of vehicles that pass any of the reference points in any given year, multiply the ADT values in the traffic record by 365.
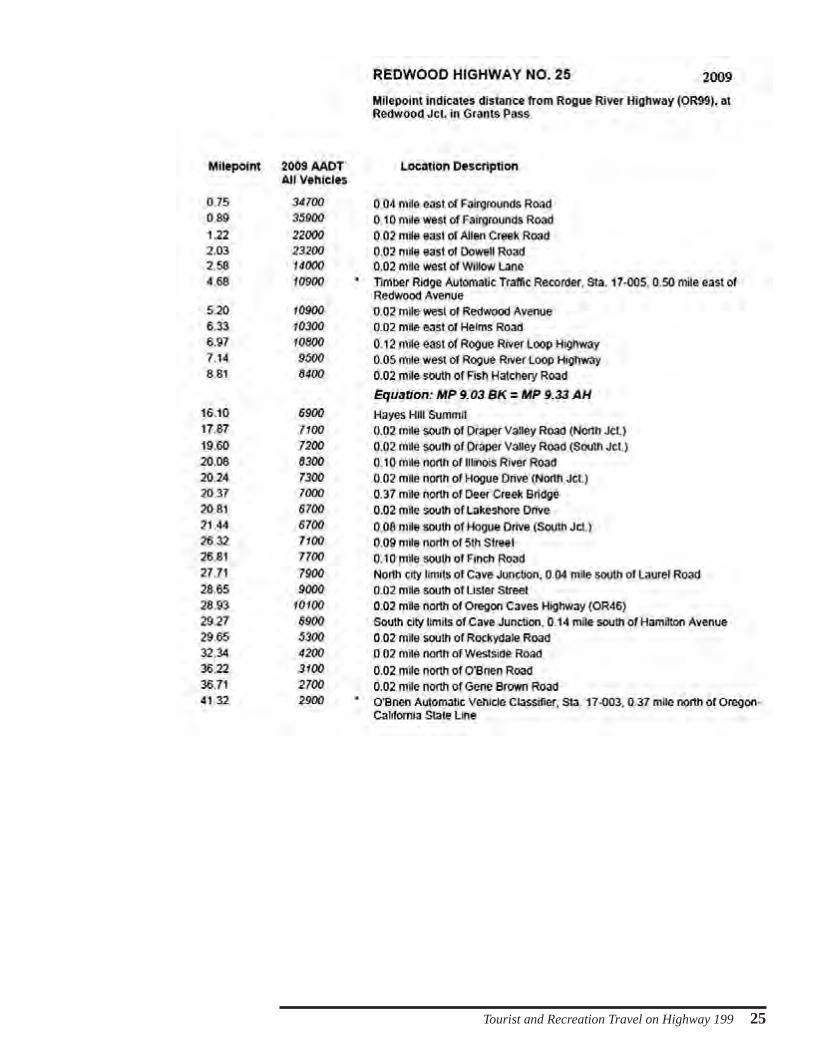
There are two sites on Highway 199 where automatic traffic counters are permanently established and the values given for these points are based on actual counts. These automated traffic counters (ATC) stations are located at mile 41.32 (the O’Brien Station) near the California border and at mile 4.7 (the Timber Ridge Station) near Rogue Community College, in Grants Pass. The Timber Ridge Station was installed in 2002 so records won’t begin to appear until that year.
The other values listed for different points along Highway 199 were obtained with temporary counters set up at designated points along the highway where they count traffic for 48 hours. Values at these points are compared with the values taken at the O’Brien ATC Station and adjusted to give an approximate annual traffic volume value for that reference point.
Understanding the dataThe left column labeled “MP” stands for “mile point”. All distances represent the distance in miles from the intersection with the Rogue River Highway (old Highway 99) in Grants Pass.
Records occasionally have notations such as “Equation: MP 9.33AH = MP 9.03BK”. These notes are inserted into data records when construction changes the length of a highway. Changes might happen when cutting a curve shortens the highway or the highway is lengthened if it becomes necessary to go around a stubborn obstacle like a constantly sliding hillside. When the road is changed like this, ODOT does not want to have to re-milepoint the entire highway. The equation is used to make the correction.
The letters BK stands for “back” and AH stands for “ahead” and are terms indicating the direction of travel. On Highway 199, “ahead” means north and “back” means south. Understanding these terms and calculations is necessary to assure staff places vehicle counting equipment in the same location to produce consistent data.
Note regarding the use of #25 in the traffic record title: Oregon Sate maintains a list of state highways. Redwood Highway 199, is the 25th road on the list, hence Redwood Highway #25.
Tourist and Recreation Travel on Highway 199 9
10 Tourist and Recreation Travel on Highway 199
Tourist and Recreation Travel on Highway 199 11
12 Tourist and Recreation Travel on Highway 199
Tourist and Recreation Travel on Highway 199 13
14 Tourist and Recreation Travel on Highway 199
Tourist and Recreation Travel on Highway 199 15
16 Tourist and Recreation Travel on Highway 199
Tourist and Recreation Travel on Highway 199 17
18 Tourist and Recreation Travel on Highway 199
2002
Tourist and Recreation Travel on Highway 199 19
20 Tourist and Recreation Travel on Highway 199
Tourist and Recreation Travel on Highway 199 21
22 Tourist and Recreation Travel on Highway 199
Tourist and Recreation Travel on Highway 199 23
24 Tourist and Recreation Travel on Highway 199
Tourist and Recreation Travel on Highway 199 25
26 Tourist and Recreation Travel on Highway 199
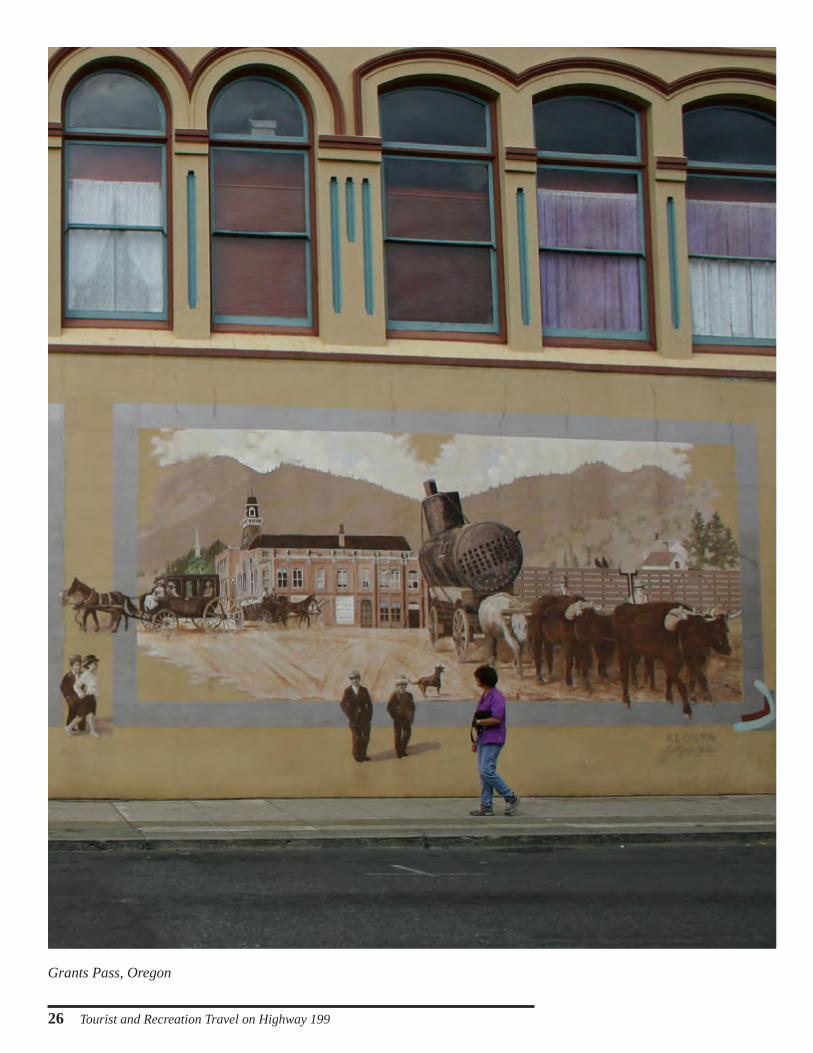
Grants Pass, Oregon
Tourist and Recreation Travel on Highway 199 27
Oregon State Automated Traffic Counter Station
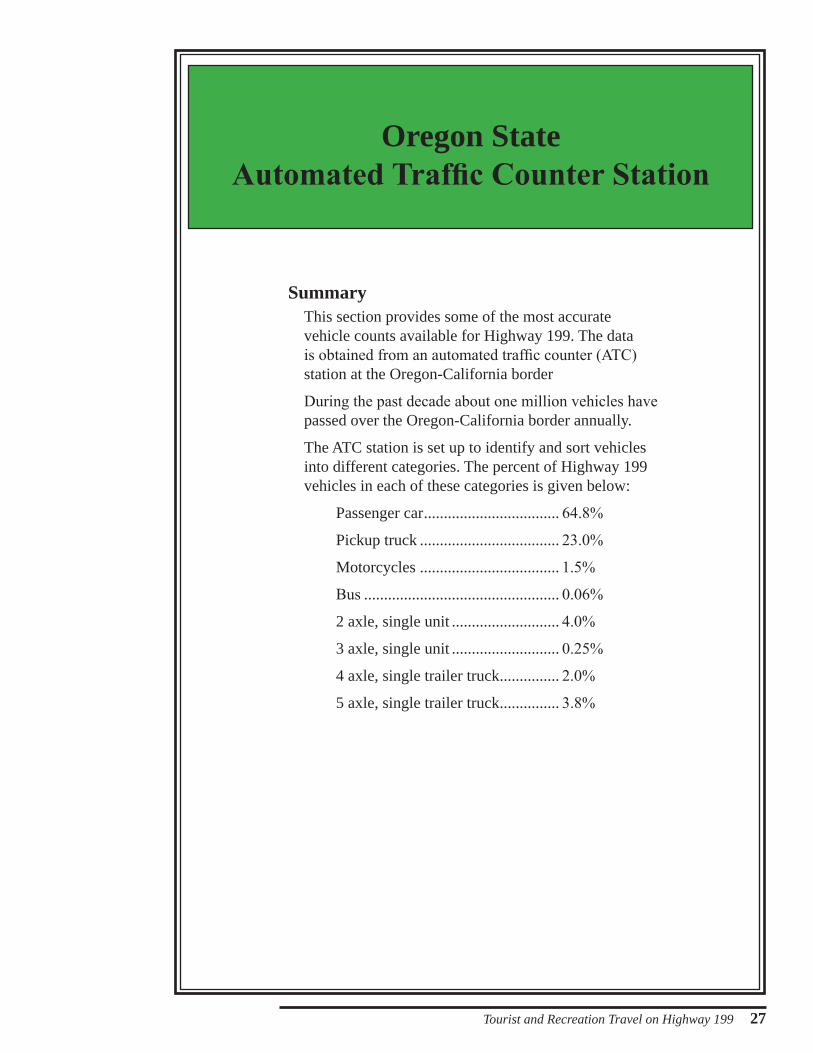
SummaryThis section provides some of the most accurate vehicle counts available for Highway 199. The data is obtained from an automated traffic counter (ATC) station at the Oregon-California border
During the past decade about one million vehicles have passed over the Oregon-California border annually.
The ATC station is set up to identify and sort vehicles into different categories. The percent of Highway 199 vehicles in each of these categories is given below:
Passenger car .................................. 64.8%
Pickup truck ................................... 23.0%
Motorcycles ................................... 1.5%
Bus ................................................. 0.06%
2 axle, single unit ........................... 4.0%
3 axle, single unit ........................... 0.25%
4 axle, single trailer truck ............... 2.0%
5 axle, single trailer truck ............... 3.8%
28 Tourist and Recreation Travel on Highway 199
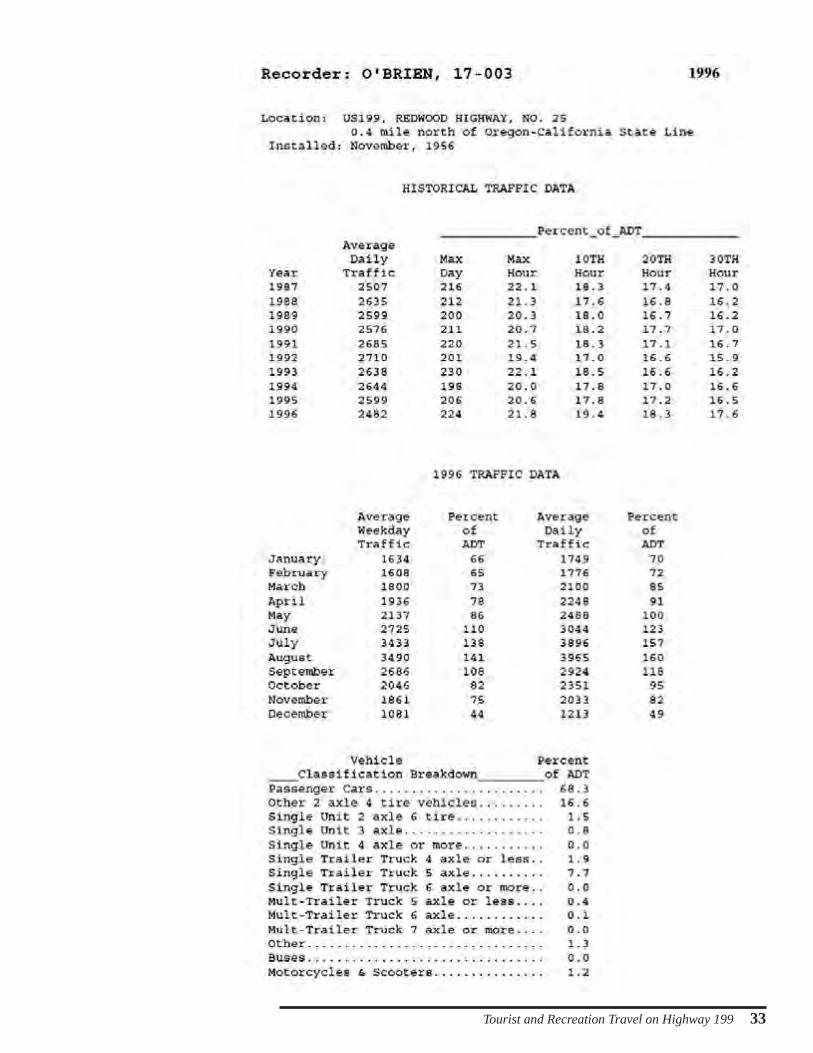
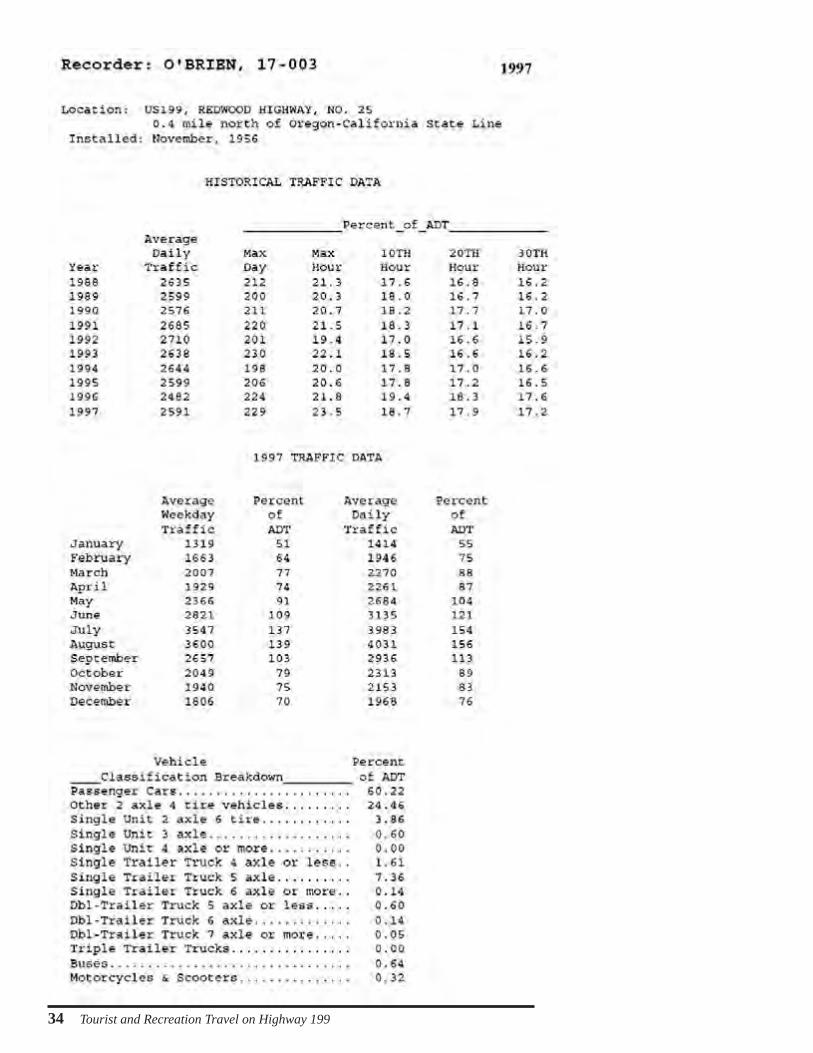
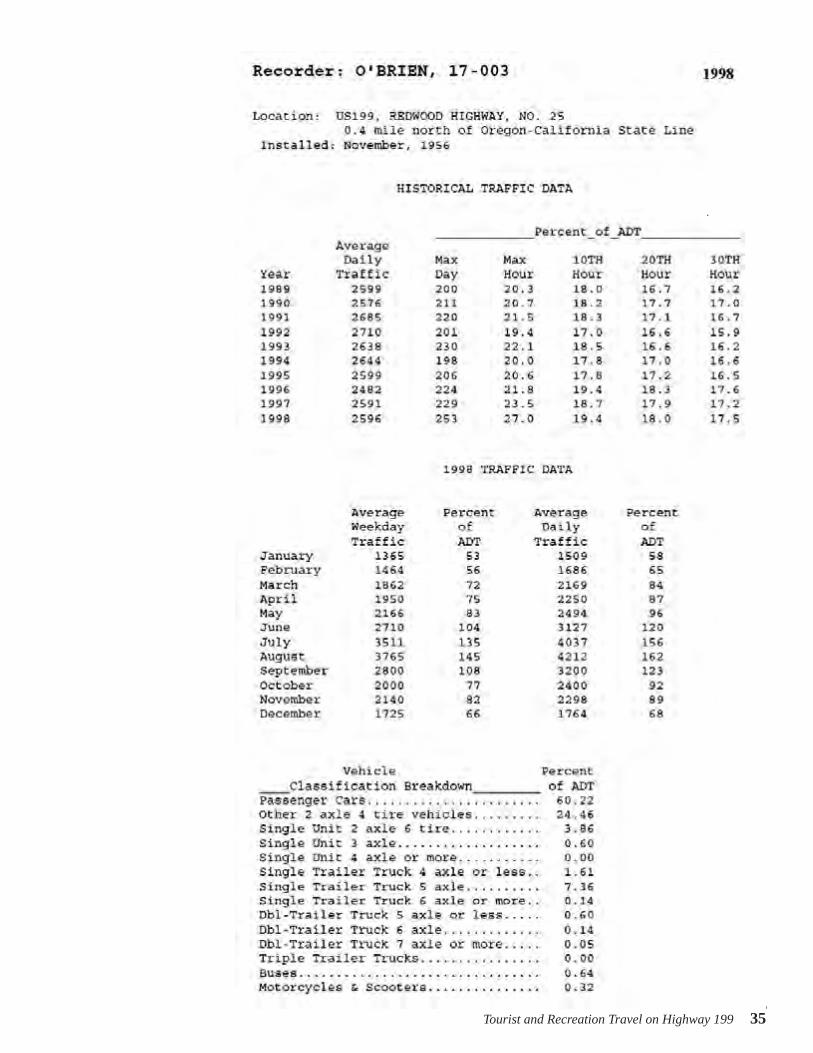
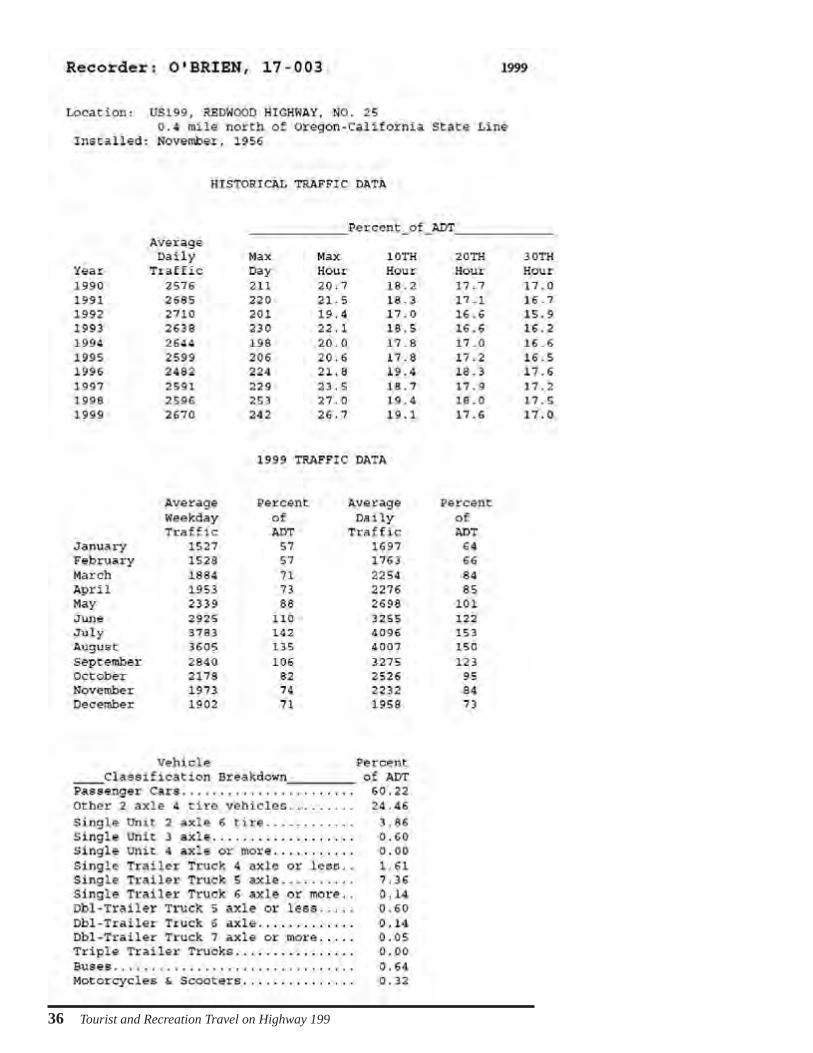
IntroductionAutomated traffic counter (ATC) stations provide some of the most accurate information on traffic volumes passing through the Highway 199 corridor. The counters use a pair of wires embedded in the pavement to track vehicle activity. The spacing of these wires also makes it possible to collect information on the numbers and types of vehicles.
There are two ATC stations on Highway 199 with both in Oregon. The oldest of these is the “O’Brien Station” located about half a mile north of the Oregon-California border. The “Timber Ridge Station” is newer and is located near Highway 199 mile marker five in Grants Pass where it tracks four lanes of traffic (two north bound and two south bound).
The automated counter at the Oregon-California border (O’Brien Station) provides the most useful information on tourist traffic into and out of Oregon. The other station (Timber Ridge) is not as useful because it is in a location here tourist and recreational traffic is mixed in with large volumes of commuter and commercial traffic entering and departing Grants Pass.
This section contains only the data tables from the “O’Brien Station” located near the Oregon-California border to retain continuity with other data collected in the same area.
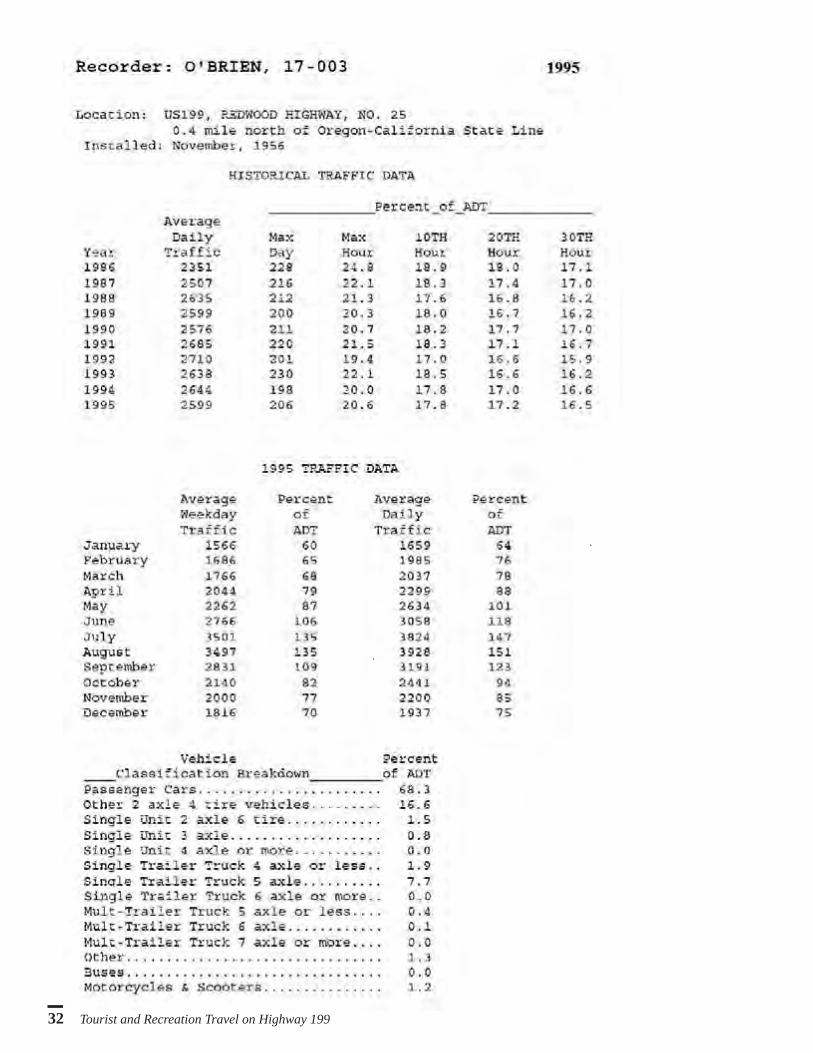
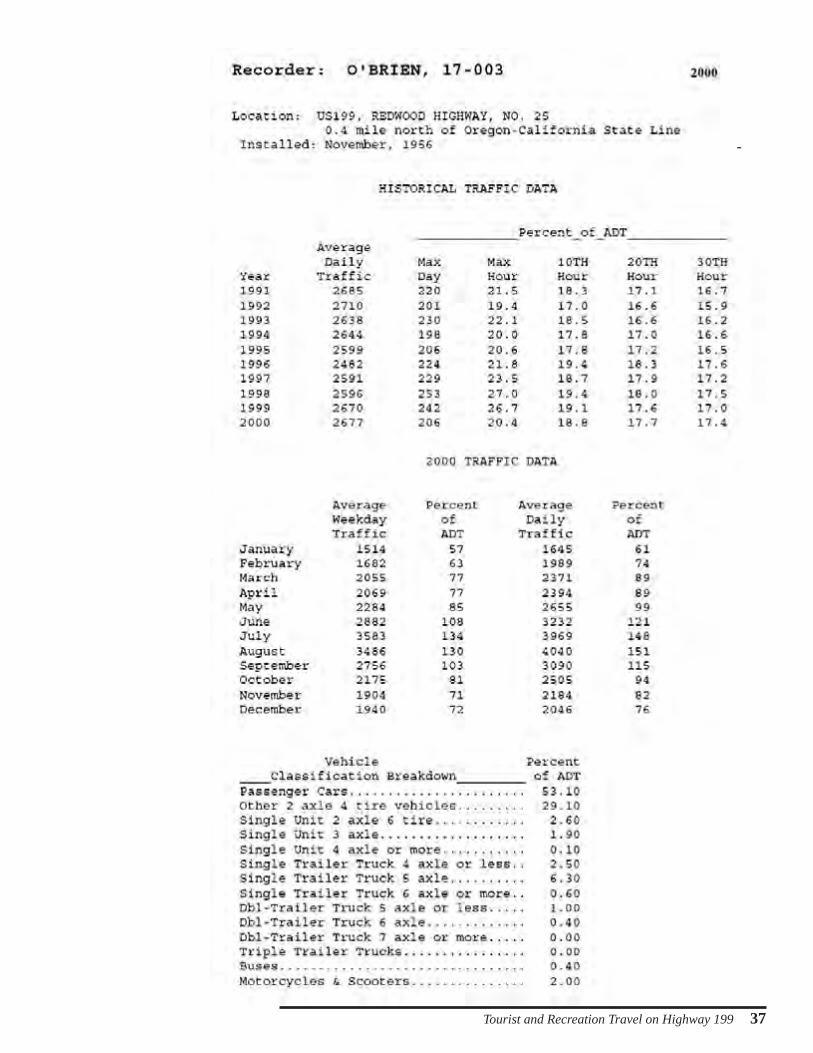
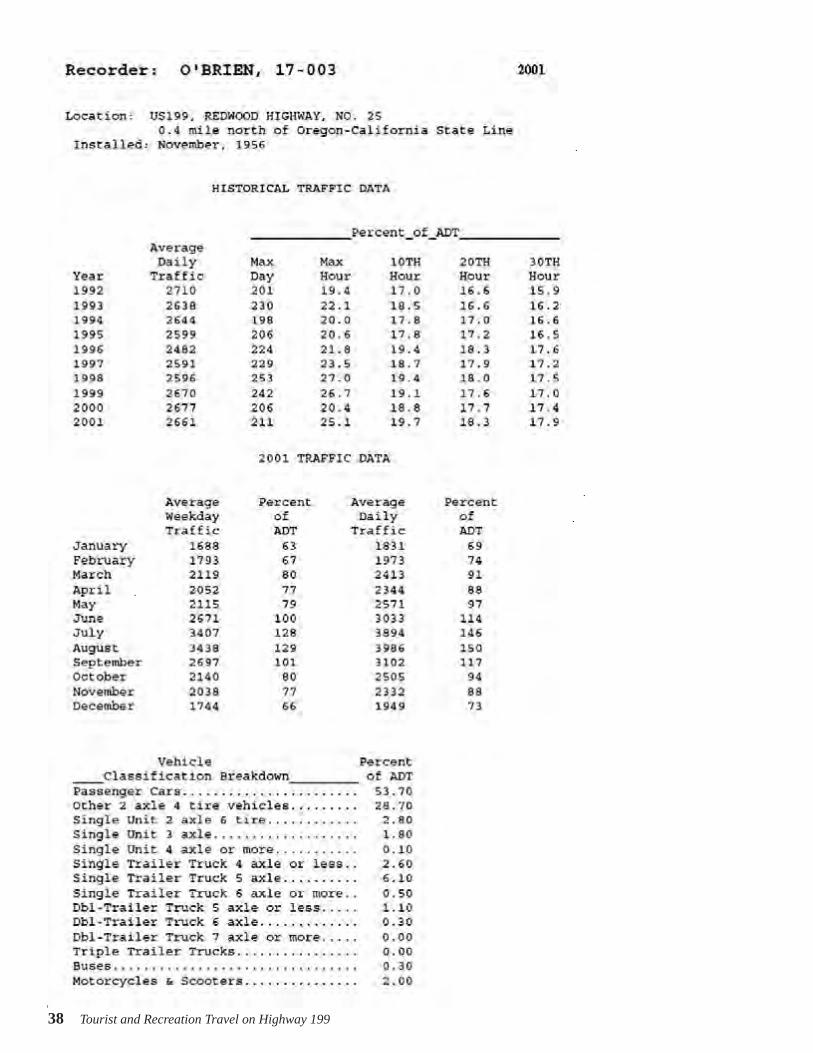
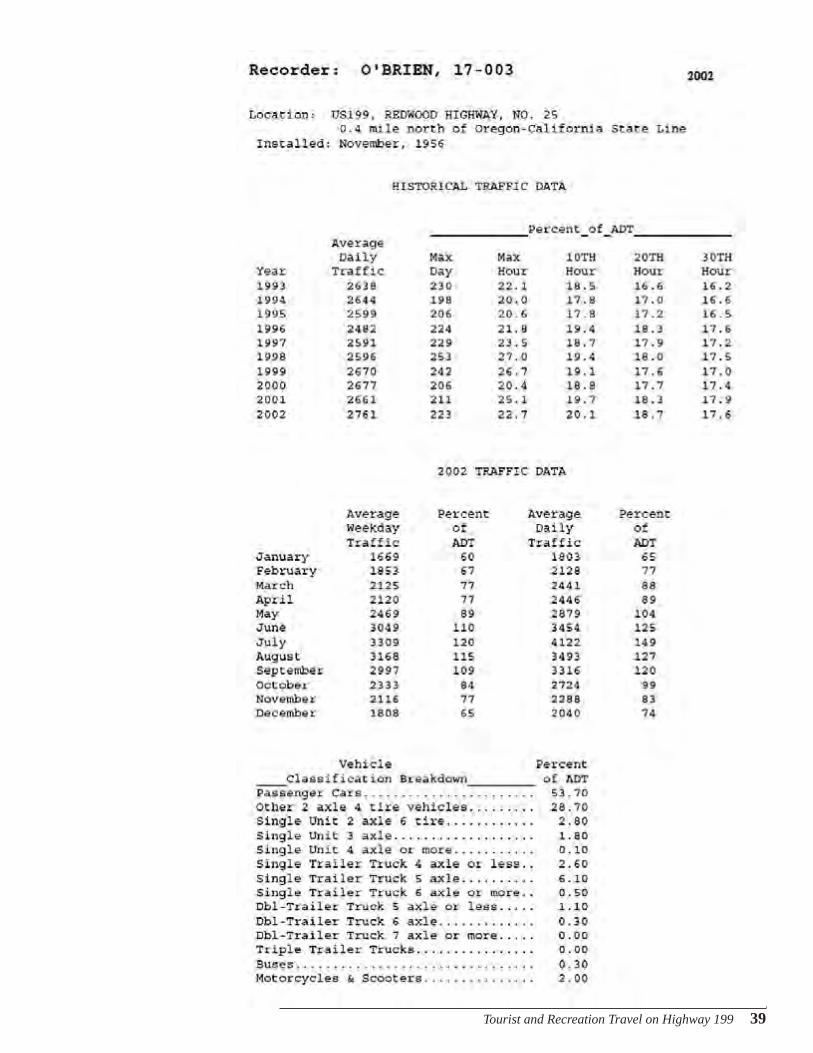
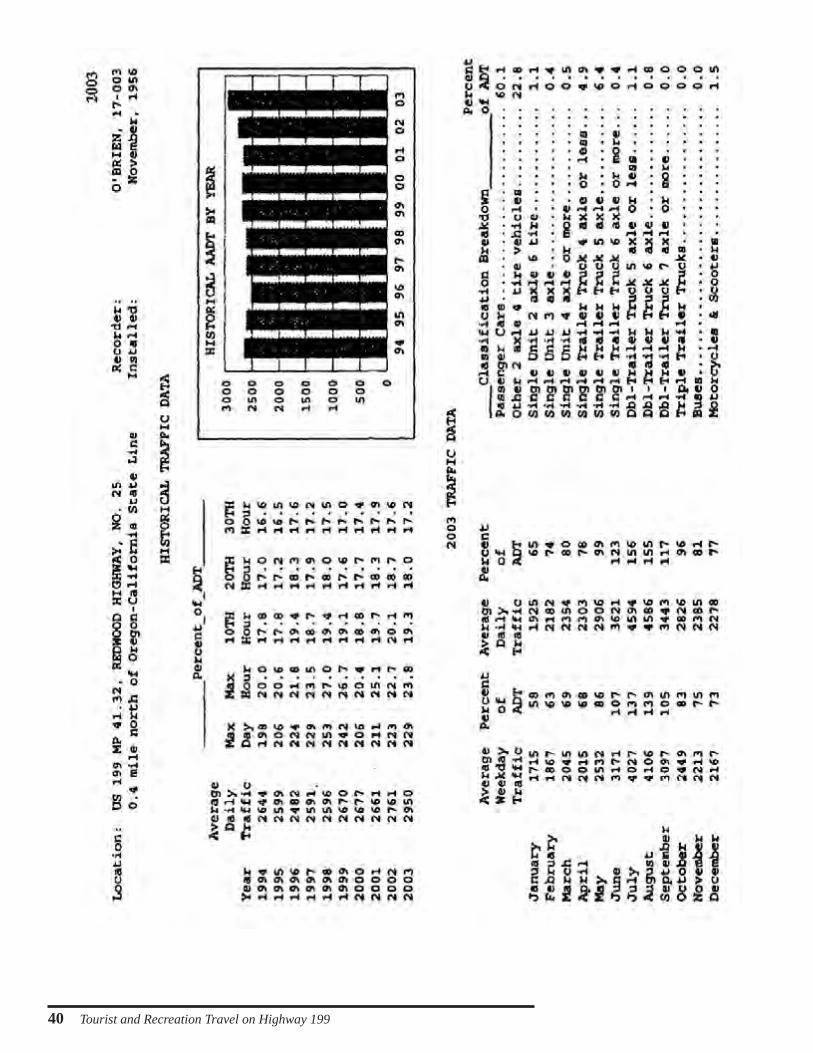
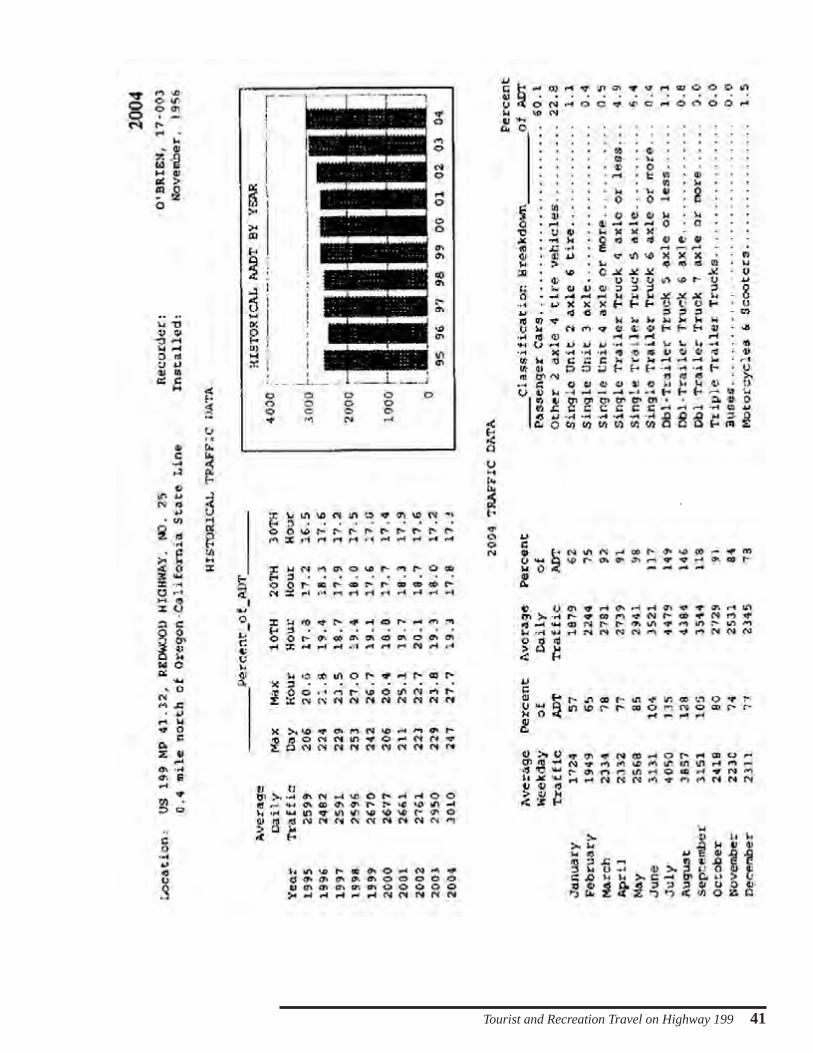
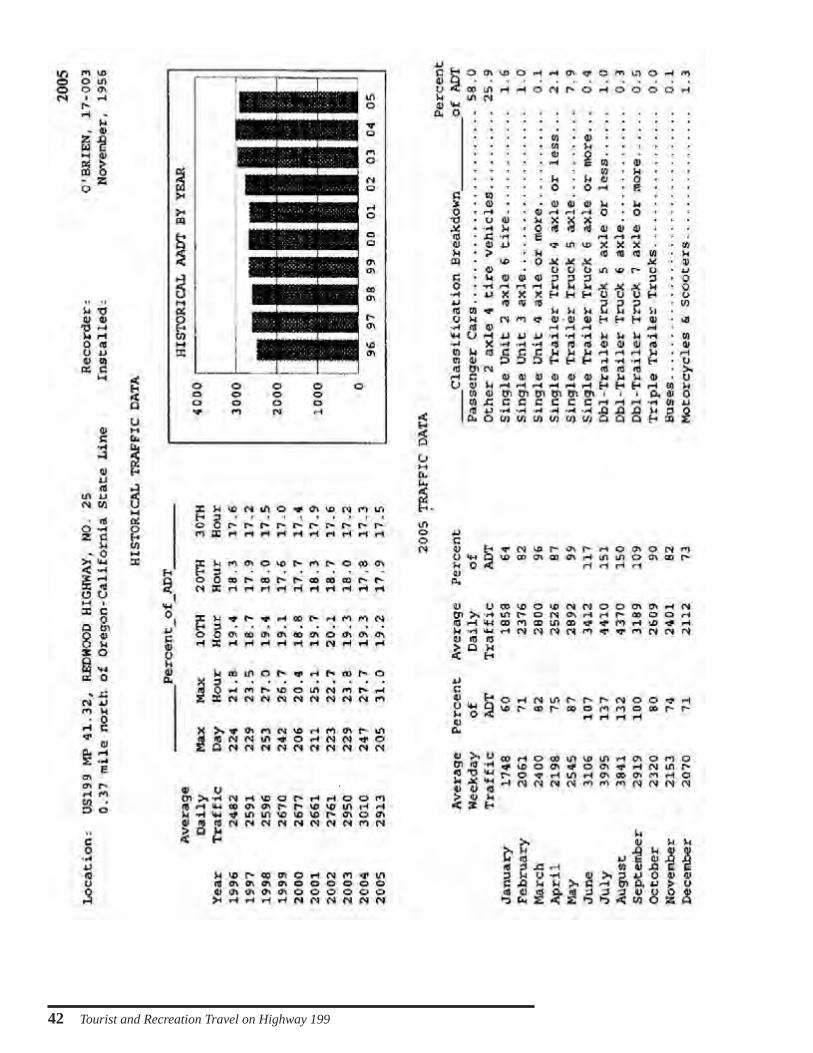
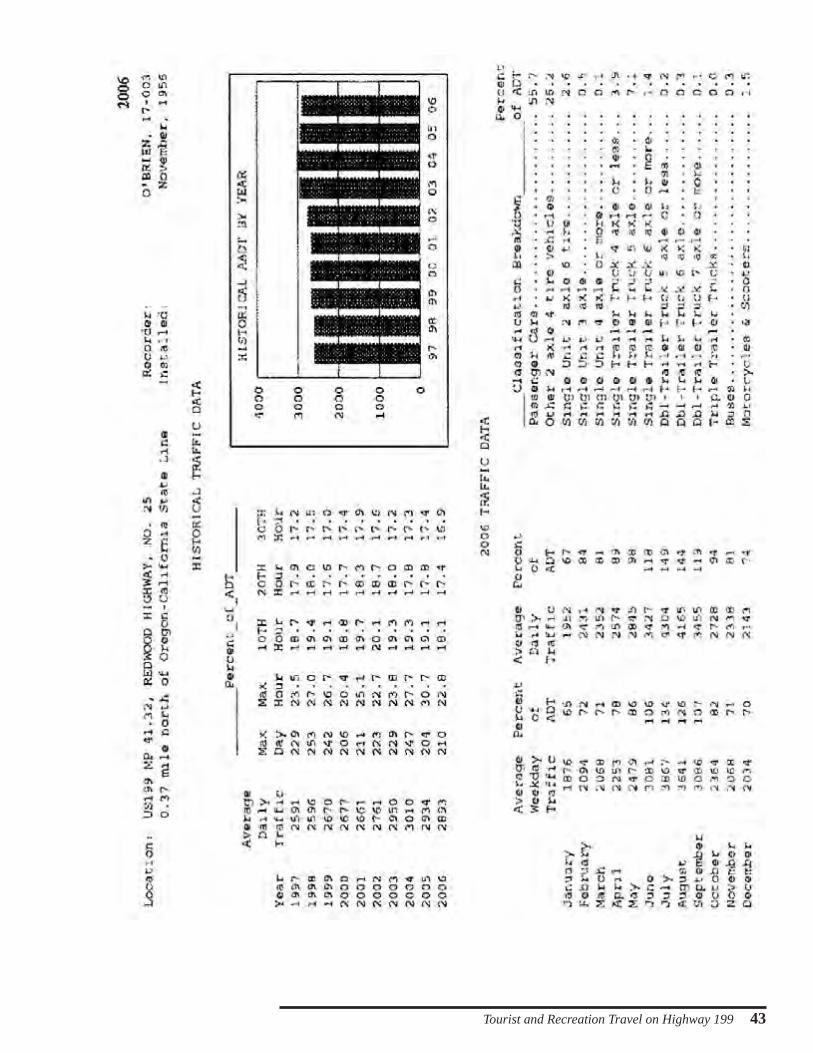
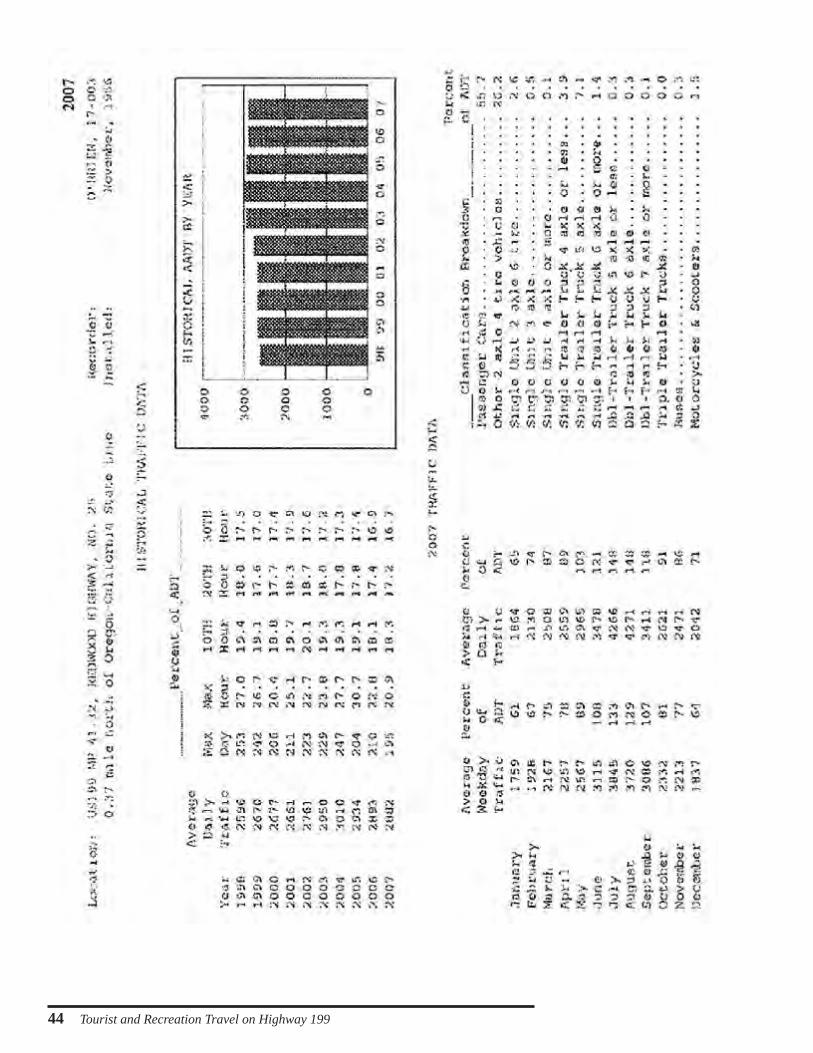
Understanding the dataThe data recorded by the ATC station is tailored for use by road engineers and highway maintenance managers and has limited use in determining the volume of tourist traffic on the Highway 199 corridor.
However, two columns of data can be useful to tourism and recreation planning: 1) the average daily traffic (ADT) for each year and 2) the ADT for each month.
Annual Average Daily Traffic (AADT) data is broken down into the maximum day, maximum hour, and 10th, 20th, and 30th hour percentages. If you want to know the total number of cars that passed the ATC station, multiply the annual ADT by 365 days. To see how many cars passed this station on the busiest day of the year, multiply the ADT by the maximum day value. Don’t forget that this value is a percentage. Move the decimal two places to the left before multiplying. Example: if the maximum day is 206, multiply the ADT by 2.06. You can also find how many cars passed the station during the busiest hour by multiplying the ADT by the value in the maximum hour column.
The 10th, 20th and 30th hour values are determined by taking all the data gathered during the 8,760 hours in a year and ranking these hours from busiest to least busy. The “10th hour” column represent the tenth highest of these days, the “20th hour” represents the 20th busiest day, and so on. This data is most useful for road design and maintenance schedules. Most road designs are based on the 30th hour values.
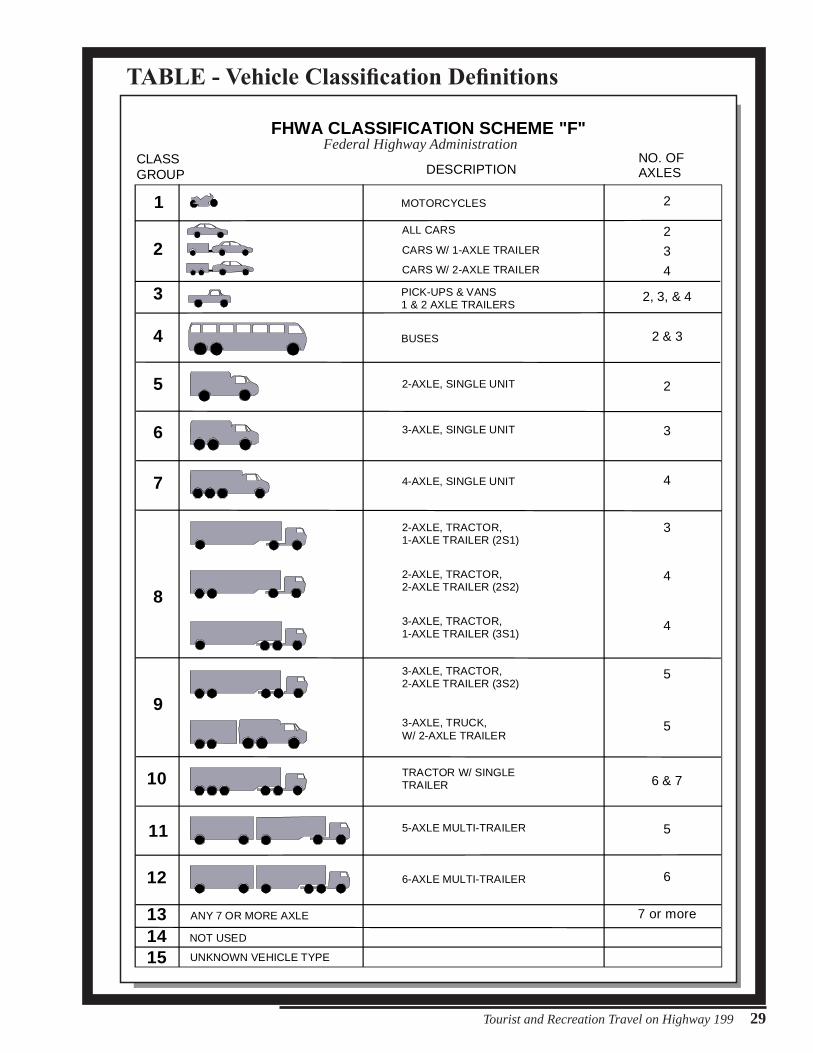
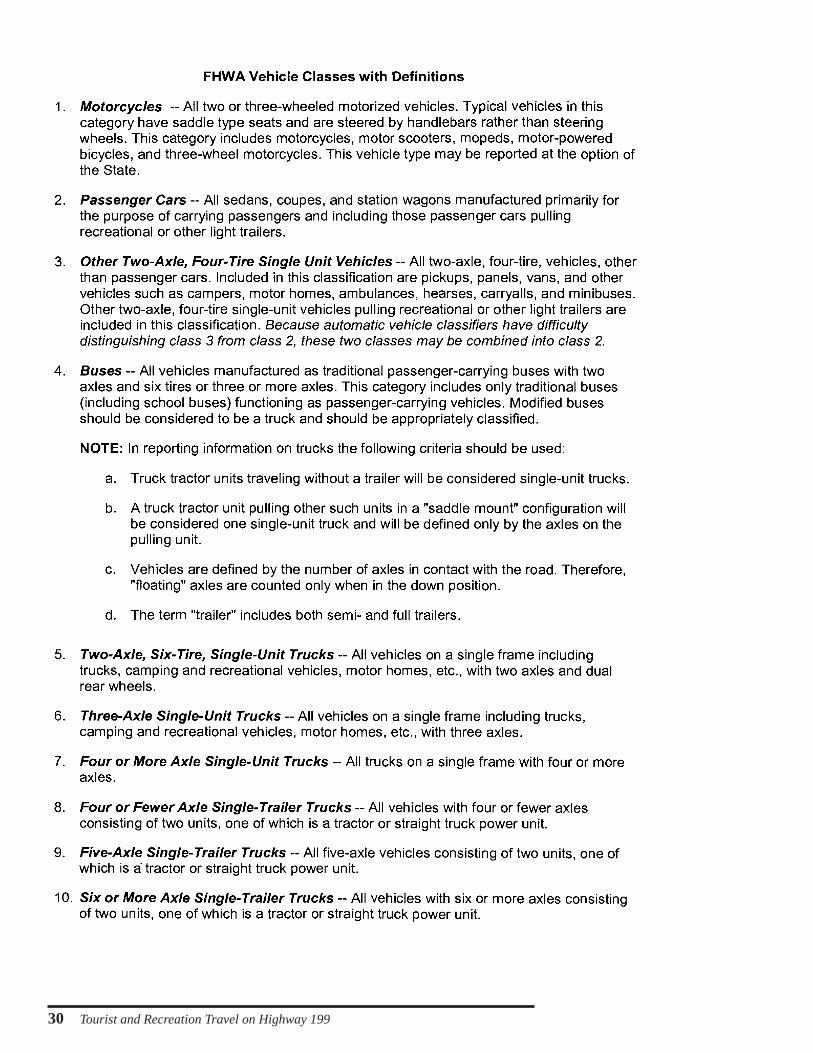
The ATC station subdivides traffic into ten categories that can be used to help determine the different type and number vehicles traveling in the Highway 199 corridor. The Federal Highway Administration (FHWA) definition sheet on the next pages explains the type of vehicles that are sorted into each of these categories.
Vehicles are categorized and sorted by the number and distance between axles but this method of categorization has limited usefulness for determining tourist traffic because it is not possible to differentiate between vehicles with similar characteristics. For example, vehicles such as motor homes, utility trucks, or delivery vans have similar wheel arrangements and are all sorted into the same category.
Tourist and Recreation Travel on Highway 199 29
2-32 Traffic Data Sources and Factors October 2002
Project Traffic Forecasting HandbookCHAPTER 2
Figure 2.2 FHWA Vehicle Classification Scheme "F"
NO. OF AXLES
2
234
2, 3, & 4
2 & 3
2
3
4
3
4
4
5
5
6 & 7
5
6
7 or more
DESCRIPTION
MOTORCYCLES
ALL CARS
CARS W/ 1-AXLE TRAILER
CARS W/ 2-AXLE TRAILER
PICK-UPS & VANS1 & 2 AXLE TRAILERS
BUSES
2-AXLE, SINGLE UNIT
3-AXLE, SINGLE UNIT
4-AXLE, SINGLE UNIT
2-AXLE, TRACTOR,1-AXLE TRAILER (2S1)
2-AXLE, TRACTOR,2-AXLE TRAILER (2S2)
3-AXLE, TRACTOR,1-AXLE TRAILER (3S1)
3-AXLE, TRACTOR,2-AXLE TRAILER (3S2)
3-AXLE, TRUCK,W/ 2-AXLE TRAILER
TRACTOR W/ SINGLETRAILER
6-AXLE MULTI-TRAILER
5-AXLE MULTI-TRAILER
1
2
3
4
5
6
7
8
9
10
11
12
131415
CLASSGROUP
ANY 7 OR MORE AXLE
NOT USED
UNKNOWN VEHICLE TYPE
FHWA CLASSIFICATION SCHEME "F"
TABLE - Vehicle Classification Definitions
Federal Highway Administration
30 Tourist and Recreation Travel on Highway 199
Tourist and Recreation Travel on Highway 199 31
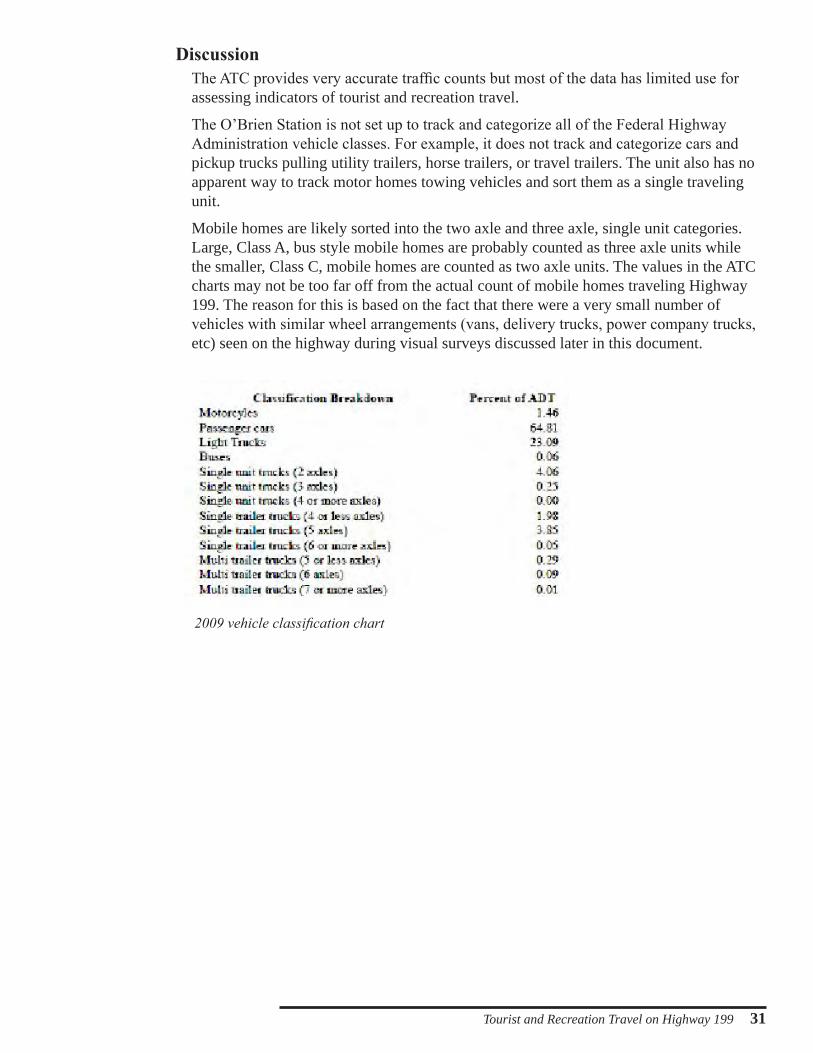
DiscussionThe ATC provides very accurate traffic counts but most of the data has limited use for assessing indicators of tourist and recreation travel.
The O’Brien Station is not set up to track and categorize all of the Federal Highway Administration vehicle classes. For example, it does not track and categorize cars and pickup trucks pulling utility trailers, horse trailers, or travel trailers. The unit also has no apparent way to track motor homes towing vehicles and sort them as a single traveling unit.
Mobile homes are likely sorted into the two axle and three axle, single unit categories. Large, Class A, bus style mobile homes are probably counted as three axle units while the smaller, Class C, mobile homes are counted as two axle units. The values in the ATC charts may not be too far off from the actual count of mobile homes traveling Highway 199. The reason for this is based on the fact that there were a very small number of vehicles with similar wheel arrangements (vans, delivery trucks, power company trucks, etc) seen on the highway during visual surveys discussed later in this document.
2009 vehicle classification chart
32 Tourist and Recreation Travel on Highway 199
Tourist and Recreation Travel on Highway 199 33
34 Tourist and Recreation Travel on Highway 199
Tourist and Recreation Travel on Highway 199 35
36 Tourist and Recreation Travel on Highway 199
Tourist and Recreation Travel on Highway 199 37
38 Tourist and Recreation Travel on Highway 199
Tourist and Recreation Travel on Highway 199 39
40 Tourist and Recreation Travel on Highway 199
Tourist and Recreation Travel on Highway 199 41
42 Tourist and Recreation Travel on Highway 199
Tourist and Recreation Travel on Highway 199 43
44 Tourist and Recreation Travel on Highway 199
Tourist and Recreation Travel on Highway 199 45
46 Tourist and Recreation Travel on Highway 199
Tourist and Recreation Travel on Highway 199 47
California State Traffic Volume Records
SummaryThis section contains the least useful traffic information in the document because the traffic numbers on the California side of the Highway 199 corridor appear to have been derived from a formula rather than from actual vehicle counts.
48 Tourist and Recreation Travel on Highway 199
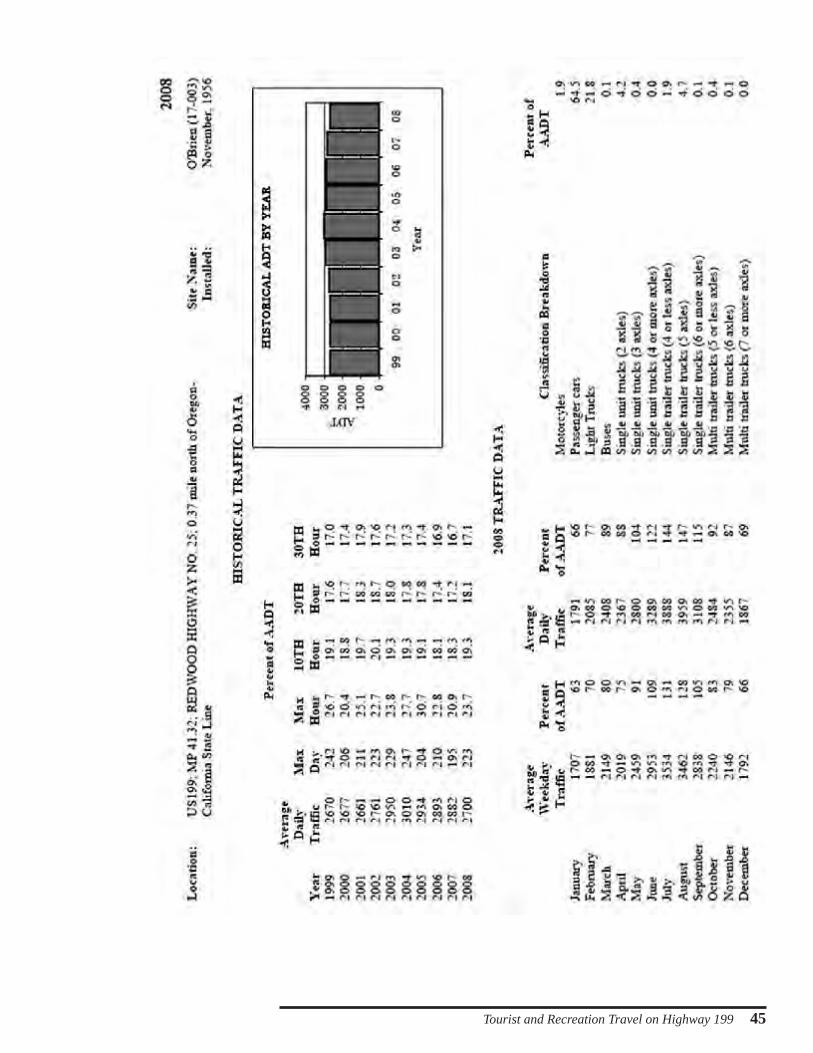
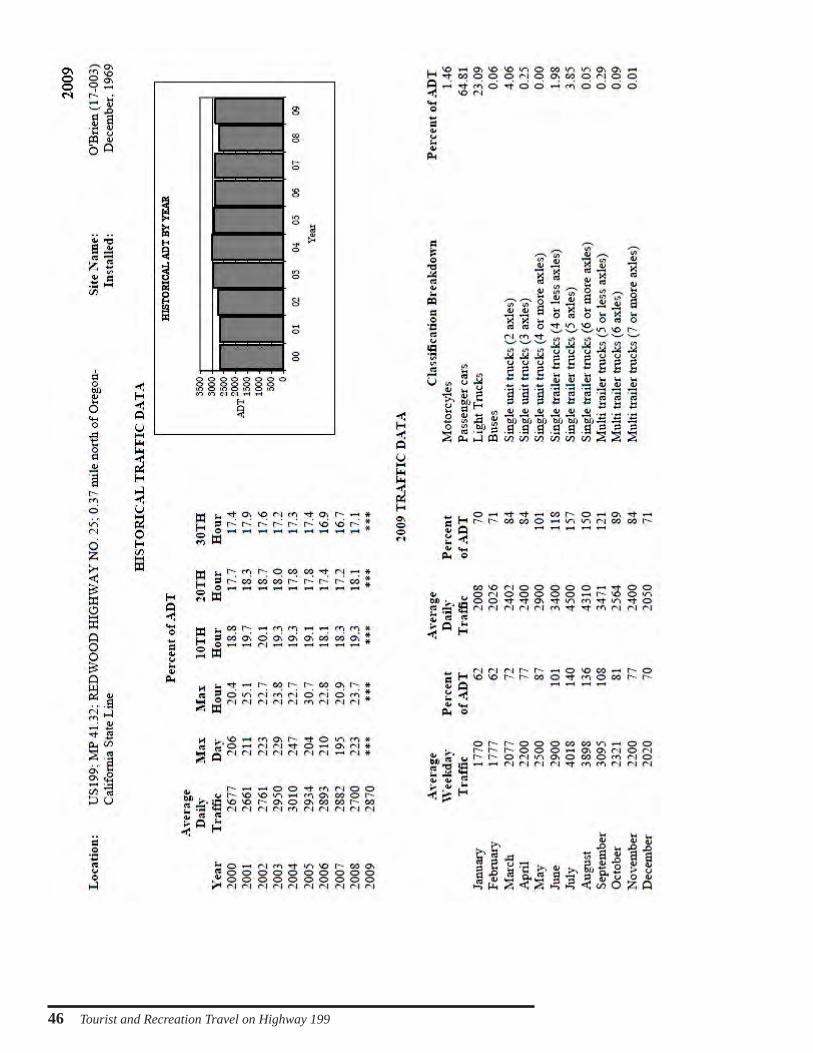
IntroductionNo information was obtained on how the California State Department of Transportation tracks the number of vehicles for their traffic records taken at different reference points along Highway 199.
There is no apparent agreement in the number of vehicles counted in Oregon and the numbers counted in California. The most obvious of these anomalies is found at the Oregon-California border where vehicle counts in California are given only for the south bound lane of traffic. These estimates for a single lane of traffic are equal to or greater than the number of vehicles counted in both lanes by the automated traffic counter (ATC) in Oregon, located about half a mile north of the border.
The California traffic data appears to have been derived from a formula rather than from mechanical or observed vehicle counts and for this reason offer no tangible usefulness for this report.
Understanding the dataThe data records use ahead and back to indicate traffic direction. Back indicates south bound traffic and ahead indicates north bound.
AADT = Annual Average Daily Traffic
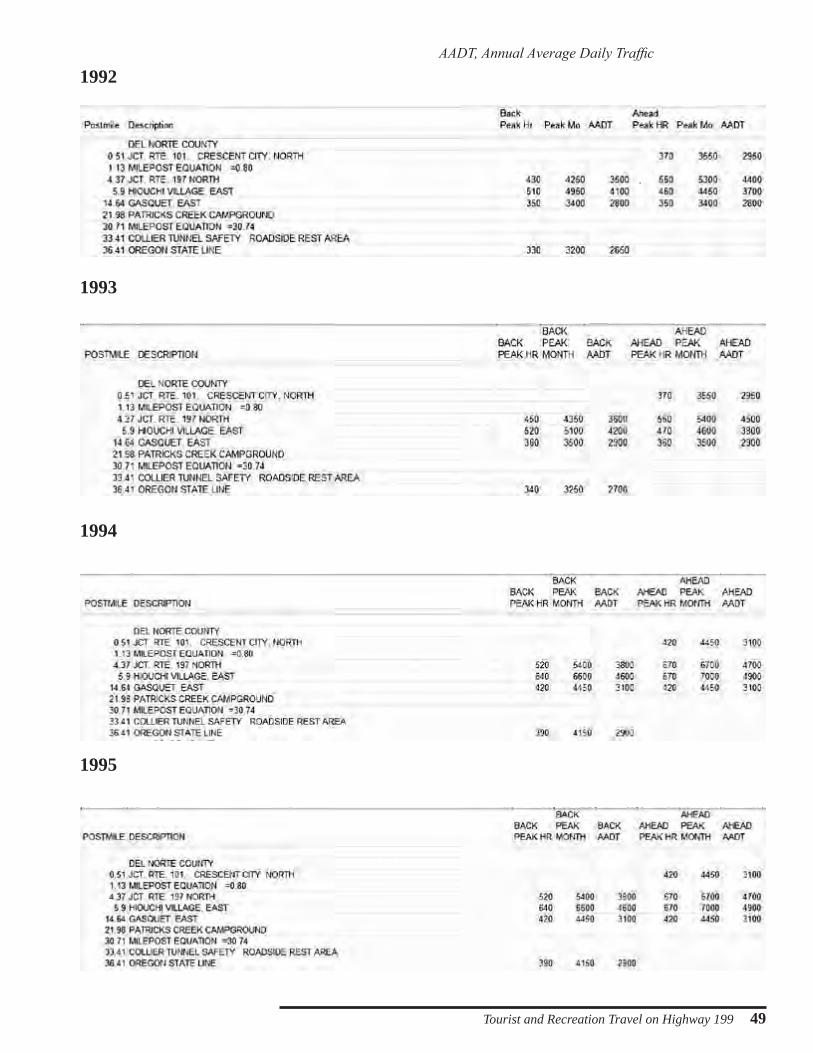
Tourist and Recreation Travel on Highway 199 49
1992
1993
1994
1995
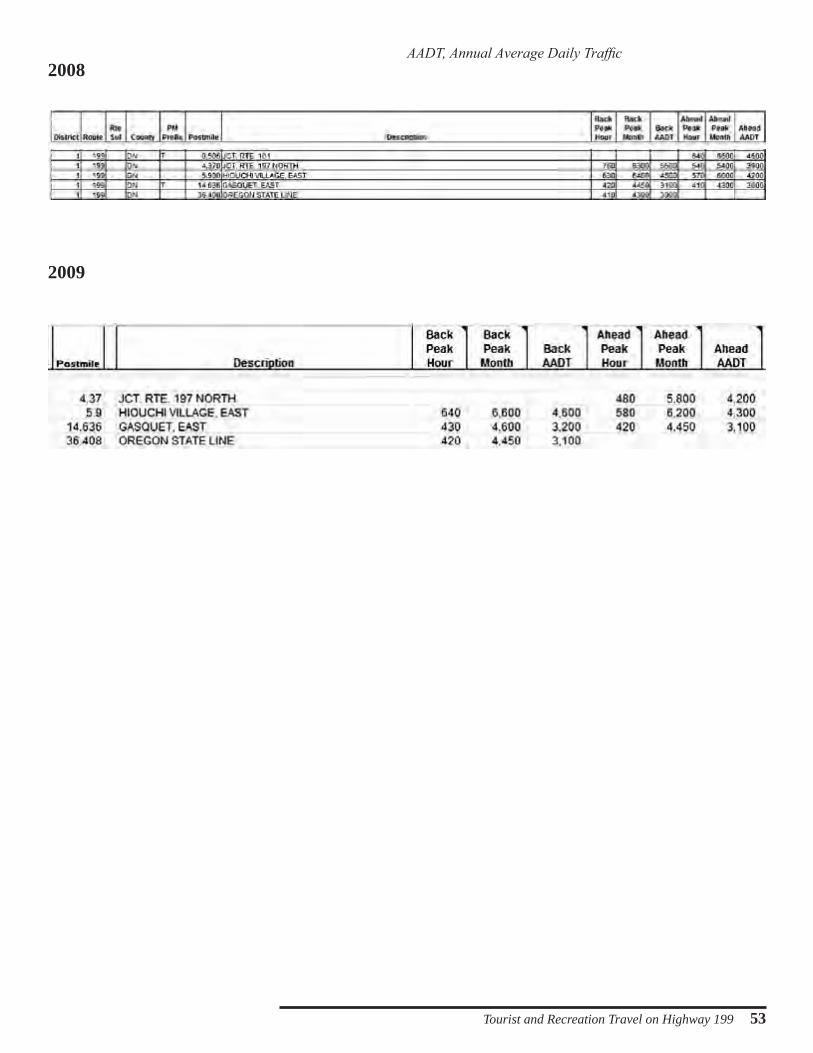
AADT, Annual Average Daily Traffic
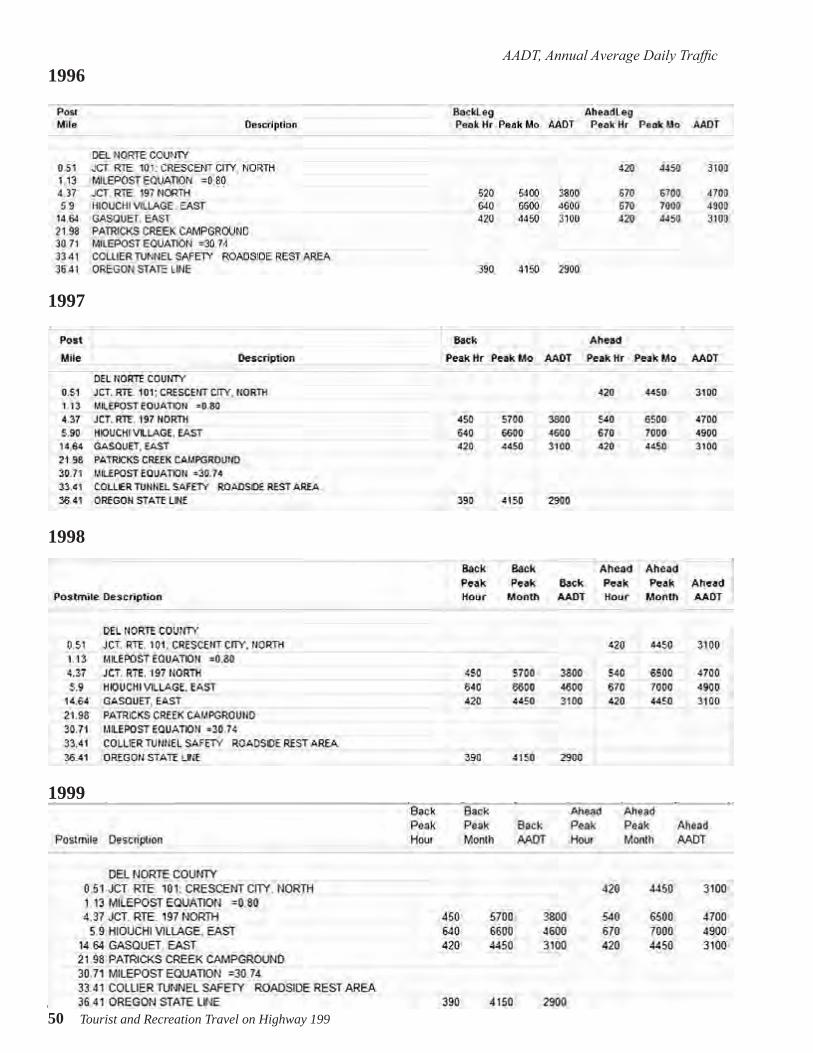
50 Tourist and Recreation Travel on Highway 199
1996
1997
1998
1999
AADT, Annual Average Daily Traffic
Tourist and Recreation Travel on Highway 199 51
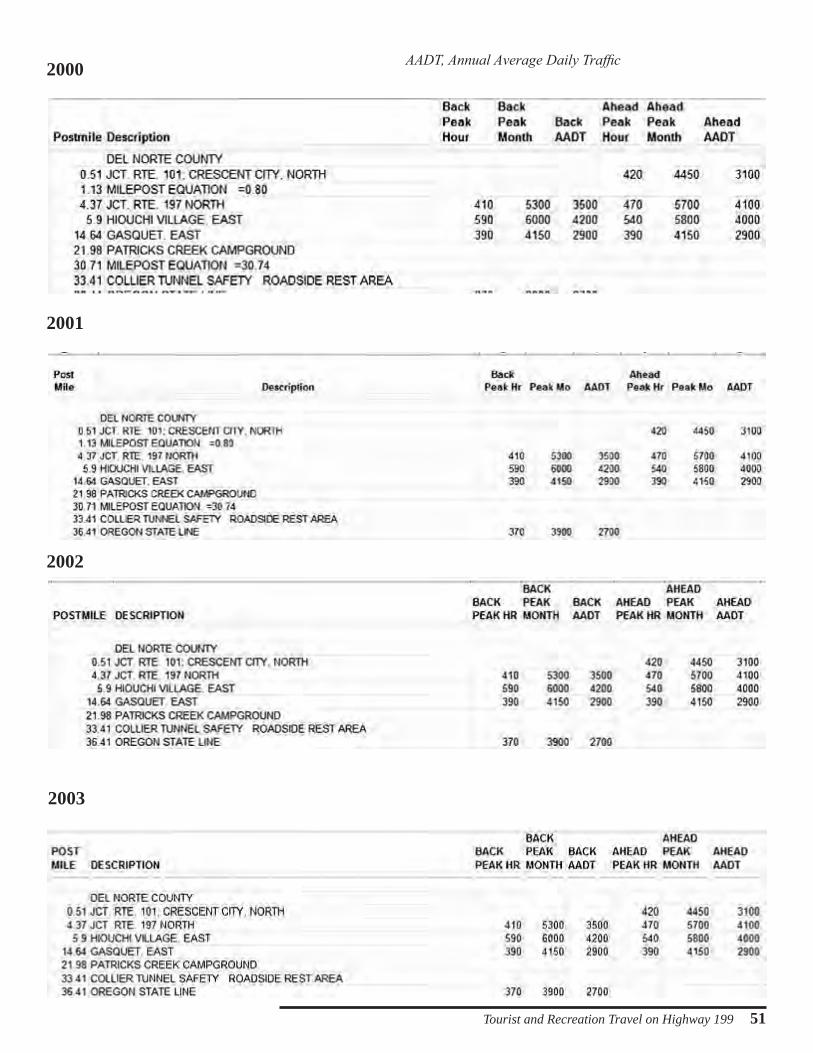
2000
2001
2002
2003
AADT, Annual Average Daily Traffic
52 Tourist and Recreation Travel on Highway 199
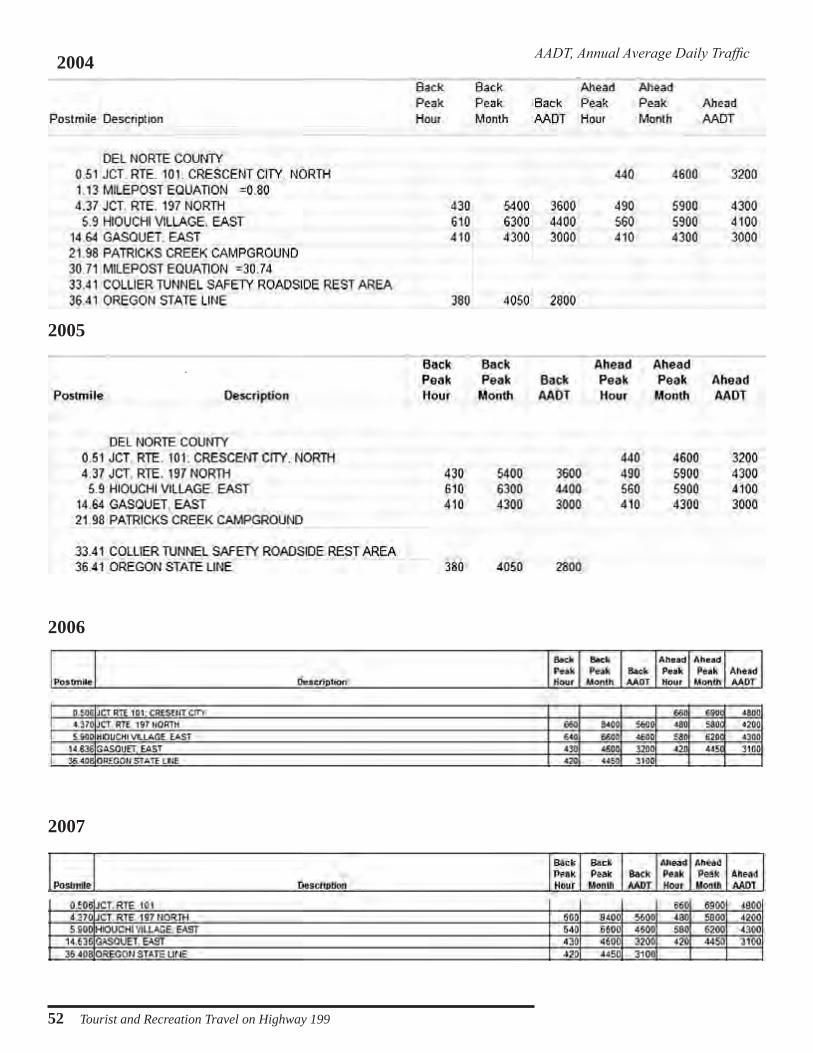
2004
2005
2006
2007
AADT, Annual Average Daily Traffic
Tourist and Recreation Travel on Highway 199 53
2008
2009
AADT, Annual Average Daily Traffic
54 Tourist and Recreation Travel on Highway 199
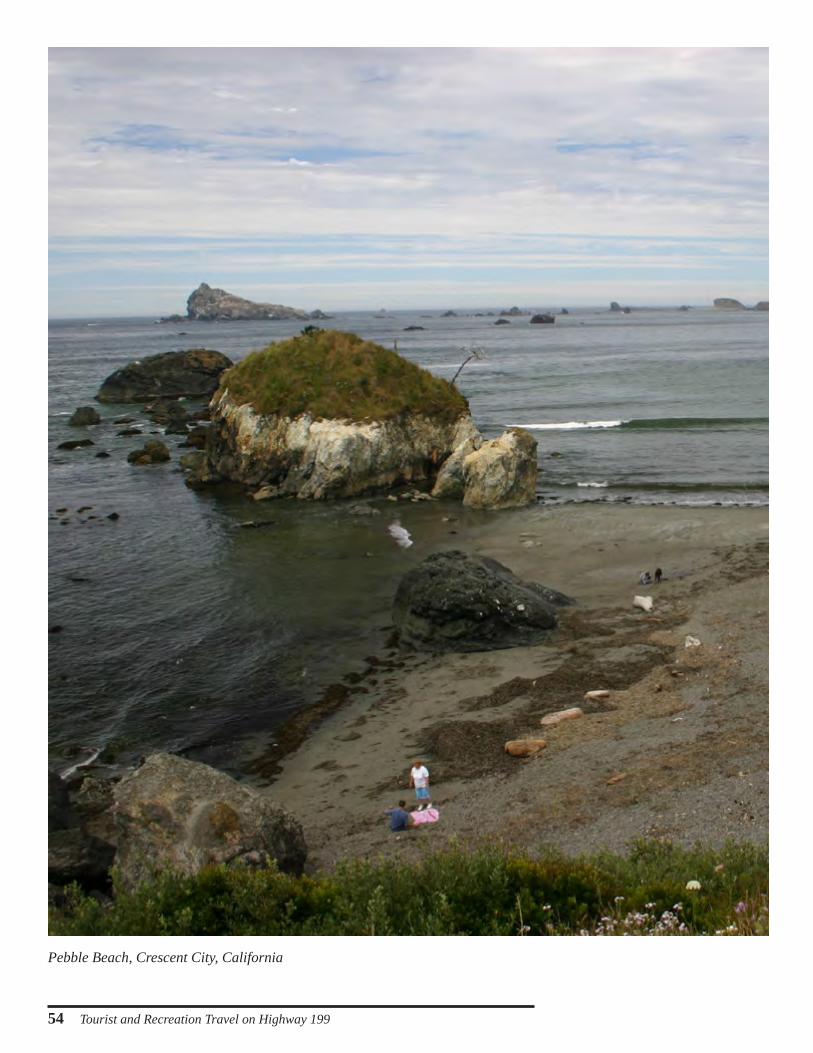
Pebble Beach, Crescent City, California
Tourist and Recreation Travel on Highway 199 55
California State Agriculture Station Records
SummaryThis section provides very limited information on total traffic. The most useful is a rough estimate of the number of mobile homes and travel trailers driving south on Highway 199.
Recreational vehicles 3% (south moving traffic only)
Assuming that there are about the same number of recreational vehicles traveling north, it can be estimated that about 6% of the total traffic going through the Highway 199 corridor are travel trailers, campers, and mobile homes.
56 Tourist and Recreation Travel on Highway 199
California Agriculture StationThe Redwood Agriculture Inspection Station is located about a half a mile south of the Oregon - California border and its primary purpose is to reduce or prevent pests and disease from being brought into the state.
The staff at this station keeps count of vehicles entering California, which is done by pushing the lever on mechanical counters. There is one counter used for cars and pickup trucks that pass through the station’s main inspection lanes and a separate counter for motor homes, travel trailers, and small cargo vehicles that pass through a lane outside of the building. The cargo vehicles are typically UHaul, Budget, or other type of rental trucks used for interstate travel.
Until recently, the station has been occupied on an irregular basis; open on some days and closed on others. During these years, tracking of vehicles passing through the station has not been consistent.
In January of 2010, the station has again been opened for 24 hours a day, every day of the week. This is why the records provided for this document (see below) include only the months of January through August 2010.
Tracking of vehicles at this station is understandably subject to error. During peak periods of vehicles passing through the main inspection lanes of the station and motor homes passing through on a separate lane outside of the building, staff sometimes has difficulty getting to the mechanical counting device and entering the numbers of vehicles or RVs they have interacted with.
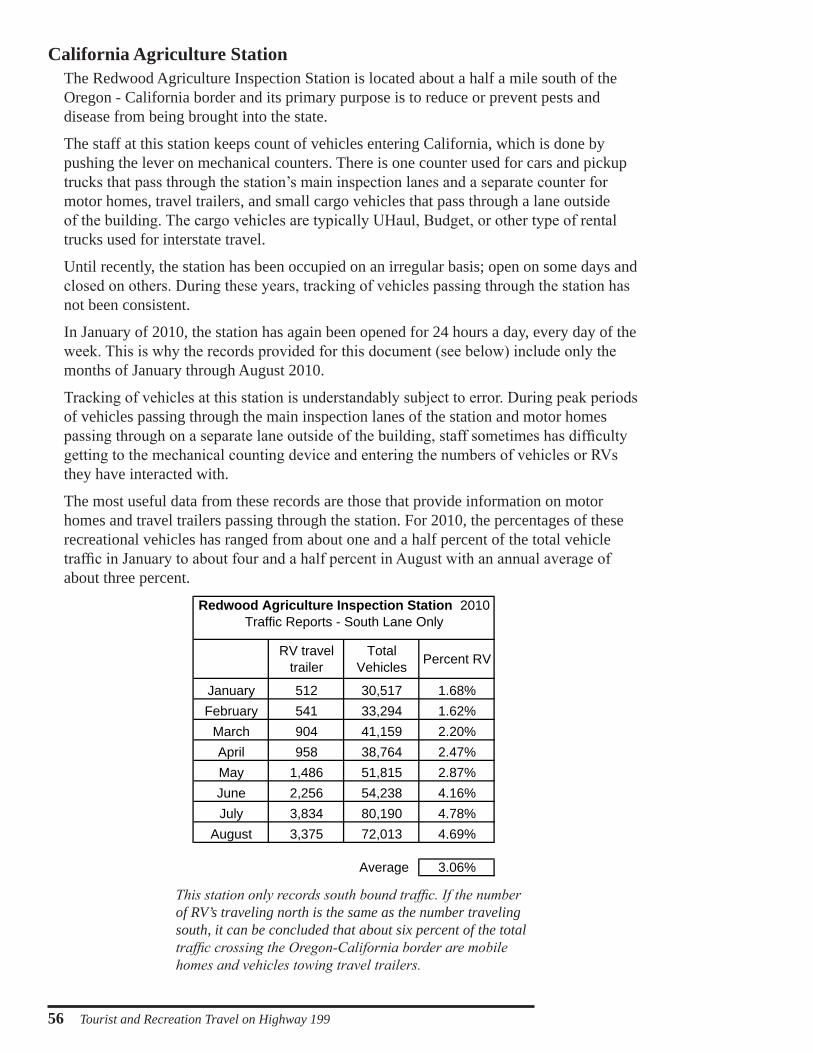
The most useful data from these records are those that provide information on motor homes and travel trailers passing through the station. For 2010, the percentages of these recreational vehicles has ranged from about one and a half percent of the total vehicle traffic in January to about four and a half percent in August with an annual average of about three percent.
RV travel trailer
TotalVehicles Percent RV
January 512 30,517 1.68%February 541 33,294 1.62%
March 904 41,159 2.20%April 958 38,764 2.47%May 1,486 51,815 2.87%June 2,256 54,238 4.16%July 3,834 80,190 4.78%
August 3,375 72,013 4.69%
3.06%
Redwood Agriculture Inspection Station 2010 Traffic Reports - South Lane Only
Average
This station only records south bound traffic. If the number of RV’s traveling north is the same as the number traveling south, it can be concluded that about six percent of the total traffic crossing the Oregon-California border are mobile homes and vehicles towing travel trailers.
Tourist and Recreation Travel on Highway 199 57
Independent Survey Visual Traffic Observations
SummaryThis section provides the best indicators of recreation and tourist traffic which were obtained by direct observation during five randomly selected days in the month of August.
Passenger car & pickup .................. 87%
Motorcycles ................................... 5%
Recreational vehicle ....................... 6%
Commerce ...................................... 1%
Passenger cars and pickups are further subdivided2% with a rooftop cargo box3% towing trailers 3% carrying recreation equipment
Recreational vehicles can be subdivided into three groups:
10% Camper 50% Vehicles towing travel trailers30% Mobile homes with about one third having
a vehicle in tow.
In all five days of traffic observations, the number of vehicles moving in north and south lanes were approximately the same. There was no predominant direction of traffic movement.
58 Tourist and Recreation Travel on Highway 199
IntroductionIn the previous sections of this report, data from traffic surveys from California and Oregon have been helpful in providing a record of total traffic but have limited usefulness for determining the volume of tourist and recreation travel in the Highway 199 corridor. This section represents another approach to understanding tourist and recreation travel numbers through the use of visual surveys.
MethodThe observer sat by the roadside at the California-Oregon border where vehicle activity was recorded on tracking sheets designed for this survey.
DiscussionThis visual survey makes an attempt to count the number of vehicles carrying recreational equipment and quantify the different types of recreation equipment being carried. These records provide reliable indicators of recreation travel but this information should not be interpreted as defining the entire extent of recreation and tourist traffic on Highway 199. The reason why is explained below.
Some of the most popular recreational activities enjoyed by Americans do not require specialized or expensive equipment. According to the Forest Service’s National Survey on Recreation and Environment (NSRE), the largest recreation survey in the United States, the number one recreational activity in America is walking followed closely by hiking. The NSRE also notes that the most popular place for recreational activities is near water such as beaches, lakes, and rivers where swimming and fishing are likely to be popular activities.
Another important reason for travel in this region can be found in surveys conducted at Oregon Caves National Monument and Rogue River - Siskiyou National Forest where visitors identified “viewing scenery” as their main reason for travel.
It is important to keep in mind that the Highway 199 corridor offers many things that are high motivators for recreation and tourist travel such as hikes through the redwood forest, strolls on the beach, rafting on the Rogue River, walking through Oregon Caves, swimming in the wild and scenic Illinois River, spectacular scenic landscapes of the Smith River National Recreation Area and Oregon coast, fishing at Lake Selmac, and picnicking at high elevation lakes in the region. Highway 199 is a powerful tourist corridor because it offers many things that are identified as the top motivators for tourist and recreation travel.
Future surveysThese visual surveys were conducted from six in the morning to six in the evening. However, it was observed during these surveys that after six in the evening, traffic continued to be strong. In the future, summer surveys should be conducted from eight in the morning to eight in the evening.
Tourist and Recreation Travel on Highway 199 59
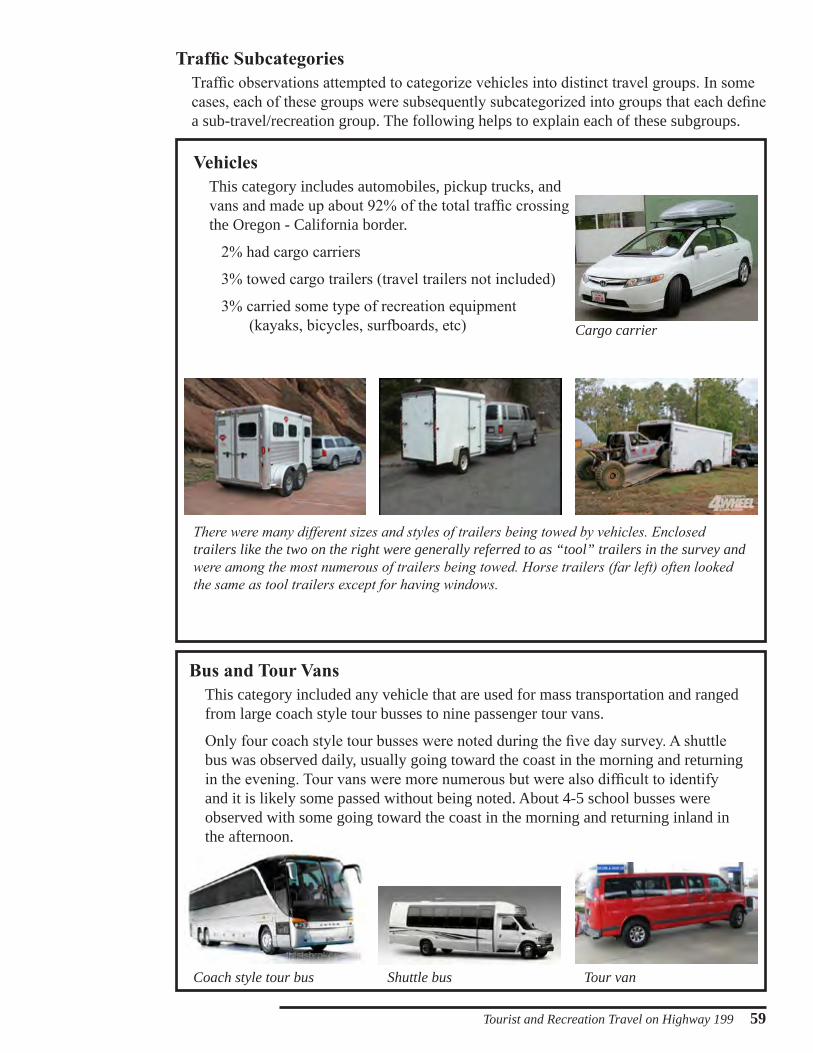
Traffic SubcategoriesTraffic observations attempted to categorize vehicles into distinct travel groups. In some cases, each of these groups were subsequently subcategorized into groups that each define a sub-travel/recreation group. The following helps to explain each of these subgroups.
VehiclesThis category includes automobiles, pickup trucks, and vans and made up about 92% of the total traffic crossing the Oregon - California border.
2% had cargo carriers
3% towed cargo trailers (travel trailers not included)
3% carried some type of recreation equipment (kayaks, bicycles, surfboards, etc)
Bus and Tour VansThis category included any vehicle that are used for mass transportation and ranged from large coach style tour busses to nine passenger tour vans.
Only four coach style tour busses were noted during the five day survey. A shuttle bus was observed daily, usually going toward the coast in the morning and returning in the evening. Tour vans were more numerous but were also difficult to identify and it is likely some passed without being noted. About 4-5 school busses were observed with some going toward the coast in the morning and returning inland in the afternoon.
Cargo carrier
There were many different sizes and styles of trailers being towed by vehicles. Enclosed trailers like the two on the right were generally referred to as “tool” trailers in the survey and were among the most numerous of trailers being towed. Horse trailers (far left) often looked the same as tool trailers except for having windows.
Coach style tour bus Shuttle bus Tour van
60 Tourist and Recreation Travel on Highway 199
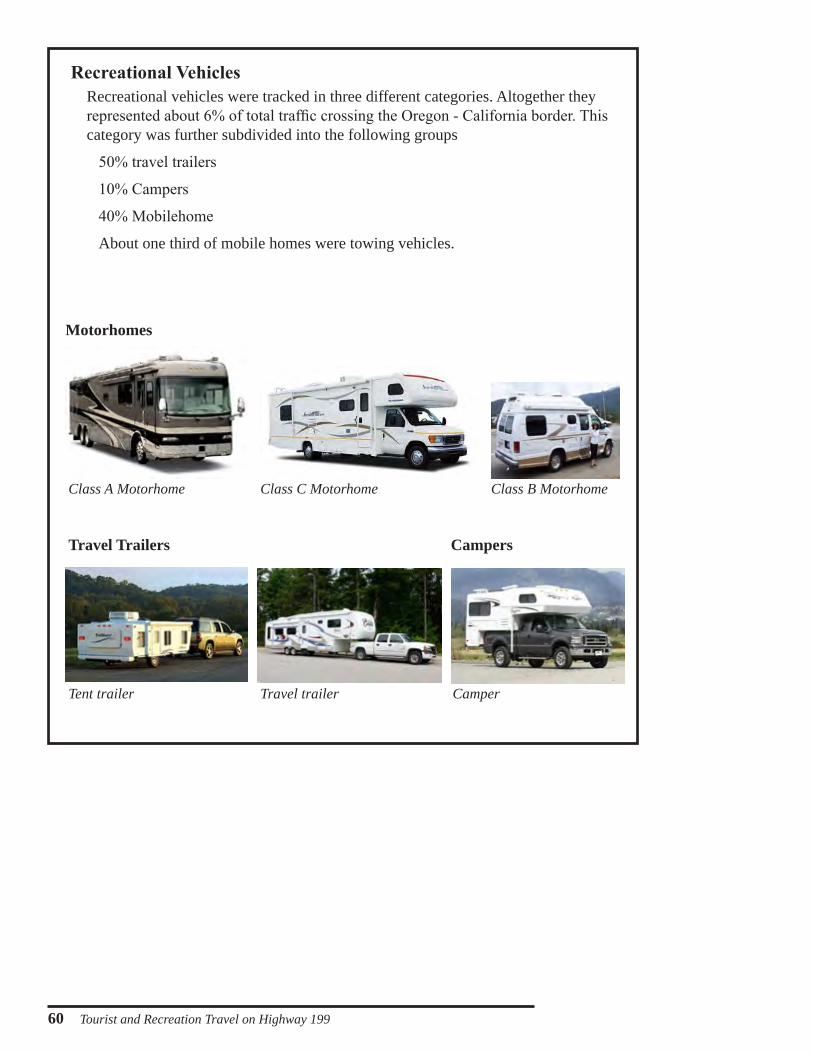
Motorhomes
Class A Motorhome Class C Motorhome Class B Motorhome
Travel Trailers Campers
Tent trailer Travel trailer Camper
Recreational VehiclesRecreational vehicles were tracked in three different categories. Altogether they represented about 6% of total traffic crossing the Oregon - California border. This category was further subdivided into the following groups
50% travel trailers
10% Campers
40% Mobilehome
About one third of mobile homes were towing vehicles.
Tourist and Recreation Travel on Highway 199 61
North South North South North South North South TotalAuto total 1,226 1,266 1,547 1,780 1,366 1,291 1,994 1,719 12,189Cargo box 34 36 30 41 30 30 38 36 275 2%
Trailer 46 30 70 47 34 38 64 87 416
Bicycles 11 18 22 21 15 22 16 20 145Boat 10 6 25 11 19 8 23 42 144
Canoe 1 0 2 4 0 0 1 0 8Horse trailer 1 3 7 4 5 1 8 2 31
Jet ski 0 0 0 1 0 0 4 3 8Kayak 8 3 5 7 1 5 5 3 37
Motorcycle 0 1 1 2 2 0 2 2 10Quad / ATV 2 0 0 1 5 5 5 1 19
Surfboard 3 5 6 6 1 1 9 4 35 437 3%
Tour van 0 0 2 2 1 1 3 3 12Shuttle bus 1 1 1 1 2 2 1 1 10Tour bus 1 1 0 0 0 0 1 1 4
School bus 1 1 0 0 0 0 2 0 4
Travel Trailer 50 35 82 76 32 43 79 92 489 939 50%Camper 9 6 24 10 13 11 10 19 102 10%
RV 51 32 53 42 40 40 46 44 348 40%Veh in tow 23 10 12 10 20 11 21 11 118
TUESDAY August 3, 2010
FRIDAY August 6, 2010
WEDNESDAY August 11, 2010
SUNDAY August 15, 2010
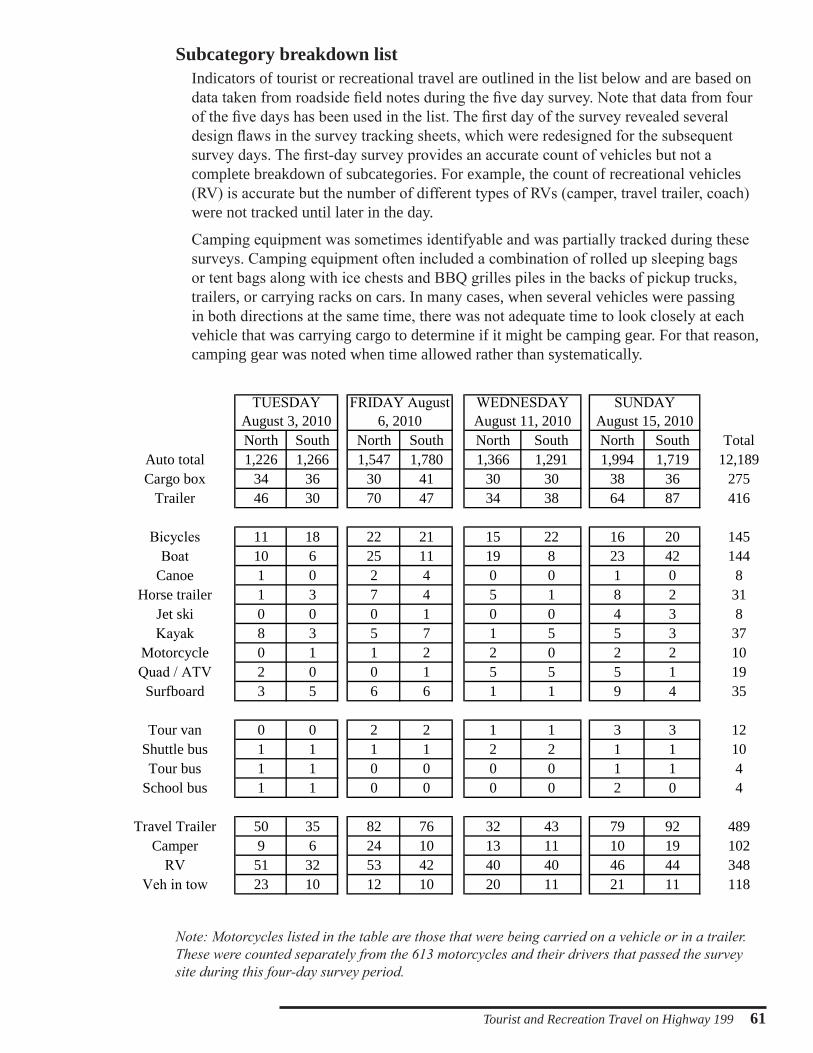
Subcategory breakdown listIndicators of tourist or recreational travel are outlined in the list below and are based on data taken from roadside field notes during the five day survey. Note that data from four of the five days has been used in the list. The first day of the survey revealed several design flaws in the survey tracking sheets, which were redesigned for the subsequent survey days. The first-day survey provides an accurate count of vehicles but not a complete breakdown of subcategories. For example, the count of recreational vehicles (RV) is accurate but the number of different types of RVs (camper, travel trailer, coach) were not tracked until later in the day.
Camping equipment was sometimes identifyable and was partially tracked during these surveys. Camping equipment often included a combination of rolled up sleeping bags or tent bags along with ice chests and BBQ grilles piles in the backs of pickup trucks, trailers, or carrying racks on cars. In many cases, when several vehicles were passing in both directions at the same time, there was not adequate time to look closely at each vehicle that was carrying cargo to determine if it might be camping gear. For that reason, camping gear was noted when time allowed rather than systematically.
Note: Motorcycles listed in the table are those that were being carried on a vehicle or in a trailer. These were counted separately from the 613 motorcycles and their drivers that passed the survey site during this four-day survey period.
62 Tourist and Recreation Travel on Highway 199
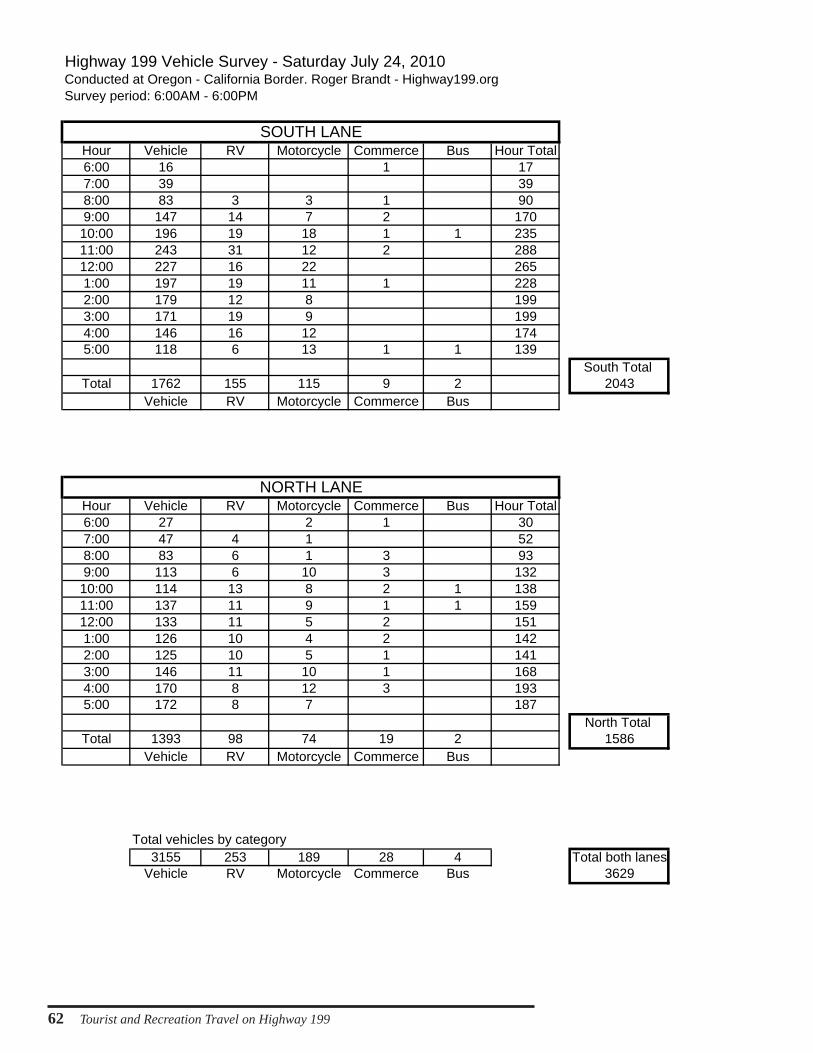
Hour Vehicle RV Motorcycle Commerce Bus Hour Total6:00 16 1 177:00 39 398:00 83 3 3 1 909:00 147 14 7 2 17010:00 196 19 18 1 1 23511:00 243 31 12 2 28812:00 227 16 22 2651:00 197 19 11 1 2282:00 179 12 8 1993:00 171 19 9 1994:00 146 16 12 1745:00 118 6 13 1 1 139
South Total Total 1762 155 115 9 2 2043
Vehicle RV Motorcycle Commerce Bus
Hour Vehicle RV Motorcycle Commerce Bus Hour Total6:00 27 2 1 307:00 47 4 1 528:00 83 6 1 3 939:00 113 6 10 3 13210:00 114 13 8 2 1 13811:00 137 11 9 1 1 15912:00 133 11 5 2 1511:00 126 10 4 2 1422:00 125 10 5 1 1413:00 146 11 10 1 1684:00 170 8 12 3 1935:00 172 8 7 187
North Total Total 1393 98 74 19 2 1586
Vehicle RV Motorcycle Commerce Bus
3155 253 189 28 4 Total both lanesVehicle RV Motorcycle Commerce Bus 3629
Highway 199 Vehicle Survey - Saturday July 24, 2010Conducted at Oregon - California Border. Roger Brandt - Highway199.org
Total vehicles by category
Survey period: 6:00AM - 6:00PM
SOUTH LANE
NORTH LANE
Tourist and Recreation Travel on Highway 199 63
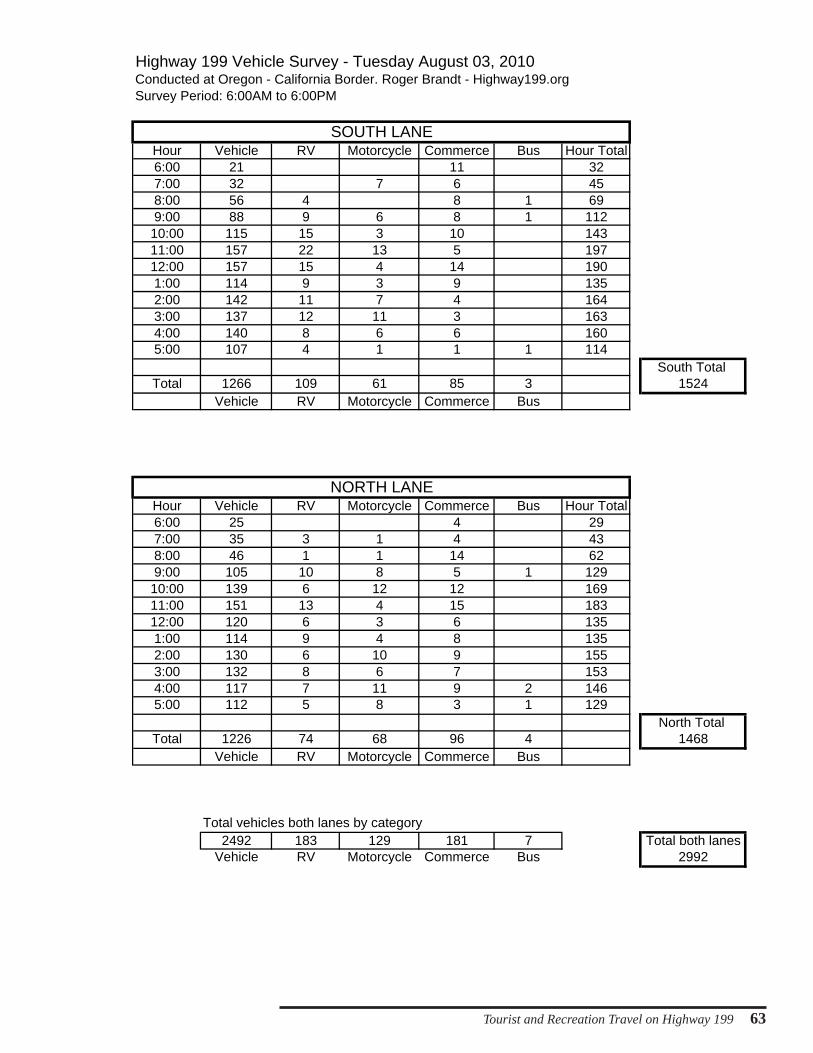
Hour Vehicle RV Motorcycle Commerce Bus Hour Total6:00 21 11 327:00 32 7 6 458:00 56 4 8 1 699:00 88 9 6 8 1 11210:00 115 15 3 10 14311:00 157 22 13 5 19712:00 157 15 4 14 1901:00 114 9 3 9 1352:00 142 11 7 4 1643:00 137 12 11 3 1634:00 140 8 6 6 1605:00 107 4 1 1 1 114
South Total Total 1266 109 61 85 3 1524
Vehicle RV Motorcycle Commerce Bus
Hour Vehicle RV Motorcycle Commerce Bus Hour Total6:00 25 4 297:00 35 3 1 4 438:00 46 1 1 14 629:00 105 10 8 5 1 12910:00 139 6 12 12 16911:00 151 13 4 15 18312:00 120 6 3 6 1351:00 114 9 4 8 1352:00 130 6 10 9 1553:00 132 8 6 7 1534:00 117 7 11 9 2 1465:00 112 5 8 3 1 129
North Total Total 1226 74 68 96 4 1468
Vehicle RV Motorcycle Commerce Bus
2492 183 129 181 7 Total both lanesVehicle RV Motorcycle Commerce Bus 2992
Total vehicles both lanes by category
SOUTH LANE
NORTH LANE
Highway 199 Vehicle Survey - Tuesday August 03, 2010Conducted at Oregon - California Border. Roger Brandt - Highway199.orgSurvey Period: 6:00AM to 6:00PM
64 Tourist and Recreation Travel on Highway 199
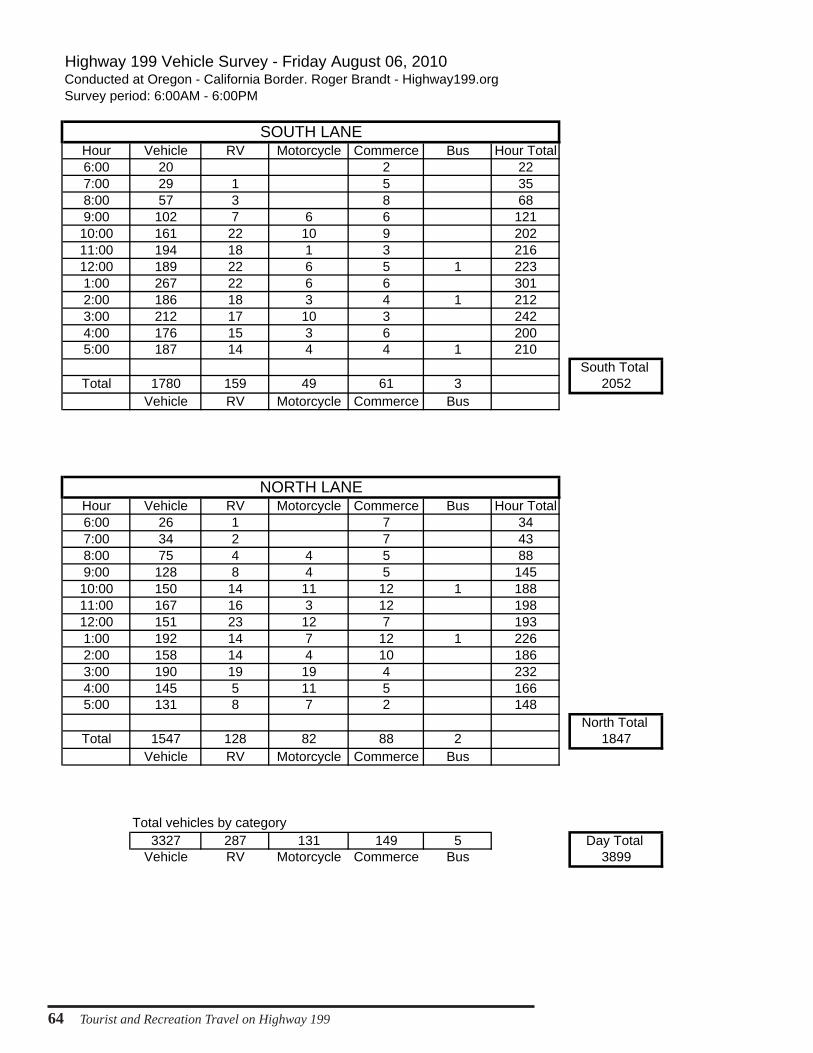
Hour Vehicle RV Motorcycle Commerce Bus Hour Total6:00 20 2 227:00 29 1 5 358:00 57 3 8 689:00 102 7 6 6 12110:00 161 22 10 9 20211:00 194 18 1 3 21612:00 189 22 6 5 1 2231:00 267 22 6 6 3012:00 186 18 3 4 1 2123:00 212 17 10 3 2424:00 176 15 3 6 2005:00 187 14 4 4 1 210
South Total Total 1780 159 49 61 3 2052
Vehicle RV Motorcycle Commerce Bus
Hour Vehicle RV Motorcycle Commerce Bus Hour Total6:00 26 1 7 347:00 34 2 7 438:00 75 4 4 5 889:00 128 8 4 5 14510:00 150 14 11 12 1 18811:00 167 16 3 12 19812:00 151 23 12 7 1931:00 192 14 7 12 1 2262:00 158 14 4 10 1863:00 190 19 19 4 2324:00 145 5 11 5 1665:00 131 8 7 2 148
North Total Total 1547 128 82 88 2 1847
Vehicle RV Motorcycle Commerce Bus
3327 287 131 149 5 Day Total Vehicle RV Motorcycle Commerce Bus 3899
Total vehicles by category
SOUTH LANE
NORTH LANE
Highway 199 Vehicle Survey - Friday August 06, 2010Conducted at Oregon - California Border. Roger Brandt - Highway199.orgSurvey period: 6:00AM - 6:00PM
Tourist and Recreation Travel on Highway 199 65
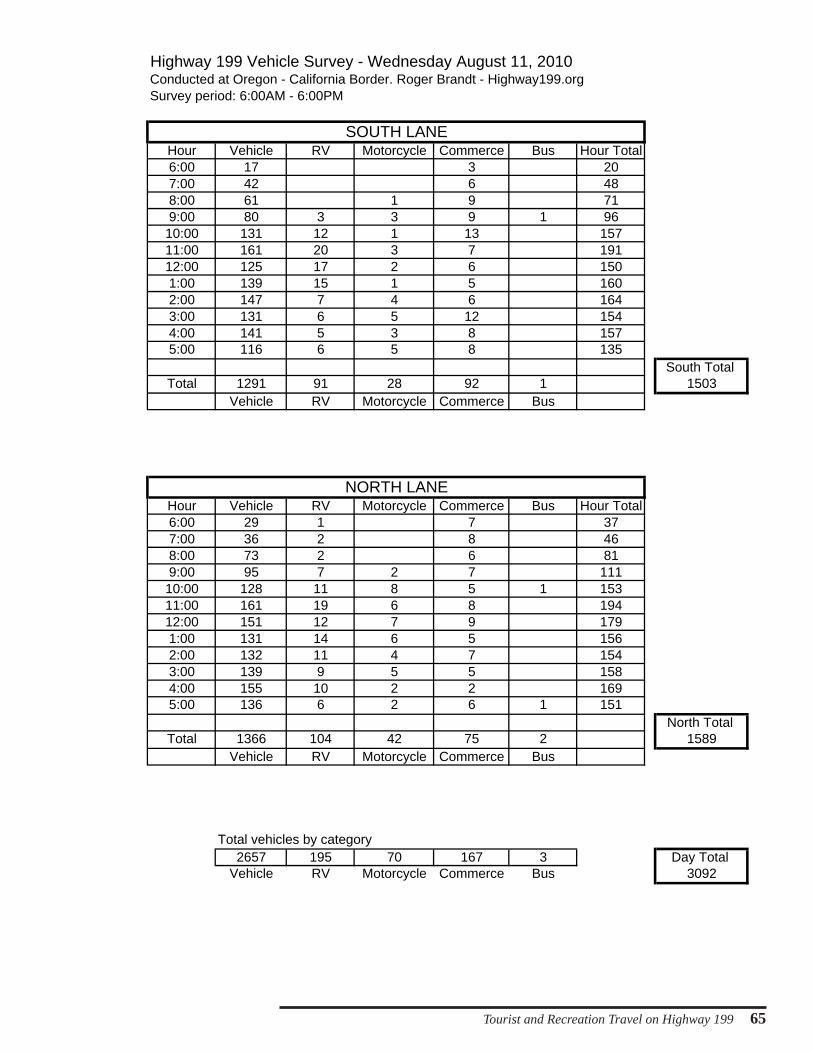
Hour Vehicle RV Motorcycle Commerce Bus Hour Total6:00 17 3 207:00 42 6 488:00 61 1 9 719:00 80 3 3 9 1 9610:00 131 12 1 13 15711:00 161 20 3 7 19112:00 125 17 2 6 1501:00 139 15 1 5 1602:00 147 7 4 6 1643:00 131 6 5 12 1544:00 141 5 3 8 1575:00 116 6 5 8 135
South Total Total 1291 91 28 92 1 1503
Vehicle RV Motorcycle Commerce Bus
Hour Vehicle RV Motorcycle Commerce Bus Hour Total6:00 29 1 7 377:00 36 2 8 468:00 73 2 6 819:00 95 7 2 7 11110:00 128 11 8 5 1 15311:00 161 19 6 8 19412:00 151 12 7 9 1791:00 131 14 6 5 1562:00 132 11 4 7 1543:00 139 9 5 5 1584:00 155 10 2 2 1695:00 136 6 2 6 1 151
North Total Total 1366 104 42 75 2 1589
Vehicle RV Motorcycle Commerce Bus
2657 195 70 167 3 Day Total Vehicle RV Motorcycle Commerce Bus 3092
Highway 199 Vehicle Survey - Wednesday August 11, 2010Conducted at Oregon - California Border. Roger Brandt - Highway199.org
Total vehicles by category
Survey period: 6:00AM - 6:00PM
SOUTH LANE
NORTH LANE
66 Tourist and Recreation Travel on Highway 199
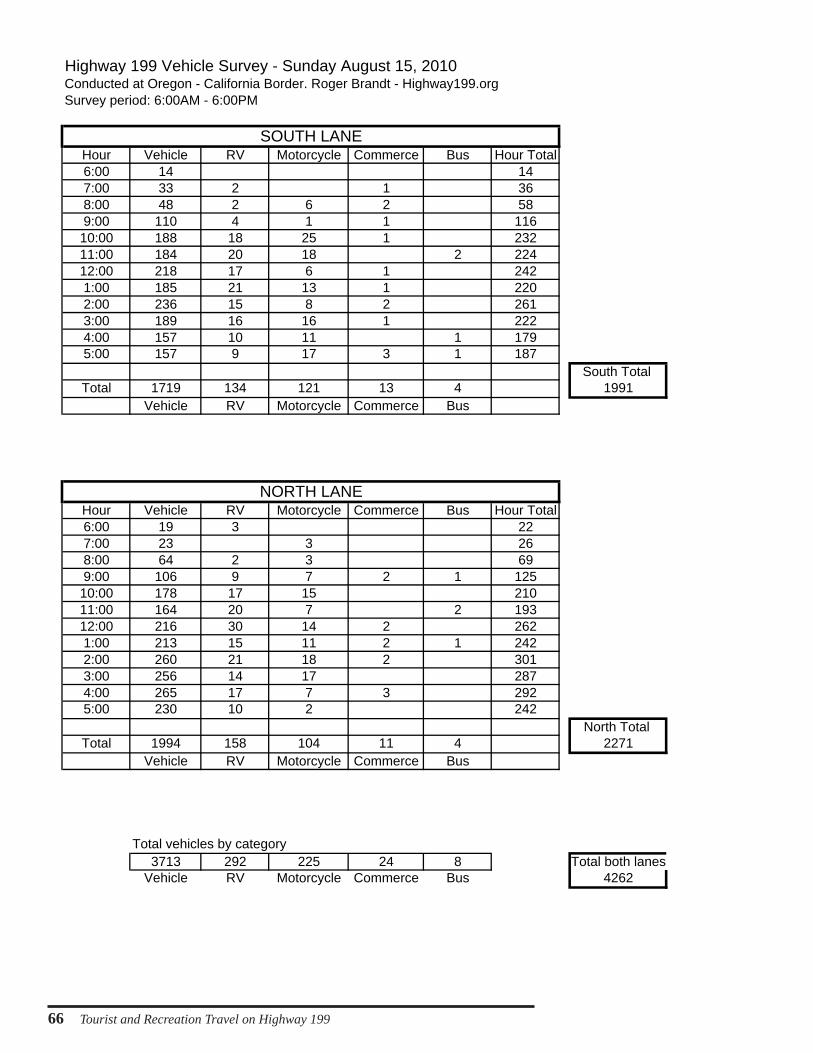
Hour Vehicle RV Motorcycle Commerce Bus Hour Total6:00 14 147:00 33 2 1 368:00 48 2 6 2 589:00 110 4 1 1 11610:00 188 18 25 1 23211:00 184 20 18 2 22412:00 218 17 6 1 2421:00 185 21 13 1 2202:00 236 15 8 2 2613:00 189 16 16 1 2224:00 157 10 11 1 1795:00 157 9 17 3 1 187
South Total Total 1719 134 121 13 4 1991
Vehicle RV Motorcycle Commerce Bus
Hour Vehicle RV Motorcycle Commerce Bus Hour Total6:00 19 3 227:00 23 3 268:00 64 2 3 699:00 106 9 7 2 1 12510:00 178 17 15 21011:00 164 20 7 2 19312:00 216 30 14 2 2621:00 213 15 11 2 1 2422:00 260 21 18 2 3013:00 256 14 17 2874:00 265 17 7 3 2925:00 230 10 2 242
North Total Total 1994 158 104 11 4 2271
Vehicle RV Motorcycle Commerce Bus
3713 292 225 24 8 Total both lanesVehicle RV Motorcycle Commerce Bus 4262
Highway 199 Vehicle Survey - Sunday August 15, 2010Conducted at Oregon - California Border. Roger Brandt - Highway199.org
Total vehicles by category
Survey period: 6:00AM - 6:00PM
SOUTH LANE
NORTH LANE
Tourist and Recreation Travel on Highway 199 67
This report estimates that about one third of the total annual traffic on Highway 199 represents tourist and recreation travel. This number is very conservative for the following reasons.
The 30% estimate (see page 5) assumes that all the traffic counted at the Oregon-California border during January represents only commuter and routine commercial travel. It is more likely that a significant amount of the traffic during this time of year involves vehicles being used for recreation and leisure travel. For example, in the first part of January, many people are traveling home from visiting friends and relatives during the Christmas and New Years holiday. It is also likely that there are spikes of recreation and tourist travel on weekends, especially during the Martin Luther King weekend near the end of the month.
There are many recreational opportunities that residents in this region could enjoy during weekends in January. Residents on the coast might travel inland to enjoy winter sports at ski resorts while residents in the communities of southwest Oregon may travel to the coast to enjoy recreational activities like hiking on trails in the redwood forest or walking on the beach to look for driftwood and other things that winter storms wash ashore or collect agates after storm waves have removed sand and exposed rocks.
The winter also offers some of the year’s most dramatic scenic opportunities. For example, this is when giant waves from winter storms pound the rocky Oregon coast creating the spectacular waterworks that are so often seen in calendar photographs and posters. It is very rare that dramatic displays like this are seen during summer months.
Other motivations for traveling during January might include attending sport events, concerts, plays, art shows, or to take advantage of post-Christmas sales. There are plenty of good reasons to travel in January
Considering all these factors, the traffic count in January more likely represents a significant amount of vehicles being used for tourist and recreation travel rather than exclusively commuter and commercial traffic. For this reason, it is more likely that the actual tourist and recreation travel on Highway 199 is closer to 50% of the total traffic. When you think about it, why else would someone be driving to the coast?
This report produced by: Roger BrandtSouthwest Oregon Traveler, LLC 541 592-4316 [email protected] Highway199.orgOctober 3, 2010
Concluding Remarks
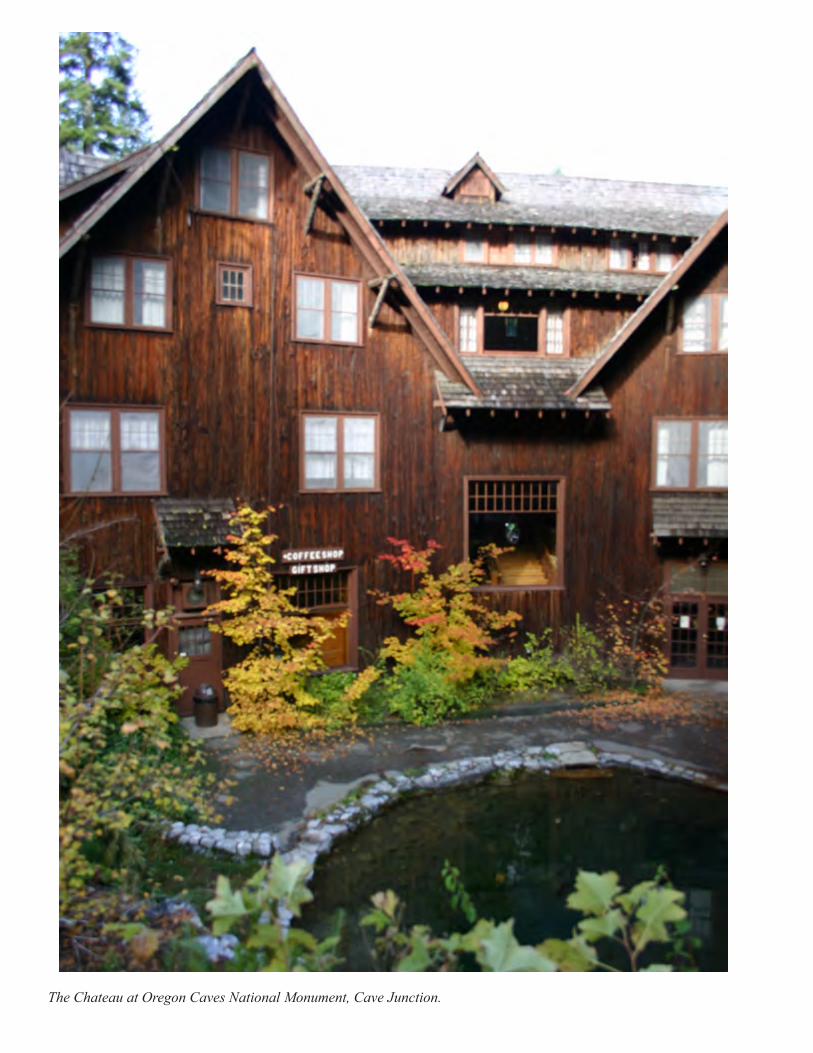
The Chateau at Oregon Caves National Monument, Cave Junction.


![homelessness nyc - New York – São Paulo Exchange | The ... · 2/6/2010 · homelessness [nyc] homelessness ... ... 199 2 199 3 199 4 199 5 199 6 199 7 199 8 199 9 200 0 200 1 200](https://img.pdfslide.net/doc/110x75/5c622b0c09d3f2223c8b45ae/homelessness-nyc-new-york-sao-paulo-exchange-the-262010-homelessness.jpg)