Embed Size (px)
Citation preview
Toward A Bottom-Up Approach in Assessing Sovereign Default Risk
Dr. Edward I. Altman
Stern School of Business
New York University
Keynote Lecture
Risk Day Conference
MacQuarie University
Sydney, Australia
March 22, 2013
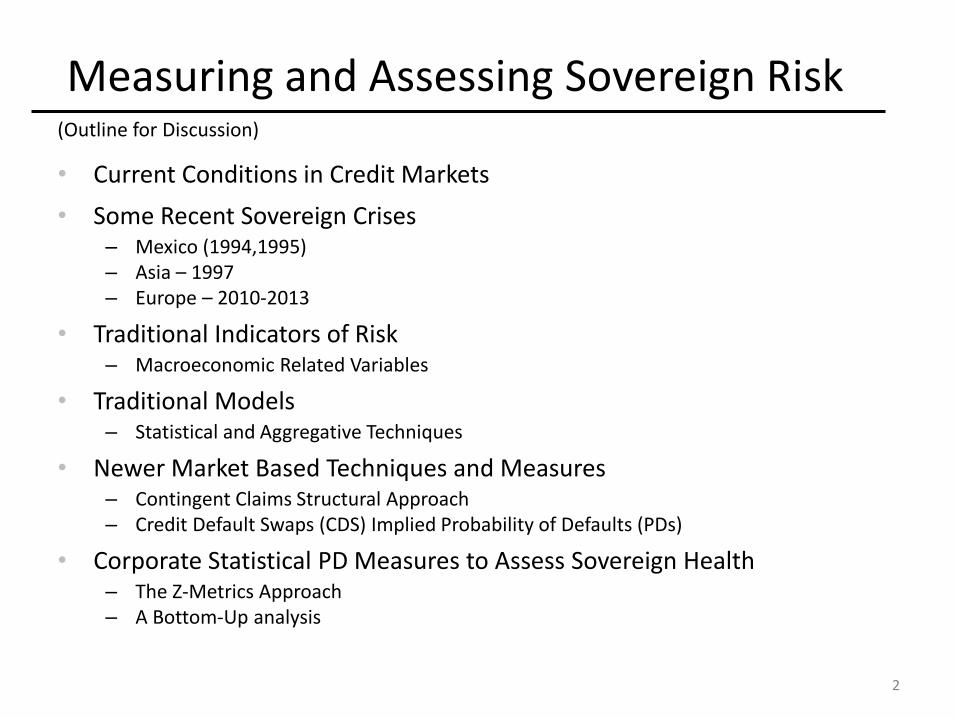
Measuring and Assessing Sovereign Risk
• Current Conditions in Credit Markets
• Some Recent Sovereign Crises – Mexico (1994,1995) – Asia – 1997 – Europe – 2010-2013
• Traditional Indicators of Risk – Macroeconomic Related Variables
• Traditional Models – Statistical and Aggregative Techniques
• Newer Market Based Techniques and Measures – Contingent Claims Structural Approach – Credit Default Swaps (CDS) Implied Probability of Defaults (PDs)
• Corporate Statistical PD Measures to Assess Sovereign Health – The Z-Metrics Approach – A Bottom-Up analysis
(Outline for Discussion)
2
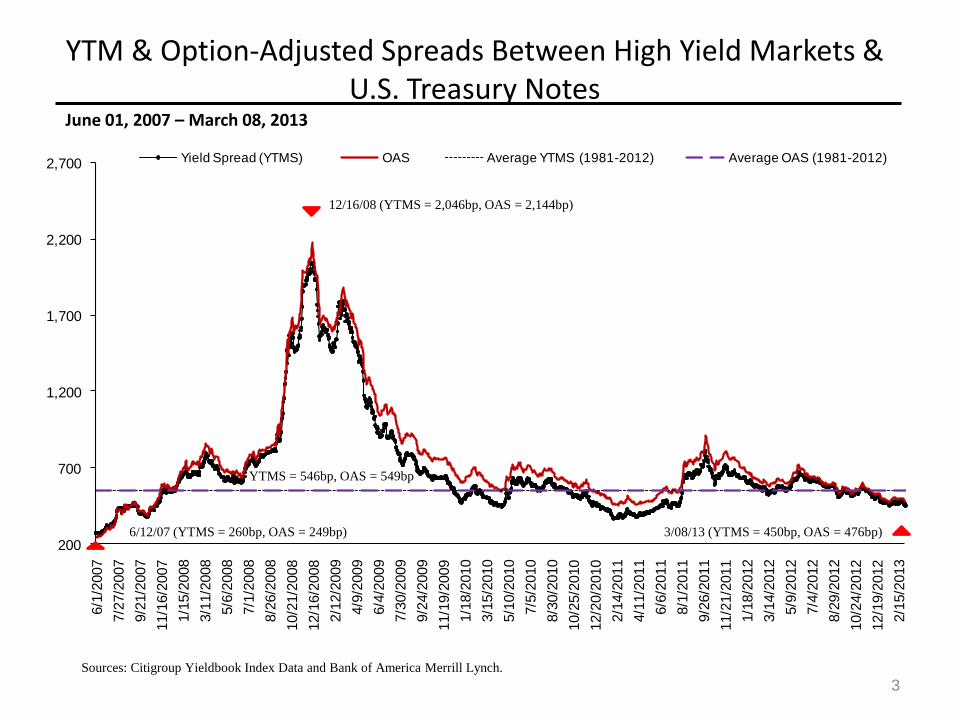
June 01, 2007 – March 08, 2013
Sources: Citigroup Yieldbook Index Data and Bank of America Merrill Lynch.
3
YTM & Option-Adjusted Spreads Between High Yield Markets & U.S. Treasury Notes
200
700
1,200
1,700
2,200
2,700
6/1
/2007
7/2
7/2
007
9/2
1/2
007
11/1
6/2
007
1/1
5/2
008
3/1
1/2
008
5/6
/2008
7/1
/2008
8/2
6/2
008
10/2
1/2
008
12/1
6/2
008
2/1
2/2
009
4/9
/2009
6/4
/2009
7/3
0/2
009
9/2
4/2
009
11/1
9/2
009
1/1
8/2
010
3/1
5/2
010
5/1
0/2
010
7/5
/2010
8/3
0/2
010
10/2
5/2
010
12/2
0/2
010
2/1
4/2
011
4/1
1/2
011
6/6
/2011
8/1
/2011
9/2
6/2
011
11/2
1/2
011
1/1
8/2
012
3/1
4/2
012
5/9
/2012
7/4
/2012
8/2
9/2
012
10/2
4/2
012
12/1
9/2
012
2/1
5/2
013
Yield Spread (YTMS) OAS Average YTMS (1981-2012) Average OAS (1981-2012)
6/12/07 (YTMS = 260bp, OAS = 249bp)
YTMS = 546bp, OAS = 549bp
12/16/08 (YTMS = 2,046bp, OAS = 2,144bp)
3/08/13 (YTMS = 450bp, OAS = 476bp)
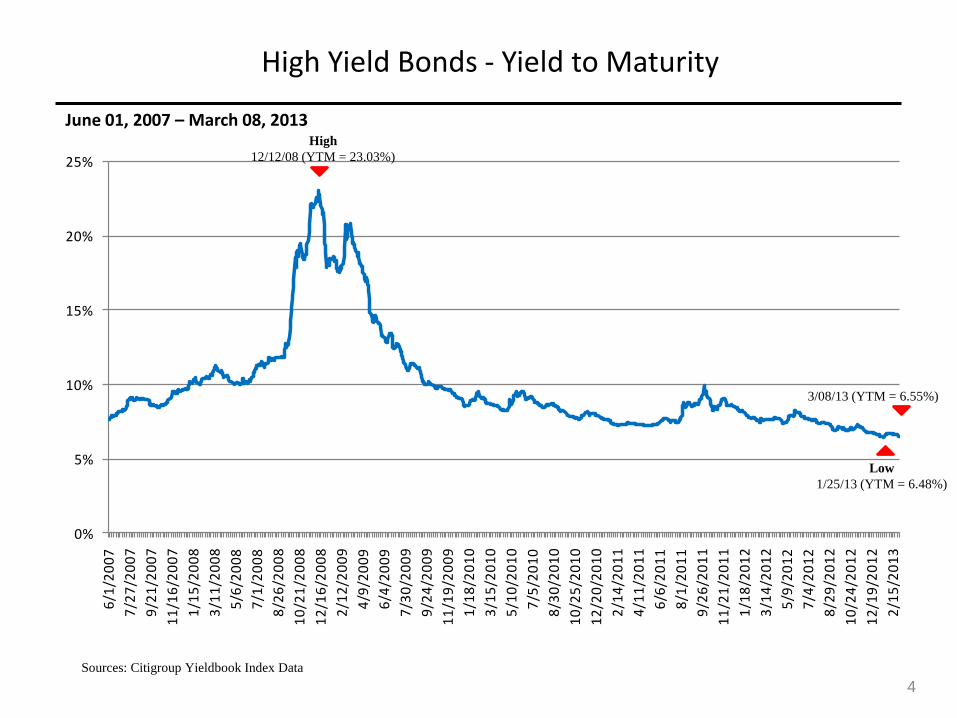
High Yield Bonds - Yield to Maturity
June 01, 2007 – March 08, 2013
Sources: Citigroup Yieldbook Index Data
4
0%
5%
10%
15%
20%
25%
6/1
/20
07
7/2
7/2
00
7
9/2
1/2
00
7
11
/16
/20
07
1/1
5/2
00
8
3/1
1/2
00
8
5/6
/20
08
7/1
/20
08
8/2
6/2
00
8
10
/21
/20
08
12
/16
/20
08
2/1
2/2
00
9
4/9
/20
09
6/4
/20
09
7/3
0/2
00
9
9/2
4/2
00
9
11
/19
/20
09
1/1
8/2
01
0
3/1
5/2
01
0
5/1
0/2
01
0
7/5
/20
10
8/3
0/2
01
0
10
/25
/20
10
12
/20
/20
10
2/1
4/2
01
1
4/1
1/2
01
1
6/6
/20
11
8/1
/20
11
9/2
6/2
01
1
11
/21
/20
11
1/1
8/2
01
2
3/1
4/2
01
2
5/9
/20
12
7/4
/20
12
8/2
9/2
01
2
10
/24
/20
12
12
/19
/20
12
2/1
5/2
01
3
High
12/12/08 (YTM = 23.03%)
Low
1/25/13 (YTM = 6.48%)
3/08/13 (YTM = 6.55%)
5
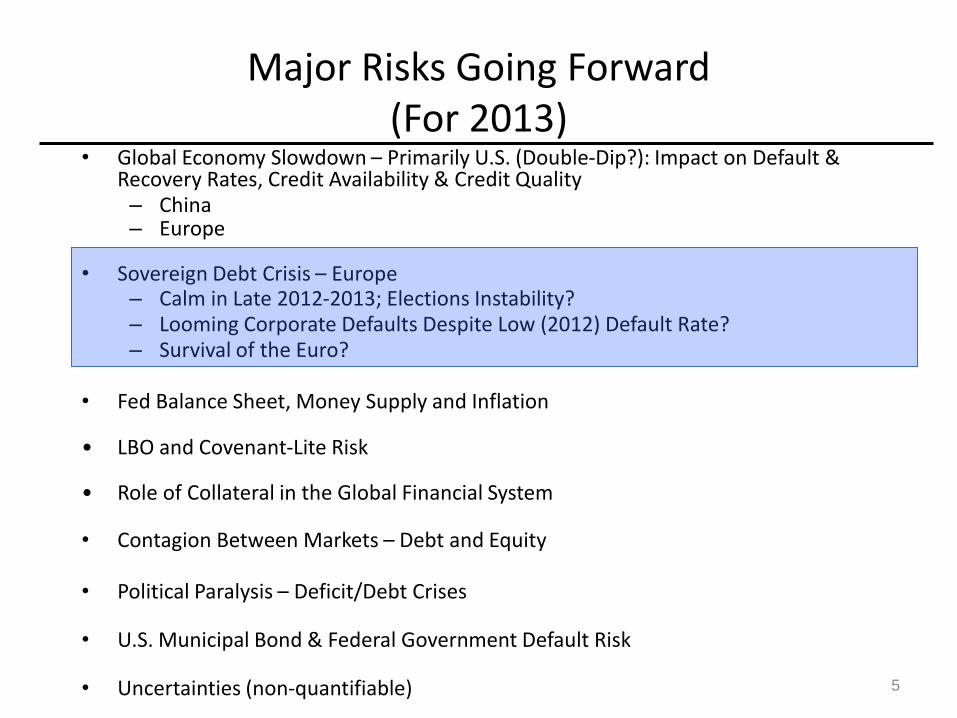
Major Risks Going Forward (For 2013)
• Global Economy Slowdown – Primarily U.S. (Double-Dip?): Impact on Default & Recovery Rates, Credit Availability & Credit Quality – China – Europe
• Sovereign Debt Crisis – Europe
– Calm in Late 2012-2013; Elections Instability? – Looming Corporate Defaults Despite Low (2012) Default Rate? – Survival of the Euro?
• Fed Balance Sheet, Money Supply and Inflation • LBO and Covenant-Lite Risk • Role of Collateral in the Global Financial System • Contagion Between Markets – Debt and Equity • Political Paralysis – Deficit/Debt Crises
• U.S. Municipal Bond & Federal Government Default Risk
• Uncertainties (non-quantifiable)
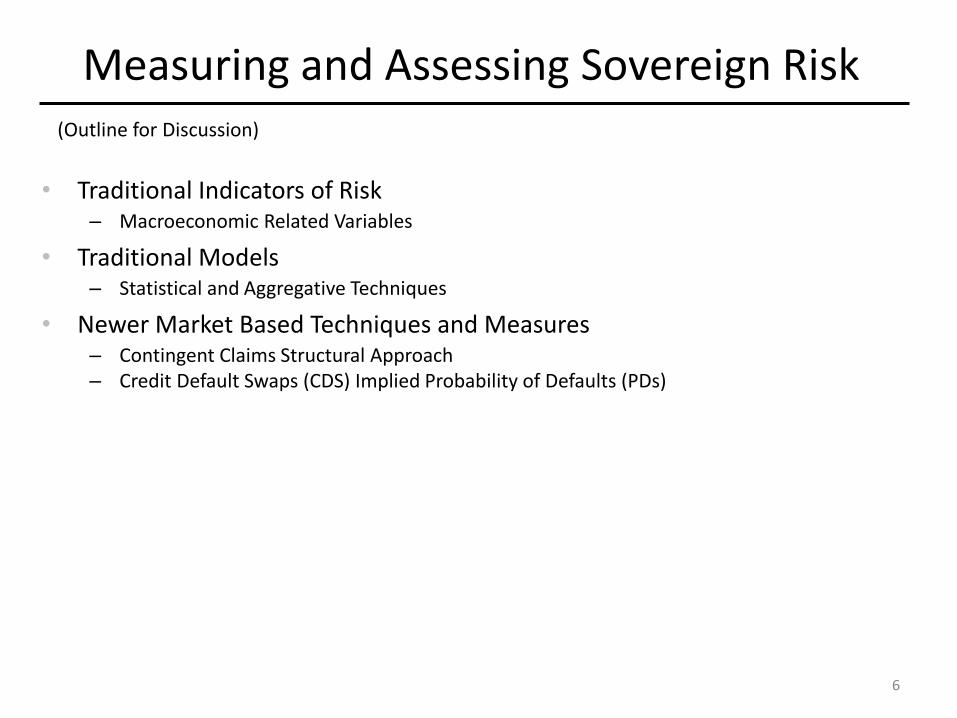
Measuring and Assessing Sovereign Risk
• Traditional Indicators of Risk – Macroeconomic Related Variables
• Traditional Models – Statistical and Aggregative Techniques
• Newer Market Based Techniques and Measures – Contingent Claims Structural Approach – Credit Default Swaps (CDS) Implied Probability of Defaults (PDs)
(Outline for Discussion)
6

A NOVEL APPROACH TO
ASSESSING SOVEREIGN
DEBT RISK
7
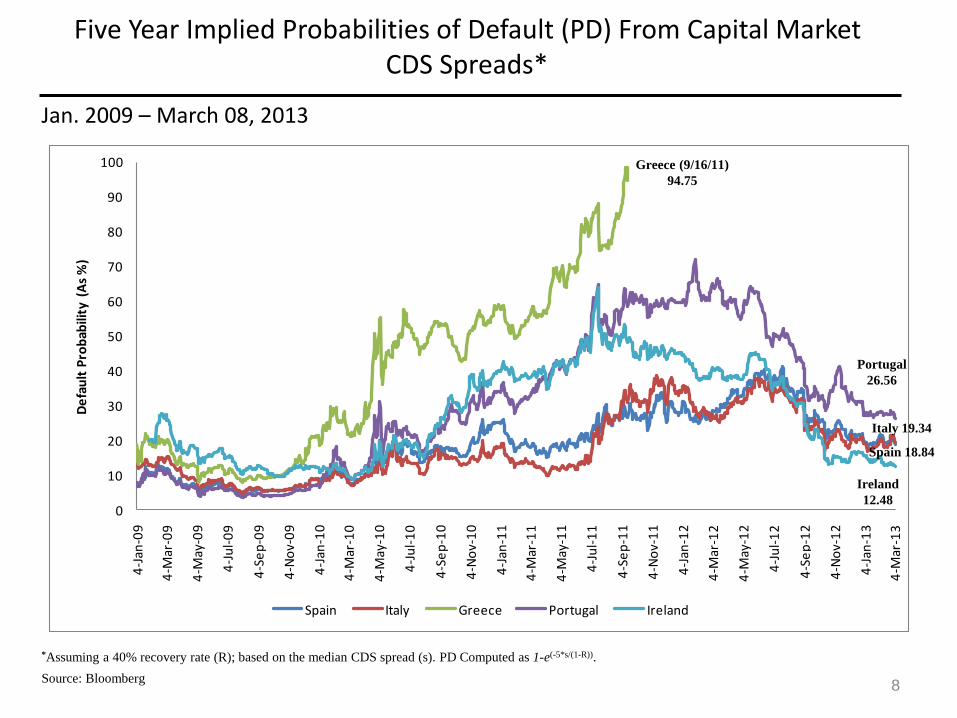
Jan. 2009 – March 08, 2013
*Assuming a 40% recovery rate (R); based on the median CDS spread (s). PD Computed as 1-e(-5*s/(1-R)).
Source: Bloomberg 8
Five Year Implied Probabilities of Default (PD) From Capital Market CDS Spreads*
0
10
20
30
40
50
60
70
80
90
100
4-J
an-0
9
4-M
ar-0
9
4-M
ay-0
9
4-J
ul-
09
4-S
ep
-09
4-N
ov-
09
4-J
an-1
0
4-M
ar-1
0
4-M
ay-1
0
4-J
ul-
10
4-S
ep
-10
4-N
ov-
10
4-J
an-1
1
4-M
ar-1
1
4-M
ay-1
1
4-J
ul-
11
4-S
ep
-11
4-N
ov-
11
4-J
an-1
2
4-M
ar-1
2
4-M
ay-1
2
4-J
ul-
12
4-S
ep
-12
4-N
ov-
12
4-J
an-1
3
4-M
ar-1
3
De
fau
lt P
rob
abili
ty (
As
%)
Spain Italy Greece Portugal Ireland
Greece (9/16/11)
94.75
Portugal
26.56
Ireland
12.48
Italy 19.34
Spain 18.84
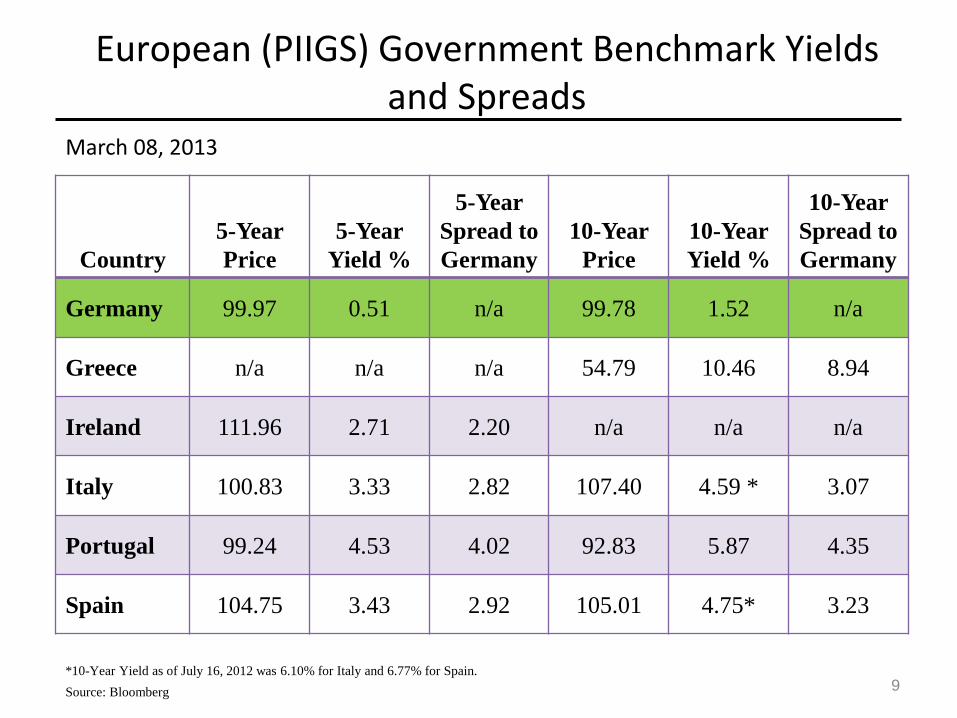
March 08, 2013
Country
5-Year
Price
5-Year
Yield %
5-Year
Spread to
Germany
10-Year
Price
10-Year
Yield %
10-Year
Spread to
Germany
Germany 99.97 0.51 n/a 99.78 1.52 n/a
Greece n/a n/a n/a 54.79 10.46 8.94
Ireland 111.96 2.71 2.20 n/a n/a n/a
Italy 100.83 3.33 2.82 107.40 4.59 * 3.07
Portugal 99.24 4.53 4.02 92.83 5.87 4.35
Spain 104.75 3.43 2.92 105.01 4.75* 3.23
*10-Year Yield as of July 16, 2012 was 6.10% for Italy and 6.77% for Spain. Source: Bloomberg 9
European (PIIGS) Government Benchmark Yields and Spreads
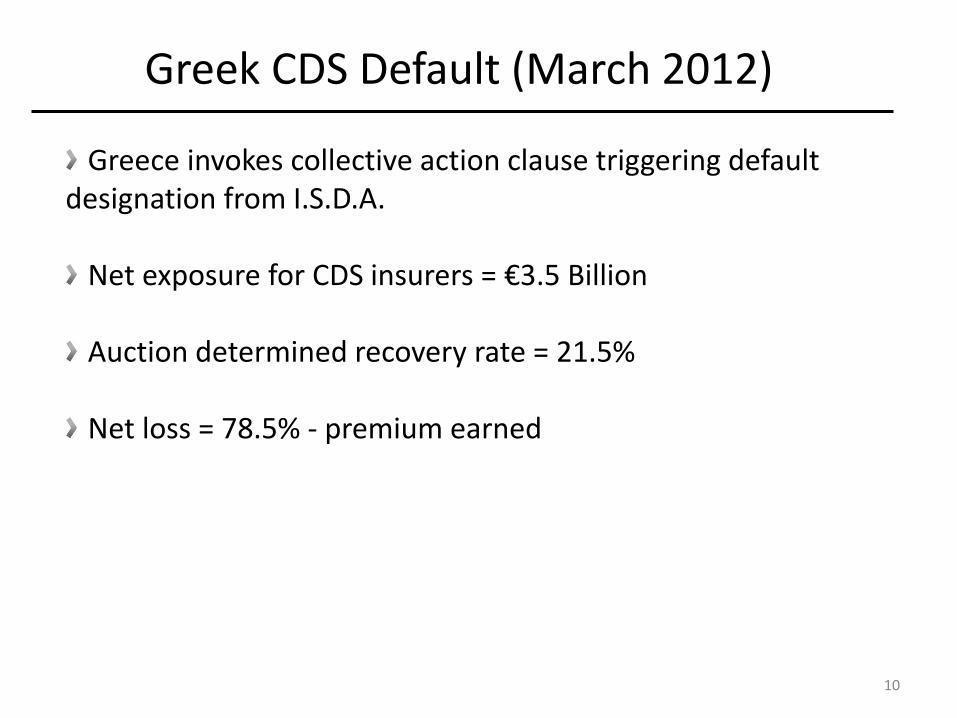
Greek CDS Default (March 2012)
Greece invokes collective action clause triggering default designation from I.S.D.A.
Net exposure for CDS insurers = €3.5 Billion Auction determined recovery rate = 21.5% Net loss = 78.5% - premium earned
10
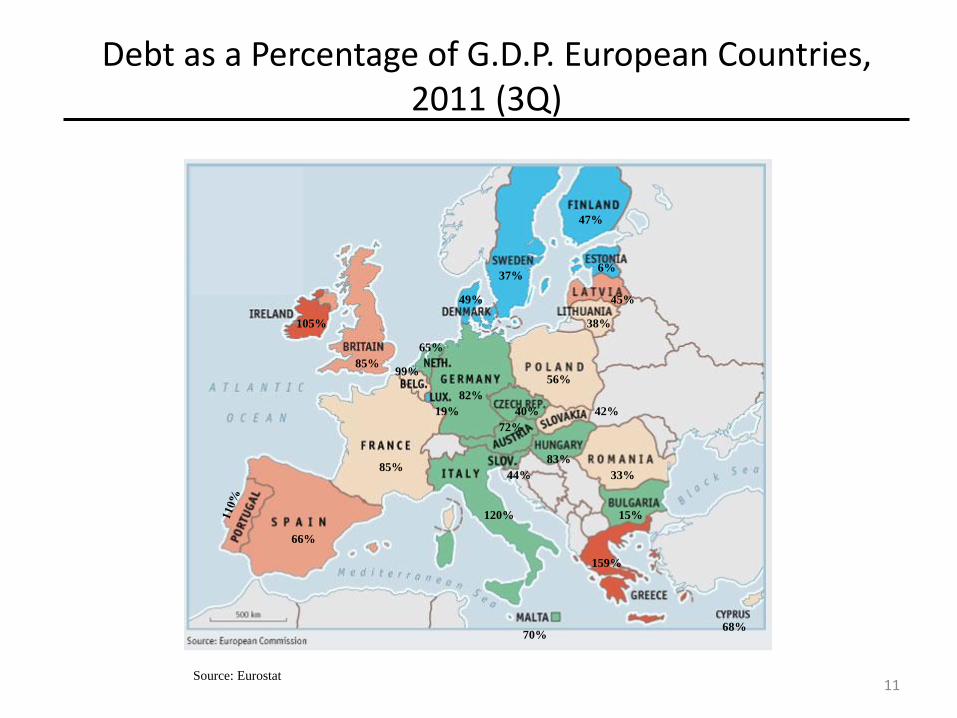
Debt as a Percentage of G.D.P. European Countries, 2011 (3Q)
47%
6%
45%
38%
37%
49%
56%
82%
40% 42%
83%
33%
15%
44%
72%
159%
70%
120%
65%
99%
85%
66%
105%
85%
19%
68%
Source: Eurostat 11
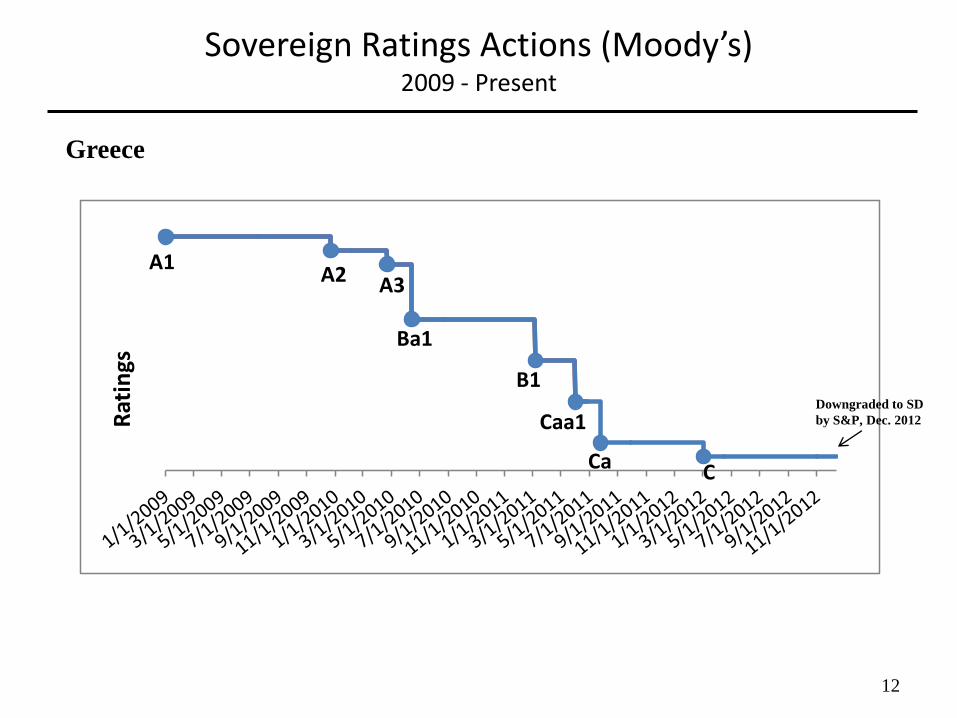
Sovereign Ratings Actions (Moody’s) 2009 - Present
Greece
12
Rat
ings
A1
B1
A2 A3
Ba1
Caa1
Ca C
Downgraded to SD
by S&P, Dec. 2012
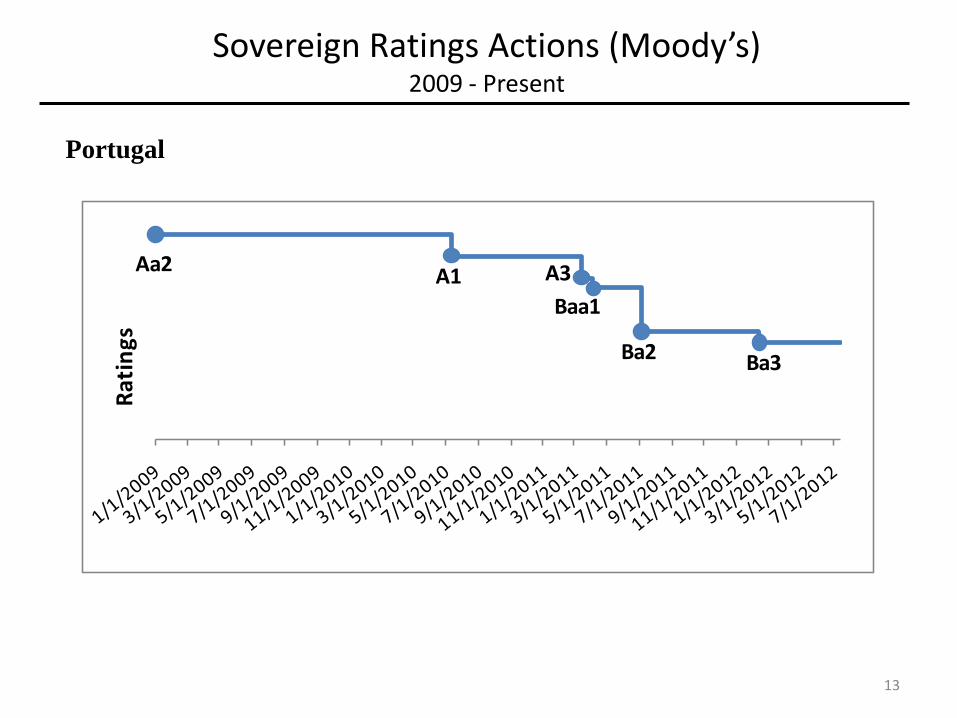
Portugal
Sovereign Ratings Actions (Moody’s) 2009 - Present
Rat
ings
Aa2A1 A3
Baa1
Ba2 Ba3
13
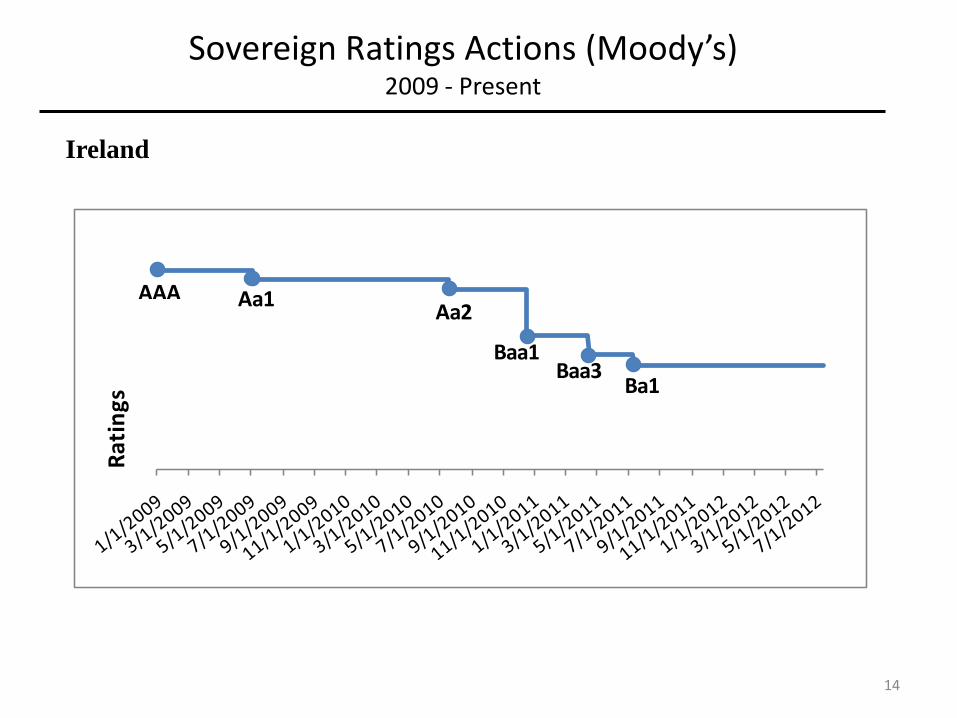
Ireland
Sovereign Ratings Actions (Moody’s) 2009 - Present
Rat
ings
AAAAa2
Baa1Baa3
Aa1
Ba1
14
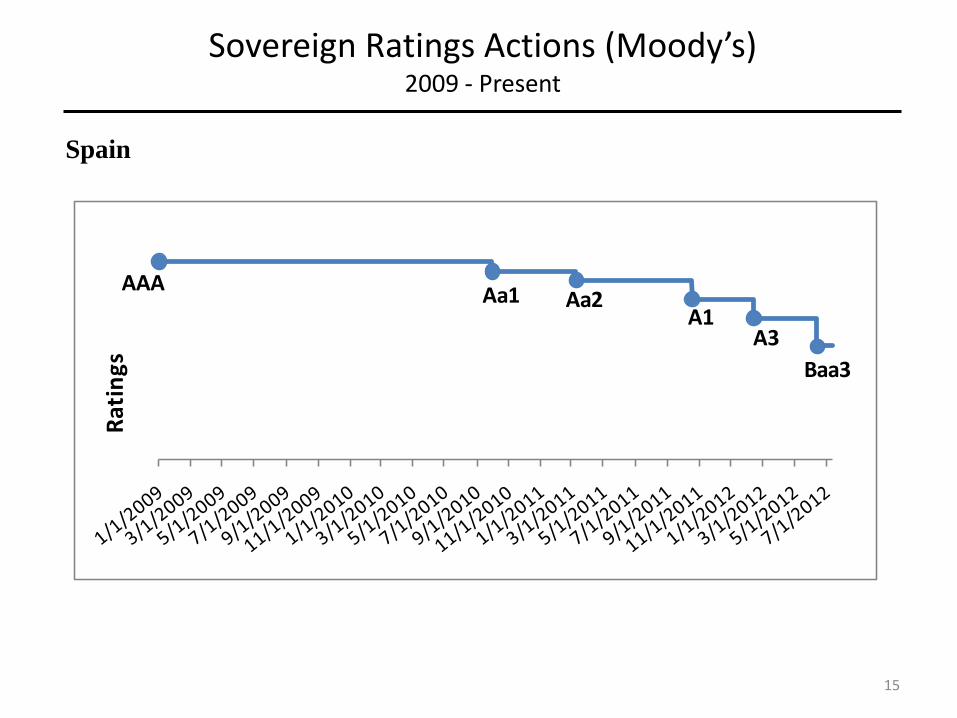
Spain
Sovereign Ratings Actions (Moody’s) 2009 - Present
Rat
ings
AAAAa2Aa1
A1A3
Baa3
15
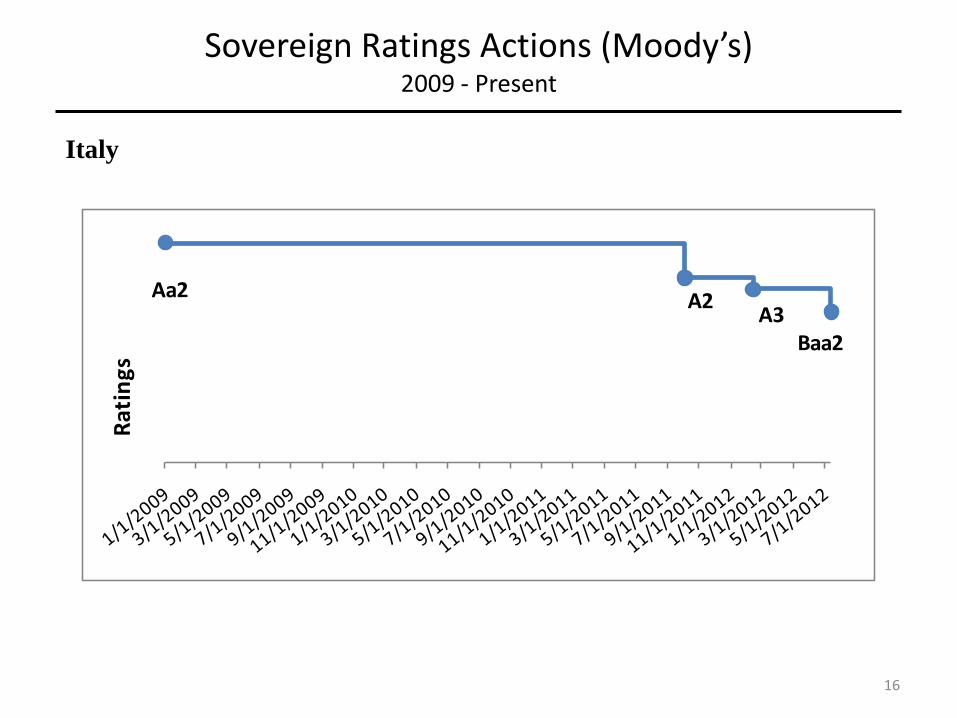
Italy
Sovereign Ratings Actions (Moody’s) 2009 - Present
Rat
ings
Aa2 A2A3
Baa2
16
Objectives of Our Z-Metrics™ Model
• To construct an accurate, logical, and robust credit-scoring model
• To assign a probability of default (PD) and Z-Metrics unique credit rating over one-year and five-year horizons to non-financial firms
• To provide both “best estimate” as well as “stressed” PDs and ratings
• To create models for:
– Large publicly-held firms in the U.S. and Canada (“U.S. Model”)
– Large, privately-held firms in the U.S. and Canada
– Small, publicly-held firms in the U.S. and Canada
– Large and small firms outside the U.S. and Canada
• We expect that our U.S. model will be applicable to ex-U.S. firms
17
Model Characteristics
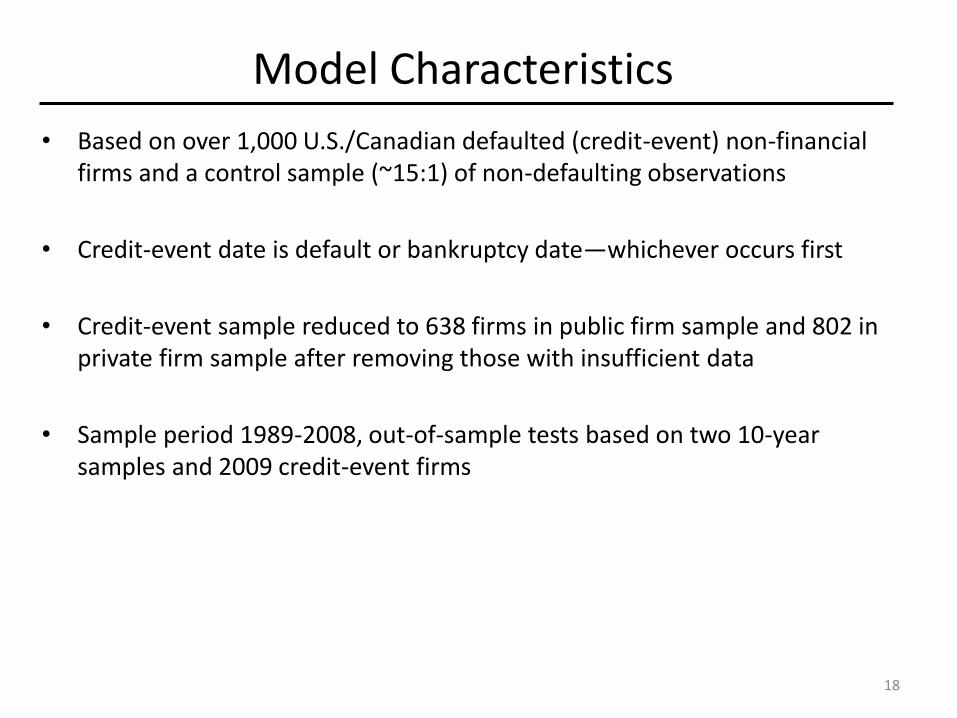
• Based on over 1,000 U.S./Canadian defaulted (credit-event) non-financial firms and a control sample (~15:1) of non-defaulting observations
• Credit-event date is default or bankruptcy date—whichever occurs first
• Credit-event sample reduced to 638 firms in public firm sample and 802 in private firm sample after removing those with insufficient data
• Sample period 1989-2008, out-of-sample tests based on two 10-year samples and 2009 credit-event firms
18
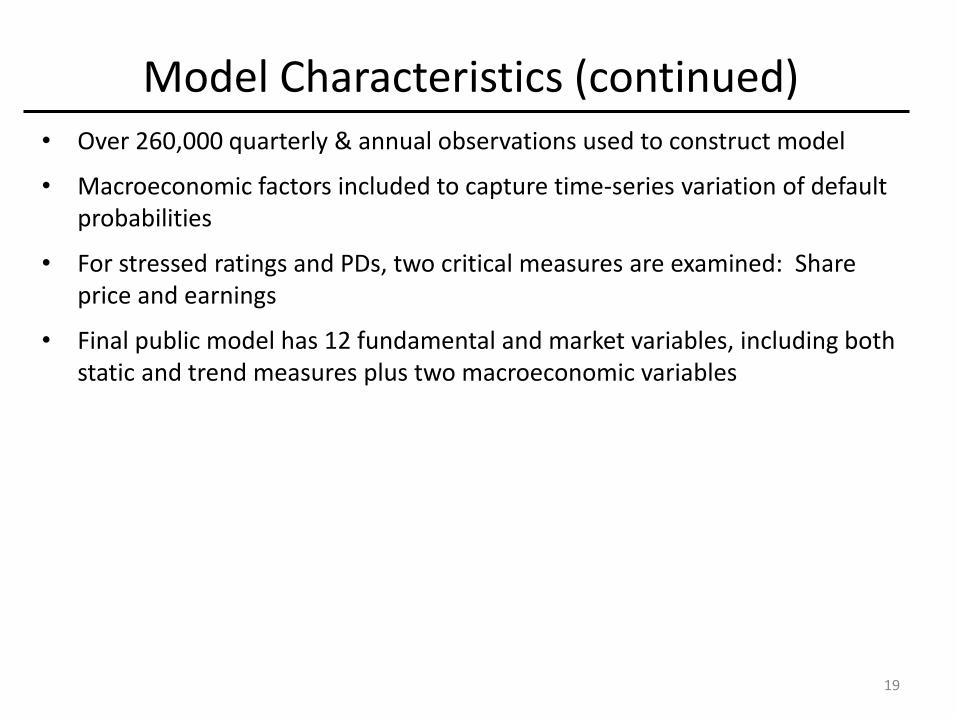
Model Characteristics (continued) • Over 260,000 quarterly & annual observations used to construct model
• Macroeconomic factors included to capture time-series variation of default probabilities
• For stressed ratings and PDs, two critical measures are examined: Share price and earnings
• Final public model has 12 fundamental and market variables, including both static and trend measures plus two macroeconomic variables
19
Variables Assessed
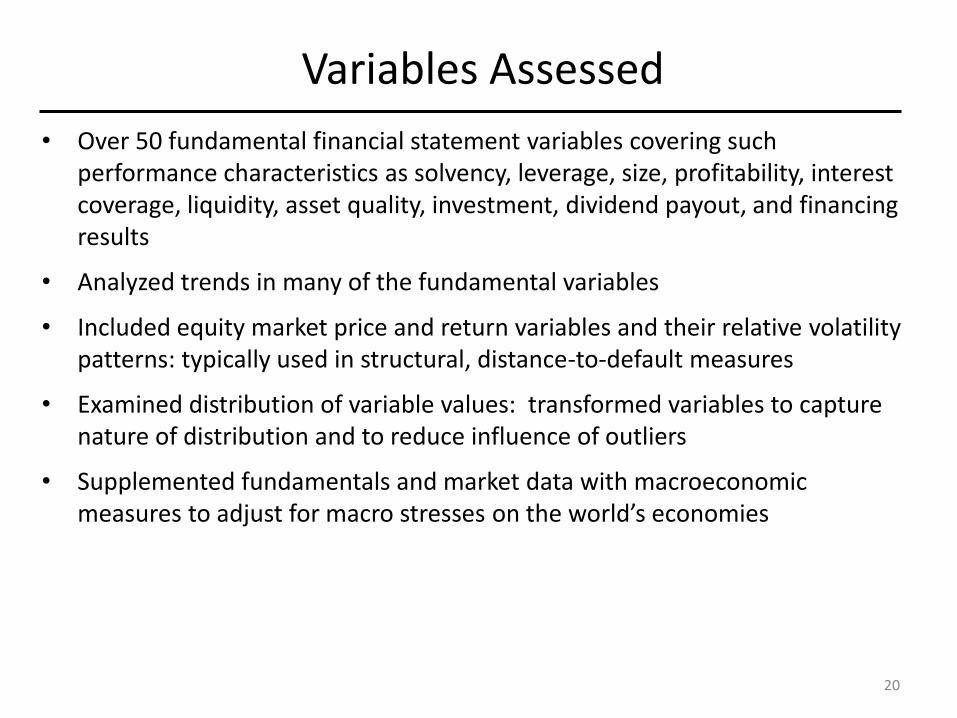
• Over 50 fundamental financial statement variables covering such performance characteristics as solvency, leverage, size, profitability, interest coverage, liquidity, asset quality, investment, dividend payout, and financing results
• Analyzed trends in many of the fundamental variables
• Included equity market price and return variables and their relative volatility patterns: typically used in structural, distance-to-default measures
• Examined distribution of variable values: transformed variables to capture nature of distribution and to reduce influence of outliers
• Supplemented fundamentals and market data with macroeconomic measures to adjust for macro stresses on the world’s economies
20
Logit Model Estimation
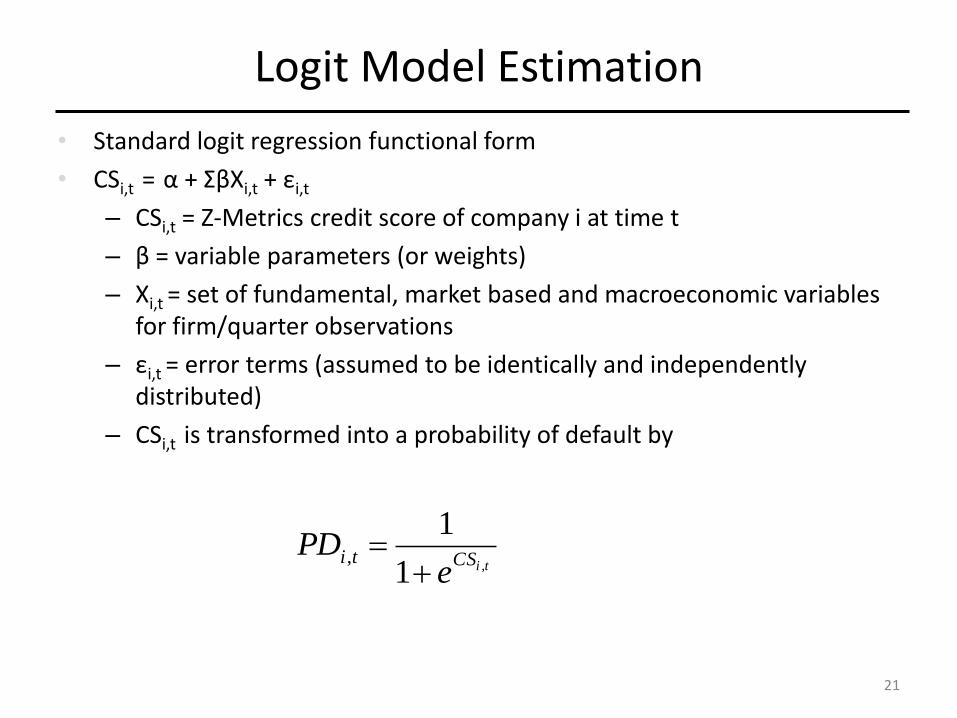
• Standard logit regression functional form
• CSi,t = α + ΣβXi,t + εi,t
– CSi,t = Z-Metrics credit score of company i at time t
– β = variable parameters (or weights)
– Xi,t = set of fundamental, market based and macroeconomic variables for firm/quarter observations
– εi,t = error terms (assumed to be identically and independently distributed)
– CSi,t is transformed into a probability of default by
tiCStie
PD,1
1,
21
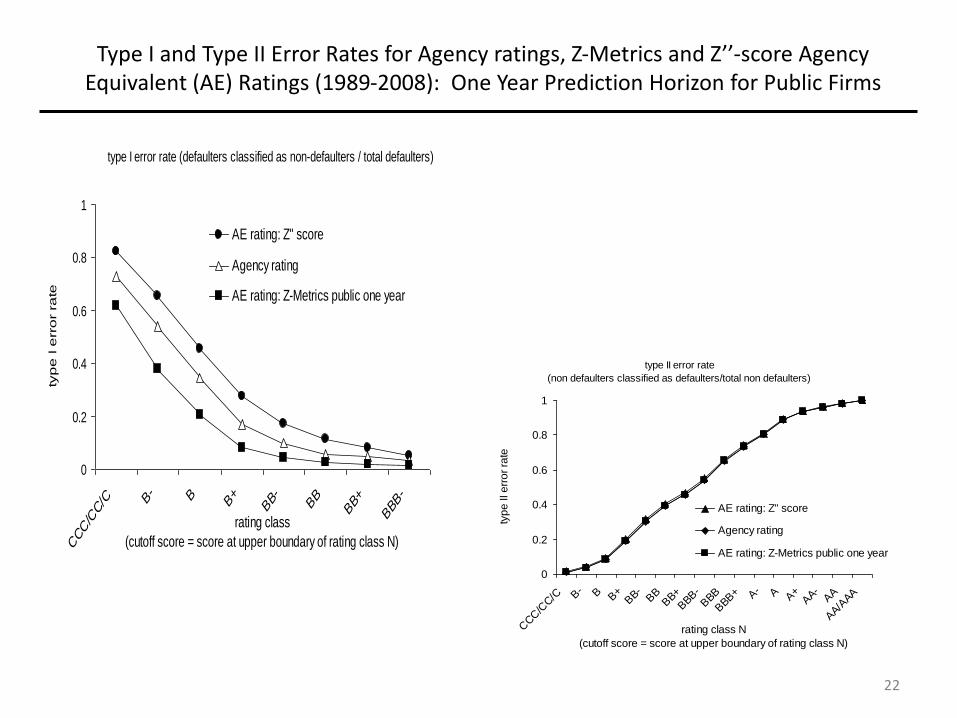
Type I and Type II Error Rates for Agency ratings, Z-Metrics and Z’’-score Agency Equivalent (AE) Ratings (1989-2008): One Year Prediction Horizon for Public Firms
type I error rate (defaulters classified as non-defaulters / total defaulters)
0
0.2
0.4
0.6
0.8
1
CCC/C
C/C B
- B B+
BB-
BB
BB+
BBB-
rating class
(cutoff score = score at upper boundary of rating class N)
typ
e I e
rro
r ra
te
AE rating: Z" score
Agency rating
AE rating: Z-Metrics public one year
type II error rate
(non defaulters classified as defaulters/total non defaulters)
0
0.2
0.4
0.6
0.8
1
CCC/C
C/C B
- B B+
BB-
BB
BB+
BBB
-BBB
BBB
+ A- A A
+AA-
AA
AA/A
AA
rating class N
(cutoff score = score at upper boundary of rating class N)
typ
e II e
rro
r ra
teAE rating: Z" score
Agency rating
AE rating: Z-Metrics public one year
22
*Since the Z-Metrics Model is not practically available for most analysts, we could substitute the Z”-Score method (available from <altmanZscoreplus.com>). Sources: RiskMetrics Group (MSCI), Markit, Compustat.
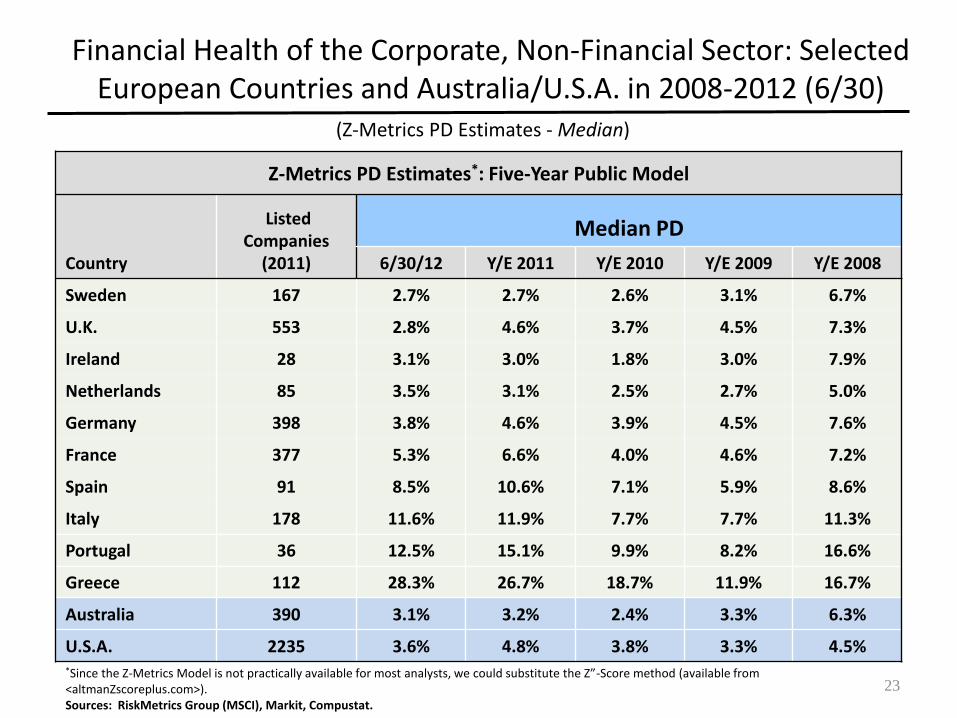
Z-Metrics PD Estimates*: Five-Year Public Model
Country
Listed Companies
(2011)
Median PD
6/30/12 Y/E 2011 Y/E 2010 Y/E 2009 Y/E 2008
Sweden 167 2.7% 2.7% 2.6% 3.1% 6.7%
U.K. 553 2.8% 4.6% 3.7% 4.5% 7.3%
Ireland 28 3.1% 3.0% 1.8% 3.0% 7.9%
Netherlands 85 3.5% 3.1% 2.5% 2.7% 5.0%
Germany 398 3.8% 4.6% 3.9% 4.5% 7.6%
France 377 5.3% 6.6% 4.0% 4.6% 7.2%
Spain 91 8.5% 10.6% 7.1% 5.9% 8.6%
Italy 178 11.6% 11.9% 7.7% 7.7% 11.3%
Portugal 36 12.5% 15.1% 9.9% 8.2% 16.6%
Greece 112 28.3% 26.7% 18.7% 11.9% 16.7%
Australia 390 3.1% 3.2% 2.4% 3.3% 6.3%
U.S.A. 2235 3.6% 4.8% 3.8% 3.3% 4.5%
Financial Health of the Corporate, Non-Financial Sector: Selected European Countries and Australia/U.S.A. in 2008-2012 (6/30)
(Z-Metrics PD Estimates - Median)
23
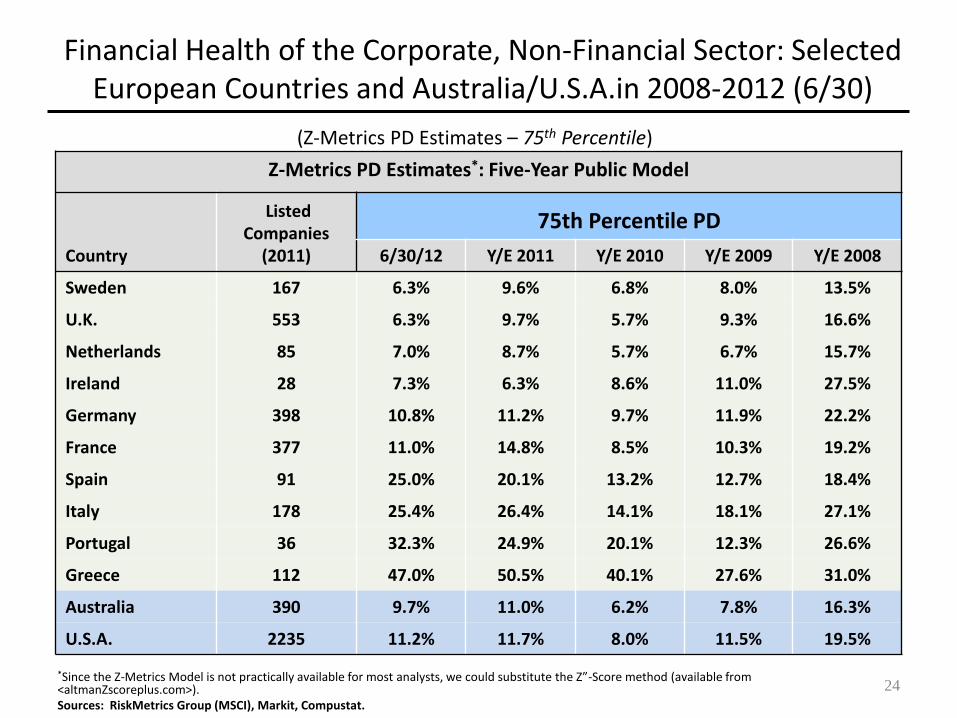
(Z-Metrics PD Estimates – 75th Percentile)
*Since the Z-Metrics Model is not practically available for most analysts, we could substitute the Z”-Score method (available from <altmanZscoreplus.com>). Sources: RiskMetrics Group (MSCI), Markit, Compustat.
Z-Metrics PD Estimates*: Five-Year Public Model
Country
Listed Companies
(2011)
75th Percentile PD
6/30/12 Y/E 2011 Y/E 2010 Y/E 2009 Y/E 2008
Sweden 167 6.3% 9.6% 6.8% 8.0% 13.5%
U.K. 553 6.3% 9.7% 5.7% 9.3% 16.6%
Netherlands 85 7.0% 8.7% 5.7% 6.7% 15.7%
Ireland 28 7.3% 6.3% 8.6% 11.0% 27.5%
Germany 398 10.8% 11.2% 9.7% 11.9% 22.2%
France 377 11.0% 14.8% 8.5% 10.3% 19.2%
Spain 91 25.0% 20.1% 13.2% 12.7% 18.4%
Italy 178 25.4% 26.4% 14.1% 18.1% 27.1%
Portugal 36 32.3% 24.9% 20.1% 12.3% 26.6%
Greece 112 47.0% 50.5% 40.1% 27.6% 31.0%
Australia 390 9.7% 11.0% 6.2% 7.8% 16.3%
U.S.A. 2235 11.2% 11.7% 8.0% 11.5% 19.5%
Financial Health of the Corporate, Non-Financial Sector: Selected European Countries and Australia/U.S.A.in 2008-2012 (6/30)
24
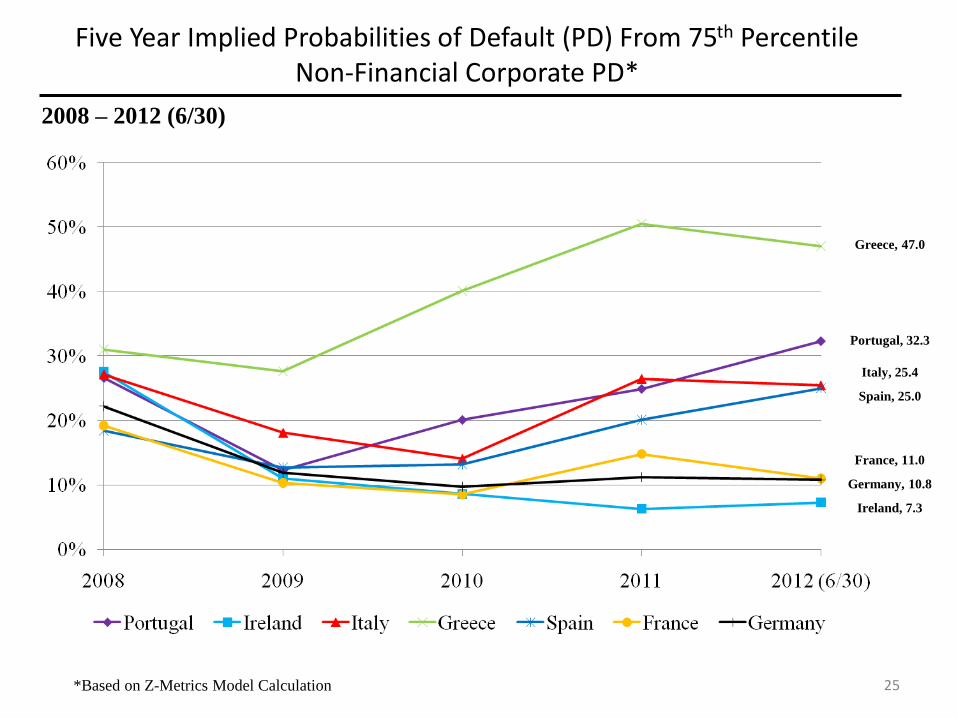
2008 – 2012 (6/30)
25
Five Year Implied Probabilities of Default (PD) From 75th Percentile Non-Financial Corporate PD*
Greece, 47.0
Portugal, 32.3
Ireland, 7.3
Spain, 25.0
Italy, 25.4
France, 11.0
Germany, 10.8
*Based on Z-Metrics Model Calculation
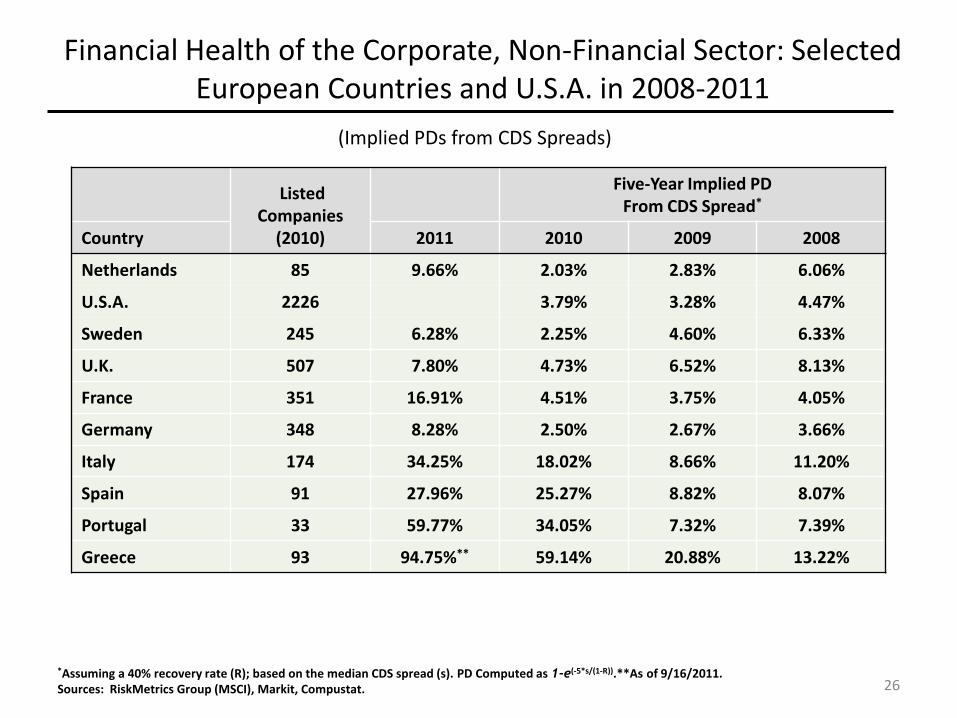
(Implied PDs from CDS Spreads)
*Assuming a 40% recovery rate (R); based on the median CDS spread (s). PD Computed as 1-e(-5*s/(1-R)).**As of 9/16/2011.
Sources: RiskMetrics Group (MSCI), Markit, Compustat.
Listed Companies
(2010)
Five-Year Implied PD From CDS Spread*
Country 2011 2010 2009 2008
Netherlands 85 9.66% 2.03% 2.83% 6.06%
U.S.A. 2226 3.79% 3.28% 4.47%
Sweden 245 6.28% 2.25% 4.60% 6.33%
U.K. 507 7.80% 4.73% 6.52% 8.13%
France 351 16.91% 4.51% 3.75% 4.05%
Germany 348 8.28% 2.50% 2.67% 3.66%
Italy 174 34.25% 18.02% 8.66% 11.20%
Spain 91 27.96% 25.27% 8.82% 8.07%
Portugal 33 59.77% 34.05% 7.32% 7.39%
Greece 93 94.75%** 59.14% 20.88% 13.22%
Financial Health of the Corporate, Non-Financial Sector: Selected European Countries and U.S.A. in 2008-2011
26
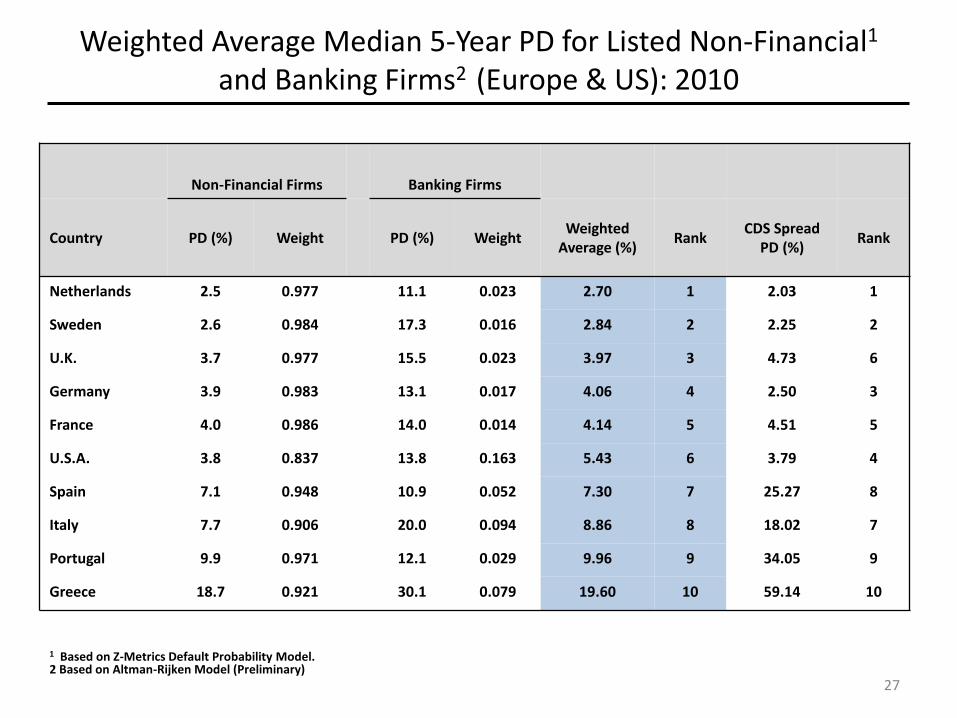
Weighted Average Median 5-Year PD for Listed Non-Financial1 and Banking Firms2 (Europe & US): 2010
1 Based on Z-Metrics Default Probability Model. 2 Based on Altman-Rijken Model (Preliminary)
Non-Financial Firms Banking Firms
Country PD (%) Weight PD (%) Weight Weighted
Average (%) Rank
CDS Spread PD (%)
Rank
Netherlands 2.5 0.977 11.1 0.023 2.70 1 2.03 1
Sweden 2.6 0.984 17.3 0.016 2.84 2 2.25 2
U.K. 3.7 0.977 15.5 0.023 3.97 3 4.73 6
Germany 3.9 0.983 13.1 0.017 4.06 4 2.50 3
France 4.0 0.986 14.0 0.014 4.14 5 4.51 5
U.S.A. 3.8 0.837 13.8 0.163 5.43 6 3.79 4
Spain 7.1 0.948 10.9 0.052 7.30 7 25.27 8
Italy 7.7 0.906 20.0 0.094 8.86 8 18.02 7
Portugal 9.9 0.971 12.1 0.029 9.96 9 34.05 9
Greece 18.7 0.921 30.1 0.079 19.60 10 59.14 10
27
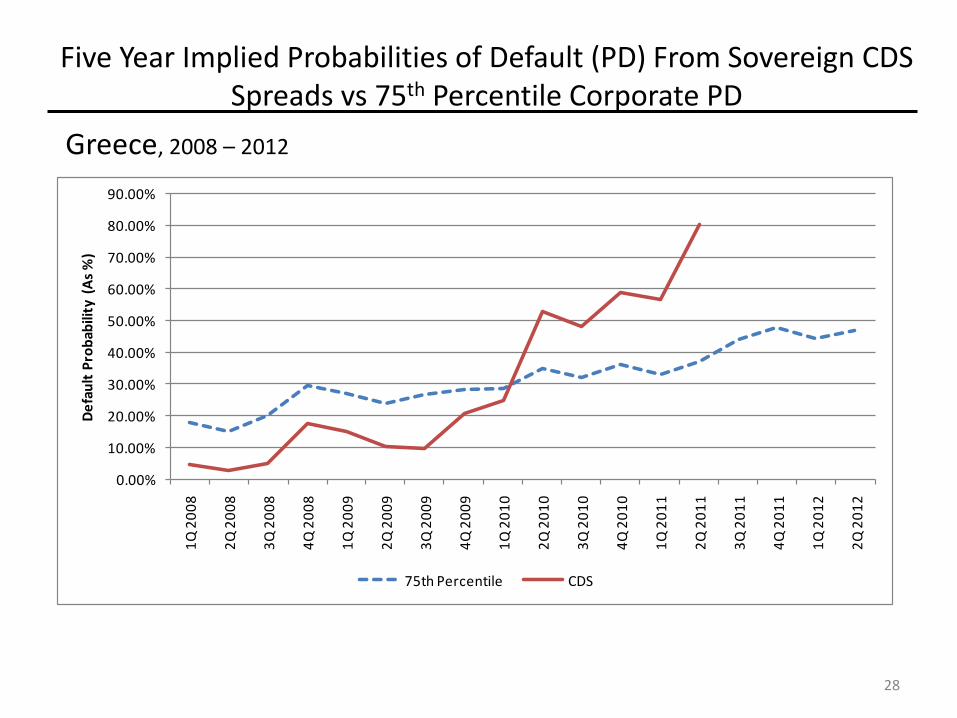
Five Year Implied Probabilities of Default (PD) From Sovereign CDS Spreads vs 75th Percentile Corporate PD
Greece, 2008 – 2012
0.00%
10.00%
20.00%
30.00%
40.00%
50.00%
60.00%
70.00%
80.00%
90.00%1
Q 2
00
8
2Q
20
08
3Q
20
08
4Q
20
08
1Q
20
09
2Q
20
09
3Q
20
09
4Q
20
09
1Q
20
10
2Q
20
10
3Q
20
10
4Q
20
10
1Q
20
11
2Q
20
11
3Q
20
11
4Q
20
11
1Q
20
12
2Q
20
12
De
fau
lt P
rob
abili
ty (
As
%)
75th Percentile CDS
28
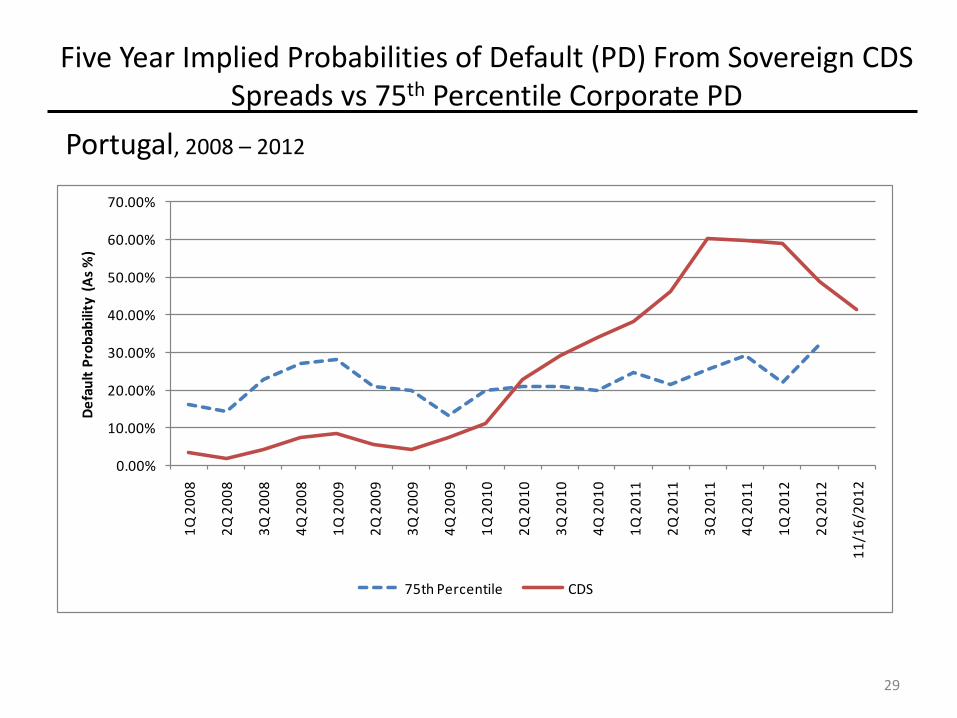
Portugal, 2008 – 2012
Five Year Implied Probabilities of Default (PD) From Sovereign CDS Spreads vs 75th Percentile Corporate PD
0.00%
10.00%
20.00%
30.00%
40.00%
50.00%
60.00%
70.00%1
Q 2
00
8
2Q
20
08
3Q
20
08
4Q
20
08
1Q
20
09
2Q
20
09
3Q
20
09
4Q
20
09
1Q
20
10
2Q
20
10
3Q
20
10
4Q
20
10
1Q
20
11
2Q
20
11
3Q
20
11
4Q
20
11
1Q
20
12
2Q
20
12
11
/16
/20
12
De
fau
lt P
rob
abili
ty (
As
%)
75th Percentile CDS
29
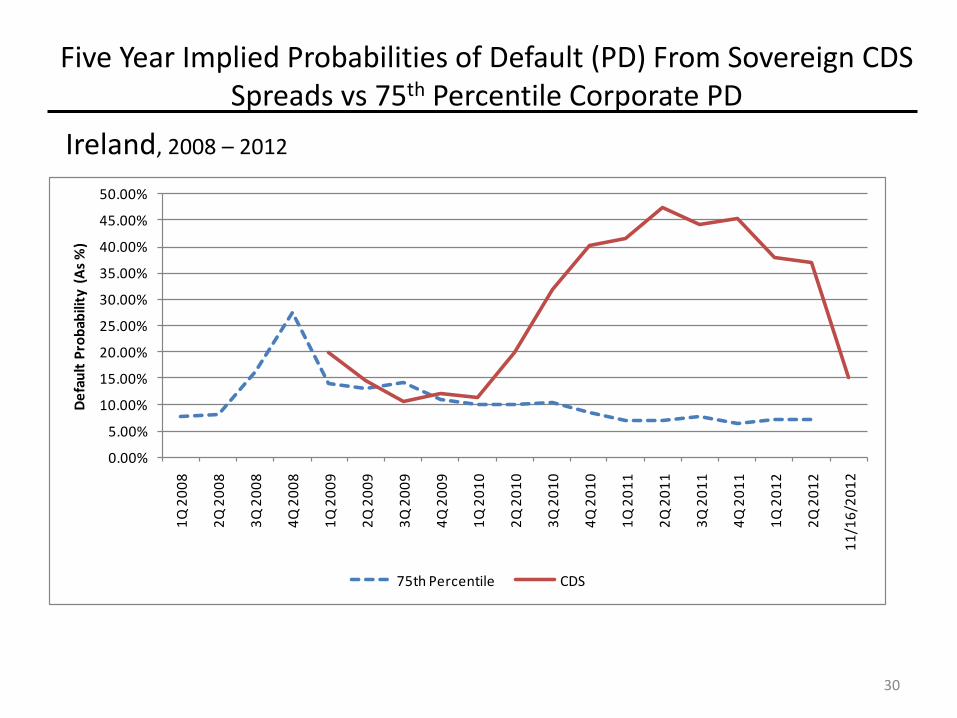
Ireland, 2008 – 2012
Five Year Implied Probabilities of Default (PD) From Sovereign CDS Spreads vs 75th Percentile Corporate PD
0.00%
5.00%
10.00%
15.00%
20.00%
25.00%
30.00%
35.00%
40.00%
45.00%
50.00%1
Q 2
00
8
2Q
20
08
3Q
20
08
4Q
20
08
1Q
20
09
2Q
20
09
3Q
20
09
4Q
20
09
1Q
20
10
2Q
20
10
3Q
20
10
4Q
20
10
1Q
20
11
2Q
20
11
3Q
20
11
4Q
20
11
1Q
20
12
2Q
20
12
11
/16
/20
12
De
fau
lt P
rob
abili
ty (
As
%)
75th Percentile CDS
30
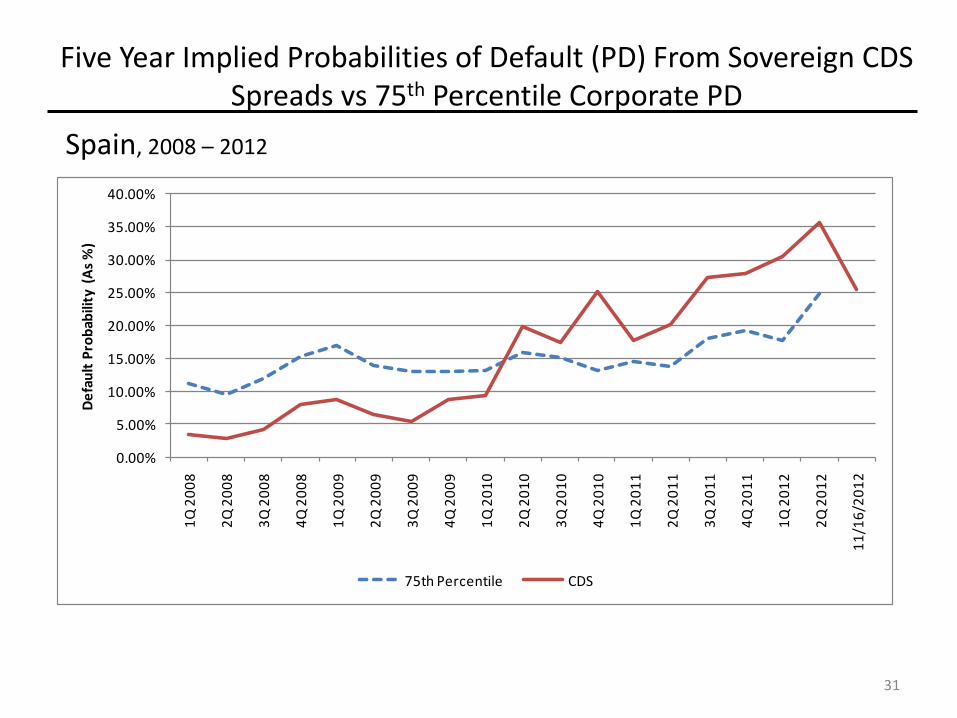
Spain, 2008 – 2012
Five Year Implied Probabilities of Default (PD) From Sovereign CDS Spreads vs 75th Percentile Corporate PD
0.00%
5.00%
10.00%
15.00%
20.00%
25.00%
30.00%
35.00%
40.00%1
Q 2
00
8
2Q
20
08
3Q
20
08
4Q
20
08
1Q
20
09
2Q
20
09
3Q
20
09
4Q
20
09
1Q
20
10
2Q
20
10
3Q
20
10
4Q
20
10
1Q
20
11
2Q
20
11
3Q
20
11
4Q
20
11
1Q
20
12
2Q
20
12
11
/16
/20
12
De
fau
lt P
rob
abili
ty (
As
%)
75th Percentile CDS
31
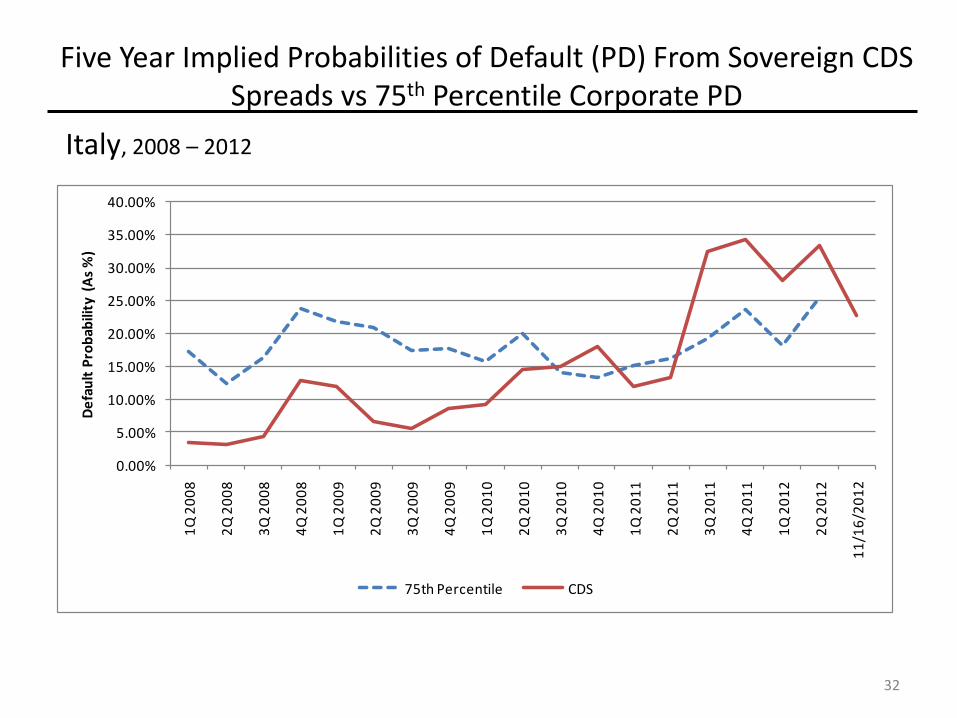
Italy, 2008 – 2012
Five Year Implied Probabilities of Default (PD) From Sovereign CDS Spreads vs 75th Percentile Corporate PD
0.00%
5.00%
10.00%
15.00%
20.00%
25.00%
30.00%
35.00%
40.00%1
Q 2
00
8
2Q
20
08
3Q
20
08
4Q
20
08
1Q
20
09
2Q
20
09
3Q
20
09
4Q
20
09
1Q
20
10
2Q
20
10
3Q
20
10
4Q
20
10
1Q
20
11
2Q
20
11
3Q
20
11
4Q
20
11
1Q
20
12
2Q
20
12
11
/16
/20
12
De
fau
lt P
rob
abili
ty (
As
%)
75th Percentile CDS
32
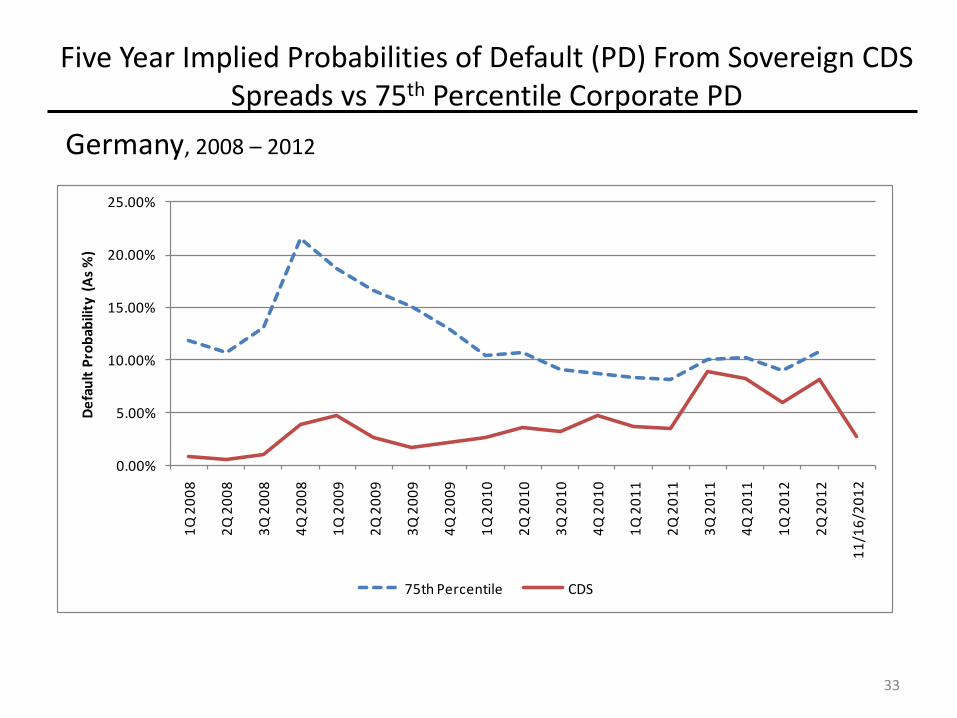
Germany, 2008 – 2012
Five Year Implied Probabilities of Default (PD) From Sovereign CDS Spreads vs 75th Percentile Corporate PD
0.00%
5.00%
10.00%
15.00%
20.00%
25.00%1
Q 2
00
8
2Q
20
08
3Q
20
08
4Q
20
08
1Q
20
09
2Q
20
09
3Q
20
09
4Q
20
09
1Q
20
10
2Q
20
10
3Q
20
10
4Q
20
10
1Q
20
11
2Q
20
11
3Q
20
11
4Q
20
11
1Q
20
12
2Q
20
12
11
/16
/20
12
De
fau
lt P
rob
abili
ty (
As
%)
75th Percentile CDS
33
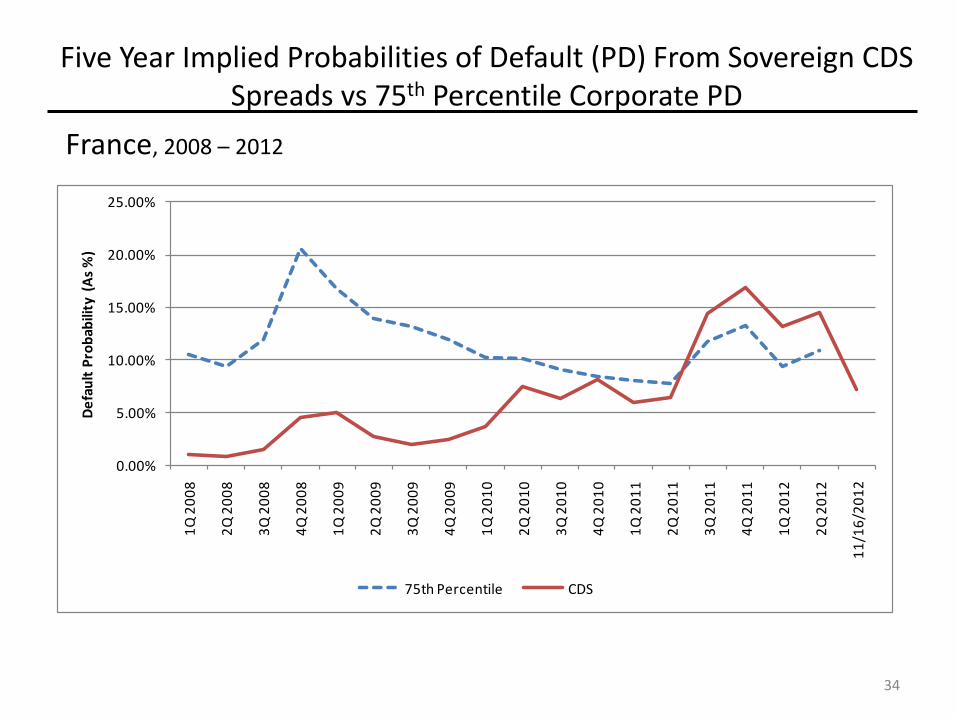
France, 2008 – 2012
Five Year Implied Probabilities of Default (PD) From Sovereign CDS Spreads vs 75th Percentile Corporate PD
0.00%
5.00%
10.00%
15.00%
20.00%
25.00%1
Q 2
00
8
2Q
20
08
3Q
20
08
4Q
20
08
1Q
20
09
2Q
20
09
3Q
20
09
4Q
20
09
1Q
20
10
2Q
20
10
3Q
20
10
4Q
20
10
1Q
20
11
2Q
20
11
3Q
20
11
4Q
20
11
1Q
20
12
2Q
20
12
11
/16
/20
12
De
fau
lt P
rob
abili
ty (
As
%)
75th Percentile CDS
34
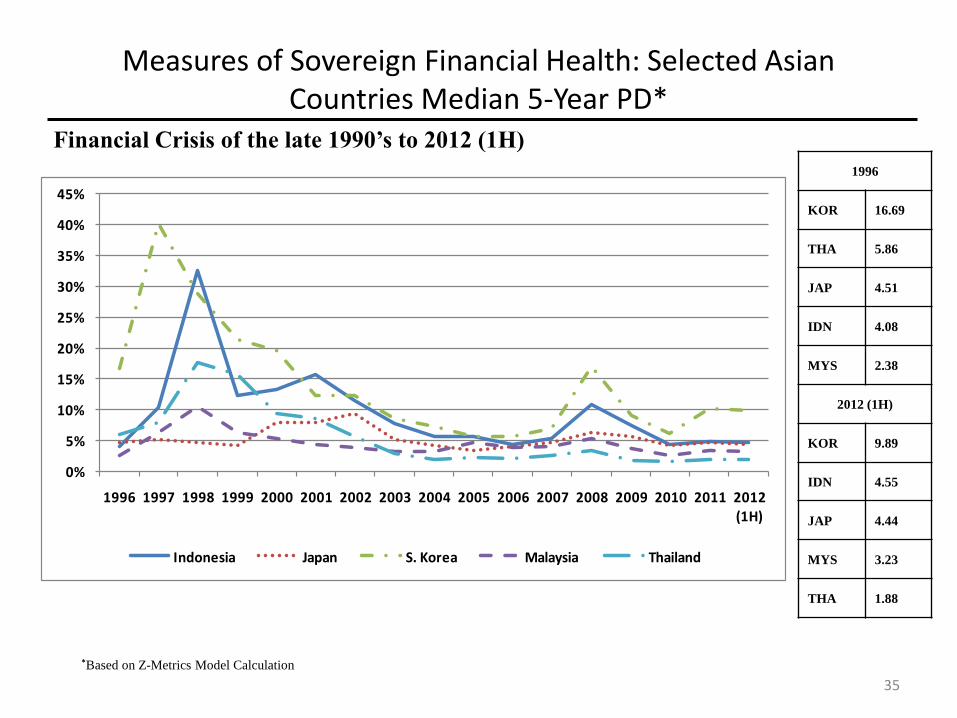
Measures of Sovereign Financial Health: Selected Asian Countries Median 5-Year PD*
*Based on Z-Metrics Model Calculation
Financial Crisis of the late 1990’s to 2012 (1H)
0%
5%
10%
15%
20%
25%
30%
35%
40%
45%
1996 1997 1998 1999 2000 2001 2002 2003 2004 2005 2006 2007 2008 2009 2010 2011 2012 (1H)
Indonesia Japan S. Korea Malaysia Thailand
1996
KOR 16.69
THA 5.86
JAP 4.51
IDN 4.08
MYS 2.38
2012 (1H)
KOR 9.89
IDN 4.55
JAP 4.44
MYS 3.23
THA 1.88
35
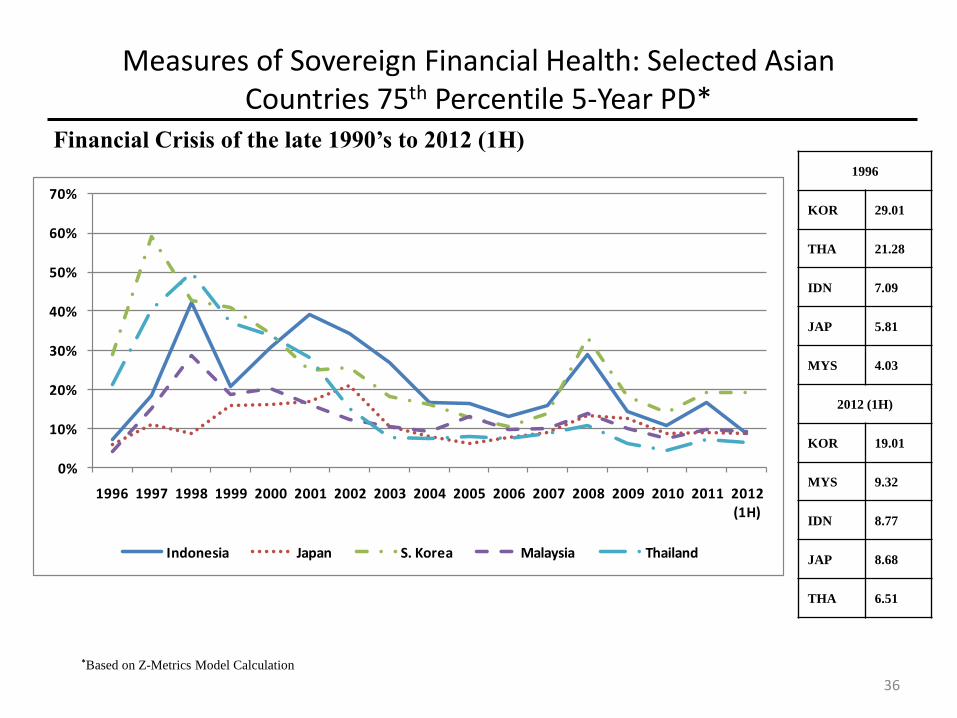
Measures of Sovereign Financial Health: Selected Asian Countries 75th Percentile 5-Year PD*
*Based on Z-Metrics Model Calculation
Financial Crisis of the late 1990’s to 2012 (1H)
1996
KOR 29.01
THA 21.28
IDN 7.09
JAP 5.81
MYS 4.03
2012 (1H)
KOR 19.01
MYS 9.32
IDN 8.77
JAP 8.68
THA 6.51
0%
10%
20%
30%
40%
50%
60%
70%
1996 1997 1998 1999 2000 2001 2002 2003 2004 2005 2006 2007 2008 2009 2010 2011 2012 (1H)
Indonesia Japan S. Korea Malaysia Thailand
36
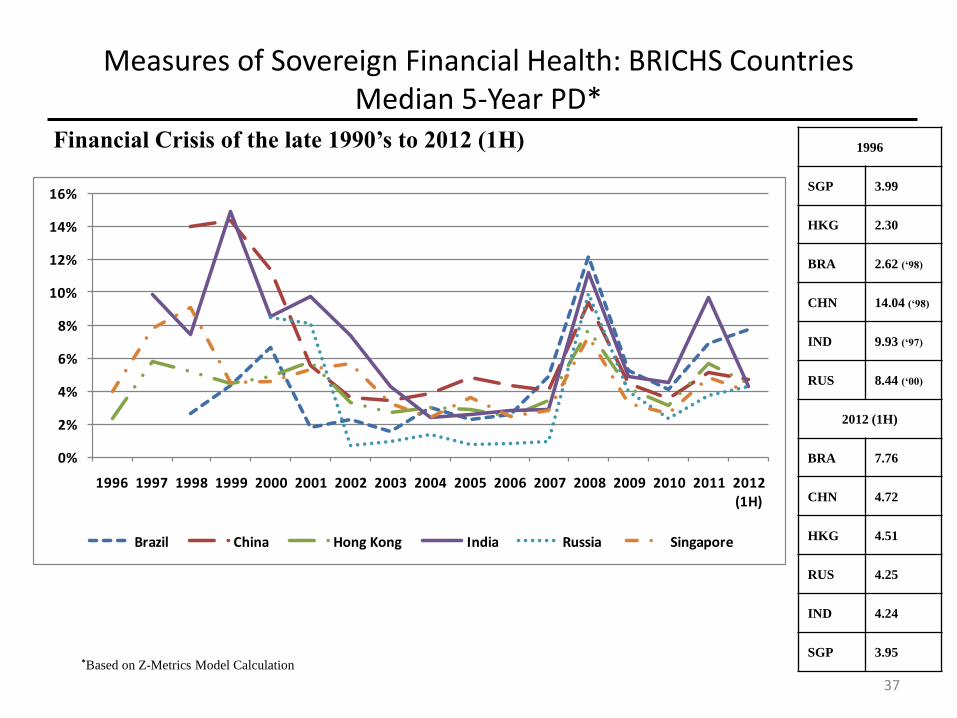
Measures of Sovereign Financial Health: BRICHS Countries Median 5-Year PD*
Financial Crisis of the late 1990’s to 2012 (1H)
*Based on Z-Metrics Model Calculation
1996
SGP 3.99
HKG 2.30
BRA 2.62 (‘98)
CHN 14.04 (‘98)
IND 9.93 (‘97)
RUS 8.44 (‘00)
2012 (1H)
BRA 7.76
CHN 4.72
HKG 4.51
RUS 4.25
IND 4.24
SGP 3.95
37
0%
2%
4%
6%
8%
10%
12%
14%
16%
1996 1997 1998 1999 2000 2001 2002 2003 2004 2005 2006 2007 2008 2009 2010 2011 2012 (1H)
Brazil China Hong Kong India Russia Singapore
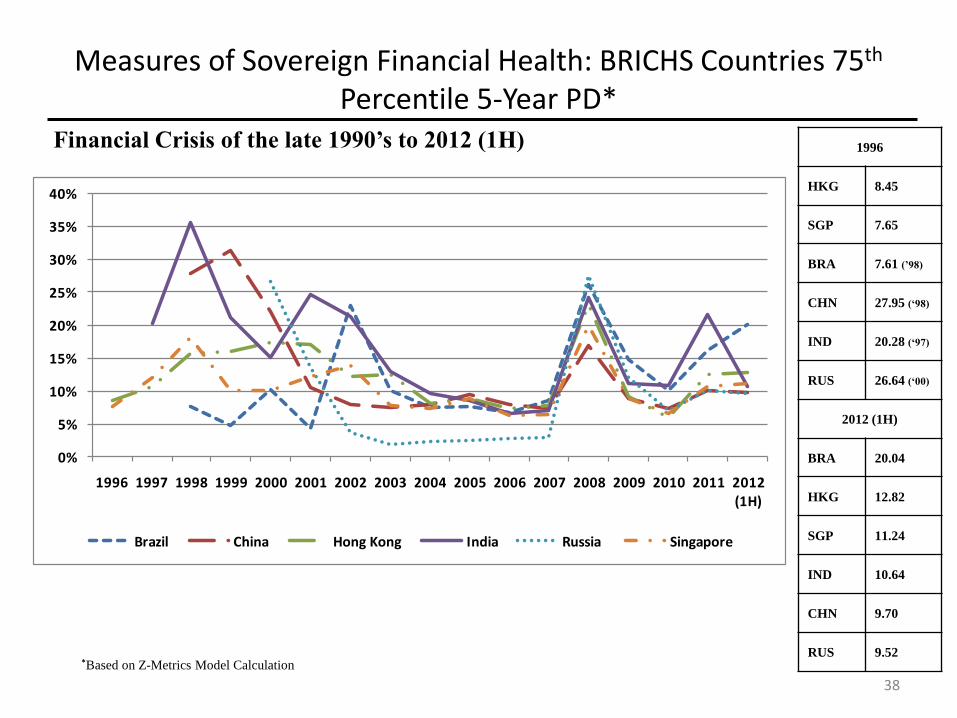
Measures of Sovereign Financial Health: BRICHS Countries 75th Percentile 5-Year PD*
Financial Crisis of the late 1990’s to 2012 (1H)
*Based on Z-Metrics Model Calculation
1996
HKG 8.45
SGP 7.65
BRA 7.61 (’98)
CHN 27.95 (‘98)
IND 20.28 (‘97)
RUS 26.64 (‘00)
2012 (1H)
BRA 20.04
HKG 12.82
SGP 11.24
IND 10.64
CHN 9.70
RUS 9.52
38
0%
5%
10%
15%
20%
25%
30%
35%
40%
1996 1997 1998 1999 2000 2001 2002 2003 2004 2005 2006 2007 2008 2009 2010 2011 2012 (1H)
Brazil China Hong Kong India Russia Singapore