Embed Size (px)
Citation preview
2011 Fermi Symposium, Roma., May. 9-12
Toward a New Paradigm for the Unification of Radio Loud AGN and its Connection to Accretion
Markos Georganopoulos Department of Physics, University of Maryland Baltimore County (UBMC),
1000 Hilltope Circle, Baltimore, MD 21250, USA fj Astrophysics Science Division, NASA/GoddardSpaceFlight Center, Greenbelt, MD20771, USA
Eileen T. :Meyer, Giovanni Fossati Department of Physics and Astronomy, Rice University, Houston, TX 77005, USA
Matthew L. Lister Department of Physics, Purdue University, West Lafayette, IN 47907, USA
We recently argued [21J that the collective properties. of radio loud active galactic nuclei point to the existence of two families of sources, one of powerful sources with single velocity jets and one of weaker jets with significant velocity gradients in the radiating plasma. These families also correspond to different accretion modes and therefore different thermal and emission line intrinsic properties: powerful sources have radiatively efficient accretion disks, while in weak sources accretion must be radiatively inefficient. Here, after we briefly review of our recent work, we present the following findings that support our unification scheme: (i) along the broken sequence of aligned objects, the jet kinetic power increases. (ii) in the powerful branch of the sequence of aligned objects the fraction of BLLs decreases with increasing jet power. (iii) for powerful sources, the fraction of BLLs increases for more un-aligned objects, as measured by the core to extended radio emission. Our results are also compatible with the possibility that a given accretion power produces jets of comparable kinetic power.
!. THE BLAZAR SEQUENCE AND OBSERVATIONS THAT CHALLENGE IT
The sequence. In blazars, radio loud active galactic nuclei (AGN) with their relativistic jet axis pointing to our line of sight, the synchrotron peak frequency (Vpeak) covers a wide range (1012 ;S Vpeak ;S 1018 Hz), with BL Lacs (BLL, lineless blazars) spanning the entire range and FSRQs (Flat spectrum radio quasars, sources with strong broad emission lines) having lower Vpeak (10'2 ;S vpeak ;S 1014 Hz). Following [1], we adopt the generic terms for low, intermediate, and high synchrotron-peaking (LSP, ISP, HSP) blazars independently of the spectroscopic type. [8] found that as the source synchrotron pOVler Lpeak increases, vpr.ak
decreases, with predominantly FSRQ sources at the low Vpeak, high Lpeak end through LSP, ISP, and finally HSP BL Lacs at the low Lpeak end. They also used the sparse EGRET data to argue that the same reduction of the peak frequency happens in the high energy - presumably inverse Compton (IC) component - component and that the Compton dominance (the fE.tio of IC to synchrotron power) increases with source power. [9] suggested that more efficient cooling of particles in the jets of high luminosity blazars is responsible for the lower peak frequencies.
·From sequence to envelope. [24] and [27] identified relatively powerful sources with a radio to X-ray spectral index ClRX typical of weak sources with Vpeak
in the X-rays. Such sources, if confirmed, challenge the se<iuence. Upon close study, however, their X-ray
eConf Cl10509
emission was found not to be of synchrotron origin [16] and as of now sources with high L,eak - high vpeak
have not been found [15, 16, 18, 26]. Sources below the blazar sequence are expected from jets less aligned to the line of sight. Indeed, [2, 23, 25] found that new SOurces they identified modify the blazar sequence to an envelope.
Challenges. [4] found several low Lpeak - low Vpeak sources that, because they have a high core dominance (R, ratio of core and therefore beamed to extended and therefore isotropic radio emission), are not intrinsically bright sources at a larger jet angle. These sources challenge the sequence because (i) both intrinsically weak and intrinsically powerful jets can have similar vpeak and (ii) intrinsically weak jets can produce a wide range of Vpeak from (1012 _ 1018
Hz). Another challenge came from [16] who showed that, contrary to what is anticipated by the sequence, high and low synchrotron peak frequency (HSP and LSP) BL Lacertae objects (BLLs, blazars with emission line EW W < 5 A) have similar Lex'. These findings challenge the sequence, even after being extended to include the sources in the envelope as de-beamed analogs of the blazar sequence sources.
A. The case for a critical accretion rate in radio loud AGN
[22] argued that at a critical value of the accretion rate mer = Maee/ MEdd f'V 10-3 - 10-2 , the accretion
1
https://ntrs.nasa.gov/search.jsp?R=20120010410 2018-05-01T10:54:51+00:00Z
2 2011 Fermi Symposium, Roma., May. 9-12
48
47
" 46
0 0
46 e> .!!.
[44 -' CO .2 43
• • BL.Lac .. ~) FSRQ
IJ FRI .. ' v FR II .... ~ .. , " o Fermi RG
... ,~I ..
" it. , ' . " ~ ' u l: .. ". - (8) " ,.. r ,-. . v I' ~ , . r..-~ /I,. -.... , v~v • • . ...... : t .' -- , Cl v :~ __ - • I~~' -:!':; ..... log ~: . ' • <43.5 I, ' [] II! 43.5-44
42
41
" c 44-44.5
@ilt 44.5-45
. 45-45.5
" • >45.5
12 13 14 15 16 17
log Vpe1k [Hz)
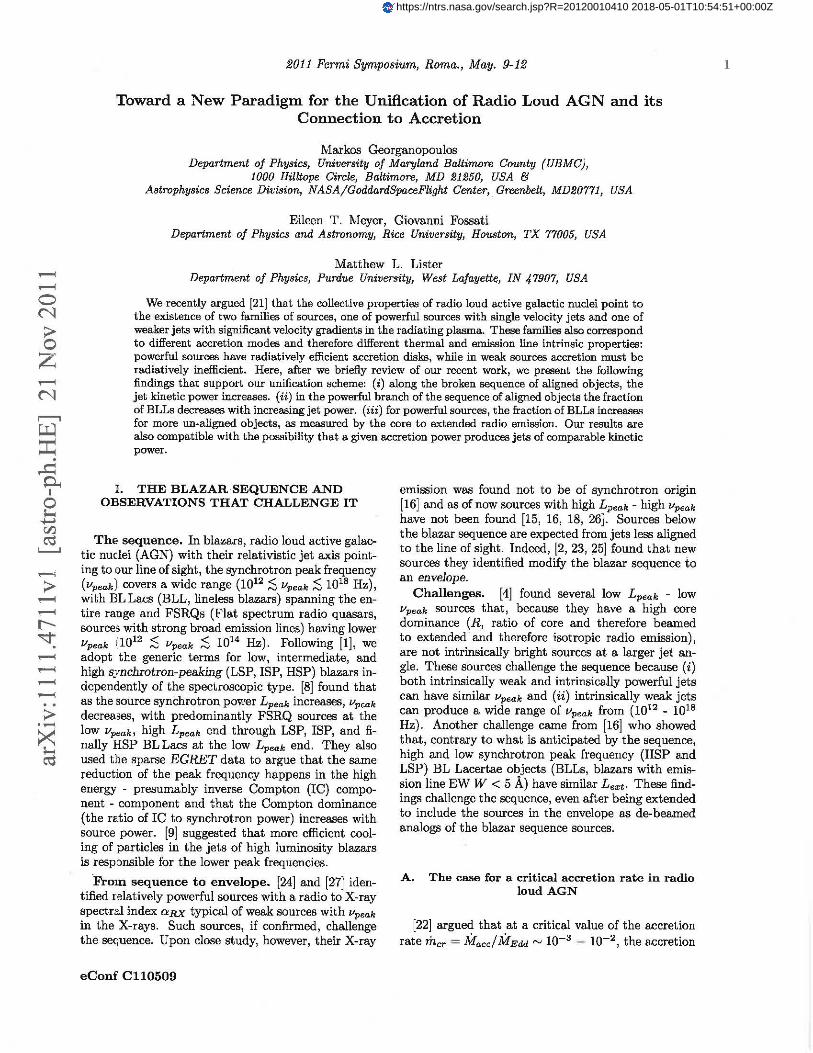
FIG. 1: From Mll: The blazar sequence, bas been expanded into an "envelope" with the addition of new observations. The solid lines indicate the broken power sequence of an aligned source as its Lkin increases. Track (A) shows the path ofasynchrotron peak for a single speed jet in an environment of radiatively efficient accretion and (B) for a decelerating jet of the type hypothesized to exist in FRI sources aJ3 the jet orientation changes.
switches from a standard radiatively efficient thin disk with accretion-related emission power Lace (X mLEdd for m > mer, to a radiatively inefficient mode where Lace ex m2 LEdd. This critical point may be connected to the transition between Fanaroff Riley [FR; 7] II to FR I radio galaxies (RG) : the level of the low frequency extended radio emission (coming mostly from the radio lobes and considered to be isotropic) that separates FR I and FR II RG, has been shown to be a function of the host galaxy optical magnitude [17]: the division between FR I and FR II is at higher radio luminosities for brighter galaxies. [10] argued that, because the optical magnitude of a galaxy is related to the central black home m""s [20] and the extended radio luminosity is related to the jet kinetic luminosity [following the scaling of 29], this division can be casted as a division in terms of the fraction of the Eddington luminosity carried by the jet: jets with kinetic luminosity Lkin ;$ mer LEdd give rise to FR I RG, while jets with Lk;n i:::. mer LEdd are predominantly FR II sources. Interestingly, and in agreement with the unification scheme, [12] and [13] find that the same dichotomy applies to separating BLLs and FSRQ, the aligned versions of FR I and FR II respectively. Finally, it is very intriguing that [19] argue that there is a paucity of sources around m f"V 0.01. FR I, low line excitation FR II and some high line excitation FR II were found to occupy the low m regime, while the high m regime was occupied by high line excitation FR II, broad line radio galaxies and powerful radio quasars.
eConf Cl10509
II. A BROKEN POWER SEQUENCE FOR BLAZARS
Recently, we [21, heretofore M11] compiled the largest sample of radio loud AGN for which sufficient data existed to determine variability-averaged Vpeak
Lpeak, as well as the extended low frequency radio emission Le:r;t. This is an important quantity in our study, because it has been shown to be a good proxy for the jet kinetic power Lkin,' as measured by the energy required to inflate the X-ray cavities seen to coincide with the radio lobes of a number of sources [e.g. 3, 5].
The picture that emerges (figure 1) exhibits some important differences with the blazar sequence. In particular, ISP BLLs have Lkin comparable to that of HSP and LSP BLLs. Also, although all the FR I galaxies were found to have similar Lkin with BLLs, no FR I galaxies were found with Vpeak .2: 1013.5 Hz. Because there is no obvious selection acting against the detection of FR I galaxies with core SED peaking at higher energies, we are lead to conclude that the unaligned versions of HSP blazars have Vpeak smaller by a factor of le""t 103 compared to their aligned equivalent, something that agrees with the existence of velocity profiles in the emitting pl""ma, "" supported by other investigations [e.g. 6, 11, 14, 28].
In M11 we suggested that extragalactic jets can be described in terms of two families. The first is that of weak jets characterized by velocity profiles and weak or absent broad emission lines. HSPs (Vpeak .2: 1016
Hz), ISPs (10'4.5 ;S Vpeak ;S 10'6 Hz), and FR I RG belong to this family. On the basis of having similar Lkin with HSPs and FR I RG, the ISP sources were argued to be somewhat un-aligned HSPs. The second family is that of more powerful jets having a single Lorentz factor emitting plasma and, in most cases, stronger broad emission lines. Interestingly, the two families divide at Lkin f"V 1044 .5 erg s-1, which for M = 109 M0' corresponds to Lkin f"V 2.3x 10⁻³ LEdd,9,
similar to the mer of [22]. Aligned sources are found along the broken power sequence depicted by the solid lines A and B with A (B) corresponding to jets in radiatively efficient (inefficient) accretion environments with m > mer (m < me.·). The broken lines A and B depict the tracks followed by two sources as they depart from the power sequence and their orientation angle (j increases. While in the first case a single velocity flow is assumed, in the second case emission from a decelerating flow is considered [14].
III. TESTS OF THE NEW SCHEME.
We now discuss some predictions of the new unification scheme and their confirmation from the current data.
2011 Fermi Symposi"m, Roma., May. 9-12
-T; 0 2' ~ ~ ~ ~
E
4B
47
46
45
44
43
42
41
log vpa .. [Hz]
BL. Lac FSRQ
[] FAI v FAil
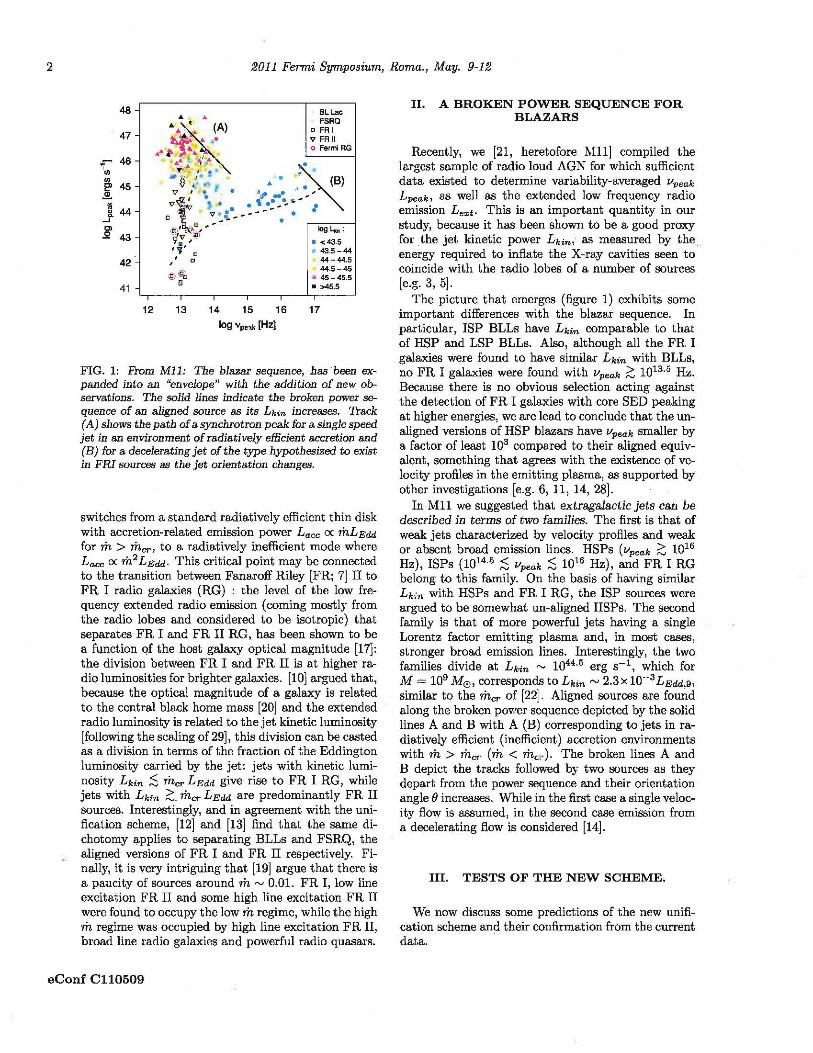
FIG. 2: Same data as Figure 1. See text for the description of boxes A, B, C and zones ex, {3, 'Y.
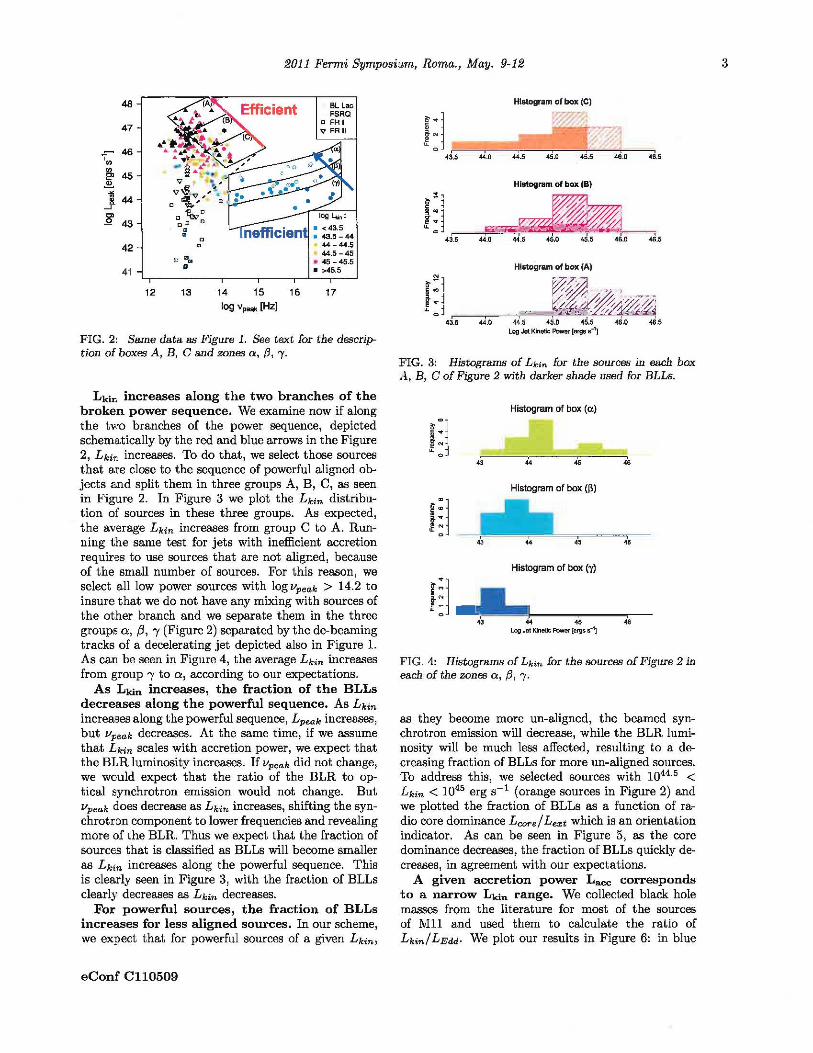
Lkin increases along the two branches of the broken power sequence. We examine now if along the two branches of the power sequence, depicted schematically by the red and blue arrows in the Figure 2, Lkin increases. To do that, we select those sources that are close to the sequence of powerful aligned olr jects and split them in three groups A, B, C, as seen in Figure 2. In Figure 3 we plot the Lkin distribution of sources in these three groups. As expected, the average Lkin increases from group C to A. Running the same test for jets with inefficient accretion requires to use sources that are not aligr..ed, because of the small number of sources. For this reason, we select all low power sources with log vpeak > 14.2 to insure that we do not have any mixing with sources of the other branch and we separate them in the three groups a, (3, 'Y (Fignre 2) separated by the de-beaming tracks of a decelerating jet depicted also in Figure 1. As can be seen in Figure 4, the average Lkin increases from group I to Q, according to our expectations.
As Lkin increases, the fraction of the BLLs decreases along the powerful sequence. As Lkin
increa3es along the powerful sequence, Lpeak increases, but Vpeak decreases. At the same time, if we assume that Lkin scales with accretion power, we expect that the BLR luminosity increases. If Vpeak did not change, we would expect that the ratio of the BLR to optical synchrotron emission would not change. But Vpeak does decrease as Lkin increases, shifting the synchrotron component to lower frequencies and revealing more of the BLR. Thus we expect that the fraction of sources that is classified as BLLs will become smaller as Lk'in increases along the powerful sequence. This is clearly seen in Figure 3, with the fraction of BLLs clearly decreases as Lkin decreases.
For powerful sources, the fraction of BLLs increases for less aligned sources. In our scheme, we expect that for powerful sources of a given Lkin,
eConf Cl10509
Histogram of box (e)
T~
Hlstogl1llm of box (8)
~~ 43.5 44.0 «.5 45.0 45.5 46.0 46.5
Histogram of box (A)
FIG. 3: Histograms of Lkin for the sources in each box .. i, B, C of Figure 2 with darker shade used for BLLs.
Histogram of box (a)
Histogram of box (~)
Hl Histogram of box (y)
m __ ~! _...---::--~ « 45 4S
Log Jet Kinetic Pbwer [ergs .-']
FIG. 4: Histograms of Lkin for the sources of Figure 2 in each· of the zones 0, {J, '"Y.
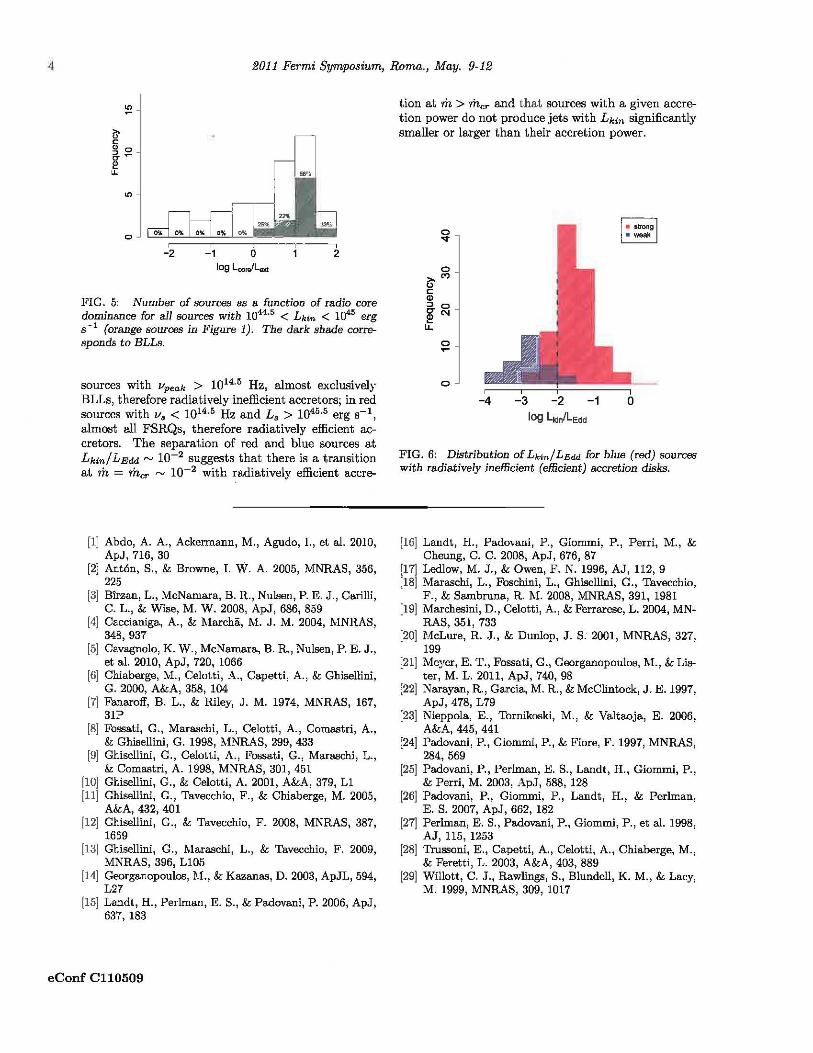
as they become more un-aligned, the beamed synchrotron emission will decrease, while the BLR luminosity will be much less affected, resulting to a decreasing fraction of BLLs for more un-aligned sources. To address this, we selected sources with 1044.5 < Lkin < 1045 erg S-l (orange sources in Figure 2) and we plotted the fraction of BLLs as a function of radio core domir..ance L core / Lext which is an orientation indicator. As can he seen in Figure 5, as the core dominance decreases, the fraction of BLLs quickly decreases, in agreement with our expectations.
A given accretion power Lace corresponds to a narrow Lkin range. We collected black hole masses from the literature for most of the sources of Mll and used them to calculate the ratio of Lkin/ LEdd. We plot our results in Figure 6: in blue
3
2011 Fermi Symposium, Roma., May. 9-12
o
FIG. 5: Number of sources as a function of radio core dominance for all sources with 1044
.5 < Lkin < 1045 erg
8-1 (orange sources in Figure 1). The dark shade corre
sponds to BLLs.
sources with lIpeak > 1014.5 Hz, almost exclusively BLLs, therefore radiatively inefficient accretors; in red sources with Vs < 1014 .5 Hz and L8 > 1045 .5 erg 8- 1,
almost all FSRQs, therefore radiatively efficient accretors. The separation of red and blue sources at Lkin/ LEdd ~ 10-2 suggests thai there is a transition at rh = mer I".J 10-2 with radiatively efficient accre-
[1] Abdo, A. A., Ackermann, M., Agudo, I., et al. 2010, ApJ, 716, 30
[2] Ant6n, S., & Browne, l. W. A. 2005, MNRAS, 356, 225
[3] Birzan, L., McNamara, B. R, Nulsen, P. E. J., CariIli, C. L., & Wise, M. W. 2008, ApJ, 686, 859
[4] Caccianiga, A., & lIarchl>, M. J. M. 2004, MNRAS, 348,937
[5] Cavagnolo, K. W., McNamara, B. R., Nulsen, P. E. J., et a1. 2010, ApJ, 720, 1066
[6] Chiaberge, M., Celotti, _\., Capetti, A., & Ghiseilini, G. 2000, A&A, 358, 104
[7] Fa:J.aroff, B. L., & Riley, J. M. 1974, MNRAS, 167, 31P
[8] Fossati, G., Maraschi, L., Celotti, A., Comastri, A., & Ghisellini, G. 1998, MNRAS, 299,433
[9] Ghisellini, G., Celotti, A., Fossati, G., Maraschi, L., I,,; Comastri, A. 1998, MNRAS, 301, 451
[10] Ghisellini, G., & Celolli, A. 2001, A&A, 379, Ll [11] Ghisellini, G., Tavecchio, F., & Chiaberge, M. 2005,
A&A, 432, 401 [12] Ghisellini, G., & Tavecchio, F. 2008, MNRAS, 387,
1659 [13] Ghisellini, G., Maraschi, L., & Tavecchio, F. 2009,
MNRAS, 396, L105 [14] Georganopoulos, 11., & Kazanas, D. 2003, ApJL, 594,
L27 [15] Landt, H., Perlman, E. S., & Padovani, P. 2006, ApJ,
637, 183
eConf Cl10509
tion at m > mer and that sources with a given accretion power do not produce jets with L ki n significantly smaller or larger than their accretion power.
o ,.,'" " c:
" " 0
~'" ..
o
FIG. 6: Distribution of Lkin / LEdd for blue (red) sources with radiatively inefficient (efficient) accretion disks.
[16] Landt, R., Padm.--ani, P., Giornmi, P., Perri, M., & Cheung, C. C. 2008, ApJ, 676, 87
[17] Ledlow, M. J., & Owen, F. N. 1996, AJ, 112, 9 [18] Maraschi, L., Foschini, L., Ghisellini, G., Tavecchio,
F., & Sambruna, R. M. 2008, MNRAS, 391, 1981 [19] Marchesini, D., Celotti, A., & Ferrarese, L. 2004, MN
RAS, 351, 733 [20] McLure, R. J., & Dunlop, J. S. 2001, MNRAS, 327,
199 [21] Me!rer, E. T., Fossati, G., Georganopoulos, 1\1., & Lis
ler, M. L. 2011, ApJ, 740, 98 [22] Narayan, R, Garcia, M. R, & McClintock, J. E. 1997,
ApJ, 478, L79 [23] Nieppola, E., Tornikoski, M., & Valtaoja, E. 2006,
A&A, 445, 441 [24] Padovani, P., Giommi, P., & Fiore, F. 1997, MNRAS,
284,569 [25] Padovani, P., Perlman, E. S., Landt, R., Giommi, P.,
& Perri, M. 2003, ApJ, 588, 128 [26] Padovani, P., Giornmi, P., Landt, R., & Perlman,
E. S. 2007, ApJ, 662, 182 [27] Perlman, E. S., Padovani, P., Giommi, P., et al. 1998,
AJ, 115, 1253 [28] Trussoni, E., Capetti, A., Celotti, A., Chiaberge, M. ,
& Feretli, L. 2003, A&A, 403, 889 [29] Willolt, C. J., Rawlings, S., Blundell, K. M., & Lacy,
M. 1999, MNRAS, 309, 1017