Embed Size (px)
Citation preview

1.4 Toward Better Use of Lightning Data in Operational Forecasting
Alan M. Cope* NOAA/National Weather Service
Mount Holly, NJ 1. INTRODUCTION Lightning is a well-known weather hazard that typically kills between 50 to 100 people in the United States each year. It is thus on a par with tornadoes and flash floods as a cause of weather-related fatalities. Many more people are struck by lightning and survive, but suffer long-term health problems. Lightning also starts many house fires and wild fires, and often causes local to widespread power outages affecting thousands of electric utility customers. All thunderstorms by definition produce lightning; however, some thunderstorms produce far more cloud-to-ground (CG) lightning than others. Of course, it takes only one CG lightning flash from one isolated thunderstorm to cause a fatality. Even so, for anyone caught in the open, the risk of being struck by lightning is certainly greater in a high-CG flash rate storm, as is the likelihood of fire damage and electrical power outages. It would be advantageous if the likelihood for high-CG storms to occur could be determined a day or even an hour in advance. While references to “intense” or “frequent” lightning may be included as part of a severe thunderstorm warning or special weather statement, there is no official National Weather Service (NWS)-wide product that deals specifically with lightning. A few local NWS offices have developed lightning forecasts on their web pages; for example, see Sharp (2005). However, there seems to be no general consensus among forecasters as to what sort of flash rate or flash density (the number of flashes per unit time per unit area) represents a “high-CG storm” versus an “ordinary” thunderstorm. The purpose of this study is to gain a better understanding of summertime lightning over the Mid-Atlantic region of the eastern U.S. by examining lightning patterns during the summers of 2004 and 2005. This study addresses two main questions: (1) What is a “big” lightning event Corresponding author address: Alan M. Cope, National Weather Service, 732 Woodlane Road, Mount Holly, NJ, 08060. e-mail: [email protected]
in the Mid-Atlantic region? and (2) How might a forecaster anticipate a “big” event? The following sections of the paper will describe the data and methods used, discuss the main results, and suggest some better ways to use lightning in NWS operations. 2. DATA AND METHODOLOGY 2.1 Methods: Assessing Lightning Frequency NWS lightning data is provided through a license agreement with Vaisala/GAI. CG lightning data have been available to NWS field-office forecasters since the late 1990’s through the Advanced Weather Information Processing System (AWIPS). On AWIPS, CG flashes can be displayed for time intervals of 1 minute, 5 minutes, 15 minutes, or 1 hour, over various spatial extents. Some examples of AWIPS lightning displays are shown in Fig. 1. A thunderstorm with a high CG flash rate relative to its neighbors is easily identified by viewing lightning in combination with radar and/or satellite imagery. The AWIPS software also shows the flash counts for negative and positive flashes within the display area in the upper left portion of each display panel. National lightning data for the summers of 2004 and 2005 (June, July and August) were archived from the AWIPS at the NWS Forecast Office in Mount Holly, New Jersey (NWS-PHI), though most of June 2005 was not available due to software problems. Archived data were loaded into the Weather Event Simulator (a computer system that mimics AWIPS; Magsig and Page 2001) at NWS-PHI. Hourly lightning counts for the five available summer months (3696 total hours) were made for various spatial scales including the NWS-PHI county warning area (CWA), for six Mid-Atlantic greater-metropolitan areas, and for a multi-state area over the greater Mid-Atlantic region. These areas are listed in Table 1 and shown graphically in Fig 2. (The "Mid-Atlantic" region, as the term is used in this paper, also includes much of southern New England, the lower Great Lakes, and the upper Ohio Valley.) The hourly flash counts, separated for positive and negative, were entered into a spreadsheet program, from which hourly, daily
1

and season totals were computed. For this study, a new "day" was considered to start at 1200 UTC. 2.2 Methods: Anticipation of Intense Lightning In theory, strong thermodynamic instability should lead to thunderstorms with strong updrafts, leading to rapid electric charge separation, leading to high lightning flash rates. However, previous efforts to correlate the amount of CG lightning with observed meteorological parameters have met with somewhat limited success (e.g., Shafer and Fuelberg 2005). Besides the role of unresolved cloud microphysical processes, the relationship is complicated by the fact that thunderstorms may not form at all in a given area, even in very unstable conditions, if other ingredients such as moisture or low-level convergence are missing. Because of complications from thunderstorm-inhibiting factors, and because intense lightning events are rare in any given location (see “Results” section below), it was decided to focus on active thunderstorm periods in the Mid-Atlantic area, and examine lightning clusters throughout that region during those times. (The "cluster" area, i.e., area "d1" in Fig. 2, is actually, a subset of the large area used for hourly counts). This would provide more cases for possible correlation, and would avoid the problem of non-occurrence of thunderstorms. However, the results would be conditional on the development of deep convection. All “active” lightning hours, defined as hours during which at least 2500 flashes were counted in region "d1" of Fig. 2, were identified during summers 2004 and 2005. The most intense cluster for each hour was then located and its flash count measured by zooming in the maximum amount on the AWIPS monitor. The latitude and longitude of the cluster center were recorded, along with the negative and positive CG flash counts. Lightning clusters over the ocean beyond coastal waters were not included. This process yielded about 300 lightning clusters, containing from a few hundred up to about 9000 CG flashes per hour in approximately a 3000 sq-km area (equivalent to area "e1" in Fig.2). These flash counts were then compared with three-hourly surface-based CAPE analyses from the Eta-model Data Assimilation System (EDAS), available on-line from the NOAA Air Resources Laboratory (ARL) Real Time Environmental Applications and Display System (READY) at http://www.arl.noaa.gov/ready.html. The analyses were generated by specifying the center latitude and longitude for each cluster and a map radius of 1.0 degree latitude. An example of a
CAPE analysis, along with 850-mb wind vectors, generated from that web site is shown in Fig 3. Generally, CAPE was estimated at a point near the center of the lightning cluster, indicated by a small star in the center of the figure. However, in some cases, such as the one in Fig 3, the lightning cluster was located over a strong gradient of CAPE with 850-mb winds blowing from a region of higher CAPE into the cluster. In those situations, the CAPE at 50 to 100 km upstream of the cluster center was judged to be more representative of the instability available to the thunderstorms. 3. RESULTS 3.1 Lightning Frequency Results of the daily-total lightning flash counts for summers 2004 and 2005 are shown in Fig. 4 and in Table 1. The most striking aspect of the graphs, especially for the smaller areas, is that most of the summer lightning for a given area occurred on just a few “big days". These results agree qualitatively with Zajac and Rutledge (2001; see their figure 8), except their analyses were based on a much finer grid. To quantify the concept of a "big day", the daily flash counts for each area were ranked from highest to lowest, the cumulative total flashes were computed by rank, and the minimum number of most active days containing 50 percent of the total summer lightning was noted. By this definition, the "metro" areas (areas "a1" to "a6") and the PHI-CWA area ('b1") experienced 6 to 9 "big days", as indicated in Table 1. Also from that table, the minimum daily flash count for a "big day" within each metro area ranged from around 3000 to 5000 flashes (except around 1550 at RNK). The largest daily flash counts by area (not in the table) ranged from 7933 flashes at RNK to 17,794 at RIC. For the larger Mid-Atlantic region (area “c1”), there is less tendency for lightning to be concentrated on a few days. However, even for that area, over 50 percent of the nearly 3 million CG lightning flashes occurred on just 24 out of 154 days. The same criterion applied to hourly lightning flash counts suggests that a "big hour" for lightning would be approximately 500 to 1000 flashes per hour. The highest overall hourly "metro" area flash count was 6088 flashes at RIC, on the same day as the maximum daily total stated above. To estimate the frequency of higher hourly lightning counts, a frequency distribution was calculated for hourly lightning counts from the combined six “metro” areas. From this distribution, one can determine a rough estimate
2

of the probability of exceeding a given flash count during one hour, for that geographic scale. The cumulative frequency distribution and the percentage of cases (hours) exceeding selected flash counts are shown in Table 2. The exceedence percentages are computed relative to the total number of summer hours and relative to the number of hours containing at least 2 flashes. Relative to the latter (i.e., given that lightning is occurring), the chance of getting more than 100 flashes is around 30 percent, while the chance of getting more than 1000 flashes is estimated at roughly 4 percent. From Table 2 and from the "big hour" definition above, the likelihood of a "big hour" during the summer is 0.5 to 1.0 percent overall, or roughly 4 to 8 percent given that lightning is already occurring. Of course, these estimates do not take into account storm history or the meteorological environment at a particular time. Although not the main focus of this study, a diurnal distribution of CG lightning flashes for the Mid-Atlantic region was also computed, and is shown in Fig 5. As expected, the number of flashes begins to increase around midday, reaching a peak in the late afternoon, and then falling off rapidly during the evening. Almost half the daily lightning (49 percent) occurred during the five hours from 1900 to 2300 UTC, or 3 pm to 8 pm EDT. Negative and positive CG flashes both show a similar diurnal trend. (Overall, positive flashes made up 13.6 percent of the total CG lightning.) The diurnal lightning pattern also mimics the diurnal summer temperature trend (not shown), although the lightning peak lags the temperature by two to three hours, and the flash rate rises and falls more sharply relative to the peak. 3.2 Anticipating Intense Lightning As discussed above, this study also attempted to find some discriminating factor(s) among lightning clusters of varying intensity. Figure 6 shows the spatial distribution of the lightning clusters in this study. A maximum is apparent over the Chesapeake and Delaware Bay regions, with a possible secondary maximum over southwestern Pennsylvania. Allowing for decreased numbers near the domain boundaries, this distribution is in broad qualitative agreement with other lightning climatologies such as that of Zajac and Rutledge (2001). These maxima suggest the preferred locations for the most intense lightning cluster, at any given hour in which widespread lightning activity is occurring. The relationship between CG flash density in the lightning clusters and the maximum CAPE in the vicinity is depicted by the scatter plot in Fig. 7. Although the plot suggests some positive
correlation, the explanation of variance is still a very modest 15 percent (r2 = .151). There is also a hint of an upper threshold of flash density for a given CAPE, i.e., CAPE might be a limiting factor; however, many additional data points would be needed to confirm or reject this hypothesis. In particular, more “high-end” cases, clusters containing 4000 flashes per hour or more, are needed. The two highest flash events in this sample (upper right of Fig. 7), which occurred over Lake Erie, could be regarded as outliers in the context of this study; however, they are likely more common over the southeast or mid-western U.S. 4. DISCUSSION AND CONCLUSION This study has been an attempt to quantify the concept of a “big” lightning event, to estimate how frequently such events occur in the Mid-Atlantic region, and to identify factors that might help anticipate these events. Daily and hourly counts of lightning flashes over several greater metropolitan areas show that lightning during the summer tends to be concentrated on a few “big” days. On one of those big days, a Mid-Atlantic metro area typically experiences at least 3000-5000 CG flashes, but possibly several times that amount. The hourly flash rates tended to be highest from mid afternoon to early evening. For an area of about 16,000 sq km (the "metro" areas in Fig. 2), the data suggest an hourly flash count of 1000 or greater might occur about 4 percent of the time given that some lightning activity is present, or about 0.5 percent of the total time. Based on only two seasons of lightning data, these results are preliminary and need verification by further study. The meteorological factors supporting intense lightning events have proven very difficult to identify. CAPE alone shows only a very modest correlation with flash rate or flash density, even for on-going lighting activity. From the scatter-plot in Fig. 7, it is tempting to infer an upper bound on the flash count as a function of CAPE. However, this is a very tentative hypothesis at best, and more studies are needed to confirm or refute it. It is anticipated that NWS forecasters in the future will need to deal routinely with lightning in a more rigorous or quantitative way, e.g., in terms of flash density. Toward that end, a more extensive lightning climatology, one that includes the probability of occurrence of a various flash rates or densities for a given size area at a given time of day and year, would be very helpful. A climatology of that type, based on 40 x 40 km grid boxes, has been developed by Bothwell (2005) for use by forecasters at the NWS Storm Prediction Center in Norman, OK; perhaps it
3

REFERENCES could be made available to NWS field forecasters as well. Bothwell, P.D., 2005: Development of an
operational statistical scheme to predict the location and intensity of lightning. Preprints, Conference on Meteorological Applications of Lightning Data, Atlanta, GA, Amer. Meteor. Soc., 4.2.
Also, AWIPS could be enhanced to give information on the lightning display beyond simply the positive and negative flash count. It would be straightforward to calculate the flash density from the lightning count, time interval, and area of the display panel. A grid of flash density could be created for each hour, or perhaps more frequently. As a start, Table 3 shows the relation between selected flash densities and the AWIPS flash count for displays at various scales. Such a table might help forecasters think in terms of flash density as well as flash count. For a given flash density, the equivalent AWIPS flash count varies with the zoom factor by several orders of magnitude; thus the scale for computing flash density is important to consider.
Magsig, M.A. and E.M. Page, 2001. Weather event simulator implementation and future development. Preprints, 19th Conference on Interactive Information Processing Systems, Long Beach, CA, Amer. Meteor. Soc., 12.9. Shafer, P.E. and H.E. Fuelberg, 2005: A statistical procedure to forecast the daily amount of warm season lightning in south Florida. Preprints, Conference on Meteorological Applications of Lightning Data, Atlanta, GA, Amer. Meteor. Soc., P1.16.
ACKNOWLEDGEMENTS Sharp, D.W., 2005: Operational applications of lightning data at WFO Melbourne, FL: A 15-year retrospective. Preprints, Conference on Meteorological Applications of Lightning Data, Atlanta, GA, Amer. Meteor. Soc., 1.1.
Thanks are extended to Heather Hauser of the Scientific Services Division of NWS Eastern Region Headquarters, for her helpful reviews and constructive criticism of this paper. Thanks are also due to NWS student volunteers Valerie Meola, Paul Loikith and Joshua Cuzzone for their help in obtaining the lightning flash counts.
Zajac, B.A. and S.A. Rutledge, 2001: Cloud-to-ground lightning activity in the contiguous United States from 1995 to 1999. Monthly Weather Review, 129, 999 –1019.
4

Table 1. Areas used for lightning flash counts during summers 2004 and 2005, or 154 days. (June 2005 is missing). Area ID’s correspond to those in Fig. 2. No. "big days" Minimum no. of Area Area Description Approximate Total Flashes containing 50 % flashes on a ID Size (sq km) of total flashes "big day" a1 Philadelphia, Pa. (PHL) 16,360 76,400 6 4446 a2 Washington, D.C. (DCA) 16,360 96,074 7 5058 a3 Wallops Island, Va. (WAL) 16,360 62,387 8 3072 a4 Richmond, Va. (RIC) 16,360 148,631 9 4861 a5 Roanoke, Va. (RNK) 16,360 54,818 9 1558 a6 Raleigh, NC (RDU) 16,360 103,945 7 4387 b1 NWS-PHI Area 66,172 287,206 8 15,613 c1 Mid-Atlantic 824,740 2,990,554 24 40,098 d1 Cluster Area 512,660 n/a e1 Cluster Size 3,262 n/a Table 2. Percent of hours exceeding the given number of hourly flashes at the “greater metro” scale (areas “a1” to “a6” in Fig. 2), or approximately 16,000 sq km. Based on 22,176 total hours (154 days x 24 hr/day x 6 areas) and 3047 hours with lightning during summers 2004 and 2005. Flash # Hours Equivalent Flash Rate Percent of Exceeding Cases relative to Threshold Exceeding (flashes per 100 sq km ---------------------------------------------------------------- In Freq. Bin Threshold per 5 minutes) All Hours Lightning Hours > 2 2859 > 0.0010 12.9 93.8 > 5 2523 > 0.0025 11.4 82.8 > 10 2216 > 0.0051 10.0 72.7 > 20 1870 > 0.010 8.4 61.4 > 50 1369 > 0.025 6.2 44.9 > 100 977 > 0.051 4.4 32.1 > 200 626 > 0.10 2.8 20.5 > 500 259 > 0.26 1.2 8.5 >1000 122 > 0.51 0.55 4.0 >2000 37 > 1.2 0.17 1.2 >5000 3 > 2.5 0.01 0.1 Table 3. AWIPS 5-minute CG lightning flash counts corresponding to selected flash densities (columns) and zoom factors (rows) at the WFO display scale (approximately 221,697 sq km). Flashes are assumed to be distributed evenly across the AWIPS display area. Equivalent flash count for the given mean Flash Density (Flashes per 5 minutes per 100 sq km) Scale Map Area* ----------------------------------------------------------------------------- Zoom (km) (sq km) 0.1 0.25 0.5 1.0 2.5 5.0 10.0 x1 459 221,697 222 554 1108 2217 5542 11,085 22,170 x2 325 110,825 111 277 554 1108 2771 5541 11,083 x3 229 55,189 55 138 276 552 1380 2759 5519 x4 162 27,702 28 69 139 277 693 1385 2770 x5 114 13,794 14 34 69 138 345 690 1379 x6 72 5,443 5 14 27 54 136 272 544 x7 45 2,173 2 5 11 22 54 109 217 x8 28 857 1 2 4 9 21 43 86
* The display area is not precisely square.
5

Fig. 1. Examples of CG lightning displays on AWIPS. The upper-left panel is lightning for a 5-minute period plotted over radar base reflectivity for the NWS Mount Holly forecast area. Lower left is 15-minute lightning over northern Delaware and southwest New Jersey. The right-hand panel is one-hour lightning over the mid-Atlantic region.
6

Fig. 2. Regions used for hourly lightning counts. Boxes a1 to a6 are centered on metropolitan areas PHL, DCA, WAL, RIC, RNK and RDU, respectively. Box b1 approximates the NWS-PHI forecast area. Box c1 is the entire “Mid-Atlantic” region. Box d1 is the area where lightning clusters were examined. Box e1 is the area size used to measure flash density within individual clusters. For those familiar with AWIPS, area c1 is the “State” scale at NWS-PHI, area “e1” is the “State” scale at maximum zoom, and areas “a1” to “a6” are the “Regional” scale at maximum zoom.
7

Fig 3. Example of EDAS CAPE (shading; J kg-1) and 850mb wind plot (wind barbs; kts) over southeast VA and northeast NC, valid 00 UTC 12 June 2004, from the ARL-READY web site. The center of the map area corresponds to the center of the lightning cluster, shown by a small star on the NC-VA border. In this case, a representative maximum CAPE for the cluster was judged to be around 1500 J kg-1.
8
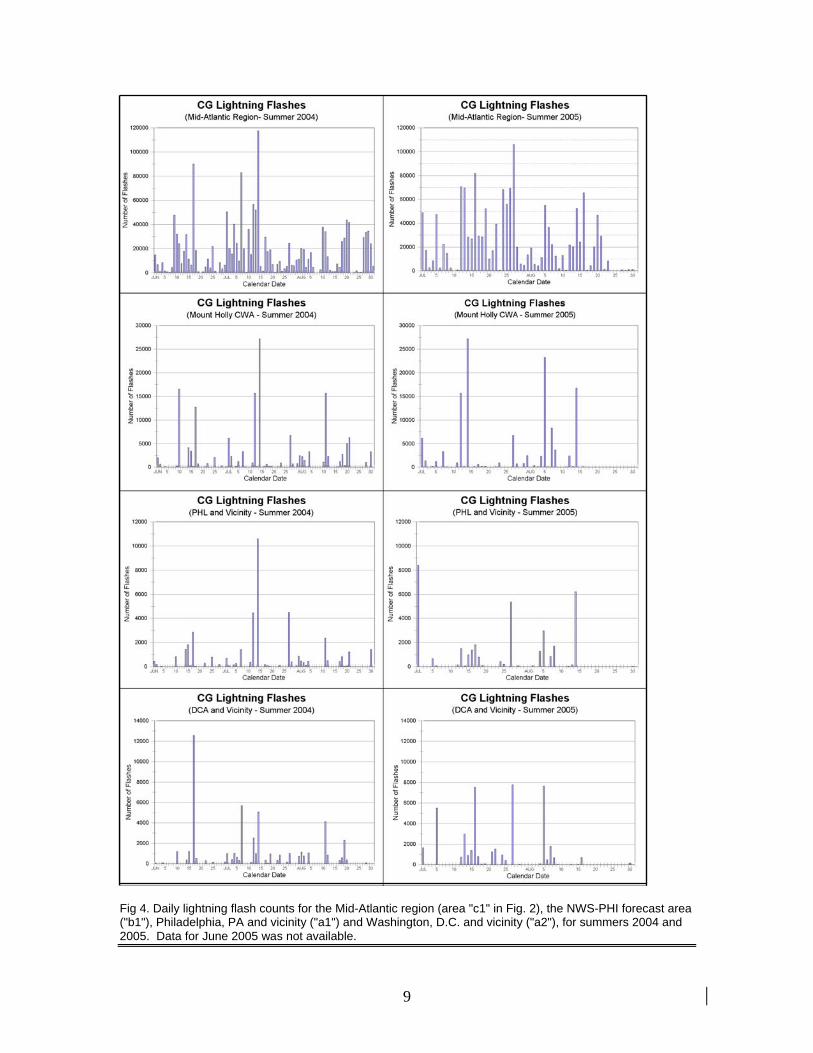
Fig 4. Daily lightning flash counts for the Mid-Atlantic region (area "c1" in Fig. 2), the NWS-PHI forecast area ("b1"), Philadelphia, PA and vicinity ("a1") and Washington, D.C. and vicinity ("a2"), for summers 2004 and 2005. Data for June 2005 was not available.
9

Fig. 5. Diurnal distribution of lightning for the Mid-Atlantic region for summers 2004 and 2005.
10

Fig 6. Location and number of lightning clusters during June – August 2004-2005, plotted on a 1-deg latitude by 1-deg longitude grid.
11

Fig 7. Scatter plot showing the number of flashes within the most intense lightning cluster for a given hour, vs. the maximum analyzed CAPE in the vicinity of that cluster (see text and example in figure 3). The plot represents about 300 clusters observed during the summers of 2004 and 2005.
12

13