Embed Size (px)
Citation preview

Toward Full Elasticity in Distributed Static Analysis
MSR-TR-2015-88
Diego GarbervetskyEdgardo Zoppi
Univesidad de BuenosAires
Thomas Ball Benjamin Livshits
Microsoft Research
Abstract
In this paper we present the design and implementa-tion of a distributed static analysis framework that isdesigned to scale with the size of the input. Our ap-proach is based on the actor programming model andis deployed in the cloud. Our reliance on a cloud clusterprovides a degree of elasticity for CPU, memory, andstorage resources. To demonstrate the potential of ourtechnique, we show how a typical call graph analysiscan be implemented in a distributed setting. The visionthat motivates this work is that every large-scale soft-ware repository such as GitHub, BitBucket, or VisualStudio Online will be able to perform static analysis ona very large scale.
We experimentally validate our distributed analysisapproach using a combination of both synthetic and realbenchmarks. To show scalability, we demonstrate howthe analysis presented in this paper is able to handleinputs that are almost 10 million LOC in size, with-out running out of memory. Our results show that theanalysis scales well in terms of memory pressure inde-pendently of the input size, as we add more VMs. Asthe number of analysis VMs increases, we observe thatthe analysis time generally improves as well. Lastly, wedemonstrate that querying the results can be performedwith a median latency of 15 ms.
1. Introduction
In the last decade, we have seen a number of attemptsto build increasingly more scalable whole program anal-ysis tools. Advances in scalability have often come fromimprovements in underlying solvers such as SAT andDatalog solvers as well as sometimes improvements tothe data representation in the analysis itself; we haveseen much of this progress in the space of pointer anal-ysis [5, 19, 20, 28, 30, 31, 44].
Limits of scalability: A typical whole-program anal-ysis is designed to run on a single machine, primar-ily storing its data structures in memory. Despite the
intentions of the analysis designer, this approach ulti-mately leads to scalability issues as the input programsize increases, with even the most lightweight of anal-yses. Indeed, if the analysis is stateful, i.e. it needs tostore data about the program as it progresses, typically,in memory, eventually this approach ceases to scale tovery large inputs. Memory is frequently a bottleneckeven if the processing time is tolerable. We believe thatthe need to develop scalable program analyses is nowgreater than ever. This is because we see a shift towarddeveloping large projects in centralized source reposito-ries such as GitHub, which opens up opportunities forcreating powerful and scalable analysis backends thatgo beyond what any developer’s machine may be ableto accomplish.
Distributed analysis: In this paper we explore analternative approach to build distributed static analysistools, designed to scale with the input size, with the goalof achieving full elasticity. In other words, no matterhow big the input program is, given enough computingresources, i.e. machines to execute on, the analysis willcomplete in a reasonable time. Our analysis architectureassumes that the static analysis runs in the cloud, whichgives us elasticity for CPU and memory resources, aswell as storage. More specifically, in the context of large-scale code repositories, even code understanding andcode browsing tasks are made challenging by the size ofthe code base. We have seen the emergence of scalableonline code browsers such as Mozilla’s LXR [33]. Thesetools often operate in batch mode, and thus have ahard time keeping up with a rapidly changing coderepository in real time, especially for repositories withmany simultaneous contributors. In this paper we aimto show how a more nimble system can be designed,where analysis results are largely stored in memory,spread across multiple machines. This design results inmore responsive queries to obtain analysis results.
1.1 Motivation: Static Analysis Backend
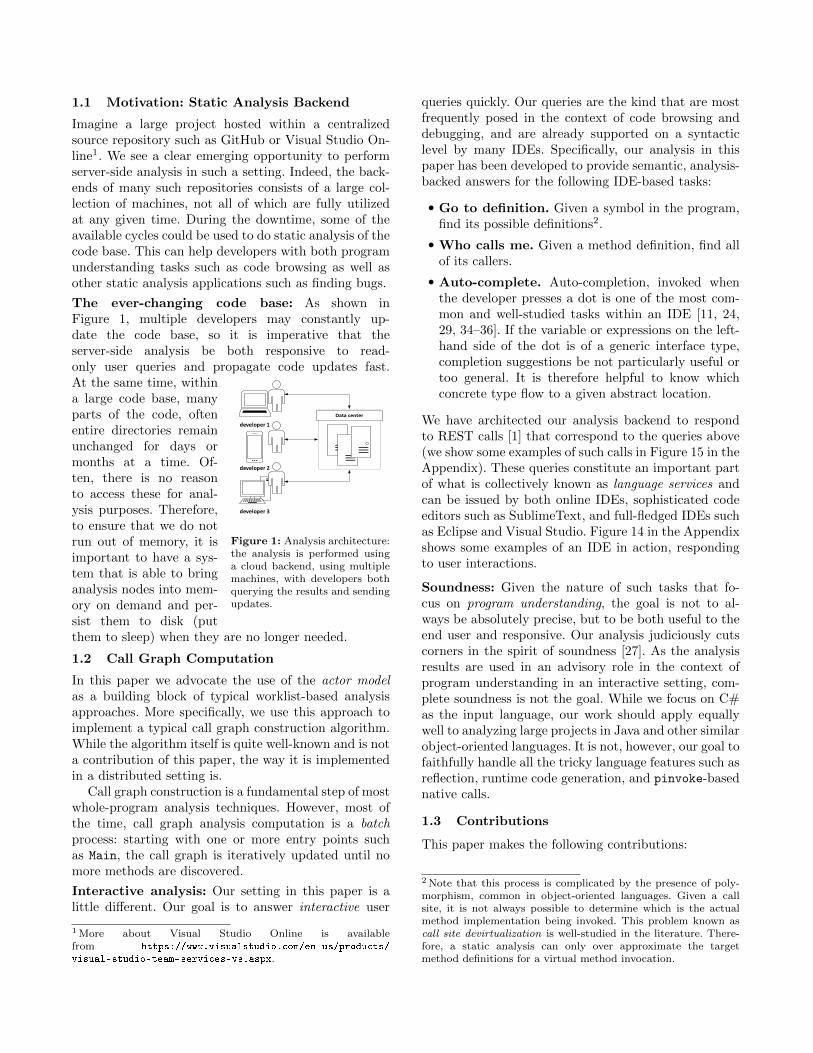
Imagine a large project hosted within a centralizedsource repository such as GitHub or Visual Studio On-line1. We see a clear emerging opportunity to performserver-side analysis in such a setting. Indeed, the back-ends of many such repositories consists of a large col-lection of machines, not all of which are fully utilizedat any given time. During the downtime, some of theavailable cycles could be used to do static analysis of thecode base. This can help developers with both programunderstanding tasks such as code browsing as well asother static analysis applications such as finding bugs.
The ever-changing code base: As shown inFigure 1, multiple developers may constantly up-date the code base, so it is imperative that theserver-side analysis be both responsive to read-only user queries and propagate code updates fast.
developer 3
developer 1
developer 2
Figure 1: Analysis architecture:the analysis is performed usinga cloud backend, using multiplemachines, with developers bothquerying the results and sendingupdates.
At the same time, withina large code base, manyparts of the code, oftenentire directories remainunchanged for days ormonths at a time. Of-ten, there is no reasonto access these for anal-ysis purposes. Therefore,to ensure that we do notrun out of memory, it isimportant to have a sys-tem that is able to bringanalysis nodes into mem-ory on demand and per-sist them to disk (putthem to sleep) when they are no longer needed.
1.2 Call Graph Computation
In this paper we advocate the use of the actor modelas a building block of typical worklist-based analysisapproaches. More specifically, we use this approach toimplement a typical call graph construction algorithm.While the algorithm itself is quite well-known and is nota contribution of this paper, the way it is implementedin a distributed setting is.
Call graph construction is a fundamental step of mostwhole-program analysis techniques. However, most ofthe time, call graph analysis computation is a batchprocess: starting with one or more entry points suchas Main, the call graph is iteratively updated until nomore methods are discovered.
Interactive analysis: Our setting in this paper is alittle different. Our goal is to answer interactive user
1 More about Visual Studio Online is availablefrom https://www.visualstudio.com/en-us/products/
visual-studio-team-services-vs.aspx.
queries quickly. Our queries are the kind that are mostfrequently posed in the context of code browsing anddebugging, and are already supported on a syntacticlevel by many IDEs. Specifically, our analysis in thispaper has been developed to provide semantic, analysis-backed answers for the following IDE-based tasks:
• Go to definition. Given a symbol in the program,find its possible definitions2.
• Who calls me. Given a method definition, find allof its callers.
• Auto-complete. Auto-completion, invoked whenthe developer presses a dot is one of the most com-mon and well-studied tasks within an IDE [11, 24,29, 34–36]. If the variable or expressions on the left-hand side of the dot is of a generic interface type,completion suggestions be not particularly useful ortoo general. It is therefore helpful to know whichconcrete type flow to a given abstract location.
We have architected our analysis backend to respondto REST calls [1] that correspond to the queries above(we show some examples of such calls in Figure 15 in theAppendix). These queries constitute an important partof what is collectively known as language services andcan be issued by both online IDEs, sophisticated codeeditors such as SublimeText, and full-fledged IDEs suchas Eclipse and Visual Studio. Figure 14 in the Appendixshows some examples of an IDE in action, respondingto user interactions.
Soundness: Given the nature of such tasks that fo-cus on program understanding, the goal is not to al-ways be absolutely precise, but to be both useful to theend user and responsive. Our analysis judiciously cutscorners in the spirit of soundness [27]. As the analysisresults are used in an advisory role in the context ofprogram understanding in an interactive setting, com-plete soundness is not the goal. While we focus on C#as the input language, our work should apply equallywell to analyzing large projects in Java and other similarobject-oriented languages. It is not, however, our goal tofaithfully handle all the tricky language features such asreflection, runtime code generation, and pinvoke-basednative calls.
1.3 Contributions
This paper makes the following contributions:
2 Note that this process is complicated by the presence of poly-morphism, common in object-oriented languages. Given a callsite, it is not always possible to determine which is the actualmethod implementation being invoked. This problem known ascall site devirtualization is well-studied in the literature. There-fore, a static analysis can only over approximate the targetmethod definitions for a virtual method invocation.
• We propose a distributed static analysis approachand show how to apply it to call graph construc-tion for answering program understanding and codebrowsing queries.
• We describe how our analysis framework is imple-mented on top of the Orleans distributed program-ming platform and is deployed on legacy hardwarein the cloud using Microsoft Azure.
• We experimentally demonstrate the scalability of ourtechnique using a range of synthetic and real bench-marks. The results show that our analysis scales wellin terms of memory pressure independently of the in-put size, as we add more machines. Elapsed analysistimes can vary based on project complexity.
Despite using stock hardware and incurring a non-trivial communication overhead, we scale to inputscontaining 10 million LOC, and our processing timefor some benchmarks of close to 1 million LOC isabout 5 minutes, excluding compilation time. Whilethe communication overhead can become a bottle-neck, we show that as the number of machines in-creases (up to 64), the analysis time generally drops.Lastly, we demonstrate that querying the results canbe performed with an acceptable median latencyof 15 ms.
1.4 Paper Organization
The rest of the paper is organized as follows. Section 2provides a high-level overview of our distributed anal-ysis approach. Section 3 describes the specifics of thecall graph construction algorithm. Section 4 discussessome of the implementation details of our system ontop of the Orleans distributed programming framework.Section 5 presents our experimental evaluation. Finally,Sections 6 and 7 describe related work and conclude.The Appendix contains extra screen-shots and figures.
2. Overview
Given the architecture shown in Figure 1, our goal is tohave the analysis backend respond to queries quickly,independently of the input size. Of course, we also needto make sure that the backend does not run out ofmemory or timeout in some unpredictable way. Ourrequirements force us to rethink some of the typicalassumptions of whole-program analysis.
2.1 Analysis Design Principles
We use a distributed actor model [4] as the basis ofour distributed static analysis engine. For a programwritten in an object-oriented language such as Java orC#, a natural fit is to have an actor per method withinthe program3. These actors are responsible for receiv-
3 We could choose to have an actor per class in a program, orother well-defined program entity.
1: while |MQ| > 0 do2: 〈a,m〉 := MQ.choose()3: v := UNPACK (m) tVALUE [a]4: if v v VALUE [a] then5: continue6: end if7: v′ := TF [a](v)8: if v v v′ then9: U := DELTA(v, v′)
10: for each u in U do11: MQ := MQ ∪ PACK (a, u)12: end for13: VALUE [a] := v′
14: end if15: end while
Figure 2: Distributed worklist algorithm.
ing messages from other actors, processing them usinglocal state (a representation of the method body, forinstance), and sending information to other methodsthat depend on it. For example, for a call graph con-struction analysis, actors representing individual meth-ods may send messages to actors for their callers andcallees. Our analysis design adhere to the following dis-tilled principles.
• Minimal in-memory state per actor. We wantto “pack” as many actors per machine as possi-ble without creating undue memory pressure, whichcould lead to swapping, etc.
• Design for lightweight serialization. We havedesigned our analysis so that the updates sent fromone actor to another are generally small and easilyserialized. There is minimal sharing among actors,as actor holds on to its local state and occasionallysends small updates to others. The same principleapplies to persistent per-actor state as well. Even ifthe in-memory state for an active actor is sizeable,we only serialize the bare minimum to disk, beforethe actor is put to sleep. This can happen when theactor runtime decides to page an actor out due tomemory pressure or lack of recent use.
• State can be recomputed on demand. In a dis-tributed setting, we have to face the reality thatprocesses may die due to hardware and/or softwarefaults. It is therefore imperative to be able to recoverin case of state loss. While it is possible to commit lo-cal state to persistent store, we eschew the overheadof such an approach and instead choose to recomputeper-node state on demand.
• Locality optimizations to minimize communi-cation. We attempt to place related actors togetheron the same machine. In the case of a call graph anal-ysis, this often means that entire strongly connectedcomponents co-exist on the same physical box, whichminimizes the number of messages that we actuallyneed to dispatch across the network.
2.2 Distributed Worklist Algorithm
We now present a high-level view of a distributed anal-ysis problem as a pair 〈A,L〉 where:
• A is a set of actors distributed in a network.• 〈L,v,t〉 is a complete semi-lattice of finite height.
Each actor a ∈ A has the following associated functions:
• VALUE [a] = v ∈ L is the local state of actor a;• TF [a](v) = v′ ∈ L is the transfer function for
the local computation performed within actor a. Weassume TF is monotone;
The following helper functions are for communicatingstate changes among actors:
• DELTA(v, v′) computes a set U of (global) updatesrequired when switching from local state v to v′;
• PACK (a, u) is a function that given an update atactor a produces one or several messages to commu-nicate to other actors.
• UNPACK (m) is a function that unpacks a messageand returns a value in L.
Figure 2 shows the pseudocode for a distributed worklistalgorithm. The algorithm makes use of a global messagequeue, denoted as MQ4. The queue is initialized with aset of starting messages that will depend on the actualanalysis instance.
2.3 Termination and Non-Determinism
Let H denote the (finite) height of semi-lattice L andlet N = |A|. Consider iterations through the loop online 1. Let’s consider two sets of sequences of iterations,I1 are iterations that lead to a value increase on line 7and I2 are those that do not.
We can have at most H × N iterations in I1 giventhe finite size of the lattice. For iterations in I2, thesize of MQ decreases because at least one message isconsumed but it does not generate other messages. Weconsider two possibilities:
• Starting from some iteration i, we only have itera-tions in I2. This, however, means that on every it-eration the size of MQ decreases, until it eventuallybecomes empty.
• The other possibility is that we will have an infinitenumber of iterations in I1 . This is clearly impossiblebecause the size of I1 is bounded by H ×N .
It is important to emphasize the difference betweenthis distributed algorithm and a single-node worklistapproach. If a message is in flight, we do not wish the
4 Note that MQ is a mathematical abstraction: we do not actuallyuse a global message queue in our implementation. Conceptually,we can think of a (local) worklist maintained on a per-actor basis.Termination is achieved when all the worklists are empty.
program analysis to terminate. However, detecting theemptiness of MQ is not trivial, so in practice we musthave an effective means for detecting termination. Wemake use of an orchestrator mechanism for terminationdetection, as described in Section 4.5.
While the algorithm in Figure 2 reaches a fixpointindependently of the arrival order of messages, it isnatural to ask whether that is the only fixpoint thatcan be reached. Given that TF [a] is monotone and Lis of finite height the uniqueness of least fixpoint isguaranteed [13, 23].
3. Call Graph Analysis
In this section we present an instantiation of the generalframework described in the previous section for comput-ing call graphs. Our analysis is a distributed interproce-dural and incremental inclusion-based static analysis in-spired by the Variable Type Analysis (VTA) presentedin [41]. This flow-insensitive analysis computes the set ofpotential types for each object reference (variable, field,etc.) by solving a system of inclusion constraints. Be-cause it propagates type constraints from object alloca-tion sites to their uses, this kind of analysis is sometimesreferred to as concrete type analysis.
3.1 Program Representation
Propagation graphs: At the method level, theinclusion-based analysis is implemented using a datastructure we call a propagation graph (PG) [41]. A PGis a directed graph used to “push” type information tofollow data flow in the program, as described by analy-sis rules. Our analysis naturally lands itself to incremen-tality. A typical change in the program would requireoften minimal recomputation within the modified codefragment as well as propagation of that information toits “neighbors”. Propagation graphs support incremen-tal updates since the propagation of information is trig-gered only when a new type reaches a node.
Terminology: More formally, let PG = 〈R,E〉 whereR denotes a set of abstract locations in the method (suchas variables and fields) and E refers to a set of edgesbetween them.
An edge e = (v1, v2) ∈ E connects nodes in thePG to model the potential flow of type informationfrom v1 to v2. Essentially, an edge represents a rulestating that Types(v2) ⊇ Types(v1) (e.g, v2 = v1). Tomodel interprocedural interaction, the PG also includesspecial nodes for representing method invocations andreturn values (rv). Finally, I ⊆ R denotes the set ofinvocations. Let T be the set of all possible types,dType contains declared types (compile-time types) forabstract locations and Types denotes concrete typesinferred by our analysis.
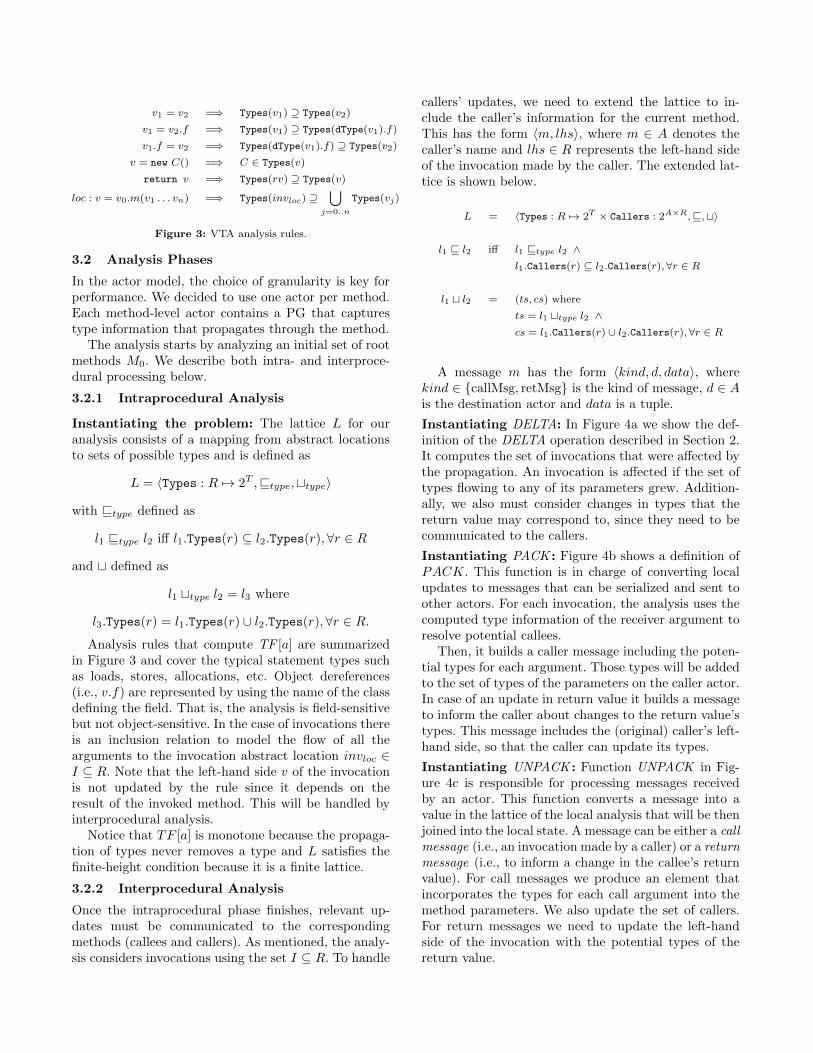
v1 = v2 =⇒ Types(v1) ⊇ Types(v2)
v1 = v2.f =⇒ Types(v1) ⊇ Types(dType(v1).f)
v1.f = v2 =⇒ Types(dType(v1).f) ⊇ Types(v2)
v = new C() =⇒ C ∈ Types(v)
return v =⇒ Types(rv) ⊇ Types(v)
loc : v = v0.m(v1 . . . vn) =⇒ Types(invloc) ⊇⋃
j=0..n
Types(vj)
Figure 3: VTA analysis rules.
3.2 Analysis Phases
In the actor model, the choice of granularity is key forperformance. We decided to use one actor per method.Each method-level actor contains a PG that capturestype information that propagates through the method.
The analysis starts by analyzing an initial set of rootmethods M0. We describe both intra- and interproce-dural processing below.
3.2.1 Intraprocedural Analysis
Instantiating the problem: The lattice L for ouranalysis consists of a mapping from abstract locationsto sets of possible types and is defined as
L = 〈Types : R 7→ 2T ,vtype,ttype〉
with vtype defined as
l1 vtype l2 iff l1.Types(r) ⊆ l2.Types(r),∀r ∈ R
and t defined as
l1 ttype l2 = l3 where
l3.Types(r) = l1.Types(r) ∪ l2.Types(r),∀r ∈ R.
Analysis rules that compute TF [a] are summarizedin Figure 3 and cover the typical statement types suchas loads, stores, allocations, etc. Object dereferences(i.e., v.f) are represented by using the name of the classdefining the field. That is, the analysis is field-sensitivebut not object-sensitive. In the case of invocations thereis an inclusion relation to model the flow of all thearguments to the invocation abstract location invloc ∈I ⊆ R. Note that the left-hand side v of the invocationis not updated by the rule since it depends on theresult of the invoked method. This will be handled byinterprocedural analysis.
Notice that TF [a] is monotone because the propaga-tion of types never removes a type and L satisfies thefinite-height condition because it is a finite lattice.
3.2.2 Interprocedural Analysis
Once the intraprocedural phase finishes, relevant up-dates must be communicated to the correspondingmethods (callees and callers). As mentioned, the analy-sis considers invocations using the set I ⊆ R. To handle
callers’ updates, we need to extend the lattice to in-clude the caller’s information for the current method.This has the form 〈m, lhs〉, where m ∈ A denotes thecaller’s name and lhs ∈ R represents the left-hand sideof the invocation made by the caller. The extended lat-tice is shown below.
L = 〈Types : R 7→ 2T × Callers : 2A×R,v,t〉
l1 v l2 iff l1 vtype l2 ∧l1.Callers(r) ⊆ l2.Callers(r), ∀r ∈ R
l1 t l2 = (ts, cs) where
ts = l1 ttype l2 ∧cs = l1.Callers(r) ∪ l2.Callers(r), ∀r ∈ R
A message m has the form 〈kind, d, data〉, wherekind ∈ {callMsg, retMsg} is the kind of message, d ∈ Ais the destination actor and data is a tuple.
Instantiating DELTA: In Figure 4a we show the def-inition of the DELTA operation described in Section 2.It computes the set of invocations that were affected bythe propagation. An invocation is affected if the set oftypes flowing to any of its parameters grew. Addition-ally, we also must consider changes in types that thereturn value may correspond to, since they need to becommunicated to the callers.
Instantiating PACK : Figure 4b shows a definition ofPACK. This function is in charge of converting localupdates to messages that can be serialized and sent toother actors. For each invocation, the analysis uses thecomputed type information of the receiver argument toresolve potential callees.
Then, it builds a caller message including the poten-tial types for each argument. Those types will be addedto the set of types of the parameters on the caller actor.In case of an update in return value it builds a messageto inform the caller about changes to the return value’stypes. This message includes the (original) caller’s left-hand side, so that the caller can update its types.
Instantiating UNPACK : Function UNPACK in Fig-ure 4c is responsible for processing messages receivedby an actor. This function converts a message into avalue in the lattice of the local analysis that will be thenjoined into the local state. A message can be either a callmessage (i.e., an invocation made by a caller) or a returnmessage (i.e., to inform a change in the callee’s returnvalue). For call messages we produce an element thatincorporates the types for each call argument into themethod parameters. We also update the set of callers.For return messages we need to update the left-handside of the invocation with the potential types of thereturn value.
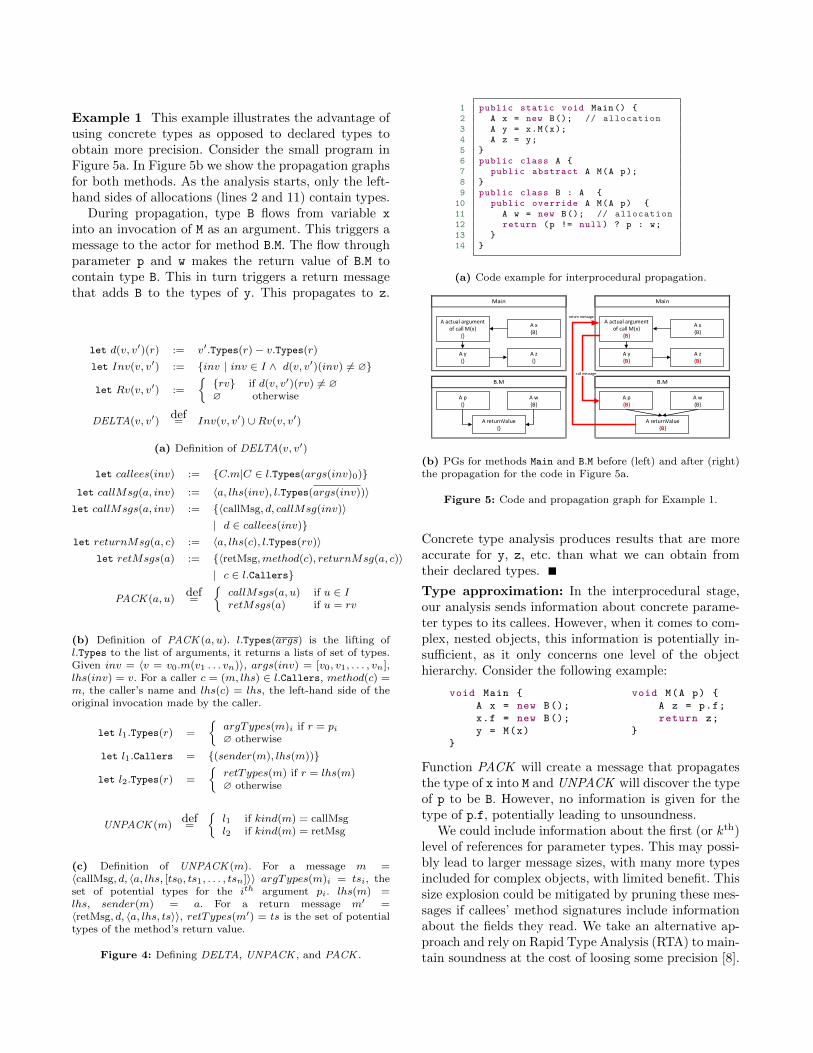
Example 1 This example illustrates the advantage ofusing concrete types as opposed to declared types toobtain more precision. Consider the small program inFigure 5a. In Figure 5b we show the propagation graphsfor both methods. As the analysis starts, only the left-hand sides of allocations (lines 2 and 11) contain types.
During propagation, type B flows from variable x
into an invocation of M as an argument. This triggers amessage to the actor for method B.M. The flow throughparameter p and w makes the return value of B.M tocontain type B. This in turn triggers a return messagethat adds B to the types of y. This propagates to z.
let d(v, v′)(r) := v′.Types(r)− v.Types(r)
let Inv(v, v′) := {inv | inv ∈ I ∧ d(v, v′)(inv) 6= ∅}
let Rv(v, v′) :=
{{rv} if d(v, v′)(rv) 6= ∅∅ otherwise
DELTA(v, v′)def= Inv(v, v′) ∪Rv(v, v′)
(a) Definition of DELTA(v, v′)
let callees(inv) := {C.m|C ∈ l.Types(args(inv)0)}
let callMsg(a, inv) := 〈a, lhs(inv), l.Types(args(inv))〉let callMsgs(a, inv) := {〈callMsg, d, callMsg(inv)〉
| d ∈ callees(inv)}let returnMsg(a, c) := 〈a, lhs(c), l.Types(rv)〉
let retMsgs(a) := {〈retMsg,method(c), returnMsg(a, c)〉| c ∈ l.Callers}
PACK (a, u)def=
{callMsgs(a, u) if u ∈ IretMsgs(a) if u = rv
(b) Definition of PACK (a, u). l.Types(args) is the lifting ofl.Types to the list of arguments, it returns a lists of set of types.Given inv = 〈v = v0.m(v1 . . . vn)〉, args(inv) = [v0, v1, . . . , vn],lhs(inv) = v. For a caller c = (m, lhs) ∈ l.Callers, method(c) =m, the caller’s name and lhs(c) = lhs, the left-hand side of theoriginal invocation made by the caller.
let l1.Types(r) =
{argTypes(m)i if r = pi∅ otherwise
let l1.Callers = {(sender(m), lhs(m))}
let l2.Types(r) =
{retTypes(m) if r = lhs(m)∅ otherwise
UNPACK (m)def=
{l1 if kind(m) = callMsgl2 if kind(m) = retMsg
(c) Definition of UNPACK (m). For a message m =〈callMsg, d, 〈a, lhs, [ts0, ts1, . . . , tsn]〉〉 argTypes(m)i = tsi, theset of potential types for the ith argument pi. lhs(m) =lhs, sender(m) = a. For a return message m′ =〈retMsg, d, 〈a, lhs, ts〉〉, retTypes(m′) = ts is the set of potentialtypes of the method’s return value.
Figure 4: Defining DELTA, UNPACK , and PACK .
1 public static void Main() {2 A x = new B(); // allocation3 A y = x.M(x);4 A z = y;5 }6 public class A {7 public abstract A M(A p);8 }9 public class B : A {10 public override A M(A p) {11 A w = new B(); // allocation12 return (p != null) ? p : w;13 }14 }
(a) Code example for interprocedural propagation.
A actual argumentof call M(x)
{}
A y{}
A z{}
A x{B}
A p{}
A returnValue{}
A w{B}
A actual argumentof call M(x)
{B}
A y{B}
A z{B}
A x{B}
A p{B}
A returnValue{B}
A w{B}
call message
return message
(b) PGs for methods Main and B.M before (left) and after (right)the propagation for the code in Figure 5a.
Figure 5: Code and propagation graph for Example 1.
Concrete type analysis produces results that are moreaccurate for y, z, etc. than what we can obtain fromtheir declared types.
Type approximation: In the interprocedural stage,our analysis sends information about concrete parame-ter types to its callees. However, when it comes to com-plex, nested objects, this information is potentially in-sufficient, as it only concerns one level of the objecthierarchy. Consider the following example:
void Main { void M(A p) {
A x = new B(); A z = p.f;
x.f = new B(); return z;
y = M(x) }
}
Function PACK will create a message that propagatesthe type of x into M and UNPACK will discover the typeof p to be B. However, no information is given for thetype of p.f, potentially leading to unsoundness.
We could include information about the first (or kth)level of references for parameter types. This may possi-bly lead to larger message sizes, with many more typesincluded for complex objects, with limited benefit. Thissize explosion could be mitigated by pruning these mes-sages if callees’ method signatures include informationabout the fields they read. We take an alternative ap-proach and rely on Rapid Type Analysis (RTA) to main-tain soundness at the cost of loosing some precision [8].
We use the type of p.f given by RTA; when RTAprovides no useful information, we fall back on declaredtypes. As usual, this kind of relaxation can lead toimprecision that may be undesirable, i.e. too manyspurious suggestions may appear for auto-complete. Wedid not observe it, an acceptable tradeoff would beto choose an under-approximation instead of an over-approximation here.
Other uses of the analysis framework: The dis-tributed algorithm in Figure 2 can be instantiatedfor other program analyses that follow the same de-sign principle. For instance, consider an inclusion-basedanalysis like Andersen’s points-to [7]. A possible instan-tiation may be as follows: (1) Each node represents amethod; (2) The transfer function implements Ander-sen’s inclusion rules locally and, in case there is a changein an argument of a method invocation, produces an up-date message to be sent to the potential callees; (3) Sim-ilarly, by just replacing the inclusion rules with uni-fication rules in the transfer function, we can turn itinto a unification based points-to analysis like Steens-gaard’s [40]. We envision future work where our dis-tributed backend would be combined with a naturalfront-end for this kind of analysis that uses Datalog,as previously proposed for single-machine analysis [22].
4. Implementation
We implemented a prototype of our distributed ap-proach5 to analyze large-scale projects written in C#.This prototype relies on Roslyn [32], a compiler frame-work for analyzing C# code and the Orleans frame-work [10], an implementation of a distributed actormodel that can be deployed in the cloud. Althoughother deployment options such AWS are possible, forthis paper we used Azure as a platform for running ourexperiments.
4.1 Orleans and the Actor Model
Orleans [10] is a framework designed to simplify the de-velopment of distributed applications. It is based on theabstraction of virtual actors. In Orleans terminology,these actors are called grains. Orleans solves a num-ber of the complex distributed systems problems, suchas deciding where — on which machine — to allocatea given actor, sending messages across machines, etc.,largely liberating developers from dealing with thoseconcerns. At the same time, the Orleans runtime is de-signed to enable applications that have high degrees ofresponsiveness and scalability.
Grains are the basic building blocks of Orleans appli-cations and are the units of isolation and distribution.
5 Source code implementing the analysis in this paper is availableon GitHub. We are planning to provide a link in the final, de-anonymized version of this paper.
Project grain p1
Solution grain
Project grain p2
Method grain m1
Method grain m2
Method grain m3
Method grain m4
Method grain m5
Method grain m6
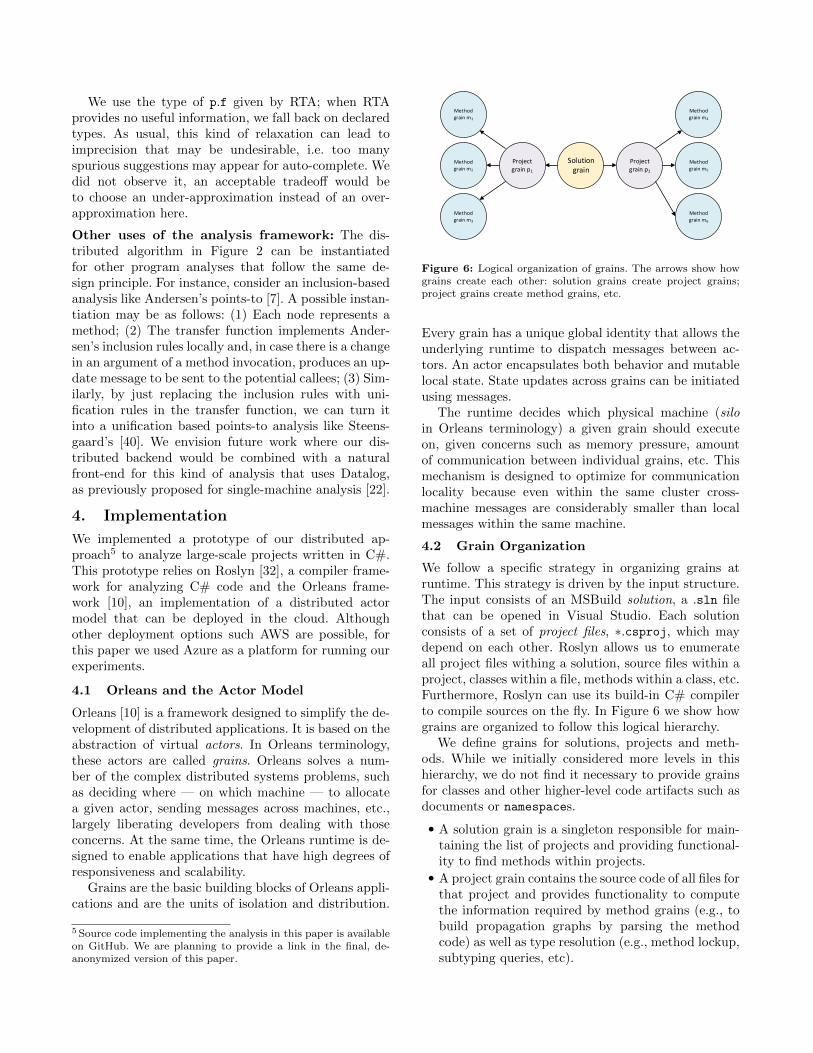
Figure 6: Logical organization of grains. The arrows show howgrains create each other: solution grains create project grains;project grains create method grains, etc.
Every grain has a unique global identity that allows theunderlying runtime to dispatch messages between ac-tors. An actor encapsulates both behavior and mutablelocal state. State updates across grains can be initiatedusing messages.
The runtime decides which physical machine (siloin Orleans terminology) a given grain should executeon, given concerns such as memory pressure, amountof communication between individual grains, etc. Thismechanism is designed to optimize for communicationlocality because even within the same cluster cross-machine messages are considerably smaller than localmessages within the same machine.
4.2 Grain Organization
We follow a specific strategy in organizing grains atruntime. This strategy is driven by the input structure.The input consists of an MSBuild solution, a .sln filethat can be opened in Visual Studio. Each solutionconsists of a set of project files, ∗.csproj, which maydepend on each other. Roslyn allows us to enumerateall project files withing a solution, source files within aproject, classes within a file, methods within a class, etc.Furthermore, Roslyn can use its build-in C# compilerto compile sources on the fly. In Figure 6 we show howgrains are organized to follow this logical hierarchy.
We define grains for solutions, projects and meth-ods. While we initially considered more levels in thishierarchy, we do not find it necessary to provide grainsfor classes and other higher-level code artifacts such asdocuments or namespaces.
• A solution grain is a singleton responsible for main-taining the list of projects and providing functional-ity to find methods within projects.
• A project grain contains the source code of all files forthat project and provides functionality to computethe information required by method grains (e.g., tobuild propagation graphs by parsing the methodcode) as well as type resolution (e.g., method lockup,subtyping queries, etc).
• The method grain is responsible for computing thelocal type propagation and resolve caller/calleesqueries. It stores type information for the abstractlocations in the method.
The hierarchical grain organization in Figure 6 allows usto minimize the amount of unnecessary IO. The solutiongrain reads the ∗.sln file from cloud storage; in ourimplementation we used Azure Files, but other formsof input that support file-like APIs such as GitHub orDropbox are also possible. Project grains read ∗.csprojfiles and also proceed to compile the sources containedin the project to get a Roslyn Compilation object.This information is only contained in the project grainto minimize duplication. To obtain information aboutthe rest of the project, method grains can consult theproject grain. We use caching to reduce the number ofmessages between grains.
Example 2 To illustrate persistent state for a typicalmethod grain, consider the example in Figure 5a. Thestate of both methods is as follows.
Method Main:
Callers = {}
Types = {(x,{B}), (y,{B}), (z,{B}), (3,{B})}
Method B.M:
Callers = {(A.Main, y)}
Types = {(p,{B}), (w,{B}), (returnValue,{B})}
This minimal state is easily serialized to disk if thegrains are ever deactivated by the Orleans runtime.
4.3 Orleans-based Implementation
Orleans is built on a cooperative multitasking model. Agrain activation operates in discrete units of work calledturns and finishes each execution unit before movingon to the next. A turn executes the computation tohandle requests from other grains or external clientsand to run closures at the resolution of a promise.While a system may execute many turns belonging todifferent activations in parallel, each activation alwaysexecutes its turns sequentially. Therefore, execution inan activation is always logically single-threaded.
Asynchronous programming: Orleans is deeplyintegrated with asynchronous programming in .NET,which involves the async/await programmingparadigm. Orleans takes care of serializing mes-sages and deserializing them on the side of the received.This is achieved by Orleans rewriting calls such as
Task <Effects > effects = await GetEffects(method );
to perform cross-machine calls: method is serialized andsent to the grain that executes GetEffects. The returnvalue effects is a promise for an eventual result. Note,however, that serializing a complex object such as amethod may be taxing for the network and is largely
unnecessary. We take care to ensure that we avoid doingso. A better approach here would be to call
string methodName = method.GetUniqueMethodName ();Effects effects = await GetEffects(methodName );
where GetUniqueMethodName returns a short string.Generally, we mostly pass around strings or lists ofstrings; other complex in-memory types are “reduced”to this simplified representation. Under the covers, thetransport layer may use JSON or another similar en-coding to transmit the data.
Fault tolerance: In addition to helping with dataseamless passing across machine boundaries, Orleanswill automatically attempt message delivery severaltimes before throwing an exception. Moreover, Orleansprovides APIs for recovery of a grain in case of a fail-ure. This allows us to find and request information fromthe corresponding project grain to build the method-level propagation graph. Similarly, project and solutiongrains can recover information from the file storage incase of a crash.
4.4 Distributed Analysis Challenges
Implementing a distributed system like ours is fraughtwith three fundamental challenges.
Reentrancy: Since the callgraph can have cycles, agrain can start a propagation which will in turn even-tually propagate to the original method. However, sinceOrleans uses turn-based concurrency this will create adeadlock. Even without recursion it is possible for amethod grain that is currently being processed to re-ceive another message (i.e. a return message).
Termination: In a distributed setting, detecting whenwe achieve termination is not so easy. This is in partbecause even if all the local worklists are empty, wemay have messages that are in flight or those that havebeen delayed.
Timeouts: In a manner similar to other turn-basedconcurrency systems (for instance, JavaScript in thebrowser), in order to detect potential failures and dead-locks, Orleans monitors the duration of calls to othergrains and terminates calls that it deems to be time-outs. This has a number of undesirable consequencessuch as exceptions that propagate throughout the sys-tem. Some program analysis tasks, such as compilinga project or creating a propagation graph for a longmethod, may exceed the timeout that Orleans imposes.
4.5 Addressing Analysis Challenges
Naıve solution #1: Given the built-in powerful fea-tures of Orleans, it is tempting to implement the mainworklist algorithm recursively, as shown in Figure 7.Note that Orleans will rewrite async calls such ascallee.ProcessMethodAsync() to communicate across
1 foreach (var r in roots) {2 var effects = await r.ProcessMethodAsync ();3 // ...4 }5 class MethodGrain {6 async Task <Effect > ProcessMethodAsync () {7 // process local state8 // ...9 foreach (var inv in this.Invocations) {10 var callees = this.ResolveCallees(inv);11 foreach (var c in callees) {12 var effects = [await] c.ProcessMethodAsync ();13 // ...14 }}}}
Figure 7: Naıve attempts #1 and #2: the keyword await ofline 12 is included in attempt #1, but not in attempt #2.
machines. Unfortunately, this naıve approach is not go-ing to work well because of reentrancy issues: the callon line 12 may affect the current grain directly (self-recursion) or after a series of calls.
Naıve solution #2: A possible solution to the issueof reentrancy is to not await the completion of calls online 12 in Figure 7. Doing so will allow other grainsto do their processing in parallel. This is sometimescalled “send-and-forget” style of asynchronous process-ing. While this approach is likely to increase the level ofparallelism, it provides no easy way to detect global ter-mination. Indeed, the top-level loop will return almostimmediately without waiting for the results to prop-agate back. Besides, not awaiting the result has as aconsequence missing the exceptions may be thrown bythe callee.
Orchestrator: A more radical option is to use of anorchestrator to establish some degree of centralized con-trol over the propagation process. Grains communicatewith the orchestrator exclusively, instead of communi-cating with each other peer-to-peer. This avoids the is-sue of reentrancy by construction; only the orchestratorcan send messages to grains via a single message queue.
The orchestrator keeps track of the outstanding tasksand can therefore detect both termination and preventreentrant calls from taking place. To overcome the issueof timeouts, the orchestrator catches the timeout excep-tions thrown by the grains. This is possible because theorchestrator initiates all the chain of grain calls. The keydisadvantage of this design is that it is possible to havea great deal of contention for access to the orchestra-tor. We observed this in practice, suggesting a differentvariant of this idea.
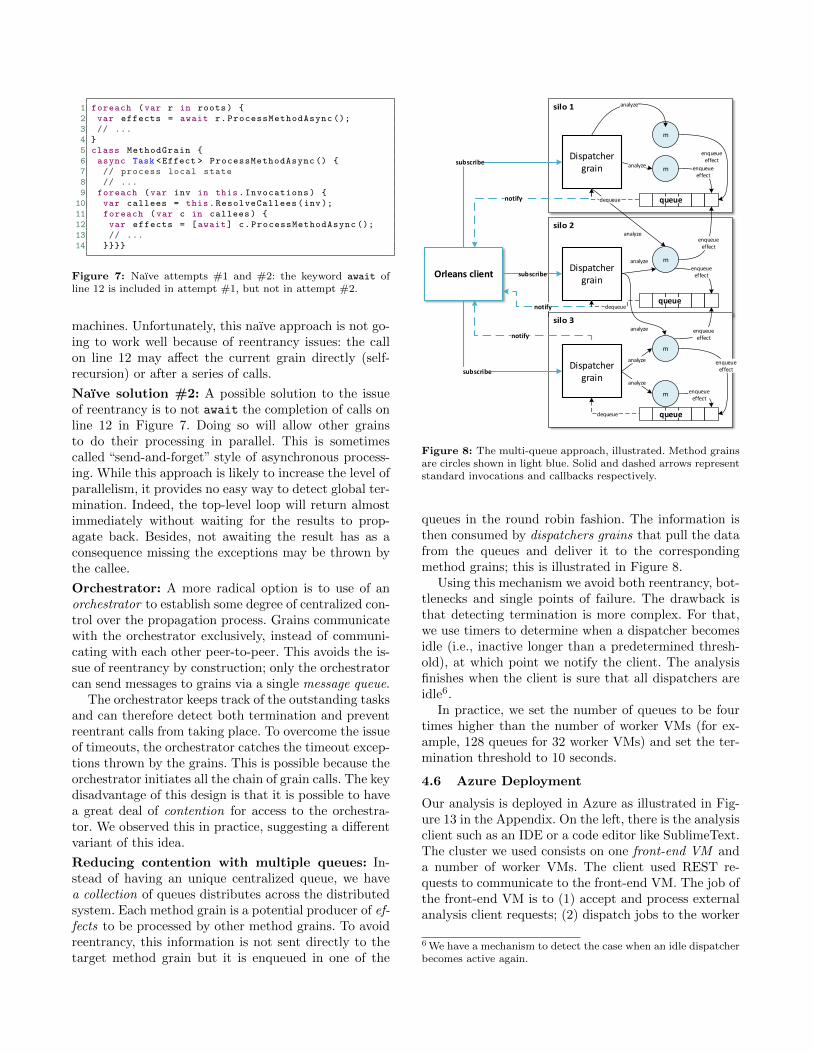
Reducing contention with multiple queues: In-stead of having an unique centralized queue, we havea collection of queues distributes across the distributedsystem. Each method grain is a potential producer of ef-fects to be processed by other method grains. To avoidreentrancy, this information is not sent directly to thetarget method grain but it is enqueued in one of the
Orleans client
Dispatcher grain
Dispatcher grain
Dispatcher grain
m
m
analyze
enqueueeffect
m
enqueueeffect
subscribe
notify
m
m enqueueeffect
dequeue
subscribe
notify
notify
subscribe
enqueueeffect
analyze
analyze
analyze
analyze
analyze enqueueeffect
analyze
queue
queue
queue
enqueueeffect
dequeue
dequeue
enqueueeffect
Figure 8: The multi-queue approach, illustrated. Method grainsare circles shown in light blue. Solid and dashed arrows representstandard invocations and callbacks respectively.
queues in the round robin fashion. The information isthen consumed by dispatchers grains that pull the datafrom the queues and deliver it to the correspondingmethod grains; this is illustrated in Figure 8.
Using this mechanism we avoid both reentrancy, bot-tlenecks and single points of failure. The drawback isthat detecting termination is more complex. For that,we use timers to determine when a dispatcher becomesidle (i.e., inactive longer than a predetermined thresh-old), at which point we notify the client. The analysisfinishes when the client is sure that all dispatchers areidle6.
In practice, we set the number of queues to be fourtimes higher than the number of worker VMs (for ex-ample, 128 queues for 32 worker VMs) and set the ter-mination threshold to 10 seconds.
4.6 Azure Deployment
Our analysis is deployed in Azure as illustrated in Fig-ure 13 in the Appendix. On the left, there is the analysisclient such as an IDE or a code editor like SublimeText.The cluster we used consists on one front-end VM anda number of worker VMs. The client used REST re-quests to communicate to the front-end VM. The job ofthe front-end VM is to (1) accept and process externalanalysis client requests; (2) dispatch jobs to the worker
6 We have a mechanism to detect the case when an idle dispatcherbecomes active again.
VMs and process the results; and (3) provide a Web UIwith analysis results and statistics.
In Figure 14 in the Appendix we show two screen-shots of an experimental IDE prototype that uses theAPI exposed by our analysis to resolve caller/calleesqueries7. In Figure 15 in the Appendix, we show sev-eral typical REST requests for common IDE navigationtasks. The API is designed for use with a variety ofclients; for a task such as getting all references to asymbol, we simply package up the name of the symbolinto a string and dispatch the request.
5. Evaluation
In our evaluation, we aim to answer the following threeresearch questions.
RQ1: Is our analysis capable of handling arbitraryamounts of input (i.e., more lines of code, files,projects, etc.) by increasing the number of workerVMs, without running out of memory?
RQ2: While the communication overhead can becomesignificant, as more worker VMs are added, does anincrease in the number of worker VMs significantlyincrease the overall analysis times?
RQ3: Is the analysis query latency small enough toallow for interactive use8?
5.1 Experimental Setup
All the experiments presented in this paper were exe-cuted in the cloud, on a commercially available Azurecluster. We could also have used an AWS cluster, asour dependency on Azure is small. The Azure clus-ter we used for the experiments consists on one front-end VM and up to 64 worker role VMs. The front-end VM is an Azure VM with 14 GB of RAM (thisis an A4\ExtraLarge VM in Azure parlance9). Eachworker role is an Azure VM with 7 GB of RAM(called A3\Large in Azure). For benchmarking pur-poses, we run our analysis with configurations that in-clude 1, 2, 4, 8, 16, 32, and 64 worker VMs. Note thatthe orchestrator always resides in a single VM.
To collect numbers for this paper, we used a custom-written experimental controller as our analysis clientthroughout this section; this setup is illustrated in Fig-ure 13 in the Appendix. The controller is scripted toissue commands to analyze the next .sln file, collecttimings, etc.
7 Another example of such an IDE can be found at http://
source.roslyn.io/8 Generally, query latencies of 10 to 20 ms are considered to beacceptable.9 Up-to-date VM specifications are available at https:
//azure.microsoft.com/en-us/documentation/articles/
virtual-workerVMs-size-specs/.
We heavily instrumented our analysis to collect aset of relevant metrics. We instrumented our analysiscode to measure the analysis elapsed time. We intro-duced wrappers around our grains (solution, project,and method grains) to distinguish between local mes-sages (within the same VM) and network messages. Us-ing Orleans-provided statistics, we measured the max-imum memory consumption per VM. Lastly, we alsohave added instrumentation to measure query responsetimes. While these measurements are collected at thelevel of an individual grain, we generally wanted to re-port aggregates. In order to collect these, we postedgrain-level statistics to a special auxiliary grain.
5.2 Benchmarks
For our inputs, we have used two categories of bench-marks, synthetic benchmarks we have generated specif-ically to test the scalability of our call graph analysisand a set of 3 real applications written in C# that pushour analysis implementation to be as complete as possi-ble, in terms of handling tricky language features suchas delegate, lambdas, etc. and see the impact of deal-ing with polymorphic method invocations. In all cases,we start with a solution file (.sln) which references sev-eral project files (.csproj), each of which in turn refer-ences a number of C# source files (.cs).
Synthetic benchmarks: We designed a set of syn-thetic benchmarks to test the scalability of our analysisapproach. These are solution files generated to have therequisite number of methods (for the experiments, weranged that number between 1,000 and 1,000,000).
These methods are broken into classes, one class perinput file. The pattern of calls within this syntheticcode is set up to maintain a fixed average number ofcallees per invocation and also to force all methodsto be reachable from root methods. The figure belowsummarizes some statistics about the synthetic projectswe have used for this evaluation.
Benchmark LOC Projects Classes Methods
X1,000 9,196 10 10 1,000X10,000 92,157 50 50 10,000X100,000 904,854 100 100 100,000X1,000,000 9,005,368 100 100 1,000,000
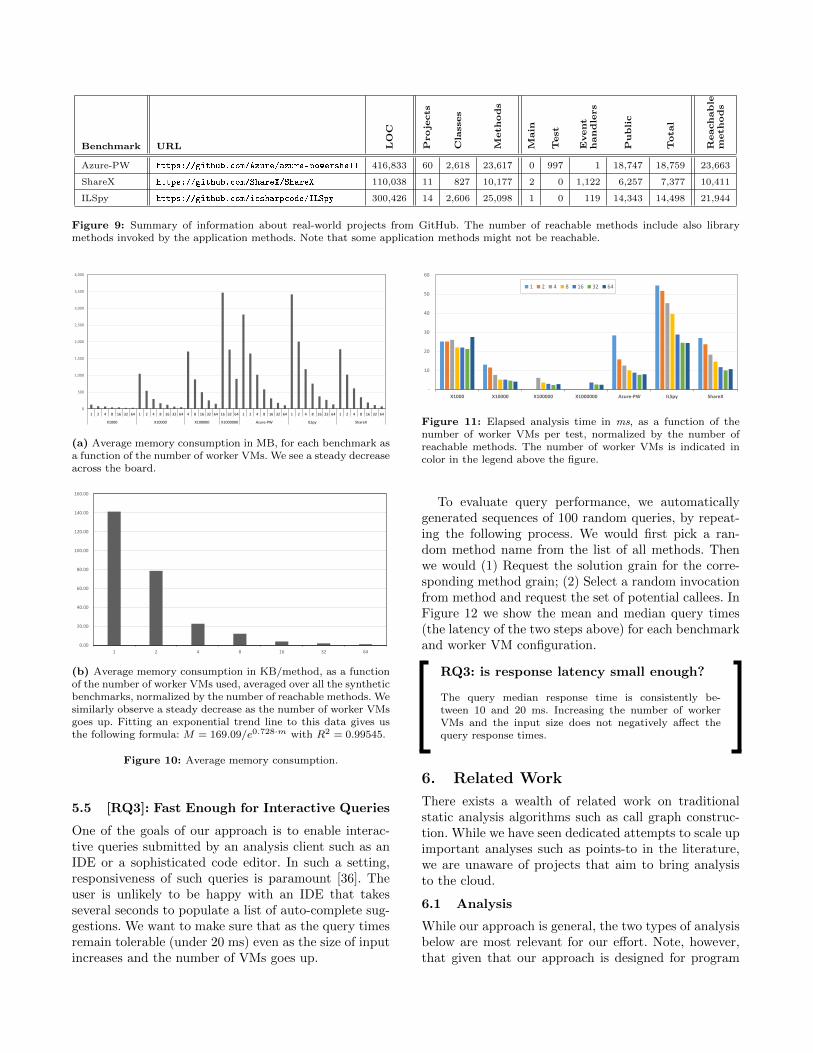
Real-world benchmarks: We have selected severallarge open-source projects from GitHub for our anal-ysis. A summary of information about these programsin shown in Figure 9. We tried to focus on projectsthat are under active development. To illustrate, oneof our benchmarks, Azure Powershell is one of themost popular projects written in C# on GitHub. Ac-cording to the project statistics, over a period of onemonth in October–November 2015, 51 authors havepushed 280 commits to the main branch and 369commits to all branches. There have been 342,796additions and 195,366 deletions. We picked solu-
tion ResourceManager.ForRefactoringOnly.sln fromAzure Powershell because it is the only one that con-tains all the projects. Generally, discovering good rootmethods to serve as starting points for the call graphanalysis is not trivial. Because there is no natural Mainmethod in several of these projects, we have decided touse as entry points the included unit tests, event han-dlers, and public methods within the project to in-crease the number of methods our analysis reaches10.
5.3 [RQ1]: Scales with Input Size
To answer RQ1, we measured the memory consumptionof each VM and computed the average and maximummemory consumption across all VMs. Figure 10a showsthe average memory consumption for each benchmarkduring the run, for each experimental configuration,i.e. number of worker VMs used. To give an aggregateperspective of the effect that adding more VMs to themix has on memory pressure, Figure 10b shows thememory consumption averaged across all benchmarksshown for every cloud configuration.
As can be observed from the chart, the memory con-sumption decreases steadily as the number of workerVMs increases. Recall that worker VMs come equippedwith 7 GB of memory, so these memory consumptionnumbers are nowhere near that limit. Looking at Fig-ure 10a, we can see peaks of about 3.2 GB for a singleworker VM while analyzing X1,000,00011.
These experiments naturally highlight the notion ofanalysis elasticity. While we run the analysis with dif-ferent number of VMs set for the sake of measurement,in reality, more machines would be added (or removed)due to memory pressure (or lack thereof) or to respondto how full analysis processing queues get. We can sim-ilarly choose to increase (or decrease) the number ofqueues and dispatchers involved in effect propagation.It is the job of the Orleans runtime to redistribute thegrains to update the system with the new configuration.
RQ1: capable of handling input size?
The memory consumption per worker VMs steadily de-creases as the number of worker VMs increases.
5.4 [RQ2]: Scales with the # of Worker VMs
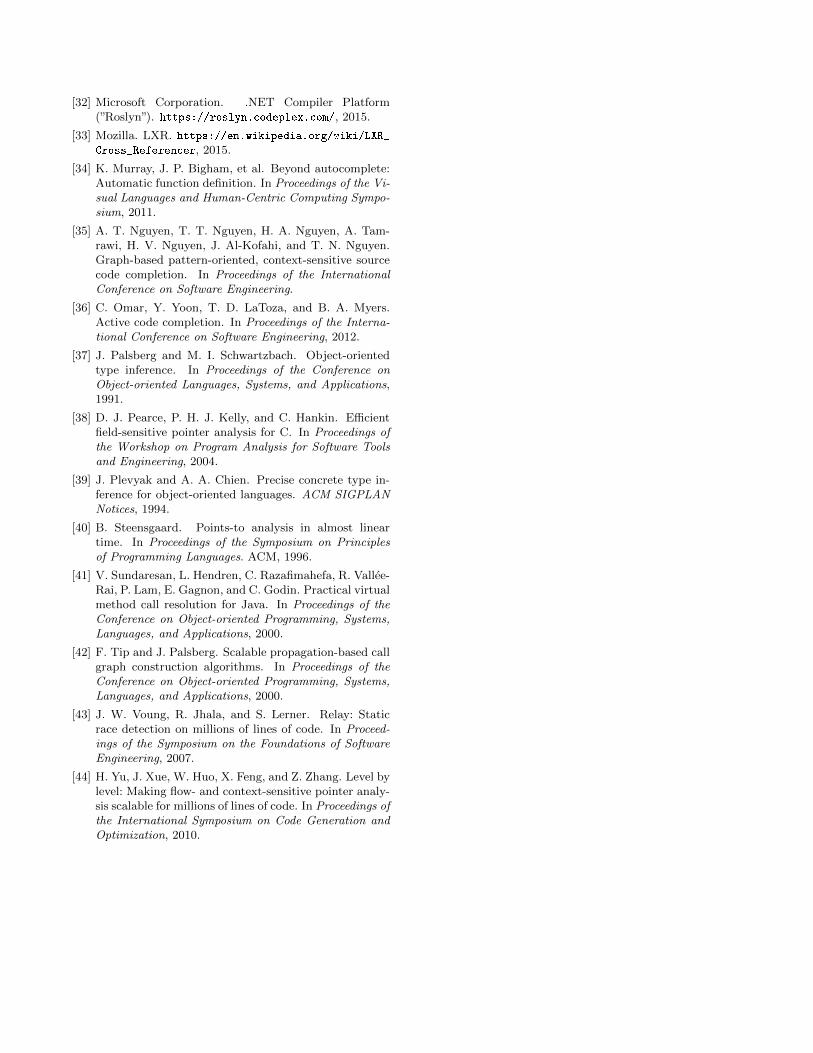
To answer RQ2, we proceeded to measure the totalelapsed analysis time for each benchmark on all theconfigurations. Figure 16 in the Appendix shows theoverall analysis and compilation times; the latter canbe quite substantial (i.e., about 3 minutes to compilethe larger benchmarks such as X100,000 and Azure-
10 Note that we do not analyze libraries provided as DLLs; ouranalysis works at the source level only.11 Note also that for that benchmark, we needed to use at least 16worker VMs to fit all the methods into (their shared) memory. Weneeded at least 4 worker VMs for X100,000.
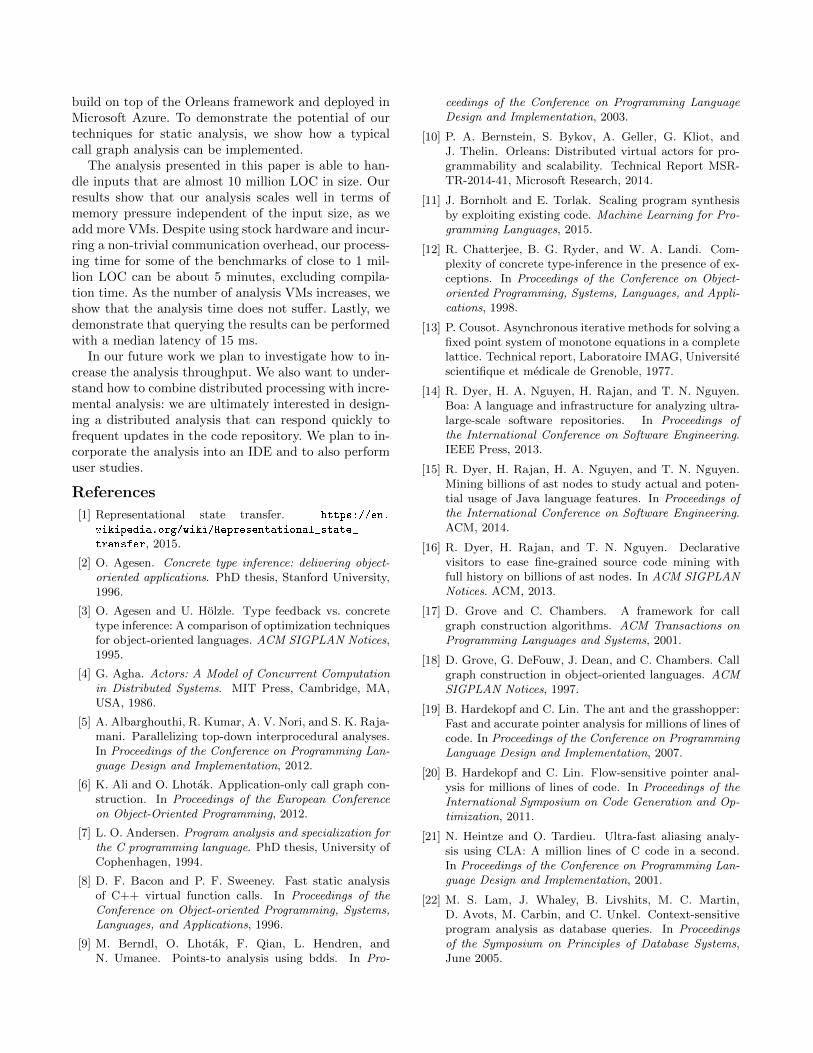
PW). Analysis time is compared to compilation timein Figure 17. Clearly, the analysis time is highly inputsize-specific. It is therefore instructive to normalize theanalysis time by the input size. Figure 11 shows theelapsed analysis time normalized by the number ofmethods in the input.
Note that the real-world benchmarks shown on theright-hand side of the chart, despite containing fewermethods, require more time than the synthetic bench-marks with 100,000 methods. This is simply because ofthe analysis time that goes into analyzing more complexmethod bodies.
Real-world benchmarks allocate more objects permethod, involving more type propagation time, andperform more virtual invocations, adding to the methodresolution time, while the synthetic benchmarks onlyperform static invocations and allocate relatively fewobjects. As the number of worker VMs increases, wesee a consistent drop in the normalized analysis times.However, this effect generally diminishes after 16 VMs.This has to do with the tension between more parallelprocessing power of more machines and the increase inthe network overhead, as shown below.
Degradation due to increased network overhead
Improvement due to increase parallelism
Balance between parallelism and network overhead
number of machines
anal
ysis
tim
e
It is instructive to focus on the average number of(unprocessed) messages in the analysis queues. If thequeues are too full, adding more machines will increasethe number of queues, reducing the size of each one.More machines will increase the parallelism because ofmore dispatchers to process the messages in the newqueues. As we add more resources, however, when thequeues become mostly empty, their associated dispatch-ers will be mostly idle. So the cluster as a whole will havemore computing resources than needed. Additionally, ifmore machines are added, the probability of sending amessage to a grain on the same machine as the senderwill be reduced, leading to more network overhead. Soafter reaching a certain cut-off point, adding more ma-chines is not only not helping the analysis, but starts todegrade its performance.
RQ2: does adding more worker VMs in-crease analysis time?
Normalized analysis time generally decreases, as the num-ber of worker VMs increases, up to a point, where the lawof diminishing returns kicks in.
Benchmark URL LOC
Projects
Classes
Methods
Main
Test
Event
handlers
Public
Total
Reachable
methods
Azure-PW https://github.com/Azure/azure-powershell 416,833 60 2,618 23,617 0 997 1 18,747 18,759 23,663
ShareX https://github.com/ShareX/ShareX 110,038 11 827 10,177 2 0 1,122 6,257 7,377 10,411
ILSpy https://github.com/icsharpcode/ILSpy 300,426 14 2,606 25,098 1 0 119 14,343 14,498 21,944
Figure 9: Summary of information about real-world projects from GitHub. The number of reachable methods include also librarymethods invoked by the application methods. Note that some application methods might not be reachable.
0
500
1,000
1,500
2,000
2,500
3,000
3,500
4,000
1 2 4 8 16 32 64 1 2 4 8 16 32 64 4 8 16 32 64 16 32 64 1 2 4 8 16 32 64 1 2 4 8 16 32 64 1 2 4 8 16 32 64
X1000 X10000 X100000 X1000000 Azure-PW ILSpy ShareX
(a) Average memory consumption in MB, for each benchmark asa function of the number of worker VMs. We see a steady decreaseacross the board.
0.00
20.00
40.00
60.00
80.00
100.00
120.00
140.00
160.00
1 2 4 8 16 32 64
(b) Average memory consumption in KB/method, as a functionof the number of worker VMs used, averaged over all the syntheticbenchmarks, normalized by the number of reachable methods. Wesimilarly observe a steady decrease as the number of worker VMsgoes up. Fitting an exponential trend line to this data gives usthe following formula: M = 169.09/e0.728·m with R2 = 0.99545.
Figure 10: Average memory consumption.
5.5 [RQ3]: Fast Enough for Interactive Queries
One of the goals of our approach is to enable interac-tive queries submitted by an analysis client such as anIDE or a sophisticated code editor. In such a setting,responsiveness of such queries is paramount [36]. Theuser is unlikely to be happy with an IDE that takesseveral seconds to populate a list of auto-complete sug-gestions. We want to make sure that as the query timesremain tolerable (under 20 ms) even as the size of inputincreases and the number of VMs goes up.
-
10
20
30
40
50
60
X1000 X10000 X100000 X1000000 Azure-PW ILSpy ShareX
1 2 4 8 16 32 64
Figure 11: Elapsed analysis time in ms, as a function of thenumber of worker VMs per test, normalized by the number ofreachable methods. The number of worker VMs is indicated incolor in the legend above the figure.
To evaluate query performance, we automaticallygenerated sequences of 100 random queries, by repeat-ing the following process. We would first pick a ran-dom method name from the list of all methods. Thenwe would (1) Request the solution grain for the corre-sponding method grain; (2) Select a random invocationfrom method and request the set of potential callees. InFigure 12 we show the mean and median query times(the latency of the two steps above) for each benchmarkand worker VM configuration.
RQ3: is response latency small enough?
The query median response time is consistently be-tween 10 and 20 ms. Increasing the number of workerVMs and the input size does not negatively affect thequery response times.
6. Related Work
There exists a wealth of related work on traditionalstatic analysis algorithms such as call graph construc-tion. While we have seen dedicated attempts to scale upimportant analyses such as points-to in the literature,we are unaware of projects that aim to bring analysisto the cloud.
6.1 Analysis
While our approach is general, the two types of analysisbelow are most relevant for our effort. Note, however,that given that our approach is designed for program
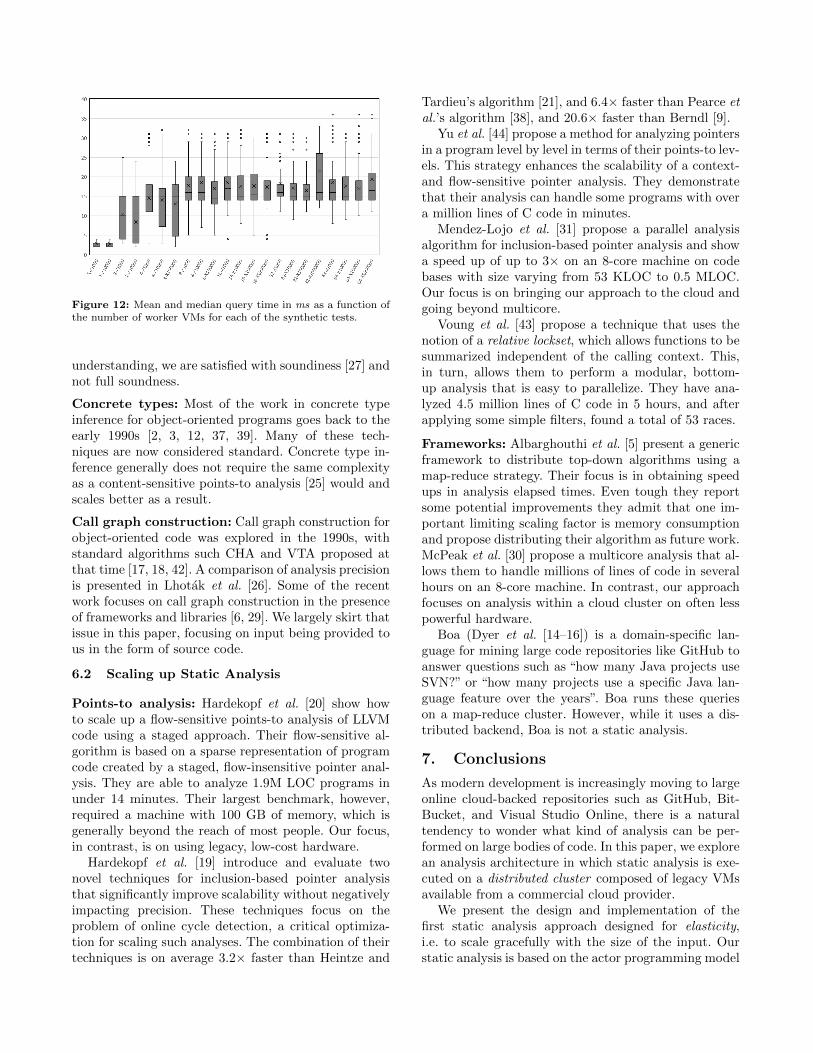
Figure 12: Mean and median query time in ms as a function ofthe number of worker VMs for each of the synthetic tests.
understanding, we are satisfied with soundiness [27] andnot full soundness.
Concrete types: Most of the work in concrete typeinference for object-oriented programs goes back to theearly 1990s [2, 3, 12, 37, 39]. Many of these tech-niques are now considered standard. Concrete type in-ference generally does not require the same complexityas a content-sensitive points-to analysis [25] would andscales better as a result.
Call graph construction: Call graph construction forobject-oriented code was explored in the 1990s, withstandard algorithms such CHA and VTA proposed atthat time [17, 18, 42]. A comparison of analysis precisionis presented in Lhotak et al. [26]. Some of the recentwork focuses on call graph construction in the presenceof frameworks and libraries [6, 29]. We largely skirt thatissue in this paper, focusing on input being provided tous in the form of source code.
6.2 Scaling up Static Analysis
Points-to analysis: Hardekopf et al. [20] show howto scale up a flow-sensitive points-to analysis of LLVMcode using a staged approach. Their flow-sensitive al-gorithm is based on a sparse representation of programcode created by a staged, flow-insensitive pointer anal-ysis. They are able to analyze 1.9M LOC programs inunder 14 minutes. Their largest benchmark, however,required a machine with 100 GB of memory, which isgenerally beyond the reach of most people. Our focus,in contrast, is on using legacy, low-cost hardware.
Hardekopf et al. [19] introduce and evaluate twonovel techniques for inclusion-based pointer analysisthat significantly improve scalability without negativelyimpacting precision. These techniques focus on theproblem of online cycle detection, a critical optimiza-tion for scaling such analyses. The combination of theirtechniques is on average 3.2× faster than Heintze and
Tardieu’s algorithm [21], and 6.4× faster than Pearce etal.’s algorithm [38], and 20.6× faster than Berndl [9].
Yu et al. [44] propose a method for analyzing pointersin a program level by level in terms of their points-to lev-els. This strategy enhances the scalability of a context-and flow-sensitive pointer analysis. They demonstratethat their analysis can handle some programs with overa million lines of C code in minutes.
Mendez-Lojo et al. [31] propose a parallel analysisalgorithm for inclusion-based pointer analysis and showa speed up of up to 3× on an 8-core machine on codebases with size varying from 53 KLOC to 0.5 MLOC.Our focus is on bringing our approach to the cloud andgoing beyond multicore.
Voung et al. [43] propose a technique that uses thenotion of a relative lockset, which allows functions to besummarized independent of the calling context. This,in turn, allows them to perform a modular, bottom-up analysis that is easy to parallelize. They have ana-lyzed 4.5 million lines of C code in 5 hours, and afterapplying some simple filters, found a total of 53 races.
Frameworks: Albarghouthi et al. [5] present a genericframework to distribute top-down algorithms using amap-reduce strategy. Their focus is in obtaining speedups in analysis elapsed times. Even tough they reportsome potential improvements they admit that one im-portant limiting scaling factor is memory consumptionand propose distributing their algorithm as future work.McPeak et al. [30] propose a multicore analysis that al-lows them to handle millions of lines of code in severalhours on an 8-core machine. In contrast, our approachfocuses on analysis within a cloud cluster on often lesspowerful hardware.
Boa (Dyer et al. [14–16]) is a domain-specific lan-guage for mining large code repositories like GitHub toanswer questions such as “how many Java projects useSVN?” or “how many projects use a specific Java lan-guage feature over the years”. Boa runs these querieson a map-reduce cluster. However, while it uses a dis-tributed backend, Boa is not a static analysis.
7. Conclusions
As modern development is increasingly moving to largeonline cloud-backed repositories such as GitHub, Bit-Bucket, and Visual Studio Online, there is a naturaltendency to wonder what kind of analysis can be per-formed on large bodies of code. In this paper, we explorean analysis architecture in which static analysis is exe-cuted on a distributed cluster composed of legacy VMsavailable from a commercial cloud provider.
We present the design and implementation of thefirst static analysis approach designed for elasticity,i.e. to scale gracefully with the size of the input. Ourstatic analysis is based on the actor programming model
build on top of the Orleans framework and deployed inMicrosoft Azure. To demonstrate the potential of ourtechniques for static analysis, we show how a typicalcall graph analysis can be implemented.
The analysis presented in this paper is able to han-dle inputs that are almost 10 million LOC in size. Ourresults show that our analysis scales well in terms ofmemory pressure independent of the input size, as weadd more VMs. Despite using stock hardware and incur-ring a non-trivial communication overhead, our process-ing time for some of the benchmarks of close to 1 mil-lion LOC can be about 5 minutes, excluding compila-tion time. As the number of analysis VMs increases, weshow that the analysis time does not suffer. Lastly, wedemonstrate that querying the results can be performedwith a median latency of 15 ms.
In our future work we plan to investigate how to in-crease the analysis throughput. We also want to under-stand how to combine distributed processing with incre-mental analysis: we are ultimately interested in design-ing a distributed analysis that can respond quickly tofrequent updates in the code repository. We plan to in-corporate the analysis into an IDE and to also performuser studies.
References
[1] Representational state transfer. https://en.
wikipedia.org/wiki/Representational_state_
transfer, 2015.
[2] O. Agesen. Concrete type inference: delivering object-oriented applications. PhD thesis, Stanford University,1996.
[3] O. Agesen and U. Holzle. Type feedback vs. concretetype inference: A comparison of optimization techniquesfor object-oriented languages. ACM SIGPLAN Notices,1995.
[4] G. Agha. Actors: A Model of Concurrent Computationin Distributed Systems. MIT Press, Cambridge, MA,USA, 1986.
[5] A. Albarghouthi, R. Kumar, A. V. Nori, and S. K. Raja-mani. Parallelizing top-down interprocedural analyses.In Proceedings of the Conference on Programming Lan-guage Design and Implementation, 2012.
[6] K. Ali and O. Lhotak. Application-only call graph con-struction. In Proceedings of the European Conferenceon Object-Oriented Programming, 2012.
[7] L. O. Andersen. Program analysis and specialization forthe C programming language. PhD thesis, University ofCophenhagen, 1994.
[8] D. F. Bacon and P. F. Sweeney. Fast static analysisof C++ virtual function calls. In Proceedings of theConference on Object-oriented Programming, Systems,Languages, and Applications, 1996.
[9] M. Berndl, O. Lhotak, F. Qian, L. Hendren, andN. Umanee. Points-to analysis using bdds. In Pro-
ceedings of the Conference on Programming LanguageDesign and Implementation, 2003.
[10] P. A. Bernstein, S. Bykov, A. Geller, G. Kliot, andJ. Thelin. Orleans: Distributed virtual actors for pro-grammability and scalability. Technical Report MSR-TR-2014-41, Microsoft Research, 2014.
[11] J. Bornholt and E. Torlak. Scaling program synthesisby exploiting existing code. Machine Learning for Pro-gramming Languages, 2015.
[12] R. Chatterjee, B. G. Ryder, and W. A. Landi. Com-plexity of concrete type-inference in the presence of ex-ceptions. In Proceedings of the Conference on Object-oriented Programming, Systems, Languages, and Appli-cations, 1998.
[13] P. Cousot. Asynchronous iterative methods for solving afixed point system of monotone equations in a completelattice. Technical report, Laboratoire IMAG, Universitescientifique et medicale de Grenoble, 1977.
[14] R. Dyer, H. A. Nguyen, H. Rajan, and T. N. Nguyen.Boa: A language and infrastructure for analyzing ultra-large-scale software repositories. In Proceedings ofthe International Conference on Software Engineering.IEEE Press, 2013.
[15] R. Dyer, H. Rajan, H. A. Nguyen, and T. N. Nguyen.Mining billions of ast nodes to study actual and poten-tial usage of Java language features. In Proceedings ofthe International Conference on Software Engineering.ACM, 2014.
[16] R. Dyer, H. Rajan, and T. N. Nguyen. Declarativevisitors to ease fine-grained source code mining withfull history on billions of ast nodes. In ACM SIGPLANNotices. ACM, 2013.
[17] D. Grove and C. Chambers. A framework for callgraph construction algorithms. ACM Transactions onProgramming Languages and Systems, 2001.
[18] D. Grove, G. DeFouw, J. Dean, and C. Chambers. Callgraph construction in object-oriented languages. ACMSIGPLAN Notices, 1997.
[19] B. Hardekopf and C. Lin. The ant and the grasshopper:Fast and accurate pointer analysis for millions of lines ofcode. In Proceedings of the Conference on ProgrammingLanguage Design and Implementation, 2007.
[20] B. Hardekopf and C. Lin. Flow-sensitive pointer anal-ysis for millions of lines of code. In Proceedings of theInternational Symposium on Code Generation and Op-timization, 2011.
[21] N. Heintze and O. Tardieu. Ultra-fast aliasing analy-sis using CLA: A million lines of C code in a second.In Proceedings of the Conference on Programming Lan-guage Design and Implementation, 2001.
[22] M. S. Lam, J. Whaley, B. Livshits, M. C. Martin,D. Avots, M. Carbin, and C. Unkel. Context-sensitiveprogram analysis as database queries. In Proceedingsof the Symposium on Principles of Database Systems,June 2005.
Appendix
Orchestrator (Orleans Client)
Web roleExperimentalcontroller
load and store experimental statistics
Figure 13: Azure-based deployment of our analysis. The majority of work happens within an Azure cluster, within worker VMs. Theanalysis client interacts with the cluster via a front-end VM.
(a) Visualizing callees: call site on line 20 invokes function DoTest
on line 17.
(b) Visualizing callers: method Bar defined on line 12 is called online 23.
Figure 14: An experimental online IDE that uses analysis for resolving references for callees and callers.
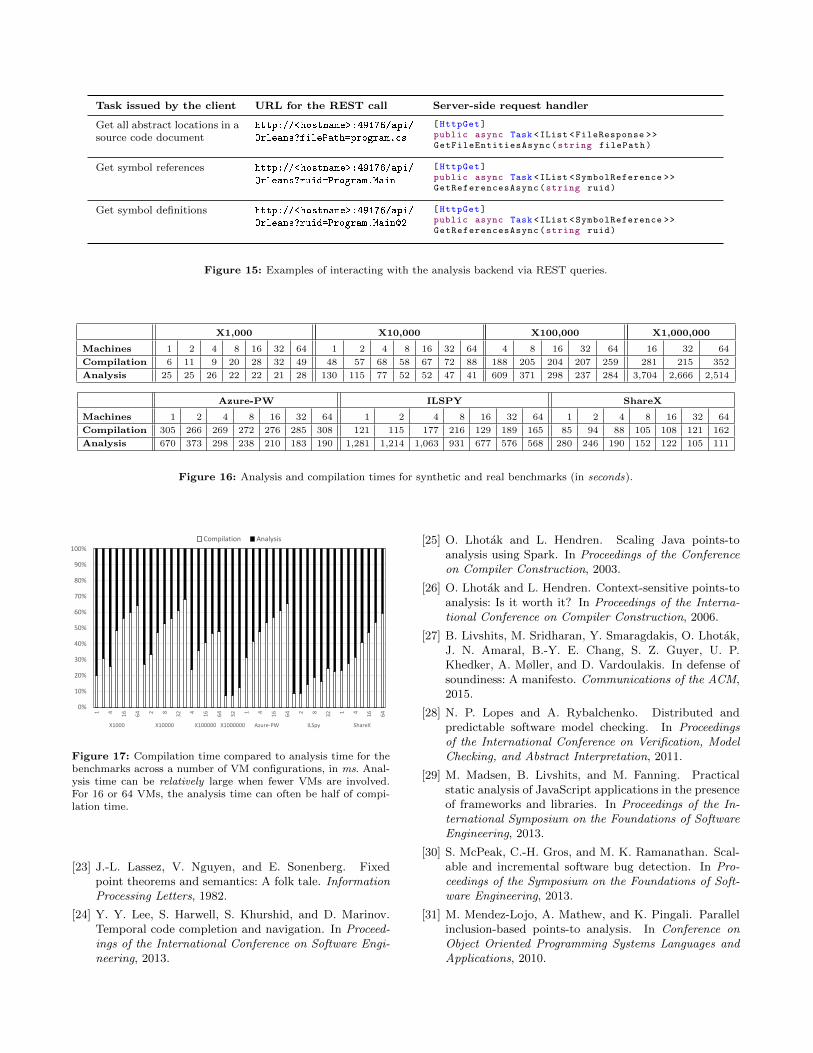
Task issued by the client URL for the REST call Server-side request handler
Get all abstract locations in asource code document
http://<hostname>:49176/api/
Orleans?filePath=program.cs
[HttpGet]public async Task <IList <FileResponse >>GetFileEntitiesAsync(string filePath)
Get symbol references http://<hostname>:49176/api/
Orleans?ruid=Program.Main
[HttpGet]public async Task <IList <SymbolReference >>GetReferencesAsync(string ruid)
Get symbol definitions http://<hostname>:49176/api/
Orleans?ruid=Program.Main@2
[HttpGet]public async Task <IList <SymbolReference >>GetReferencesAsync(string ruid)
Figure 15: Examples of interacting with the analysis backend via REST queries.
X1,000 X10,000 X100,000 X1,000,000
Machines 1 2 4 8 16 32 64 1 2 4 8 16 32 64 4 8 16 32 64 16 32 64
Compilation 6 11 9 20 28 32 49 48 57 68 58 67 72 88 188 205 204 207 259 281 215 352
Analysis 25 25 26 22 22 21 28 130 115 77 52 52 47 41 609 371 298 237 284 3,704 2,666 2,514
Azure-PW ILSPY ShareX
Machines 1 2 4 8 16 32 64 1 2 4 8 16 32 64 1 2 4 8 16 32 64
Compilation 305 266 269 272 276 285 308 121 115 177 216 129 189 165 85 94 88 105 108 121 162
Analysis 670 373 298 238 210 183 190 1,281 1,214 1,063 931 677 576 568 280 246 190 152 122 105 111
Figure 16: Analysis and compilation times for synthetic and real benchmarks (in seconds).
0%
10%
20%
30%
40%
50%
60%
70%
80%
90%
100%
1 4
16
64 2 8
32 4
16
64
32 1 4
16
64 2 8
32 1 4
16
64
X1000 X10000 X100000 X1000000 Azure-PW ILSpy ShareX
Compilation Analysis
Figure 17: Compilation time compared to analysis time for thebenchmarks across a number of VM configurations, in ms. Anal-ysis time can be relatively large when fewer VMs are involved.For 16 or 64 VMs, the analysis time can often be half of compi-lation time.
[23] J.-L. Lassez, V. Nguyen, and E. Sonenberg. Fixedpoint theorems and semantics: A folk tale. InformationProcessing Letters, 1982.
[24] Y. Y. Lee, S. Harwell, S. Khurshid, and D. Marinov.Temporal code completion and navigation. In Proceed-ings of the International Conference on Software Engi-neering, 2013.
[25] O. Lhotak and L. Hendren. Scaling Java points-toanalysis using Spark. In Proceedings of the Conferenceon Compiler Construction, 2003.
[26] O. Lhotak and L. Hendren. Context-sensitive points-toanalysis: Is it worth it? In Proceedings of the Interna-tional Conference on Compiler Construction, 2006.
[27] B. Livshits, M. Sridharan, Y. Smaragdakis, O. Lhotak,J. N. Amaral, B.-Y. E. Chang, S. Z. Guyer, U. P.Khedker, A. Møller, and D. Vardoulakis. In defense ofsoundiness: A manifesto. Communications of the ACM,2015.
[28] N. P. Lopes and A. Rybalchenko. Distributed andpredictable software model checking. In Proceedingsof the International Conference on Verification, ModelChecking, and Abstract Interpretation, 2011.
[29] M. Madsen, B. Livshits, and M. Fanning. Practicalstatic analysis of JavaScript applications in the presenceof frameworks and libraries. In Proceedings of the In-ternational Symposium on the Foundations of SoftwareEngineering, 2013.
[30] S. McPeak, C.-H. Gros, and M. K. Ramanathan. Scal-able and incremental software bug detection. In Pro-ceedings of the Symposium on the Foundations of Soft-ware Engineering, 2013.
[31] M. Mendez-Lojo, A. Mathew, and K. Pingali. Parallelinclusion-based points-to analysis. In Conference onObject Oriented Programming Systems Languages andApplications, 2010.
[32] Microsoft Corporation. .NET Compiler Platform(”Roslyn”). https://roslyn.codeplex.com/, 2015.
[33] Mozilla. LXR. https://en.wikipedia.org/wiki/LXR_Cross_Referencer, 2015.
[34] K. Murray, J. P. Bigham, et al. Beyond autocomplete:Automatic function definition. In Proceedings of the Vi-sual Languages and Human-Centric Computing Sympo-sium, 2011.
[35] A. T. Nguyen, T. T. Nguyen, H. A. Nguyen, A. Tam-rawi, H. V. Nguyen, J. Al-Kofahi, and T. N. Nguyen.Graph-based pattern-oriented, context-sensitive sourcecode completion. In Proceedings of the InternationalConference on Software Engineering.
[36] C. Omar, Y. Yoon, T. D. LaToza, and B. A. Myers.Active code completion. In Proceedings of the Interna-tional Conference on Software Engineering, 2012.
[37] J. Palsberg and M. I. Schwartzbach. Object-orientedtype inference. In Proceedings of the Conference onObject-oriented Languages, Systems, and Applications,1991.
[38] D. J. Pearce, P. H. J. Kelly, and C. Hankin. Efficientfield-sensitive pointer analysis for C. In Proceedings ofthe Workshop on Program Analysis for Software Toolsand Engineering, 2004.
[39] J. Plevyak and A. A. Chien. Precise concrete type in-ference for object-oriented languages. ACM SIGPLANNotices, 1994.
[40] B. Steensgaard. Points-to analysis in almost lineartime. In Proceedings of the Symposium on Principlesof Programming Languages. ACM, 1996.
[41] V. Sundaresan, L. Hendren, C. Razafimahefa, R. Vallee-Rai, P. Lam, E. Gagnon, and C. Godin. Practical virtualmethod call resolution for Java. In Proceedings of theConference on Object-oriented Programming, Systems,Languages, and Applications, 2000.
[42] F. Tip and J. Palsberg. Scalable propagation-based callgraph construction algorithms. In Proceedings of theConference on Object-oriented Programming, Systems,Languages, and Applications, 2000.
[43] J. W. Voung, R. Jhala, and S. Lerner. Relay: Staticrace detection on millions of lines of code. In Proceed-ings of the Symposium on the Foundations of SoftwareEngineering, 2007.
[44] H. Yu, J. Xue, W. Huo, X. Feng, and Z. Zhang. Level bylevel: Making flow- and context-sensitive pointer analy-sis scalable for millions of lines of code. In Proceedings ofthe International Symposium on Code Generation andOptimization, 2010.


![Static Elasticity in a Riemannian Manifold · Static Elasticity in a Riemannian Manifold 3 (the mapping expj 0 is defined below). The derivative of a function f[ ] at a point j in](https://img.pdfslide.net/doc/110x75/6009265595d23075e824d4ab/static-elasticity-in-a-riemannian-manifold-static-elasticity-in-a-riemannian-manifold.jpg)