Embed Size (px)
Citation preview
Loughborough UniversityInstitutional Repository
Toward the 3Dcharacterisation of GLARE
and other fibre-metallaminate composites
This item was submitted to Loughborough University's Institutional Repositoryby the/an author.
Citation: SMITH, R.A., VERES, I.A. and PINFIELD, V.J., 2014. Towardthe 3D characterisation of GLARE and other fibre-metal laminate composites.Proceedings, NDT 2014 - 53rd Annual Conference of the British Institute ofNon-Destructive Testing, 9th - 11th September 2014, Manchester, UK.
Additional Information:
• This is a conference paper.
Metadata Record: https://dspace.lboro.ac.uk/2134/17635
Version: Accepted for publication
Publisher: British Institute of Non-Destructive Testing
Rights: This work is made available according to the conditions of the CreativeCommons Attribution-NonCommercial 4.0 International (CC BY-NC 4.0) li-cence. Full details of this licence are available at: https://creativecommons.org/licenses/by-nc/4.0/
Please cite the published version.
Published in Proceedings of ‘NDT2014’, Manchester, Sept 2014.
1
Toward the 3D characterisation of GLARE and other fibre-metal laminate composites.
Robert A. Smith,1 Istvan A. Veres 1,2 and Valerie J Pinfield 3
1 Ultrasonics and NDT Group, University of Bristol, Bristol, BS8 1TR, UK
Phone: +44 (0)117 331 5934 E-mail: [email protected]
2 Research Center for Non-Destructive Testing GmbH, Linz, Austria;
3 Chemical Engineering Dept., Loughborough University, Loughborough, Leics., UK
Abstract Fibre-metal laminates such as GLARE (alternating glass-fibre composite and aluminium layers) are seeing increasing usage on critical aircraft structures due to their enhanced fatigue resistance compared with unreinforced metal. They can be inspected for overall quality using through-transmission ultrasound, but it is very difficult to determine the depth or nature of any defect in the structure in order to assess its importance or severity. As a result, manufacturing scrap rates are higher than desirable and designed components are heavier in order to mitigate risk due to inadequate information. Defect-depth information is buried in the ultrasonic response but is difficult to extract due to the high reflection coefficients of the interfaces and the variable glass-fibre layer thicknesses.
This paper presents the potential for using model-based multi-dimensional optimisation to determine the layer thicknesses and depth locations of anomalies in the ultrasonic response due to delaminations or porosity. Numerical (FEM) and analytical methods are presented to model the ultrasonic response of fibre-metal laminates, calculated as the steady-state harmonic response of the layered medium. These frequency-domain responses can be used to determine the individual layer thicknesses and depth locations of anomalies by multi-dimensional optimisation. Investigations on the accuracy and the limitations of the method for the 3D characterisation of laminates will be presented.
In addition, the evaluated frequency-domain responses show that the high reflection coefficients in combination with the periodic arrangement of the layup effectively mimic the behaviour of a one-dimensional phononic crystal. In the through-transmission ultrasound response, stop bands arise where the transmission is close to zero. None of the resonance frequencies of a laminate – even one with a finite number of layers – can lie within a stop band. However, the presence of a defect in a layer, or different material properties or thickness, can cause the defect modes, i.e. eigenmodes, to shift into the expected stop bands. This might open new possibilities in the non-destructive testing of fibre-metal laminates, which will be elaborated in the presented paper.
Published in Proceedings of ‘NDT2014’, Manchester, Sept 2014.
2
1 Introduction
1.1 Inspection of GLARE
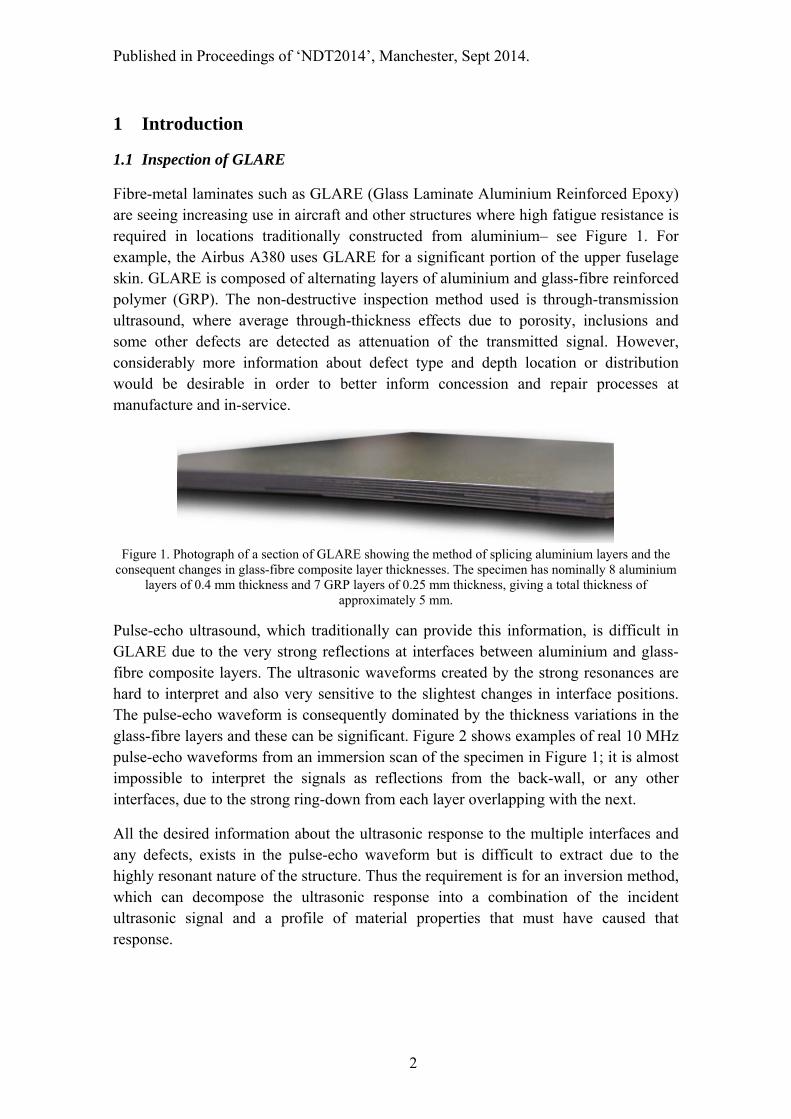
Fibre-metal laminates such as GLARE (Glass Laminate Aluminium Reinforced Epoxy) are seeing increasing use in aircraft and other structures where high fatigue resistance is required in locations traditionally constructed from aluminium– see Figure 1. For example, the Airbus A380 uses GLARE for a significant portion of the upper fuselage skin. GLARE is composed of alternating layers of aluminium and glass-fibre reinforced polymer (GRP). The non-destructive inspection method used is through-transmission ultrasound, where average through-thickness effects due to porosity, inclusions and some other defects are detected as attenuation of the transmitted signal. However, considerably more information about defect type and depth location or distribution would be desirable in order to better inform concession and repair processes at manufacture and in-service.
Figure 1. Photograph of a section of GLARE showing the method of splicing aluminium layers and the
consequent changes in glass-fibre composite layer thicknesses. The specimen has nominally 8 aluminium layers of 0.4 mm thickness and 7 GRP layers of 0.25 mm thickness, giving a total thickness of
approximately 5 mm.
Pulse-echo ultrasound, which traditionally can provide this information, is difficult in GLARE due to the very strong reflections at interfaces between aluminium and glass-fibre composite layers. The ultrasonic waveforms created by the strong resonances are hard to interpret and also very sensitive to the slightest changes in interface positions. The pulse-echo waveform is consequently dominated by the thickness variations in the glass-fibre layers and these can be significant. Figure 2 shows examples of real 10 MHz pulse-echo waveforms from an immersion scan of the specimen in Figure 1; it is almost impossible to interpret the signals as reflections from the back-wall, or any other interfaces, due to the strong ring-down from each layer overlapping with the next.
All the desired information about the ultrasonic response to the multiple interfaces and any defects, exists in the pulse-echo waveform but is difficult to extract due to the highly resonant nature of the structure. Thus the requirement is for an inversion method, which can decompose the ultrasonic response into a combination of the incident ultrasonic signal and a profile of material properties that must have caused that response.

Published in Proceedings of ‘NDT2014’, Manchester, Sept 2014.
3
Figure 2. Typical variability in ultrasonic pulse-echo responses from three nominally similar locations on
the GLARE structure shown in Figure 1. The ultrasonic transducer was a 10 MHz probe of 6.25 mm diameter, focused with a nominal 38 mm focal length in water. The water stand-off was approximately 28
mm. The first signal, at 38.3 μs, is from the front-wall echo and the specimen is approximately 5 mm thick, but it is very difficult to distinguish a back-wall echo or the causes of any of the response without a
modelled approach.
1.2 Potential inversion solution
Ultrasonic methods allow non-destructive material characterization such as the evaluation of elastic material properties [1] or the porosity [2] through inverse problems. The determination of elastic parameters or the geometry is based on the measurement of the wave velocity or the dispersion curves [1] and can be straightforwardly carried out. The influence of the microstructure and, in particular, the effect of the porosity is partially described by the attenuation of the wave due to the backscattering of ultrasound [3]. An effective-medium approach with a complex wave number provides a simple technique to account for the attenuation of the ultrasound due to porosity [4,5]. Ultrasonic propagation through the glass-fibre composite layers of GLARE can be modelled by combining the properties of porosity, glass-fibre and resin into the properties of an ‘effective’ homogeneous medium. Within this approach the elastic material properties such as density or wave velocities are also replaced by their effective counterparts. Such homogenized models mimic well the effect of porosity for low void volume fractions [6] although their use might also lead to artefacts [7].
The overall strength and performance of a GLARE laminate strongly depends upon the porosity level in the composite layers. However, changes in thickness of these layers obscure the pulse-echo ultrasonic response from porosity. In this work, a forward model is presented for GLARE laminates, which could be used as the basis of an inversion process through the use of global optimisation methods. The response of the layered structure is modelled by using the transfer-matrix method whereby the effect of the porosity in the composite layer is taken into account by effective material properties. The forward model is tested in inverse problems by evaluating composite layer thicknesses and porosity values.
Published in Proceedings of ‘NDT2014’, Manchester, Sept 2014.
4
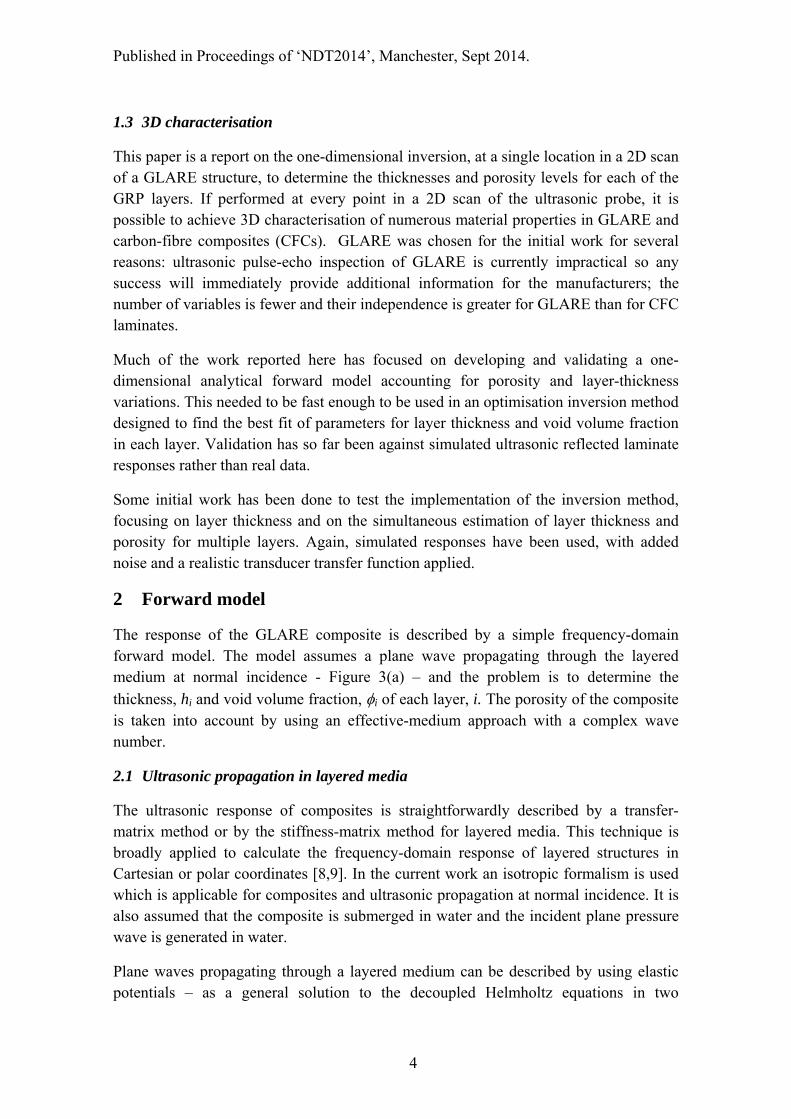
1.3 3D characterisation
This paper is a report on the one-dimensional inversion, at a single location in a 2D scan of a GLARE structure, to determine the thicknesses and porosity levels for each of the GRP layers. If performed at every point in a 2D scan of the ultrasonic probe, it is possible to achieve 3D characterisation of numerous material properties in GLARE and carbon-fibre composites (CFCs). GLARE was chosen for the initial work for several reasons: ultrasonic pulse-echo inspection of GLARE is currently impractical so any success will immediately provide additional information for the manufacturers; the number of variables is fewer and their independence is greater for GLARE than for CFC laminates.
Much of the work reported here has focused on developing and validating a one-dimensional analytical forward model accounting for porosity and layer-thickness variations. This needed to be fast enough to be used in an optimisation inversion method designed to find the best fit of parameters for layer thickness and void volume fraction in each layer. Validation has so far been against simulated ultrasonic reflected laminate responses rather than real data.
Some initial work has been done to test the implementation of the inversion method, focusing on layer thickness and on the simultaneous estimation of layer thickness and porosity for multiple layers. Again, simulated responses have been used, with added noise and a realistic transducer transfer function applied.
2 Forward model
The response of the GLARE composite is described by a simple frequency-domain forward model. The model assumes a plane wave propagating through the layered medium at normal incidence - Figure 3(a) – and the problem is to determine the
thickness, hi and void volume fraction, i of each layer, i. The porosity of the composite is taken into account by using an effective-medium approach with a complex wave number.
2.1 Ultrasonic propagation in layered media
The ultrasonic response of composites is straightforwardly described by a transfer-matrix method or by the stiffness-matrix method for layered media. This technique is broadly applied to calculate the frequency-domain response of layered structures in Cartesian or polar coordinates [8,9]. In the current work an isotropic formalism is used which is applicable for composites and ultrasonic propagation at normal incidence. It is also assumed that the composite is submerged in water and the incident plane pressure wave is generated in water.
Plane waves propagating through a layered medium can be described by using elastic potentials – as a general solution to the decoupled Helmholtz equations in two
Published in Proceedings of ‘NDT2014’, Manchester, Sept 2014.
5
dimensions. The scalar and vector potential functions , are given as a sum of
forward and backward propagating harmonic longitudinal and shear waves:
φ χ Ae Ce (1)
ψ χ Be De (2)
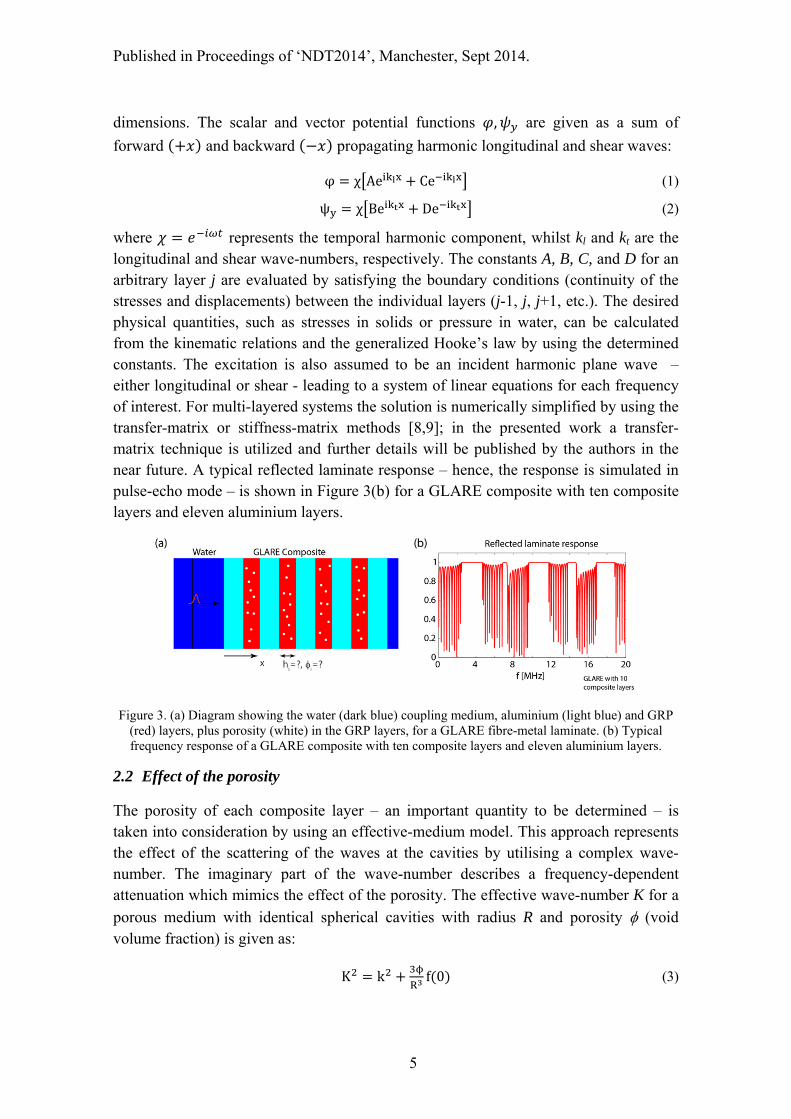
where represents the temporal harmonic component, whilst kl and kt are the longitudinal and shear wave-numbers, respectively. The constants A, B, C, and D for an arbitrary layer j are evaluated by satisfying the boundary conditions (continuity of the stresses and displacements) between the individual layers (j-1, j, j+1, etc.). The desired physical quantities, such as stresses in solids or pressure in water, can be calculated from the kinematic relations and the generalized Hooke’s law by using the determined constants. The excitation is also assumed to be an incident harmonic plane wave – either longitudinal or shear - leading to a system of linear equations for each frequency of interest. For multi-layered systems the solution is numerically simplified by using the transfer-matrix or stiffness-matrix methods [8,9]; in the presented work a transfer-matrix technique is utilized and further details will be published by the authors in the near future. A typical reflected laminate response – hence, the response is simulated in pulse-echo mode – is shown in Figure 3(b) for a GLARE composite with ten composite layers and eleven aluminium layers.
Figure 3. (a) Diagram showing the water (dark blue) coupling medium, aluminium (light blue) and GRP (red) layers, plus porosity (white) in the GRP layers, for a GLARE fibre-metal laminate. (b) Typical frequency response of a GLARE composite with ten composite layers and eleven aluminium layers.
2.2 Effect of the porosity
The porosity of each composite layer – an important quantity to be determined – is taken into consideration by using an effective-medium model. This approach represents the effect of the scattering of the waves at the cavities by utilising a complex wave-number. The imaginary part of the wave-number describes a frequency-dependent attenuation which mimics the effect of the porosity. The effective wave-number K for a
porous medium with identical spherical cavities with radius R and porosity (void volume fraction) is given as:
K k f 0 (3)
Published in Proceedings of ‘NDT2014’, Manchester, Sept 2014.
6
where k is the elastic wave-number and f(0) is the backscattered wave from a single cavity [6,7]. This complex wave-number can be calculated for both longitudinal and shear waves and, therefore, to estimate effective material properties as well. Although this approach neglects the interaction between the scatterers, or multiple scattering effects, it gives an excellent approximation for low void volume fractions in the range of a few percent. For a particular void volume fraction of porosity, with a given pore radius or radius distribution, a complex wave-number can be assigned to each composite layer. Similar models were used in the literature [2,6,7] and the authors’ own studies have validated the current model.
3 Inverse problem
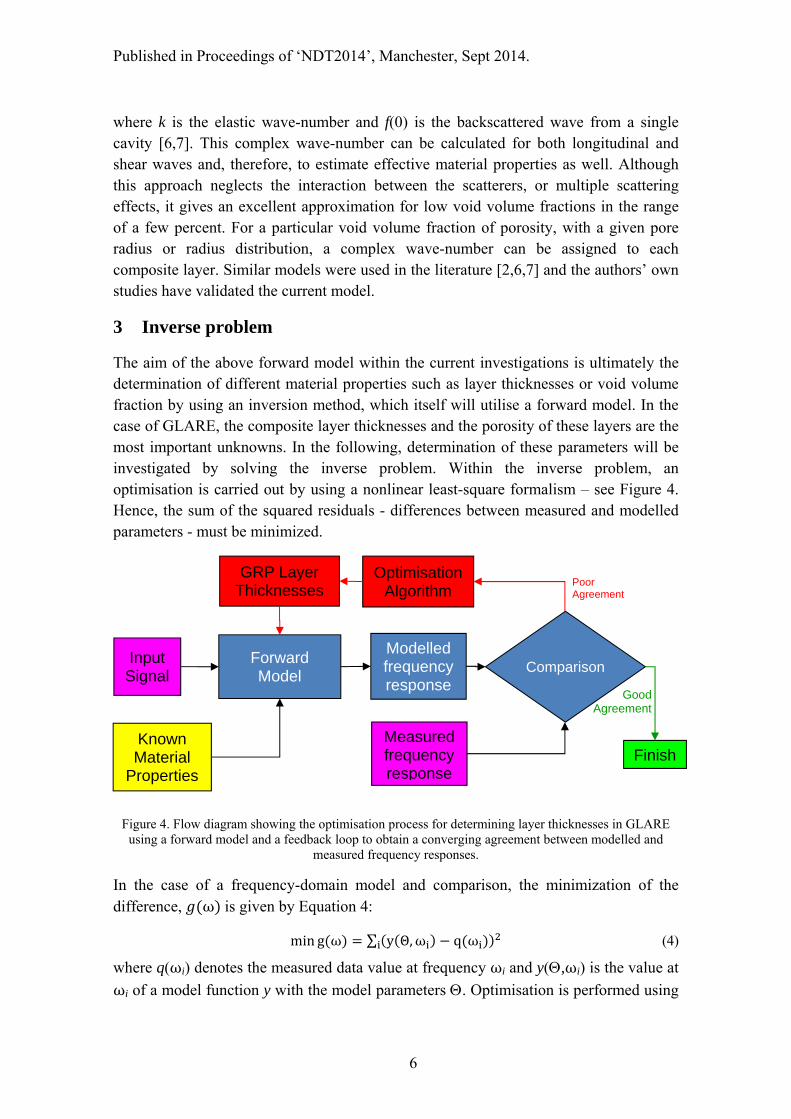
The aim of the above forward model within the current investigations is ultimately the determination of different material properties such as layer thicknesses or void volume fraction by using an inversion method, which itself will utilise a forward model. In the case of GLARE, the composite layer thicknesses and the porosity of these layers are the most important unknowns. In the following, determination of these parameters will be investigated by solving the inverse problem. Within the inverse problem, an optimisation is carried out by using a nonlinear least-square formalism – see Figure 4. Hence, the sum of the squared residuals - differences between measured and modelled parameters - must be minimized.
Figure 4. Flow diagram showing the optimisation process for determining layer thicknesses in GLARE using a forward model and a feedback loop to obtain a converging agreement between modelled and
measured frequency responses.
In the case of a frequency-domain model and comparison, the minimization of the difference, ω is given by Equation 4:
min g ω ∑ y Θ,ω q ω (4)
where q(ωi) denotes the measured data value at frequency ωi and y(,ωi) is the value at
ωi of a model function y with the model parameters . Optimisation is performed using
Forward Model
Modelled frequency response
Measured frequency response
Input Signal
Comparison
GRP Layer Thicknesses
Known Material
Properties Finish
Poor Agreement
Good Agreement
Optimisation Algorithm
Published in Proceedings of ‘NDT2014’, Manchester, Sept 2014.
7
the lsqnonlin (nonlinear least-square curve fit) function of the optimisation toolbox in Matlab.
The developed forward model was tested within an inverse problem. The optimization was carried out by minimizing the error in different parameters. First, the composite layer thicknesses were evaluated with several different numbers of layers (varying between four and ten) by assuming that thickness changes occur only in the composite layers but not in the aluminium layers – see Figure 5. In the second case, porosity was included. In the inverse problem, the porosity is described by two parameters - the radius and the void volume fraction - assuming that the pores (voids) are identical in size and shape (spherical). In this case, lay-ups with up to four composite layers are considered.
3.1 Generation of the data
The data points for the inverse problem – the response of the laminate - were generated by simulations using the forward model and then artificial noise was added to the signals at a level of 5%. These signals were then convolved with a simulated response of the transducer - a Gaussian-windowed pulse with a centre frequency of 10 MHz and a bandwidth of 5 MHz. The reflected laminate frequency responses are calculated up to 20 MHz in 1000 uniformly distributed frequency points.
3.2 Layer thickness mapping
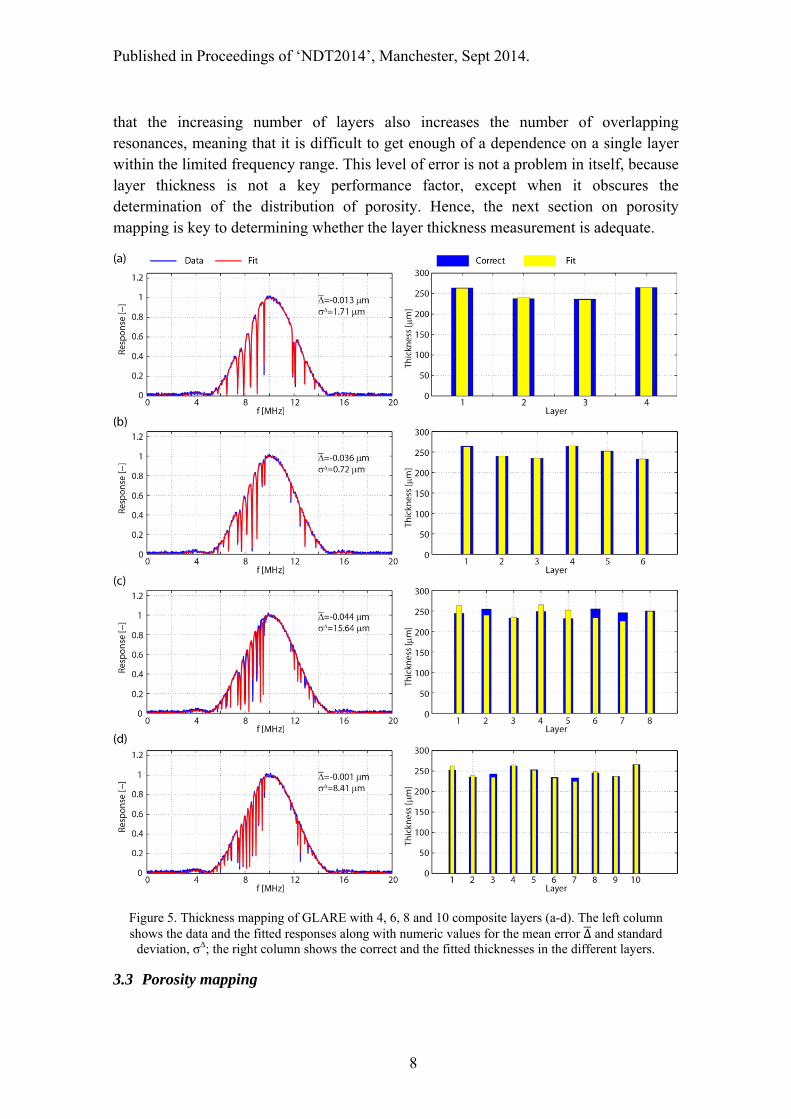
A numerically calculated frequency response, the reflected laminate response, is shown in Figure 3(b) for a laminate with 10 composite layers and 11 aluminium layers. The response possesses numerous resonance frequencies and a few ‘stop bands’ where most of the energy is reflected. To generate the simulated data points, similar frequency responses for 4, 6, 8 and 10 composite layers were calculated, multiplied by the transfer function of the transducer. For the investigation, it was assumed that the aluminium
layers are each fixed at 400 m thickness but that the composite layers show deviations
from the default 250 m thicknesses such that each layer is a slightly different thickness.
The quality of fit is defined by two parameters, the mean (Δ) and standard deviation
() of the distribution of the error in the fitted thickness. The results of the inverse problems are shown in Figure 5(a)-(d). The frequency responses with different numbers of composite layers (left column) show an increasing number of resonances and also a wide stop-band between approximately 10 and 12 MHz. The fitted thicknesses show a very good agreement with 4 and 6 composite layers; the mean value of the deviation is
less than ±0.1 m and the standard deviation of the error is less than 2 m. For the cases
with 8 and 10 composite layers, the standard deviations become larger, up to 16 m (7%). In addition, less pronounced resonances might disappear in the noise, making a unique identification of the resonance frequencies impossible. Another reason may be
Published in Proceedings of ‘NDT2014’, Manchester, Sept 2014.
8
that the increasing number of layers also increases the number of overlapping resonances, meaning that it is difficult to get enough of a dependence on a single layer within the limited frequency range. This level of error is not a problem in itself, because layer thickness is not a key performance factor, except when it obscures the determination of the distribution of porosity. Hence, the next section on porosity mapping is key to determining whether the layer thickness measurement is adequate.
Figure 5. Thickness mapping of GLARE with 4, 6, 8 and 10 composite layers (a-d). The left column shows the data and the fitted responses along with numeric values for the mean error Δ and standard
deviation, σΔ; the right column shows the correct and the fitted thicknesses in the different layers.
3.3 Porosity mapping
Published in Proceedings of ‘NDT2014’, Manchester, Sept 2014.
9
The estimation of the porosity is a more challenging task as the description of porosity requires more than one parameter for each layer. In the most general case, a particular distribution of radii must be assumed [2] since, in real samples, the voids are not necessarily identical but fall within a range of sizes. In fact the shape of voids also varies but, for the purposes of this work, they are assumed to be spherical. Hence, not
only the volume fraction but also further parameters such as the mean radius R must be evaluated. An assumption about the distribution of sizes could influence the accuracy of the void volume fraction determination, so it may be necessary to estimate the mean size or range of sizes first, followed by a determination of void volume fraction using the size information as part of the inverse problem.
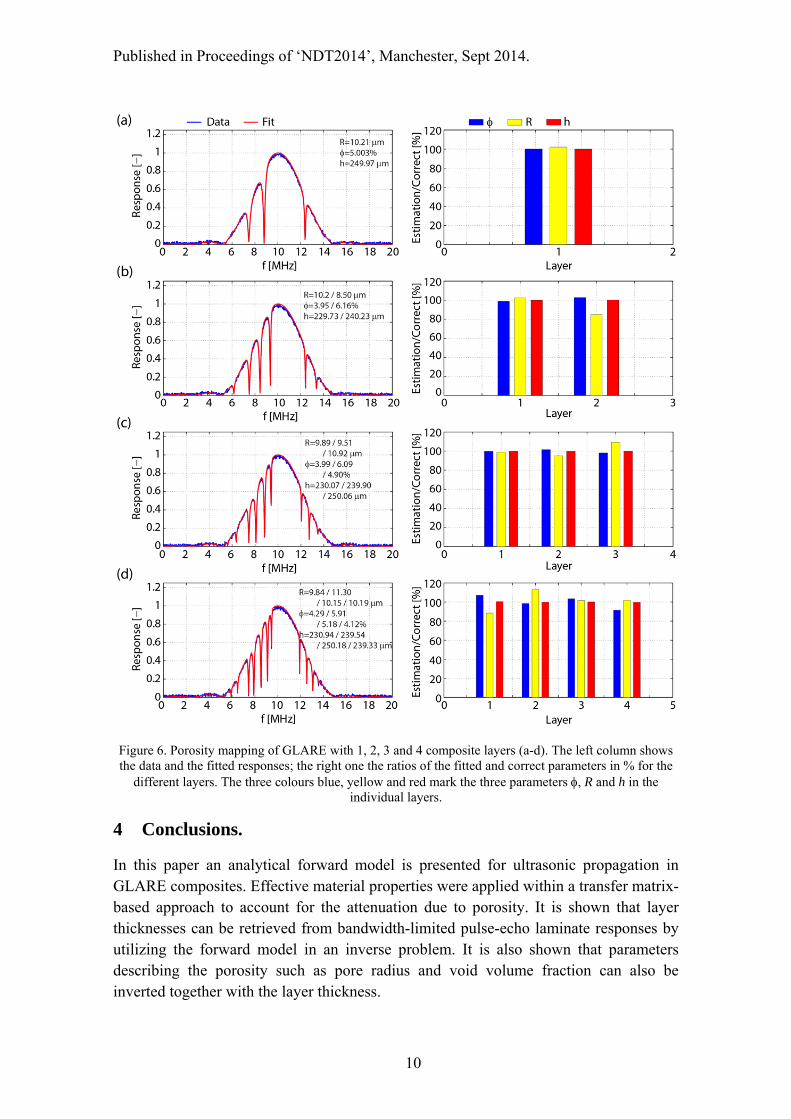
Four cases – lay-ups with composite layer numbers between one and four – were
studied. In all four cases identical cavities with R = 10 m radius were used with different void volume fractions and also the composite layer thickness was varied. Although real samples are composed of more than four composite layers, an initial demonstration of the ability to evaluate parameters describing the porosity is possible with fewer layers. For the inverse problem, three parameters were optimized: composite layer thickness h, radius of the cavities R and void volume fraction φ.
The estimated parameters and the comparison of the data and the fitted frequency response is shown in Figure 6. In the last case (Figure 6(d)) with four layers, the number of independent variables is already 12; hence, more than in the case with ten layers in the previous subsection. The results in Figure 6 are shown as the ratios of the correct values and the fitted parameters. The diagrams demonstrate that the optimum fitted thicknesses approximate the initial values very well; the errors remain below 1% for
each case. The parameters which describe the porosity, the volume fraction and the cavity radius R, on the other hand, show much stronger deviations from the true values. The estimated radius R deviated from the correct value as much as ±15% for just two composite layers, with a similar behaviour for an increasing number of layers. The void
volume fraction, shows smaller deviations of less than ±10%; nonetheless, it is less accurate than the measurement of thickness.
The results demonstrate that the non-destructive 3D characterisation of the composite layers in GLARE is possible by using ultrasonic pulse-echo methods and inverse problems. The characterisation was done through the evaluation of the layer thicknesses and parameters describing the porosity within the layers. The results also demonstrate the limitations of the method as the determination of the porosity is significantly more difficult than the layer thicknesses resulting in higher errors than for estimated thicknesses.
Published in Proceedings of ‘NDT2014’, Manchester, Sept 2014.
10
Figure 6. Porosity mapping of GLARE with 1, 2, 3 and 4 composite layers (a-d). The left column shows the data and the fitted responses; the right one the ratios of the fitted and correct parameters in % for the
different layers. The three colours blue, yellow and red mark the three parameters , R and h in the individual layers.
4 Conclusions.
In this paper an analytical forward model is presented for ultrasonic propagation in GLARE composites. Effective material properties were applied within a transfer matrix-based approach to account for the attenuation due to porosity. It is shown that layer thicknesses can be retrieved from bandwidth-limited pulse-echo laminate responses by utilizing the forward model in an inverse problem. It is also shown that parameters describing the porosity such as pore radius and void volume fraction can also be inverted together with the layer thickness.
Published in Proceedings of ‘NDT2014’, Manchester, Sept 2014.
11
The presented work has therefore indicated that, by using an elastic forward model with an effective-medium approach, the 3D characterization of GLARE composite should be possible.
Other effects such as fibre volume fraction changes with composite-layer thickness still need to be included in the model but these are not parameters requiring optimisation. A realistic pore-radius distribution is also required, allowing the estimation of the smallest and largest radii within the sample and potentially improving the estimation of void volume fraction.
Acknowledgments Support is acknowledged from an ongoing research program of the Engineering and Physical Sciences Research Council EPSRC (EP/K037315/1) and the FWF Austrian Science Fund (P26162). The Authors gratefully acknowledge the help of Dr Mihai Caleap, Prof Paul Wilcox and Prof Bruce Drinkwater for valuable discussions.
References 1. I A Veres, M B Sayir, ‘Wave propagation in a wooden bar’, Ultrasonics, Vol. 42,
No. 1–9, pp. 495-499, April 2004. 2. B Ghaffari, G Mozurkewich L A Godlewski and J W Zindel, 'Ultrasonic
characterization of shrinkage microporosity in aluminum castings', Ultrasonics, Vol. 41 No. 9, pp. 699-707, 2004.
3. J. Gubernatis, E. Domany, 'Effects of microstructure on the speed and attenuation of elastic waves in porous materials', Wave Motion, Vol. 6, No. 6, pp. 579-589, 1984.
4. L Adler, J H Rose, C Mobley, 'Ultrasonic method to determine gas porosity in aluminum alloy castings: Theory and experiment', J. Appl. Phys. Vol. 59, No. 2, pp. 336-347, 1986.
5. M Caleap, B W Drinkwater, P D Wilcox, 'Modelling wave propagation through creep damaged material', NDT & E International Vol. 44, No. 5, pp. 456-462, 2011.
6. V J Pinfeld, R E Challis, R A Smith, 'A comparison of stochastic and effective medium approaches to the backscattered signal from a porous layer in a solid matrix', J. Acoust. Soc. Am., Vol. 130, No. 1, pp. 122-134, 2011.
7. V J Pinfeld, R E Challis, 'Modelling the backscatter from spherical cavities in a solid matrix: Can an effective medium layer model mimic the scattering response?’ J. Phys.: Conf. Ser. Vol. 269, No. 1, Paper 012016, 2011.
8. W Huang, and Y J Wang, and S L Rokhlin, ‘Oblique scattering of an elastic wave from a multilayered cylinder in a solid. Transfer matrix approach’, J. Acoust. Soc. Am., Vol. 99, pp. 2742-2754, 1996.
9. L Wang, S I Rokhlin, ‘Stable reformulation of transfer matrix method for wave propagation in layered anisotropic media’, Ultrasonics, Vol. 39, No. 6, pp. 413-424, 2001.