Embed Size (px)
Citation preview
Seediscussions,stats,andauthorprofilesforthispublicationat:https://www.researchgate.net/publication/318317796
TowardsaHolisticApproachtoLow-EnergyBuildingDesign:ConsequencesofMetricsforEvaluationofSpatial...
ConferencePaper·July2017
CITATION
1
READS
174
4authors,including:
Someoftheauthorsofthispublicationarealsoworkingontheserelatedprojects:
Energyrenovationofsocialhousingunits-addedvaluethrougharchitecturaltransformationView
project
PerformanceSimulationandInformationflowinBuildingInformationModelsViewproject
PilBrixPurup
NIRASA/SandAarhsUniversity
7PUBLICATIONS2CITATIONS
SEEPROFILE
StinaRaskJensen
AarhusUniversity
4PUBLICATIONS2CITATIONS
SEEPROFILE
SteffenPetersen
AarhusUniversity
44PUBLICATIONS198CITATIONS
SEEPROFILE
AllcontentfollowingthispagewasuploadedbySteffenPetersenon10July2017.
Theuserhasrequestedenhancementofthedownloadedfile.
Towards a Holistic Approach to Low-Energy Building Design: Consequences of Metrics for Evaluation of Spatial Quality on Design Pil Brix Purup1,2, Stina Rask Jensen2,3, Steffen Petersen2 and Poul Henning Kirkegaard2 1 NIRAS A/S, Aarhus, Denmark, [email protected] 2 Department of Engineering, Aarhus University, Aarhus, Denmark, [email protected] 3 Aart Architects, Aarhus, Denmark
Abstract: Multiple and sometimes conflicting design aspects such as energy efficiency, architectural quality and environmental comfort for occupant satisfaction need to be addressed simultaneously when designing low-energy buildings holistically. However, the technical and thereby measureable qualities has a tendency to overrule the softer values, why recent research aims to transform spatial qualities into quantitative metrics, in order to support a more equal dialogue among multiple stakeholders. This paper presents a computational building model in which the ability to simulate the performance of two architectural metrics for evaluating spatial quality were implemented concerning (1) View-Out Quality and (2) Degree of Privacy, alongside with a tool for daylight and thermal performance simulations. The model was used in a case study in Aarhus, Denmark, where design of a facade for a living room in a senior dwelling was conducted, in order to illustrate how the new set of measurable architectural metrics may instigate a more qualified and holistic discussion on feasible trade-offs between energy use, daylight level, thermal indoor climate, and spatial quality (i.e. the notion of degree of view and privacy) in the design process. Keywords: Building Performance Evaluation, Low-Energy Design, Computational Design Model, Spatial Quality, Indoor climate,
Introduction
A holistic approach to design low-energy buildings requires considerations regarding quantitative performance indicators such as energy efficiency, daylight level, and thermal comfort, as well as qualities such as architectural aesthetics, privacy, view to the outside, and room composition. However, the quantitative aspects have a tendency to overrule qualitative issues and thereby dominate the solutions (Petersen et al, 2014). To instigate a more equal dialogue on trade-offs between quantitative and qualitative aspects, recent research discus research-based efforts for transforming spatial qualities into measureable quantitative metrics (Jensen et al, 2017). In this paper we have further developed two of these metrics: (1) view quality through windows and (2) privacy, and translated them into a computational procedure. The metrics were applied in a case study of a dwelling renovation project in Aarhus, Denmark, alongside performance evaluation of daylight, energy efficiency
and thermal comfort to illustrate potential design consequences of introducing the new metrics. It is not our intention to substitute any qualitative dialogue by introducing measurable metrics, but rather to support the argumentation and amplify spatial qualities as an important aspect of holistic building design; as suggested by Jensen et al (2017), some important qualities may be lost when quantified.
Method
Metrics for Evaluation of Spatial Quality
The spatial qualities view quality through windows and privacy is – among other qualities in architecture – discussed by Jensen et al (2017), who find that the indicators developed by Acre and Wyckmans (2014) is currently the best proposal for quantifiable metrics related to spatial quality. These indicators are based on a schematic with yes/no-checkboxes combined with a calculation of view-angles in a specific direction and location of the room. In the following, we modify the definition of these principles and present a new computational calculation procedure for estimating what we define View-Out Quality and Degree of Privacy.
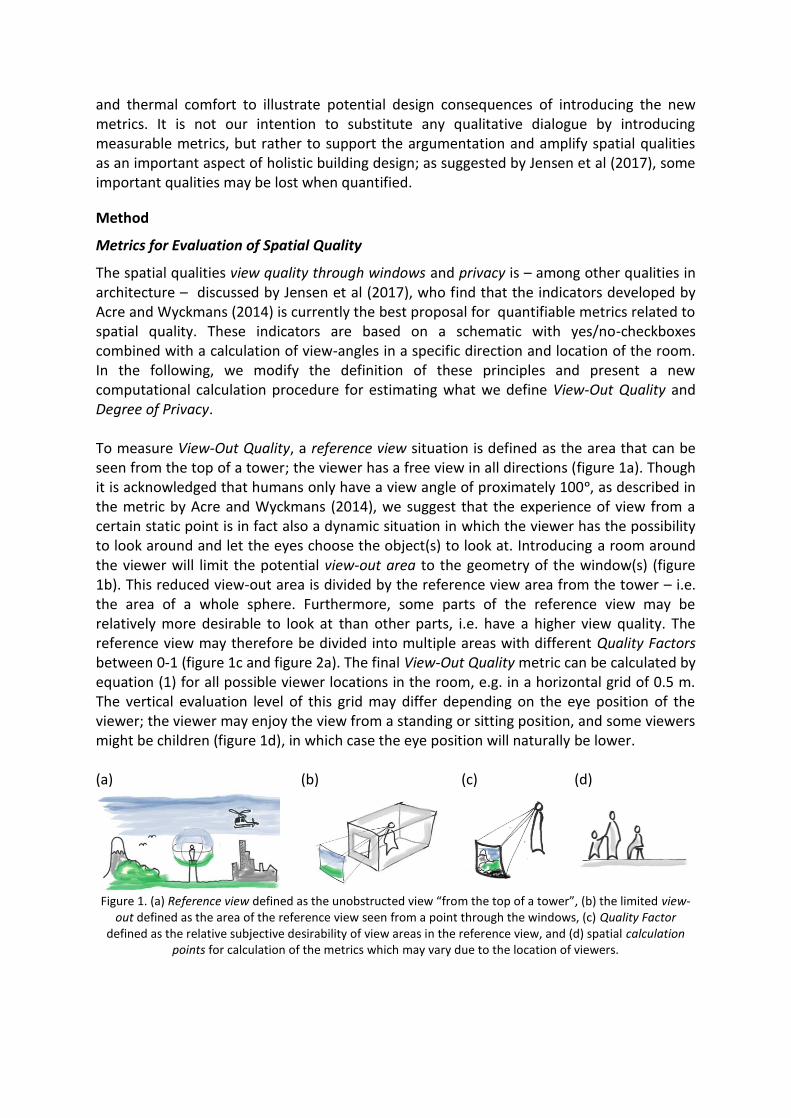
To measure View-Out Quality, a reference view situation is defined as the area that can be seen from the top of a tower; the viewer has a free view in all directions (figure 1a). Though it is acknowledged that humans only have a view angle of proximately 100ᵒ, as described in the metric by Acre and Wyckmans (2014), we suggest that the experience of view from a certain static point is in fact also a dynamic situation in which the viewer has the possibility to look around and let the eyes choose the object(s) to look at. Introducing a room around the viewer will limit the potential view-out area to the geometry of the window(s) (figure 1b). This reduced view-out area is divided by the reference view area from the tower – i.e. the area of a whole sphere. Furthermore, some parts of the reference view may be relatively more desirable to look at than other parts, i.e. have a higher view quality. The reference view may therefore be divided into multiple areas with different Quality Factors between 0-1 (figure 1c and figure 2a). The final View-Out Quality metric can be calculated by equation (1) for all possible viewer locations in the room, e.g. in a horizontal grid of 0.5 m. The vertical evaluation level of this grid may differ depending on the eye position of the viewer; the viewer may enjoy the view from a standing or sitting position, and some viewers might be children (figure 1d), in which case the eye position will naturally be lower.
(a) (b) (c) (d)
Figure 1. (a) Reference view defined as the unobstructed view “from the top of a tower”, (b) the limited view-out defined as the area of the reference view seen from a point through the windows, (c) Quality Factor
defined as the relative subjective desirability of view areas in the reference view, and (d) spatial calculation points for calculation of the metrics which may vary due to the location of viewers.
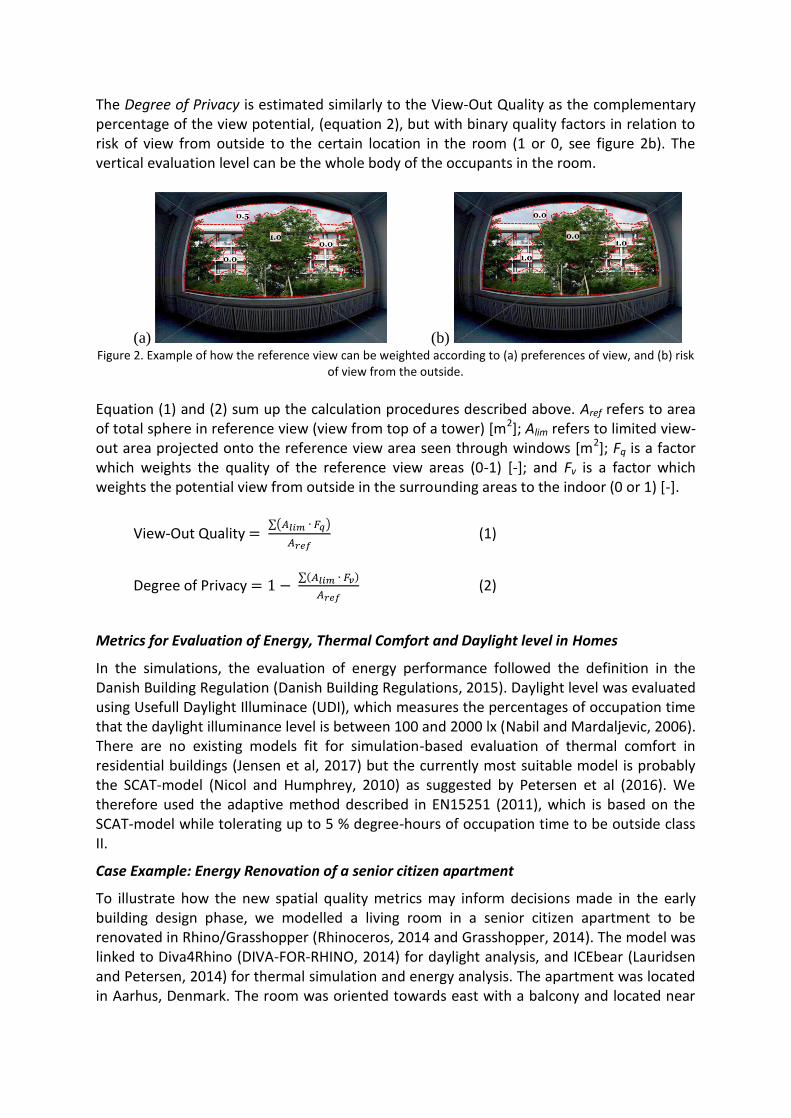
The Degree of Privacy is estimated similarly to the View-Out Quality as the complementary percentage of the view potential, (equation 2), but with binary quality factors in relation to risk of view from outside to the certain location in the room (1 or 0, see figure 2b). The vertical evaluation level can be the whole body of the occupants in the room.
(a) (b) Figure 2. Example of how the reference view can be weighted according to (a) preferences of view, and (b) risk
of view from the outside.
Equation (1) and (2) sum up the calculation procedures described above. Aref refers to area of total sphere in reference view (view from top of a tower) [m2]; Alim refers to limited view-out area projected onto the reference view area seen through windows [m2]; Fq is a factor which weights the quality of the reference view areas (0-1) [-]; and Fv is a factor which weights the potential view from outside in the surrounding areas to the indoor (0 or 1) [-].
View-Out Quality = ∑(𝐴𝑙𝑖𝑚 ∙ 𝐹𝑞)
𝐴𝑟𝑒𝑓 (1)
Degree of Privacy = 1 − ∑(𝐴𝑙𝑖𝑚 ∙ 𝐹𝑣)
𝐴𝑟𝑒𝑓 (2)
Metrics for Evaluation of Energy, Thermal Comfort and Daylight level in Homes
In the simulations, the evaluation of energy performance followed the definition in the Danish Building Regulation (Danish Building Regulations, 2015). Daylight level was evaluated using Usefull Daylight Illuminace (UDI), which measures the percentages of occupation time that the daylight illuminance level is between 100 and 2000 lx (Nabil and Mardaljevic, 2006). There are no existing models fit for simulation-based evaluation of thermal comfort in residential buildings (Jensen et al, 2017) but the currently most suitable model is probably the SCAT-model (Nicol and Humphrey, 2010) as suggested by Petersen et al (2016). We therefore used the adaptive method described in EN15251 (2011), which is based on the SCAT-model while tolerating up to 5 % degree-hours of occupation time to be outside class II.
Case Example: Energy Renovation of a senior citizen apartment
To illustrate how the new spatial quality metrics may inform decisions made in the early building design phase, we modelled a living room in a senior citizen apartment to be renovated in Rhino/Grasshopper (Rhinoceros, 2014 and Grasshopper, 2014). The model was linked to Diva4Rhino (DIVA-FOR-RHINO, 2014) for daylight analysis, and ICEbear (Lauridsen and Petersen, 2014) for thermal simulation and energy analysis. The apartment was located in Aarhus, Denmark. The room was oriented towards east with a balcony and located near
the south gable wall of the building. To chill the room, the occupants may increase natural ventilation by openings estimated according to the method described in SBI202 (2002) as implemented in ICEbear by Purup and Petersen (2016). Sensible heat load of occupants was estimated according to Fangers PMV model using clothing and activity level as well as air temperature of last hour. Since users in dwellings will adapt their clothing, this was estimated as binary hysteresis between 22 ᵒC (Apply sweatshirt: 1.0 clo) and 24 ᵒC (Take off Sweatshirt: 0.5 clo). See figure 3 and table 1 for further details.
The calculation procedures for the two spatial quality metrics were modelled with a C#-script in grasshopper which used a ray-trace model for approximation of view angles. Calculation points were distributed in a grid of 0.5 m at 1.8 m above floor level, i.e. as eye level of a standing person. A scenario with and without quality factors added to reference view was calculated.
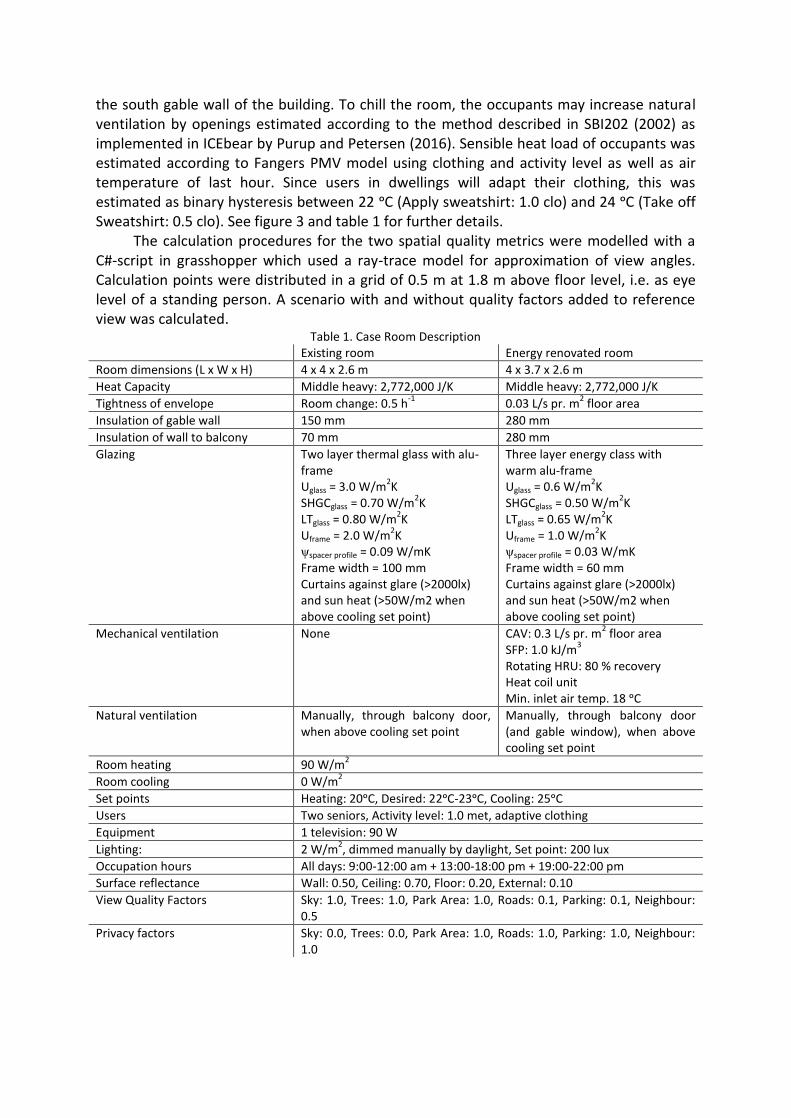
Table 1. Case Room Description Existing room Energy renovated room
Room dimensions (L x W x H) 4 x 4 x 2.6 m 4 x 3.7 x 2.6 m
Heat Capacity Middle heavy: 2,772,000 J/K Middle heavy: 2,772,000 J/K
Tightness of envelope Room change: 0.5 h-1
0.03 L/s pr. m2 floor area
Insulation of gable wall 150 mm 280 mm
Insulation of wall to balcony 70 mm 280 mm
Glazing Two layer thermal glass with alu-frame Uglass = 3.0 W/m
2K
SHGCglass = 0.70 W/m2K
LTglass = 0.80 W/m2K
Uframe = 2.0 W/m2K
ψspacer profile = 0.09 W/mK Frame width = 100 mm Curtains against glare (>2000lx) and sun heat (>50W/m2 when above cooling set point)
Three layer energy class with warm alu-frame Uglass = 0.6 W/m
2K
SHGCglass = 0.50 W/m2K
LTglass = 0.65 W/m2K
Uframe = 1.0 W/m2K
ψspacer profile = 0.03 W/mK Frame width = 60 mm Curtains against glare (>2000lx) and sun heat (>50W/m2 when above cooling set point)
Mechanical ventilation None CAV: 0.3 L/s pr. m2 floor area
SFP: 1.0 kJ/m3
Rotating HRU: 80 % recovery Heat coil unit Min. inlet air temp. 18 ᵒC
Natural ventilation Manually, through balcony door, when above cooling set point
Manually, through balcony door (and gable window), when above cooling set point
Room heating 90 W/m2
Room cooling 0 W/m2
Set points Heating: 20ᵒC, Desired: 22ᵒC-23ᵒC, Cooling: 25ᵒC
Users Two seniors, Activity level: 1.0 met, adaptive clothing
Equipment 1 television: 90 W
Lighting: 2 W/m2, dimmed manually by daylight, Set point: 200 lux
Occupation hours All days: 9:00-12:00 am + 13:00-18:00 pm + 19:00-22:00 pm
Surface reflectance Wall: 0.50, Ceiling: 0.70, Floor: 0.20, External: 0.10
View Quality Factors Sky: 1.0, Trees: 1.0, Park Area: 1.0, Roads: 0.1, Parking: 0.1, Neighbour: 0.5
Privacy factors Sky: 0.0, Trees: 0.0, Park Area: 1.0, Roads: 1.0, Parking: 1.0, Neighbour: 1.0
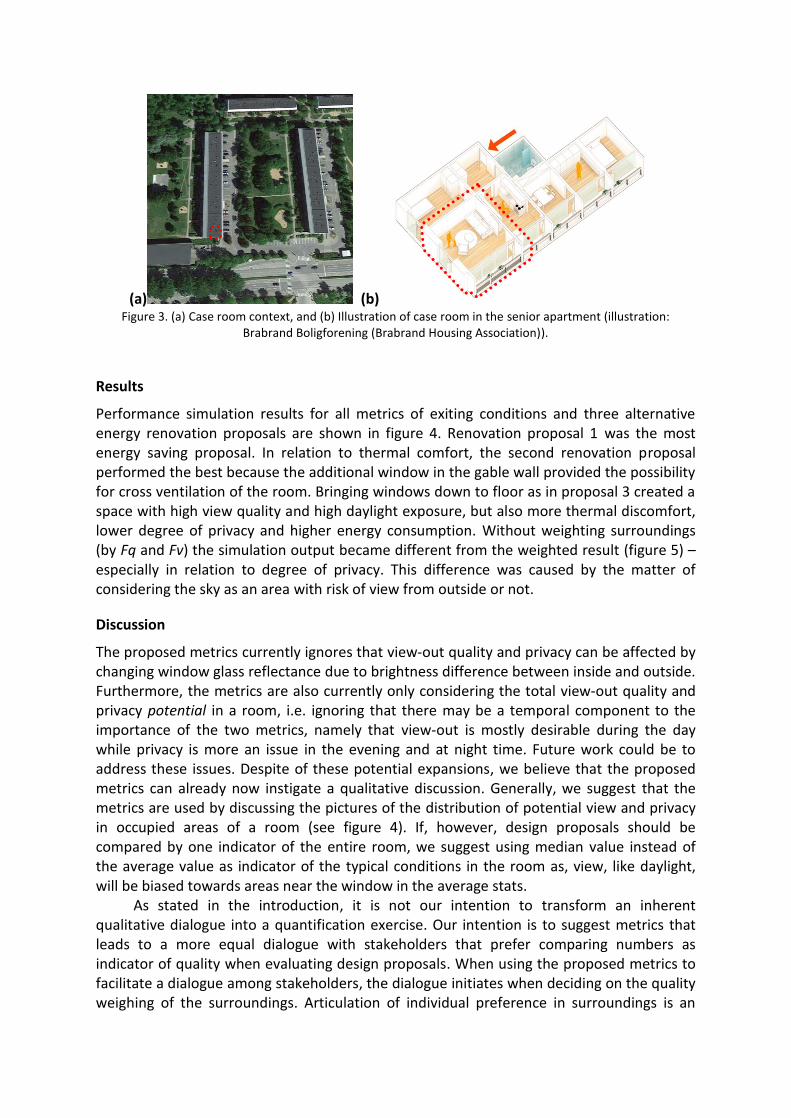
(a) (b) Figure 3. (a) Case room context, and (b) Illustration of case room in the senior apartment (illustration:
Brabrand Boligforening (Brabrand Housing Association)).
Results
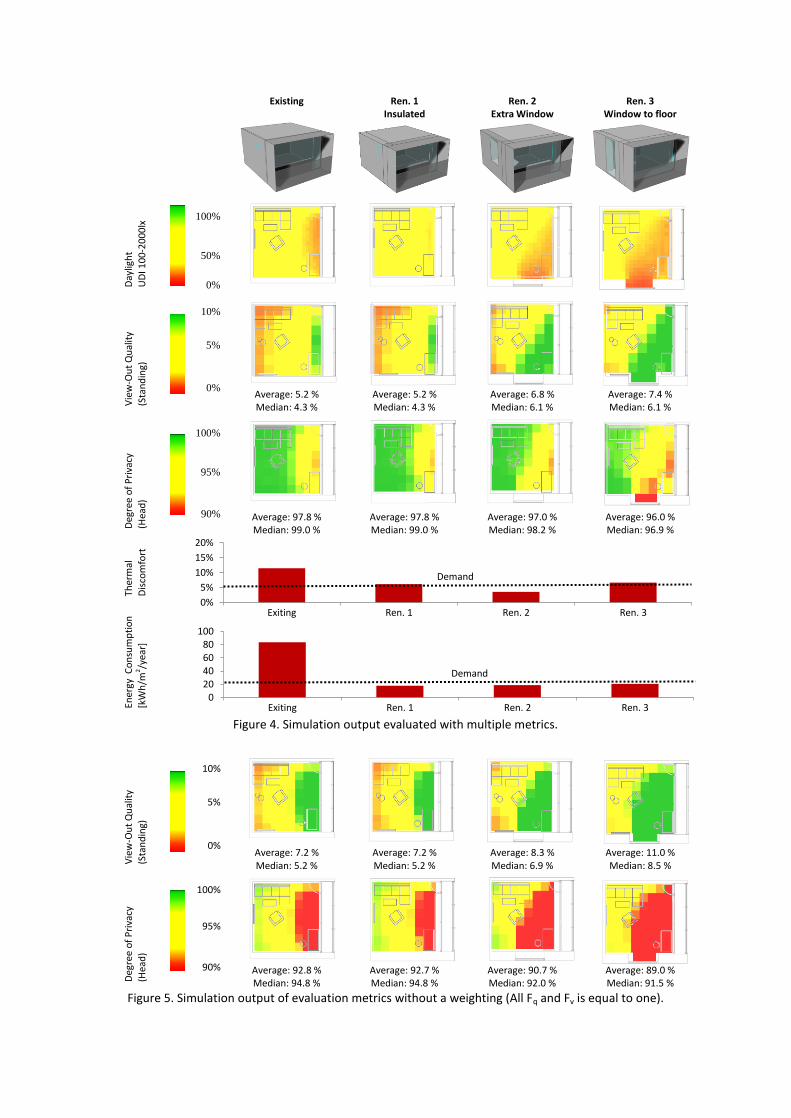
Performance simulation results for all metrics of exiting conditions and three alternative energy renovation proposals are shown in figure 4. Renovation proposal 1 was the most energy saving proposal. In relation to thermal comfort, the second renovation proposal performed the best because the additional window in the gable wall provided the possibility for cross ventilation of the room. Bringing windows down to floor as in proposal 3 created a space with high view quality and high daylight exposure, but also more thermal discomfort, lower degree of privacy and higher energy consumption. Without weighting surroundings (by Fq and Fv) the simulation output became different from the weighted result (figure 5) – especially in relation to degree of privacy. This difference was caused by the matter of considering the sky as an area with risk of view from outside or not.
Discussion
The proposed metrics currently ignores that view-out quality and privacy can be affected by changing window glass reflectance due to brightness difference between inside and outside. Furthermore, the metrics are also currently only considering the total view-out quality and privacy potential in a room, i.e. ignoring that there may be a temporal component to the importance of the two metrics, namely that view-out is mostly desirable during the day while privacy is more an issue in the evening and at night time. Future work could be to address these issues. Despite of these potential expansions, we believe that the proposed metrics can already now instigate a qualitative discussion. Generally, we suggest that the metrics are used by discussing the pictures of the distribution of potential view and privacy in occupied areas of a room (see figure 4). If, however, design proposals should be compared by one indicator of the entire room, we suggest using median value instead of the average value as indicator of the typical conditions in the room as, view, like daylight, will be biased towards areas near the window in the average stats.
As stated in the introduction, it is not our intention to transform an inherent qualitative dialogue into a quantification exercise. Our intention is to suggest metrics that leads to a more equal dialogue with stakeholders that prefer comparing numbers as indicator of quality when evaluating design proposals. When using the proposed metrics to facilitate a dialogue among stakeholders, the dialogue initiates when deciding on the quality weighing of the surroundings. Articulation of individual preference in surroundings is an
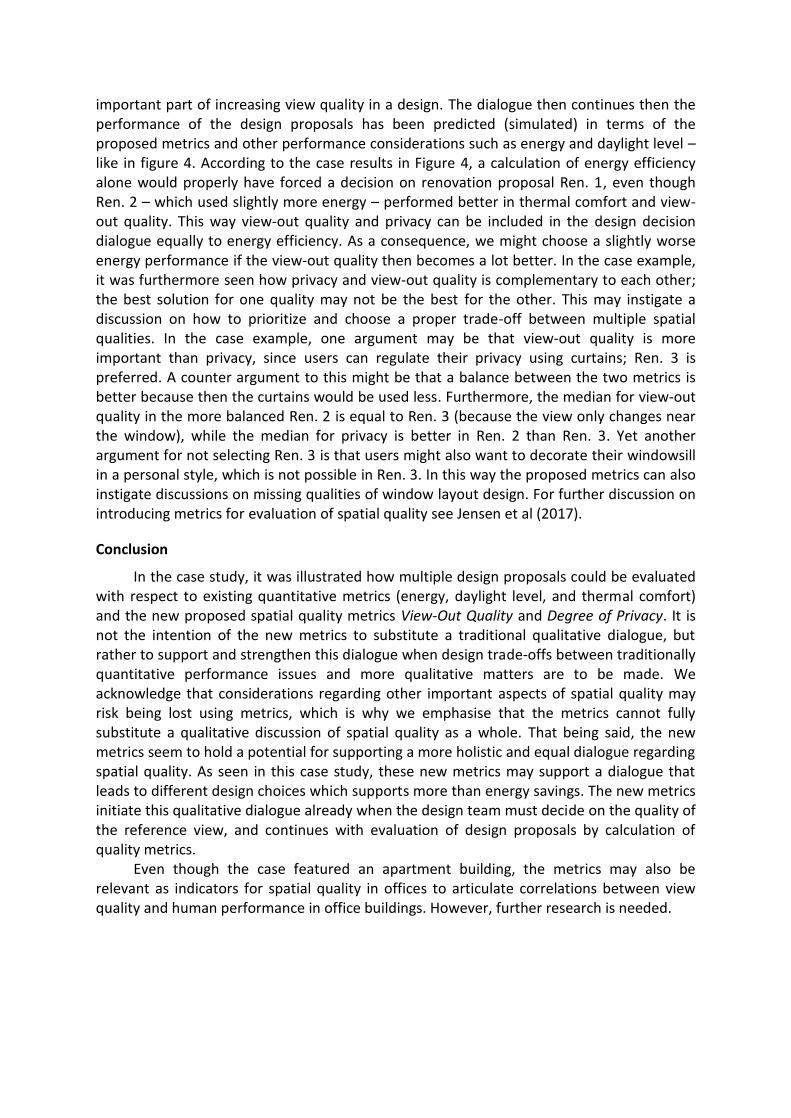
important part of increasing view quality in a design. The dialogue then continues then the performance of the design proposals has been predicted (simulated) in terms of the proposed metrics and other performance considerations such as energy and daylight level – like in figure 4. According to the case results in Figure 4, a calculation of energy efficiency alone would properly have forced a decision on renovation proposal Ren. 1, even though Ren. 2 – which used slightly more energy – performed better in thermal comfort and view-out quality. This way view-out quality and privacy can be included in the design decision dialogue equally to energy efficiency. As a consequence, we might choose a slightly worse energy performance if the view-out quality then becomes a lot better. In the case example, it was furthermore seen how privacy and view-out quality is complementary to each other; the best solution for one quality may not be the best for the other. This may instigate a discussion on how to prioritize and choose a proper trade-off between multiple spatial qualities. In the case example, one argument may be that view-out quality is more important than privacy, since users can regulate their privacy using curtains; Ren. 3 is preferred. A counter argument to this might be that a balance between the two metrics is better because then the curtains would be used less. Furthermore, the median for view-out quality in the more balanced Ren. 2 is equal to Ren. 3 (because the view only changes near the window), while the median for privacy is better in Ren. 2 than Ren. 3. Yet another argument for not selecting Ren. 3 is that users might also want to decorate their windowsill in a personal style, which is not possible in Ren. 3. In this way the proposed metrics can also instigate discussions on missing qualities of window layout design. For further discussion on introducing metrics for evaluation of spatial quality see Jensen et al (2017).
Conclusion
In the case study, it was illustrated how multiple design proposals could be evaluated with respect to existing quantitative metrics (energy, daylight level, and thermal comfort) and the new proposed spatial quality metrics View-Out Quality and Degree of Privacy. It is not the intention of the new metrics to substitute a traditional qualitative dialogue, but rather to support and strengthen this dialogue when design trade-offs between traditionally quantitative performance issues and more qualitative matters are to be made. We acknowledge that considerations regarding other important aspects of spatial quality may risk being lost using metrics, which is why we emphasise that the metrics cannot fully substitute a qualitative discussion of spatial quality as a whole. That being said, the new metrics seem to hold a potential for supporting a more holistic and equal dialogue regarding spatial quality. As seen in this case study, these new metrics may support a dialogue that leads to different design choices which supports more than energy savings. The new metrics initiate this qualitative dialogue already when the design team must decide on the quality of the reference view, and continues with evaluation of design proposals by calculation of quality metrics.
Even though the case featured an apartment building, the metrics may also be relevant as indicators for spatial quality in offices to articulate correlations between view quality and human performance in office buildings. However, further research is needed.
Existing
Ren. 1 Insulated
Ren. 2 Extra Window
Ren. 3 Window to floor
Day
ligh
t
UD
I 10
0-2
00
0lx
100%
50%
0%
Vie
w-O
ut
Qu
alit
y
(Sta
nd
ing)
10%
5%
0% Average: 5.2 % Median: 4.3 %
Average: 5.2 % Median: 4.3 %
Average: 6.8 % Median: 6.1 %
Average: 7.4 % Median: 6.1 %
Deg
ree
of
Pri
vacy
(Hea
d)
100%
95%
90% Average: 97.8 % Median: 99.0 %
Average: 97.8 % Median: 99.0 %
Average: 97.0 % Median: 98.2 %
Average: 96.0 % Median: 96.9 %
Ther
mal
Dis
com
fort
Ener
gy C
on
sum
pti
on
[kW
h/m
2 /yea
r]
Figure 4. Simulation output evaluated with multiple metrics.
Vie
w-O
ut
Qu
alit
y
(Sta
nd
ing)
10%
5%
0% Average: 7.2 % Median: 5.2 %
Average: 7.2 % Median: 5.2 %
Average: 8.3 % Median: 6.9 %
Average: 11.0 % Median: 8.5 %
Deg
ree
of
Pri
vacy
(Hea
d)
100%
95%
90% Average: 92.8 % Median: 94.8 %
Average: 92.7 % Median: 94.8 %
Average: 90.7 % Median: 92.0 %
Average: 89.0 % Median: 91.5 %
Figure 5. Simulation output of evaluation metrics without a weighting (All Fq and Fv is equal to one).
0%
5%
10%
15%
20%
Exiting Ren. 1 Ren. 2 Ren. 3
Demand
020406080
100
Exiting Ren. 1 Ren. 2 Ren. 3
Demand
Acknowledgement
The authors gratefully appreciate the funding for this study provided by the NIRAS ALECTIA Foundation, the industrial Ph.D. programme at Innovation Fund Denmark and the Danish research project REVALUE. The residential used as case example is owned by Brabrand Boligforening (In Danish).
References
Acre, F. & Wyckmans, A. (2014). Dwelling renovation and spatial quality, the impact of the dwelling renovation on spatial quality determinants. International Journal of Sustainable Built Environment 4 (2015), 12-41.
Aggerholm, S. & Andersen, K.T. & Heiselberg, P. (2002). SBI 202: Naturlig ventilation i erhvervsbygninger (in Danish), SBI Hørsholm, Denmark,
Danish Building Regulations (BR15). (2015) Copenhagen: The Danish Ministry of Economic and Business Affairs.
DIVA-for-Rhino (2014) Solemma, US, http://diva4rhino.com/ EN 15251. (2007) Indoor environment input parameters for design and assessment of energy
performance of building-addressing indoor air quality, thermal environment, lighting and acoustics. Grasshopper (2014) Scott Davidson, US, http://www.grasshopper3d.com/ Jensen, S.R. & Purup, P.B. & Kirkegaard, P.H. & Petersen, S. (2017). Towards a Holistic Approach to Low-
Energy Building Design: Introducing Metrics for Evaluation of Spatial Quality. In: editor of organisation, The 33rd International Conference on Passive and Low Energy Architecture. Edinburgh, 3.-5. July 2017, PLEA 2017
Lauridsen, P. & Petersen, S. (2014). Integrating Indoor Climate, Daylight and Energy Simulations in Parametric Models and Performance-Based Design. In: L.B. Jensen and M.K. Thomsen, Proceedings of the 3rd International Workshop on Design in Civil and Environmental Engineering Volume: 1, At Kgs. Lyngby, Denmark, 21-23 August 2014, DTU
Nabil, A. & Mardaljevic, J. 2006. Useful daylight illuminances: A replacement for daylight factors. Energy and Buildings, 38, 905-913.
Nicol, F. & Humphreys, M. (2008). Derivation of the adaptive equations for thermal comfort in free-running buildings in European standard EN15251. Building and Environment, 45 (2010), 11-17.
Petersen, S. & Bryder, J. & Levinsen, K. & Strunge, J. (2014). Method for Integrating Simulation-Based Support in the Building Design Process. In: L.B. Jensen and M.K. Thomsen, Proceedings of the 3rd International Workshop on Design in Civil and Environmental Engineering Volume: 1, At Kgs. Lyngby, Denmark, 21-23 August 2014, DTU
Petersen, S. & Clausen, A.H. & Knudsen, L.D.S. (2016), Investigating the Ability of Prevailing Thermal Comfort Models to Predict Thermal Comfort inn Homes. In: P. Heiselberg, CLIMA Conference 2016. Aalborg, 23.-25. Maj 2016, Aalborg University
Purup, P.B. & Petersen, S. (2016). Simulation of Natural Ventilation in the Early Design of Near Zero Energy Buildings. In: P. Heiselberg, CLIMA Conference 2016. Aalborg, 23.-25. Maj 2016, Aalborg University
Rhinoseros (2014) Robert McNeel & Associates, US, http://www.rhino3d.com/
View publication statsView publication stats