Embed Size (px)
Citation preview

TOWARDS AN ANALYTICAL FRAMEWORK FORPRIVACY-PRESERVING AGGREGATION IN SMART GRID
A Thesis byNavid Reza Alamatsaz
Bachelor of Science, University of Isfahan, 2011
Submitted to the Department of Electrical Engineering and Computer Science and the faculty of the Graduate School of
Wichita State Universityin partial fulfillment of
the requirements for the degree ofMaster of Science
May 2014

c© Copyright 2014 by Navid Reza Alamatsaz
All Rights Reserved

TOWARDS AN ANALYTICAL FRAMEWORK FORPRIVACY-PRESERVING AGGREGATION IN SMART GRID
The following faculty members have examined the final copy of this thesis for form and content, and recommend that it be accepted in partial fulfillment of the requirement for the degree of Master of Science with a major in Computer Networking.
Murtuza Jadliwala, Committee Chair
Vinod Namboodiri , Committee Member
Davood Askari, Committee Member
iii

DEDICATION
To my loving parents for their endless support and patience, and for the sacrifices they had to make in life for me; and all my admirable teachers for their priceless knowledge and grateful support.
iv

v
ABSTRACT
Recent changes to the power grid are expected to influence the way energy is provided and
consumed by customers. Advanced Metering Infrastructure (AMI) is a tool to incorporate these
changes for modernizing the electricity grid. However, this information-based power grid can
reveal sensitive private information from the user’s perspective as it can gather highly-granular
power consumption data. This has led to limited consumer acceptance and proliferation of the
smart grid. Hence, it is crucial to design a mechanism to prevent the leakage of such sensitive
consumer usage information. Among different solutions for preserving consumer privacy in
Smart Grid Networks (SGN), private data aggregation techniques have received a tremendous
focus from security researches. In this work, a novel and efficient CDMA-based approach to
privacy-preserving aggregation in SGNs, utilizing random perturbation of power consumption
data, with limited use of traditional cryptography has been presented. The efficiency and
performance of the proposed privacy-preserving data aggregation scheme is evaluated and
validated through extensive statistical analyses and simulations. In the past few years, only
limited work has been done on quantifying the privacy leakage of the smart grid due to the
deployment of the smart meters. The goal of such quantification is to provide a formal
framework to show how much privacy is lost in smart metering systems and to what extent the
proposed solutions reduce this loss of privacy. As a second research direction, we study the
existing metrics for quantifying privacy in various domains. Then, we present four information
theoretic metrics to represent the privacy gained by utilizing different Smart grid Privacy
Preserving Mechanisms (SPPMs). We investigate the applicability of the theory of information
entropy as a potential privacy metric and suggest using conditional entropy, joint entropy, and
relative entropy to further analyze the privacy-leakage in smart metering systems.
TABLE OF CONTENTS
Chapter Page
1. WHAT IS SMART GRID AND WHY IS SECURITY IN SMARTGRID IMPORTANT? . . . . . . . . . . . . . . . . . . . . . . . . . . . . . . . . . . . . . . . . . . . . . . . . .1
1.1 Definitions: The Traditional Power Grid . . . . . . . . . . . . . . . . . . . . . . . . . . . . . . . . . . . 11.2 Definitions: What’s a Smart Grid? . . . . . . . . . . . . . . . . . . . . . . . . . . . . . . . . . . . . . . . . 31.3 Why is a Smarter Grid Needed? . . . . . . . . . . . . . . . . . . . . . . . . . . . . . . . . . . . . . . . . . . 61.4 Smart Grid Risks . . . . . . . . . . . . . . . . . . . . . . . . . . . . . . . . . . . . . . . . . . . . . . . . . . . . . . . 91.5 Smart Grid Risks versus Benefits . . . . . . . . . . . . . . . . . . . . . . . . . . . . . . . . . . . . . . . . 12
2. PRIVACY PRESERVING DATA AGGREGATION . . . . . . . . . . . . . . . . . . . . . 15
2.1 Introduction and Motivation . . . . . . . . . . . . . . . . . . . . . . . . . . . . . . . . . . . . . . . . . . . . 152.2 Background and Related Work . . . . . . . . . . . . . . . . . . . . . . . . . . . . . . . . . . . . . . . . . . 18
2.2.1 Homomorphic Encryption for Data Aggregation . . . . . . . . . . . . . . . . . . . . . 182.2.2 Non-homomorphic Private Data Aggregation . . . . . . . . . . . . . . . . . . . . . . . . 212.2.3 Discussion . . . . . . . . . . . . . . . . . . . . . . . . . . . . . . . . . . . . . . . . . . . . . . . . . . . . . . 22
2.3 Network Architecture . . . . . . . . . . . . . . . . . . . . . . . . . . . . . . . . . . . . . . . . . . . . . . . . . . 232.3.1 Network and Communication Model . . . . . . . . . . . . . . . . . . . . . . . . . . . . . . . 232.3.2 Communications on the CDMA Channel . . . . . . . . . . . . . . . . . . . . . . . . . . . 242.3.3 Adversary Model . . . . . . . . . . . . . . . . . . . . . . . . . . . . . . . . . . . . . . . . . . . . . . . . 27
2.4 Privacy-Preserving Aggregation . . . . . . . . . . . . . . . . . . . . . . . . . . . . . . . . . . . . . . . . . 292.4.1 Initialization Phase . . . . . . . . . . . . . . . . . . . . . . . . . . . . . . . . . . . . . . . . . . . . . . 292.4.2 Privacy-Preserving via Random Noise Perturbation . . . . . . . . . . . . . . . . . . 292.4.3 Proposed Secure Aggregation Protocol(AgSec) . . . . . . . . . . . . . . . . . . . . . . 34
2.4.3.1 Security Analysis . . . . . . . . . . . . . . . . . . . . . . . . . . . . . . . . . . . . . . . . 352.5 Evaluation and Simulation Results . . . . . . . . . . . . . . . . . . . . . . . . . . . . . . . . . . . . . . . 38
2.5.1 Performance Evaluation by Numerical Analysis . . . . . . . . . . . . . . . . . . . . . . 382.5.2 Simulation Results . . . . . . . . . . . . . . . . . . . . . . . . . . . . . . . . . . . . . . . . . . . . . . 41
2.6 Conclusion . . . . . . . . . . . . . . . . . . . . . . . . . . . . . . . . . . . . . . . . . . . . . . . . . . . . . . . . . . . 43
vi
3. QUANTIFYING SMART GRID PRIVACY WITH INFORMATIONTHEORETIC METRICS . . . . . . . . . . . . . . . . . . . . . . . . . . . . . . . . . . . . . . . . . . . . 45
3.1 Introduction . . . . . . . . . . . . . . . . . . . . . . . . . . . . . . . . . . . . . . . . . . . . . . . . . . . . . . . . . . 453.2 Preliminaries . . . . . . . . . . . . . . . . . . . . . . . . . . . . . . . . . . . . . . . . . . . . . . . . . . . . . . . . . . 47
3.2.1 The Framework . . . . . . . . . . . . . . . . . . . . . . . . . . . . . . . . . . . . . . . . . . . . . . . . . 473.2.2 Privacy-Preserving Techniques and Terminologies . . . . . . . . . . . . . . . . . . . . 483.2.3 Metrics for Quantifying Privacy . . . . . . . . . . . . . . . . . . . . . . . . . . . . . . . . . . . 50

TABLE OF CONTENTS (continued)
Chapter Page
3.2.3.1 k-anonymity . . . . . . . . . . . . . . . . . . . . . . . . . . . . . . . . . . . . . . . . . . . . 503.2.3.2 Mutual Information Rate . . . . . . . . . . . . . . . . . . . . . . . . . . . . . . . . . 513.2.3.3 Clustering Error . . . . . . . . . . . . . . . . . . . . . . . . . . . . . . . . . . . . . . . . 513.2.3.4 Distortion-based Metric . . . . . . . . . . . . . . . . . . . . . . . . . . . . . . . . . . 523.2.3.5 Regression Analysis . . . . . . . . . . . . . . . . . . . . . . . . . . . . . . . . . . . . . 52
3.2.4 Discussion . . . . . . . . . . . . . . . . . . . . . . . . . . . . . . . . . . . . . . . . . . . . . . . . . . . . . . 533.3 Information-Theoretic Metric . . . . . . . . . . . . . . . . . . . . . . . . . . . . . . . . . . . . . . . . . . . 53
3.3.1 Entropy . . . . . . . . . . . . . . . . . . . . . . . . . . . . . . . . . . . . . . . . . . . . . . . . . . . . . . . . 553.3.2 Relative Entropy . . . . . . . . . . . . . . . . . . . . . . . . . . . . . . . . . . . . . . . . . . . . . . . . 583.3.3 Joint Entropy . . . . . . . . . . . . . . . . . . . . . . . . . . . . . . . . . . . . . . . . . . . . . . . . . . . 593.3.4 Conditional Entropy . . . . . . . . . . . . . . . . . . . . . . . . . . . . . . . . . . . . . . . . . . . . . 60
3.4 Evaluation and Illustration . . . . . . . . . . . . . . . . . . . . . . . . . . . . . . . . . . . . . . . . . . . . . 613.4.1 An Analytical Perspective . . . . . . . . . . . . . . . . . . . . . . . . . . . . . . . . . . . . . . . . 613.4.2 A Practical Experiment . . . . . . . . . . . . . . . . . . . . . . . . . . . . . . . . . . . . . . . . . . 62
3.5 Conclusion . . . . . . . . . . . . . . . . . . . . . . . . . . . . . . . . . . . . . . . . . . . . . . . . . . . . . . . . . . . 67
4. CONCLUDING REMARKS . . . . . . . . . . . . . . . . . . . . . . . . . . . . . . . . . . . . . . . . . . . . 68
vii
BIBLIOGRAPHY . . . . . . . . . . . . . . . . . . . . . . . . . . . . . . . . . . . . . . . . . . . . . . . . . . . . . . . . . . . . 70

LIST OF FIGURES
Figure Page
1.1 Traditional Grid vs. Smart Grid . . . . . . . . . . . . . . . . . . . . . . . . . . . . . . . . . . 6
2.1 Network Architecture. . . . . . . . . . . . . . . . . . . . . . . . . . . . . . . . . . . . . . . . . . . 25
2.2 a) A 16-chip Golay OCS matrix. b) A 16-chip PCC OCSmatrix. . . . . . . . . . . . . . . . . . . . . . . . . . . . . . . . . . . . . . . . . . . . . . . . . . . . . . 26
2.3 Entities used in the privacy-preserving aggregation. . . . . . . . . . . . . . . . . 28
2.4 Initialization Parameters. . . . . . . . . . . . . . . . . . . . . . . . . . . . . . . . . . . . . . . . . 29
2.5 Perturbation Matrix. . . . . . . . . . . . . . . . . . . . . . . . . . . . . . . . . . . . . . . . . . . . . 33
2.6 OCS Length versus Error. . . . . . . . . . . . . . . . . . . . . . . . . . . . . . . . . . . . . . . . 41
2.7 OCS Length versus Communication Overhead. . . . . . . . . . . . . . . . . . . . . 41
2.8 OCS Length versus Delay. . . . . . . . . . . . . . . . . . . . . . . . . . . . . . . . . . . . . . . . 42
3.1 Transfer and attack functions . . . . . . . . . . . . . . . . . . . . . . . . . . . . . . . . . . . . 48
3.2 pdf’s of Gaussian Distributions with µ = 500 and Variable σ2. . . . . . . . 62
3.3 Entropy of Smart Meter Data, H(X). . . . . . . . . . . . . . . . . . . . . . . . . . . . . . 62
3.4 pdf’s of Random Variables X̂, fX̂(x̂) = fX+A(x+ α). . . . . . . . . . . . . . . . . . 63
3.5 Entropy of Perturbed Smart Meter Data, H(X̂) = H(X +A). . . . . . . . . 63
3.6 Power Consumption in a Household in a Twenty-four HourPeriod. . . . . . . . . . . . . . . . . . . . . . . . . . . . . . . . . . . . . . . . . . . . . . . . . . . . . . 64
3.7 The Histogram of the Power Consumption Data. . . . . . . . . . . . . . . . . . . 65
3.8 Quantile-Quantile Plot. . . . . . . . . . . . . . . . . . . . . . . . . . . . . . . . . . . . . . . . . . . 65
3.9 Distribution and Entropy of X and X̂. . . . . . . . . . . . . . . . . . . . . . . . . . . . . 66
viii

LIST OF TABLES
Table Page
2.1 Transmission Delay and Communication Overhead . . . . . . . . . . . . . . . . 40
2.2 Simulation Parameters . . . . . . . . . . . . . . . . . . . . . . . . . . . . . . . . . . . . . . . . . . 43
3.1 Comparison of Alternative Distributions . . . . . . . . . . . . . . . . . . . . . . . . . . 66
ix

CHAPTER 1WHAT IS SMART GRID AND WHY IS SECURITY IN
SMART GRID IMPORTANT?
1.1 Definitions: The Traditional Power Grid
In order to realize the concept of smart grid, which can refer to several things and have
numerous meanings, it is necessary to find out what the electrical grid is and then try to
make it smarter. “The US power supply network is the largest, most complex machine ever
created and engages the most complex enterprise. It involves some 5000 corporate entities,
100 million customers, four distinct forms of ownership and multiple levels of regulatory
oversight.” [1] This is basically a system for transferring electricity from generation plants to
houses and businesses. It helps leverage long-distance transmission lines which lead electricity
to local distribution grids where electricity is stepped down to a usable voltage. To keep
electricity from damage and outages as well as to route it properly, there are sensors, switches,
capacitor banks, and reclosers on the way that use manual and automated controls. To
make sure that disruptions in one part of the grid do not influence the other parts, special
protection systems or remedial action schemes are available.
The grid has an almost untidy and jumbled assembling with a lot of additions, tweaks,
and workarounds that supply electricity to every house. Even the word “grid” implies some
amount of organization which is not present. None of the US main grids, located in the
east and west of the US and Texas, are controlled centrally because each generation source,
transmission provider, and local distribution organization plays its own role in the technology
and processes involved. These grids are not completely independent, though.In spite of
limited resources, increasing demand, and infrastructures that rely on each other, we can find
few reliable systems that operate without enforcing compatibility between their components.
In the traditional electrical grid, the control and monitoring processes are carried out
with limited mechanisms. However, experienced experts in electricity industry refute this
1

statement right away as they correctly believe that technologies like supervisory control and
data acquisition (SCADA) and distributed control systems (DCS) have succeeded in clarifying
and controlling grid functions for several years. Nevertheless, since these technologies, even
until recently, concentrate on major substations and the generation plant, they ignore utilities
and therefore result in outages along a distribution feeder line, and the need to repair or
replace the voltage level at home and business, or whether a transformer. However, the
abovementioned protection systems help find out faults along main distribution feeder lines.
On the other hand, identifying faults and outages, particularly at the end of the line is so
challenging due to the cost and geographical factors. Sensors installed at main transmission
substations and high- voltage power lines have given independent system operators (ISOs)
and regional transmission operators(RTOs) access to real-time information about the status
of the grid. However, this information is not thorough because it doesnt include a crucial
ingredient: interaction with the consumer [48].
Although the amount of electricity which is generated and distributed is determined
by the final consumers of the electricity, the present grid regards electricity as an endless
resource which can be consumed or not consumed without considering the cost of the demand
or who will generate the electricity.The electricity generated in the current grid, except in a
few cases, has to be used by houses and businesses that are located within a few hundred
miles of the plant. Simply put, electricity needs to be dispatchable and cannot be taken
from other sources of energy. Consumers of electricity do not notice or care what the money
they pay is for. For example, they just turn on their devices and receive a bill without being
aware of what the costs are for [27].
Now, let us briefly discuss problems of cyber security. There is no doubt that the tradi-
tional grid has some limitations for IT-oriented automation systems. The concept of air gap
means that there was a physical separation between the enterprise side of the business which
was responsible for ordinary IT resources like servers and workstations for purposes such
as human resources, finance, and procurement and the operations technology side which is
2

in charge of the generation, transmission, and distribution of electricity. Furthermore, the
operations side has depended on specialized control systems designed for the real time nature
of electricity. Although typical TCP/IP networks were less common and more limited, with
communications through dial-up modems and serial communications technology. As far as
cyber security is concerned, there was more security due to the requirement of physical access
and less security because of the variation of access methods and rare application of infor-
mation security best practices. Fortunately, automated attacks that were based on famous
architectures that were constantly used were more difficult to run successfully. However,
attacks on specific parts including a dial-up modem in a substation were easier to launch
for they depended on security through vagueness. Likewise, to deal with an attack on a
person’s residential electromechanical meter, physical access was required because there was
no communications path to the meter. It wasn’t possible to launch attacks on thousands of
meters from a distant place.
1.2 Definitions: What’s a Smart Grid?
The term smart grid was proposed by a group of experts at the US Department of
Energy (DOE). The DOE tries to extend the already existing intelligence to more parts of
the grid. Smart grid is not only a technology but also a goal. Hence, a lot of the future
grid’s characteristics should be defined. Title XIII of the energy independence and security
act of 2007 mentions ten features of a smart grid [1]:
1. Increased use of digital information and controls technology to improve reliability,
security, and efficiency of the electric grid.
2. Dynamic optimization of grid operations and resources, with full cyber security.
3. Deployment and integration of distributed resources and generation, including renew-
able resources.
3

4. Development and incorporation of demand response, demand-side resources, and energy-
efficiency resources.
5. Deployment of smart technologies (real time, automated interactive technologies that
optimize the physical operation of appliances and consumer devices) for metering,
communications concerning grid operations and status, and distribution automation.
6. Integration of smart appliances and consumer devices.
7. Deployment and integration of advanced electricity storage and peak-shaving technolo-
gies, including plug-in electric and hybrid electrical vehicles, and thermal-storage air
conditioning.
8. Provision to consumers of timely information and control options.
9. Development of standards for communication and interoperability of appliances and
equipment connected to the electric grid, including the infrastructure serving the grid.
10. Identification and lowering of unreasonable or unnecessary barriers to adoption of
Smart grid technologies, practices, and services.
The present electrical grid has been created through merging of several years of build-
outs, patching, and bolt-ons. Its simple goals are to generate electricity on the basis of coal,
diesel, natural gas, nuclear, wind and solar; build huge transmission lines to deliver elec-
tricity to homes and businesses; and distribute it on the local level [48]. Some monitoring
systems were then installed in important places and measurement of the total demand was
determined to see how much generation was needed. In addition, the electrical grid depended
on small and predictable increase in electricity usage and needed robust components to keep
working. There are hardly ever outages in the US and Canada. Although this one-way flow of
electricity has been in successful operation under a vertically integrated electric utility model
where one company controls the generation, transmission, and distribution for a given cus-
tomer, the model begins to fall apart when multiple players are involved. If generation can
4

come from several places and several companies, more coordination is then needed. Likewise,
if customers are going to generate their own power and some of it back to the grid at the
distribution level, we can realize what problems we may face due to the lack of sophisticated
measurement and communications capabilities. If there is too much demand and not suffi-
cient supply in some areas and giving that information to customers to regulate their usage is
impossible, we will face rolling power cuts which are politically unacceptable and potentially
perilous. We will later understand that smart grid was not designed for today’s problems.
It was meant to deal with the future challenges. The electrical grid has worked successfully
with restricted command-and-control competences and little customer collaboration in the
past one hundred years. Electricity in most parts of the US is low-pricedand and outages
are controllable. If there are going to be changes in the grid, it is only because of various
kinds of demographic, technological, and socioeconomic features. Figure 1.1 shows that the
traditional grid is so hierarchical. The generation is at the top, transmission in the middle,
and distribution at the bottom working almost independently. Traditional generation which
is under the smart grid model still has a large role. But distributed generation sources in the
form of wind, solar, and numerous other customer-owned generation sources strengthen it.
These various energy sources can generate enough electricity to both send to end consumers
and sell it back to the utility. Furthermore, in order to support distributed generation as well
as to mix customer interaction with the equation, communications networks are added. This
way, utilities can both affect behavior and make better decisions based on customer choices.
An example of this could be technologies such as Advanced Metering Infrastructure (AMI)
that makes instant relaying of usage levels in houses and buildings. Also, using appliance
based communication technologies, grid components can relay appliance-level information
on the usage and receive orders from the utility to modify the behavior or ultimate oper-
ation of that appliance during peak time. Besides distributed generation, and augmented
communications and measurement abilities, the smart grid envisions the ability to save elec-
tricity through conventional technologies and by developing newer battery technologies. The
5

plug-in hybrid electric vehicle (PHEV) is a storage solution that can both generate and store
electricity and can also get its energy from the electric grid. These vehicles can use the
developed form of the same technology to store energy by other devices on the electrical grid
when not needed by the vehicle. Consequently, the generating capacity is maximized and
this is one of the main characteristics of the smart grid.
Figure 1.1: Traditional Grid vs. Smart Grid [1].
1.3 Why is a Smarter Grid Needed?
The smart grid is not going to solve problems with the present electrical grid. Electricity
is abundant, reliable, and inexpensive except in warm and populated places like Florida,
and Southern California. These conditions are prone to change for different reasons. Mark
Gabriel [1] mentions a lot of trends that are influencing our ability to maintain the current
situation in his book. They include demographics, the development of energy business,
carbon constraints and capacity demands, availability of intelligent infrastructure, and the
need for customer engagement. It might be said that change will be necessary if the primary
driver is profitable and so, if investor-owned utilities cannot make a profit or if consumers
cannot afford electricity costs. Several factors are driving this profitable necessity. Because
of the demographic changes, many people have gone to warm weather climates in which more
electricity is demanded for air conditioning, the largest single electricity cost in residential
areas. Another factor which is increasing demand for electricity lies in our electronic culture,
6

such as cellphones and large televisions. The problems of the supply side are caused by:
environmental regulations that limit traditional fossil fuel-based generation plants, very long
and heavily regulated deployment windows for nuclear, and the investment costs and long
payback period for renewables like solar and wind. Electricity costs will increase dramatically,
especially in large population centers in warm climates, as a result of these supply-and-
demand challenges. In addition, the work force in electric utilities will age while there are
no ready replacements. Utilities will turn to automation and outsourcing because there are
fewer people to do the work and younger generation prefers to use technology. Large investor-
owned utilities are faced with heavy regulation by public utility commissions over what they
are allowed to charge their customers at the distribution level, and consequently, they are
always looking for greater cost efficiencies and other less regulated markets to enter in order
to interest the investors. The reasons why companies look for renewable energy businesses are
taking advantage of the tax benefits, grants, and greater market-orientation on the generation
side. The DOE smart grid grants funded under the American Recovery and Reinvestment
Act of 2009 motivated some of these companies when smart grid investments were not
economically stable. Moreover, smart grid provides a large number of business opportunities
and technological innovations. Customer engagement and presence of technology that makes
its own demand are some of these opportunities. When easy and useful technologies are at
hand, what consumers and public utility commissions may never have noticed will become
an important thing. For example, nobody thought cell phones and digital video recorders
would become essential things until economical and packaged for consumers. Now they are
must-haves. The expected profits of smart grid may not seem that considerable when we
take a look at the amount of investment. What the majority of experts believe is that energy
costs will increase anyway, but through smart grid they will not have a big rise. Because
utilities will be capable of using demand response programs to turn off some appliances at
peak time, it is less likely that consumers experience as many rolling blackouts as before.
Although smart grid aims to reduce some power cuts by analyzing failures predictively and
7

better and to decrease the duration of outages by immediate locating of customers without
power, or to meter connectivity, it will not be able to protect power lines from snapping
trees during storms. Some of the storm-related outages may be alleviated with the help of
distributed generation and localized energy. There may still be the danger of single points of
outage because of snapping trees and backhoe cuts. The challenges of smart grid may be the
same as those of cyber security because the savings may be in costs avoided. Most Americans
enjoy a rather low electricity monetary. However the largest benefits come from rate that
will not rise as high as they would have otherwise. This is because of the unavoidability of
some rate increases happening as a result of increases in demand for energy. Consequently,
lower staffing levels through increasing automation, smaller income losses caused by shorter
outages, and fewer generation costs as a result of demand response and dynamic pricing
plans that move usage to off-peak periods. There are also a lot of other smart grid uses
which lower the costs as well as revenue losses. Many of the uses are not known though. For
instance, demand response programs change drastically according to customer engagement
and behaviors. Savings from increasing automation can be obtained by reducing the number
of employees. The new technology can provide shorter outages which are easier to predict
and faster to fix. The cost of smart grid upgrade can be eased by government subsidies
under the American Recovery and Reinvestment Act, but utilities still pass the rest of the
costs to customers. This proposition does not go over well with public utilities commissions.
However, there is a great need for investment in the electrical grid. It is not clear whether
using smart grid will enable utilities to postpone or avoid replacement of old infrastructures.
The future of the grid is not easy to predict due to the involvement of so many factors.
However, in the next 50 years, the grid is likely to be highly dynamic and distributed in
which consumers can use wind and solar energies to generate and store their own power.
We should expect a higher electric usage as our dependence on technology increases and
important loads, like plug-in hybrid vehicles, appear.
8

1.4 Smart Grid Risks
A large number of risks, including physical attacks and failures caused by aging infras-
tructure, are already threatening the current electrical grid. We aim not to emphasize those
risks but rather to identify the new threats resulting from the smart grid. We will discuss
the probability of a successful attack or worsening the damage by smart grid technology.
The remote attack and the compromises that might come up through the growing amount of
interconnectivity of data communications networks which monitor grid activity are the most
important threats. The effort to increase automation and fix remote problem will lead to the
problem of protecting a larger number of attack vectors since each meter in a residential area
could be a possible entry point in grid communications networks [27]. A thorough analysis
of potential attacks at the matter level is presented later. It should be noted that expanding
the communications network to every household will basically make the threat dynamic and
bring about some serious security problems. It is because of the fact that a device over
which the utility has little physical control is used to determine how much electricity should
be generated and to whom it should be delivered. In spite of the similarity of the cable
boxes for TV and cable modems for Internet access in physical control issues, the results of
prevalent solution are limited.
Since smart grid cyber security threats sound like a moving target, understanding whether
they succeed or not needs artistic skills rather than science. We try to look into various
aspects of the smart grid and its weaknesses to compromise. Evidence shows that foreign
intelligence agencies have penetrated the US electrical grid and are inactively checking it.
However, that evidence is only hypothetical and mainly dependent on internet traffic moving
toward a utility. In general, identifying the nature of the system compromised needs more
information. One example could be a virus which infects a utility’s human resources or
finance department but causes no effect on the electrical grid because it is normally physically
or virtually separatedand thus difficult to attack. We are not saying that the present electrical
or a coming version of it would be less vulnerable. What we are trying to say is that
9

the essence of the attacks, the probable attack vector, and the attacker’s impetus may be
different from traditional attacks on enterprise networks. For example, instead of targeting
the utility’s Internet connection, the attackers might either try to physically compromise the
meter and then take advantage of it to penetrate the other parts of the meter network,or
attack a consumer’s Internet connection and use the home’s network to get to the meter.
Of these two ways, the former has been simulated in lab environment using extrapolation,
while the latter in only based on speculation. Additionally, the impetus is not completely
known. Sabotage is definitely a matter of concern, but in order to do a cyber-attack a lot
of expertise and resources are required. Mostly, explosives threatening main substations
and transmission lines are easier to carry out. Plus, they do more harm to the grid and
consumers. On the other hand, when cyber-attacks are done randomly over time, they
can be more operative than an explosion because they create a great deal of uncertainty
regarding the reliability of electrical power. Examples of these cyber-attacks are the ones
that happened in the countries of Georgia and Estonia. In addition, some attacks are done
without even stepping in the US. That’s why the number of probable attackers as well as
the possibility that such attacks take place when there is not enough awareness of them will
go up.
If the smart grid is designed incorrectly, it will create additional attack vectors and a
greater harm. While the electrical grid is greatly robust, it is able to withstand intentional
attacks at its weakest point. Moreover, the grid’s power can be used against it by creating
cascade-like events. Although in the past an organized and simultaneous attack was needed
to cause a huge power outage, the future grid might face the same destiny through a hacker’s
keystroke. Nonetheless, if a smarter grid is designed, it can act more quickly in identifying
and responding to such attacks. Like majority of technological progresses, the smart grid can
also have the potential for greater effectiveness and reliability as well as for greater harm.
Another challenge that the grid may face is perception challenge. An unproven theory
that the whole grid is composed of a single meter can have a great effect on a utility’s capa-
10

bility to use a smart grid successfully. It is also believed that terrorist and other malicious
groups take as much advantage of changes in behavior caused by fear and uncertainty as they
do of direct attacks. For instance, if there are small attacks on smart grid technology, peo-
ple will start to question the security of a more general technology which prevents required
improvements and brings around higher energy costs and less security. Bruce Schneier, a
security expert, mentions some of the evolutionary effects that make us mistakenly estimate
risk and accordingly react improperly.
When we compare the risks and disadvantages of new technology with the hypothetical
benefits, we remain doubtful. The vulnerability of a new technology to hackers may force the
people and decision-makers to prefer using legacy technology even if it holds bigger risks. If
smart grid causes only a few outages of which everybody is informed, the entire effort could
be useless, just like what happened to electronic voting machines a few years ago. Likewise,
privacy risks and other harms may lead to more serious opposition than more important
risks, such as the probable loss of life by utility staff. Utilities are supposed to personalize
the advantages of smart grid and show a way to get rid of risks or else some significant
developments could be missed out.
The question that comes up here is how to sort all the viewpoints and correctly detect the
real risks. In order to determine related risks, we can normally use risk assessment methods
which have their own drawbacks. In the financial services community, variety of risks could
be evaluated using quantitative risk assessment methodologies. This is because of availability
of plentiful data and the high level of transparency in public markets. With regard to what
the recent meltdown showed, these plans can be limited especially when they are based on
wrong assumptions about the broader environment, such as the weak possibility that housing
prices would decrease considerably in a short time. The fact that most security accidents
remain unreported, it’s not possible to compare one enterprise to another in a standard way,
amplifies the problem. Although car factories, by using criteria such as age, gender, location
of residence, and driving record, can reach reliable risk factors to base premiums on, we
11

can’t find such consensus that certain controls result in a special frequency of compromises.
In addition, in places where criminal acts are intended, attacks develop as new controls are
used. Special industries like financial services and national security are more likely to be
subject to attack. This has caused some cyber security insurance approaches not to provide
coverage for large financial institutions. For the electricity industry, the main thing to figure
is the value of services to stakeholders. What shareholders want is nonstop income at a
decent profit. If an outage happens in a generation plant, the loss of revenue that the power
producer may have will be extremely significant even if the news is kept secret. In contrast, if
an outage takes place in a neighborhood and lasts for a few hours, it may make the news and
cause a serious public relations challenge for a utility. Smart grid should be able to deal with
these problems, and to prevent and shorten outages through advanced sensor technology
and more sophisticated outage management systems. There is also the risk of centralized
malfunction caused by centralized control which should be taken into account. Utilities,
vendors, and regulators need to comprehend all kinds of security controls that will suit the
future weaknesses and risks. They should also be aware of effects that may prevent moving
toward the smart grid.
1.5 Smart Grid Risks versus Benefits
So far it might have become clear that using a smart grid cannot guarantee a higher
amount of safety and reliability in our electrical grid since deployment of new technology
does not always cause a breakthrough. Nuclear power technology, for example, has been
delayed for several years thanks to what happened in Three Mile Island and Chernobyl.
However this technology is safer and cleaner than fossil fuels. Only in the past few years
and with the construction of new plants has nuclear power regained its footing. Comparing
nuclear power with smart grid is not reasonable because smart grid is a collection of different
technologies, many of which work autonomously. Utilities can increase automation in substa-
tions or install new sensors to electrical lines without applying a new residential smart meter.
12

In the following chapters we will see that each smart grid has separate challenges related
to security, stakeholders, and stakeholder interests. The smart grid, just like the electrical
grid, is composed of areas of redundancy and interdependency.What one can understand
here is when an ecosystem like smart grid is used, it is important to know where to add
redundancy, resilience, and self-reliance to the current electrical grid and at the same time
keep the economies of scale that an interdependent grid provides. Incorrect implementation
of this would decrease the reliability of the grid and make it more vulnerable to cascading
outages. Correct implementation of this would enhance reliability, decrease costs, and facili-
tate innovation. Because security is actually a subset of quality, using a good quality system
is crucial. This means handling intentional problems caused by malicious entities as well as
unintentional ones caused by authorized entities. Every process must be done by considering
the integration of quality and security. This includes product vendors, integrators, and end
customers. Everyone is expected to play their role while paying attention to both security
and quality [1].
Many companies wonder what they need to buy in order to be secure. The answer is
that security is a process and not a product. It could also be said that security is not an
outsourced service. The main responsibility of security of the grid lies with the stakeholders.
In some cases, interconnecting pieces of the grid such as distribution-only utilities, transmis-
sion providers, generation and even consumers are responsible for security. This does not
mean that third parties are not involved in providing monitoring services, patching systems,
and drafting and implementing policies and procedures. This is exactly like the example
of the criminal defendant who is sure that he is the one who should finally go to prison if
there is a conviction, no matter how responsible his lawyer is in making decisions. Passing
on responsibility for security to someone else can end up in severe consequences.
In conclusion, in order for any utility to have outsourcing or dependence on standards or
regulations, they are expected to have continuous awareness. What a contractor is mainly
responsible for is meet the requirements of the contract including dealing with security
13

threats. But they seldom take on responsibility for attacks when they have done their
contractual duties. The solution is to set clear criteria for contract compliance that are
designed to fight security risks and provide flexibility in the contract to match criteria and
responsibilities with the risk posture changes. So it is possible and in many cases better to
outsource security functions, but comes up outsourcing risk which is another matter. All
that insurance companies can do is to pay you cash. They cannot regain customer confidence
or fix compliance violations. So far, many of the risks to smart grid have been discussed from
the 10000-foot level. The advantages of smart grid are not one hundred percent certain even
if the security could be provided. As we keep looking into different smart grid technologies,
it must be remembered that this is a perilous path we are moving on.Any kind of problem
on the way, from a big security threat related to smart grid technology to an unpredicted
rate increase might either bring smart grid use to an end or cause some long delays. Simply
put, every detail is important. Utilities must not allow the messing up of security, smart
grid advertising campaign, the usability if their in-home devices, the rates they charge, or
their quality control mechanisms. Given the importance of the deployment of the smart grid
and based on the security/privacy related challenges associated with the smart grid, in this
thesis, we will address two important open problems in smart grid networks:
1. In Chapter 2, we will introduce a novel privacy-preserving aggregation scheme based
on the concepts of spread spectrum communications and using statistical perturbation
techniques to efficiently and securely aggregate power consumption data from the users
smart meters.
2. In Chapter 3, we will investigate the applicability of existing metrics for quantifying
privacy in various domains. Then, we study four information theoretic metrics, based
on the entropy of smart meter data, to effectively quantify privacy of smart metering
systems before and after using specific privacy-preserving techniques.
14

CHAPTER 2PRIVACY PRESERVING DATA AGGREGATION
2.1 Introduction and Motivation
A series of power surges over a twelve-second period triggered a cascade of shutdowns
in the US and Ontario on August 14, 2003. The result was the biggest blackout in North
American history. 61800 megawatts of power were lost to over 50 million people. Stud-
ies showed that the outage was because of lack of real-time monitoring and diagnosis and
failure in proper load balancing [43]. Recently, Smart Grid has been proposed as the next
generation power grid. A Smart Grid is an electrical grid that leverages communication
technologies and information processing to gather, process, and act on collected information
to improve reliability, efficiency, economics, and sustainability of the power grid in genera-
tion, transmission, and distribution [47]. This information-based power grid will help the
Utility Companies (UC) to act on consumer information gathered from Smart Meters (SM)
at the user’s premises. The two-way communication capability will enable functions such as
demand-response, demand-dispatch, self-monitoring, and self-diagnosis for the existing power
grid [46]. It also promises reduced prices through dynamic pricing schemes, wide penetration
of renewable resources such as wind and solar, and fewer power outages [42]. The topic of
smart grid has attracted researchers to study various aspects of modernizing the electricity
grid. The research community has been studying miscellaneous subjects such as communi-
cation technologies and infrastructure [47, 41, 40, 48, 39], legal and policy concerns [38, 83],
reliability, failure diagnosis and recovery [59, 37, 60], demand-response, demand-dispatch,
load shaping, and peak-shaving [36, 61, 49], data aggregation [47, 50, 35, 34, 30, 31, 32] and,
last but not the least, security and privacy [46, 42, 47, 33, 29, 51].
Advanced Metering Infrastructure (AMI) are systems that measure, gather, analyze en-
ergy usage, and communicate with metering devices such as water meters, gas meters, heat
meters, and electricity meters. This communication is either on request or on a predeter-
15

mined schedule. Government agencies and utilities are adopting AMI systems as part of
the deployment of the smart grid. AMI improves current Advanced Meter Reading (AMR)
technology by enabling two-way communications between the meter and the utility. This al-
lows UCs to send commands to the meters for different purposes, such as time-of-use pricing
information, demand-response actions, or remote disconnects [48].
Although AMI provides the UC with state-of-the-art capabilities, having access to fine-
grained consumer usage data can reveal information regarding the private lives of its users.
For instance, it can be easily determined if a residential house is vacant or not by observing
the fine-grained energy consumption patterns [52]. It is also possible to track the location of
the residents of a household based on the appliance they are using [53]. Insurance companies
can monitor and track eating, sleeping, and possibly exercise habits of a household [28, 27].
In 2009, the Dutch Parliament prohibited the utilization of smart meters because of privacy
issues. It is worth mentioning that in Smart Grid Networks (SGN), data-oriented privacy is
more of interest, as opposed to context-oriented privacy, because it deals with private con-
sumer data. There are also many cyber security related challenges for the deployment of the
Smart Grid [47]. This “Internet-like distributed power grid” is vulnerable to many known
and unknown cyber security attacks [54]. The security threats to the Smart Grid can target
the confidentiality and the integrity of the gathered fine-grained user data. They can also
threaten the availability of the power grid. Computerworld [26] reports more than 170 out-
ages caused by cyber-security attacks. It should go without saying that without appropriate
security and privacy-preserving techniques, large-scale deployment and consumer-acceptance
of the Smart Grid paradigm is difficult.
In general, data aggregation techniques are utilized to significantly reduce the volume
of traffic being transmitted in an SGN by compressing data in the intermediate nodes (also
called aggregators). Aggregation is an important technique for preserving network resources,
such as bandwidth and energy [25]. Also, it is deployed as a common approach to preserve
data privacy against external adversaries as the aggregation process compresses large inputs
16

to small outputs at the intermediate aggregators. However, this can lead to several new vul-
nerabilities against potential internal adversaries, such as the aggregator node itself. Thus,
it is of paramount importance to design appropriate mechanisms for privacy-preserving data
aggregation [10]. Earlier privacy-preserving approaches have primarily used cryptographic
techniques such as homomorphic encryption and secure multiparty computation in order
to preserve user privacy while aggregating usage data [21]. These approaches, although
providing strong guarantees of confidentiality, are very heavy from a computational and
communicational stand-point and may not be feasible on low-end smart meters with limited
computation capabilities [58]. Considering the huge scale of future smart meter deploy-
ment and the granularity of the data being gathered, existing communication networks will
have difficulty handling this data because of resource constraints such as network capacity
(bandwidth) [86, 87, 88]. Homomorphic cryptosystems usually generate an output of a huge
fixed-length as compared with the data generated by smart meters. This ciphertext can be
up to one hundred times larger than the actual smart meter data [47]. Given the frequency
of the data being sent and possible bandwidth scarcity, this can lead to unacceptable delay
and network overhead [86].
In this chapter, we investigate the feasibility of existing privacy-preserving data aggre-
gation approaches. We devise a novel, efficient, and feasible (from a communications per-
spective) data aggregation mechanism for SMs using coding theory, spread spectrum com-
munications (SSC), and random perturbation techniques [22, 23]. Finally, we validate the
performance of our aggregation mechanism by means of simulations.
The rest of this chapter is organized as follows. Related work in the literature and back-
ground on existing secure aggregation schemes is outlined in Section 2.2. The network and
adversary model assumed in this work along with basics of SSC are presented in Section 2.3.
Our proposed perturbation-based privacy-preserving aggregation utilizing SSC is outlined in
Section 2.4. Evaluation and simulation results are discussed in Section 2.5.
17

2.2 Background and Related Work
In this section, we outline mechanisms in the literature for privacy-preserving data ag-
gregation in SGNs and also study some data aggregation methods in other networking in-
frastructure with similar constraints such as Wireless Sensor Networks (WSN).
2.2.1 Homomorphic Encryption for Data Aggregation
A public-key cryptosystem is known to have homomorphic properties if E(m1 � m2) =
E(m1) 4 E(m2), where E is the encryption function, � and 4 are two mathematical op-
erations, and m1,m2 are two input messages. In other words, a homomorphic property
enables certain mathematical operations on the plaintext by performing specific operations
on the ciphertext without observing any intermediate results in plaintext. Based on the
supported operations, homomorphic cryptosystems fall into two broad categories: partially
homomorphic and fully homomorphic. Partially homomorphic cryptosystems only support
either addition or multiplication, or in some cases polynomials up to certain degrees, whereas
fully homomorphic cryptosystems support both addition and multiplication [47, 51]. It goes
without saying that fully homomorphic cryptosystems provide much more flexibility and
have recently received significant attention [20, 19]. However, given their computational
complexity, they are not widely used in practical applications yet. Well-known homomor-
phic cryptosystems include RSA [18], El Gamal [17], Paillier [19], Naccache-Stern [16], and
Boneh-Goh-Nissim [15, 14].
In general, data aggregation techniques might support different aggregation functions
such as sum, max, min, avg, median, and variance. However in SGNs, the UC is mostly
interested in total consumption (sum) of a given neighborhood in a specific time period to
enable functions such as demand-response, load-shaping, peak-shaving, and self-monitoring
[46, 47, 36, 49]. Also, the average (avg) usage of each household might be of interest. Given
that sum of consumed electricity of all smart meters in a residential neighborhood is required
to be computed in a private fashion, the additive homomorphic property of the Paillier [19]
18
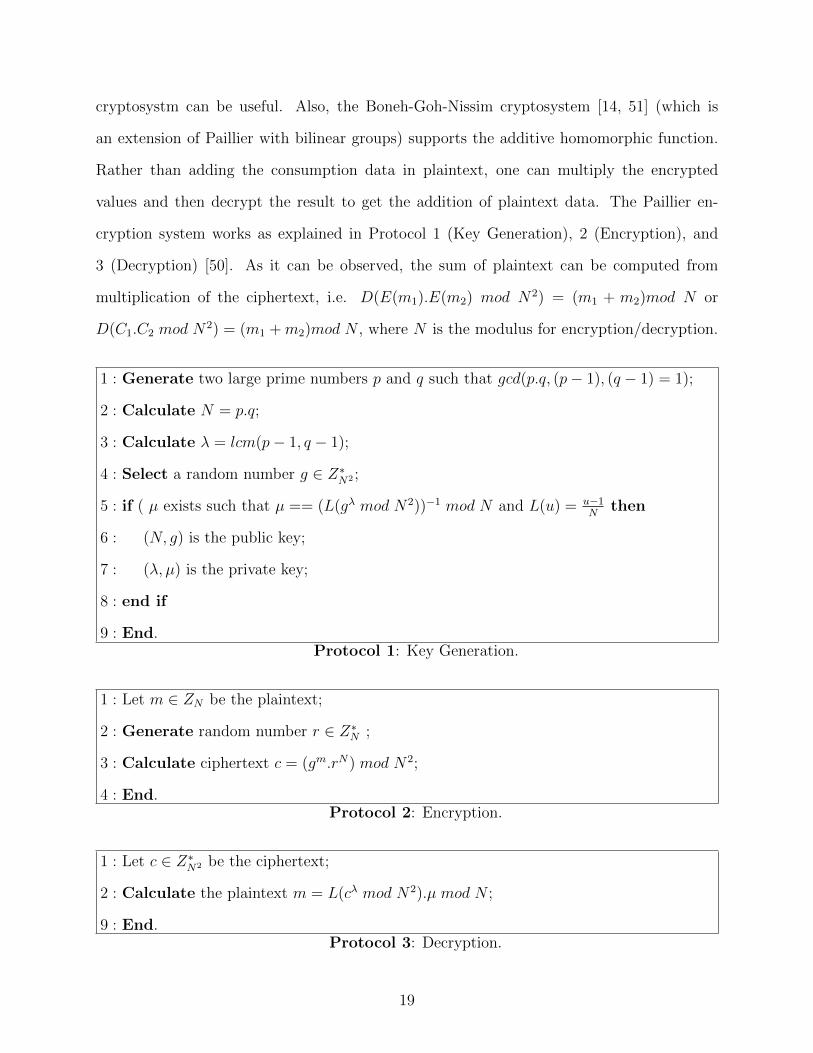
cryptosystm can be useful. Also, the Boneh-Goh-Nissim cryptosystem [14, 51] (which is
an extension of Paillier with bilinear groups) supports the additive homomorphic function.
Rather than adding the consumption data in plaintext, one can multiply the encrypted
values and then decrypt the result to get the addition of plaintext data. The Paillier en-
cryption system works as explained in Protocol 1 (Key Generation), 2 (Encryption), and
3 (Decryption) [50]. As it can be observed, the sum of plaintext can be computed from
multiplication of the ciphertext, i.e. D(E(m1).E(m2) mod N2) = (m1 + m2)mod N or
D(C1.C2 mod N2) = (m1 +m2)mod N , where N is the modulus for encryption/decryption.
1 : Generate two large prime numbers p and q such that gcd(p.q, (p− 1), (q − 1) = 1);
2 : Calculate N = p.q;
3 : Calculate λ = lcm(p− 1, q − 1);
4 : Select a random number g ∈ Z∗N2 ;
5 : if ( µ exists such that µ == (L(gλ mod N2))−1 mod N and L(u) = u−1N
then
6 : (N, g) is the public key;
7 : (λ, µ) is the private key;
8 : end if
9 : End.****************************Protocol 1: Key Generation.
1 : Let m ∈ ZN be the plaintext;
2 : Generate random number r ∈ Z∗N ;
3 : Calculate ciphertext c = (gm.rN) mod N2;
4 : End.******************************Protocol 2: Encryption.
1 : Let c ∈ Z∗N2 be the ciphertext;
2 : Calculate the plaintext m = L(cλ mod N2).µ mod N ;
9 : End.******************************Protocol 3: Decryption.
19

He et al. [51] present a secure data exchange scheme for the smart grid based on homo-
morphic properties of Goh cryptosystem [15]. Goh supports an arbitrary number of additions
and a single multiplication on the ciphertext. It is worth noting that the aforementioned
protocol is only a secure data communication scheme and does not address the problem of
secure aggregation. Li et al. [50] utilize the homomorphic properties of Paillier to propose
an incremental data aggregation scheme. In [50], every node passes its encrypted time-series
data to its parent node on the aggregation tree. The parent node multiplies the received value
into its own encrypted consumption data and passes the total result to the next parent node.
Therefore, all the SMs participate in the aggregation without seeing any intermediate or final
result. Garcia and Jacobs [55] present a privacy-preserving protocol using Paillier based on
secret sharing. Their proposal hides consumption data from the UC as it receives random
shares of data (instead of the entire data) which it cannot decrypt. The other nodes cannot
retrieve meaningful information either since they only receive random shares. Kursawe et al.
[56] propose two approaches to calculate total consumption in SGN. In their first approach,
called aggregation protocols, smart metering data are masked in such a way that after sum-
ming the data from all smart meters masking values cancel each other out and the UC gets
the total consumption information. In their second approach, named comparison protocols,
they consider that the UC roughly knows the total consumption. Erkin and Tsudik [57]
propose a cryptographic protocol based on a modified version of the Paillier cryptosystem
to calculate the total consumption of all the SMs in a given neighborhood as well as a single
SM in the AMI. Acs and Castelluccia [13] suggest a solution using masking and differential
privacy and utilizing the homomorphic properties of a computationally-cheap cryptosystem
for private data aggregation. Lu et al. [12] propose an Efficient and Privacy-Preserving
Aggregation (EPPA) for smart grid communications by structuring multidimensional data
and encrypting them with the Paillier cryptosystem. Erkin et al. [47] study different existing
secure signal processing mechanisms in SGNs and compare different existing cryptographic
methods in terms of computational complexity, efficiency, and imposed overhead.
20

It is worth noting that in WSNs another non-homomorphic, cryptographic approach has
also been utilized; an intermediate node in the aggregation tree has to decrypt the data
received from a downstream node, then aggregate the data according to the aggregation
function, for instance sum, and finally encrypt the output of the aggregation function be-
fore forwarding the result to the up-stream node on the tree. Such schemes have several
shortcomings, the most important of which is that they do not protect the privacy of the
transmitted data from the neighboring sensor nodes. All neighbors share pairwise keys and
are able to decrypt the incoming data. Hence, if the neighboring sensor node is honest-but-
curious or if it is compromised and monitored by the adversary, the data in transit can be
easily intercepted.
2.2.2 Non-homomorphic Private Data Aggregation
A common path to privacy-preserving aggregation in WSNs is perturbing the raw data
being transmitted by introducing a random noise [22, 23, 10, 3]. He et al. [10] propose
two approaches to privacy-preserving data aggregation in WSNs. The basic idea of their
first approach, Cluster-based Data Aggregation (CPDA), is to introduce noise to the raw
data sensed by the sensor node, such that this noise will be cancelled out in the aggregation
operation resulting in an accurate aggregate value. The main idea of their second proposed
method, Slice-Mix-AggRegaTe (SMART), is to slice original data into pieces and recombine
them randomly. Next, the authors further improve their protocol to iPDA which preserves
the integrity of the data on top of its privacy [24]. In another perturbation-based effort,
Zhang et al. [3] propose Generic Privacy Preservation Solutions(GP∧2S) for approximate
aggregation. In their proposed technique, the values of the data transmitted in a WSN
are generalized such that individual data content cannot be decrypted. However, the ag-
gregator can still calculate an estimate of the data distribution, and hence, approximately
compute the aggregate value. Zanjani et al. [7, 8] propose a new energy-efficient aggregation
mechanism for WSNs using the concepts of coding theory. The sensor nodes are assigned
21

unique Orthogonal Chip Sequences (OCS) that are used to code and send their data on
the CDMA channel. The authors claim that, by utilizing ESTOC, data integrity can be
protected while aggregating. Also, ESTOC reduces Bit Error Rate (BER) and interference
caused by simultaneous transmission of nodes. Yan et al. [35] propose a secure in-network
data aggregation scheme to aggregate the data from smart appliances inside a Home Area
Network (HAN) utilizing the properties of SSC for efficient aggregation. The authors only
utilize OCSs for data aggregation and not for providing any security guarantees. They use
Message Authentication Codes (MAC) for checking the authenticity of the transmitted data.
However, confidentiality and integrity of the data is not protected. In our work, we propose
a secure aggregation scheme based on the properties of OCSs to preserve the confidentiality
of the transmitted data without relying on traditional cryptographic techniques.
2.2.3 Discussion
In the homomorphic encryption-based approaches discussed in [47, 50, 51, 55, 56, 57],
we observe that the power-usage information is generally of small size (e.g. 20 bits) [46,
12]. However, the plaintext input size of most existing homomorphic cryptosystems is huge
[47, 12], for example 2048 bits for the widely-used Paillier cryptosystem [19, 55, 57, 12]. As
a result, the input data has to be padded before encryption and the size of the output is
also large. Given the high frequency of data collection and the number of deployed smart
meters, this will result in unacceptable communication overhead on the network, and also
high processing burden on the smart meters with limited computational capabilities [12, 58].
Aggregation schemes that construct and utilize the spanning-tree, for instance by Li et al.
[50], also do not consider performance issues. The processing and communication overhead
makes the protocol less suitable in practical implementations. Moreover, depending on the
depth of the spanning tree of the network, there can be large delays between the time power
consumption data is reported by the meters and the time the aggregated data is received
at the UC. In approaches proposed in [24, 10], the perturbed or the sliced data need to
22

be encrypted before being sent to the neighbors. However, the key-distribution for such
symmetric pair-wise encryption is non-trivial. In other words, any two node in the network
will share symmetric keys which will result in a key distribution complexity of order O(n2),
where n is the number of nodes in the network. Moreover, this encryption can put extra
burden on the nodes with limited capabilities. Phulpin et al. [9] study the efficiency and
benefits of network coding in both Power Line Communications (PLC) and wireless SGNs.
The authors also show that using coding theory in SGN reduces the delay by decreasing the
number of time slots and saves energy by reducing the number of transmissions.
Based on the aforementioned observations, designing an efficient privacy-preserving tech-
nique for aggregating SM data without using traditional crypto primitives with homomorphic
properties seems to be necessary. We are proposing a privacy-preserving aggregation scheme
using coding theory, spread spectrum communications, and statistical perturbation in order
to efficiently aggregate power usage while improving network performance and decreasing
unnecessary communication and computation loads on the SGN. Our contention-free scheme
will also decrease the delay, BER, and interference. Our contributions are twofold: First, we
introduce a simple, yet efficient, approach to perturb user data before aggregation in order
to preserve user privacy. Second, we propose a secure aggregation scheme, AgSec, using
SSC. Finally, we assess the performance of our scheme through analytical evaluations and
simulations.
2.3 Network Architecture
2.3.1 Network and Communication Model
Communication standards and technology to be used in the future smart grid and AMI
is an ongoing debate. There are various communication options proposed for the smart
grid including fiber optics, copper-wire line, power line communications, and miscellaneous
wireless technologies. We consider the widely used wireless architecture for the deployment
of SGN [48]. The wireless communication between SMs, which are organized into groups
23
called clusters, and the aggregator or Cluster Head (CH) uses IEEE 802.15.4 or Zigbee due to
characteristics such as low power, short delay, self-organization, scalability, and high security
[48]. The aggregated data will be forwarded from the CH to the UC using a dedicated point-
to-point link.
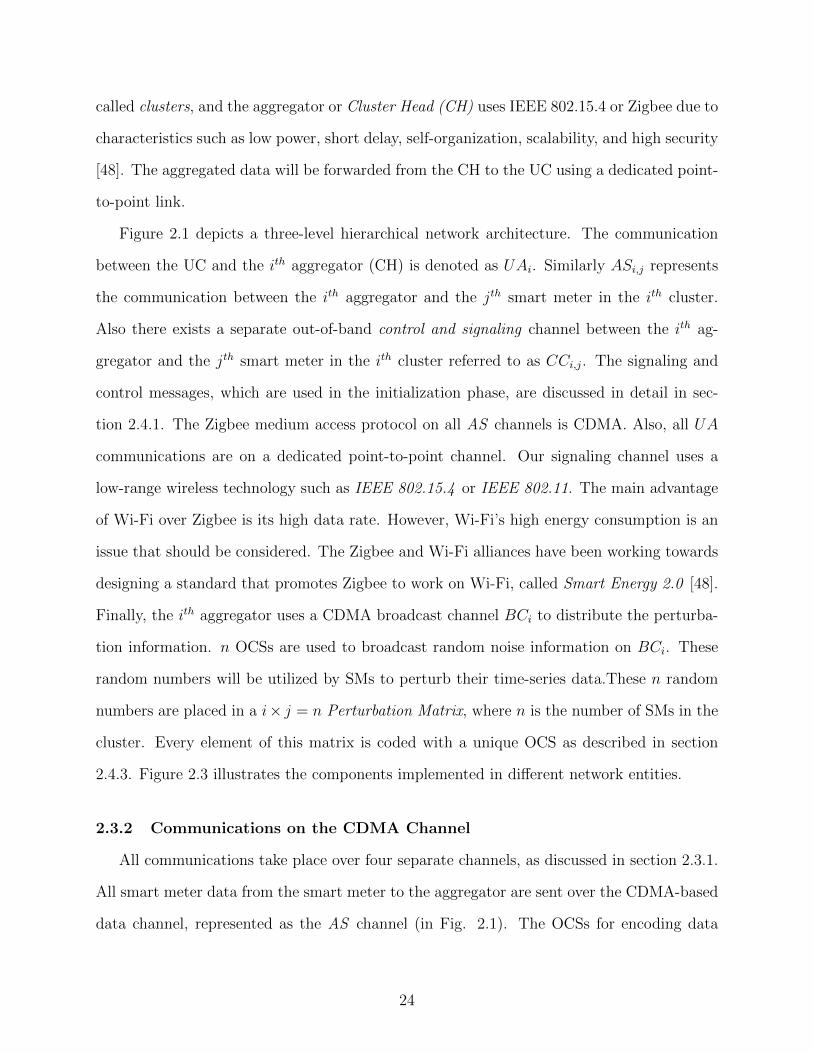
Figure 2.1 depicts a three-level hierarchical network architecture. The communication
between the UC and the ith aggregator (CH) is denoted as UAi. Similarly ASi,j represents
the communication between the ith aggregator and the jth smart meter in the ith cluster.
Also there exists a separate out-of-band control and signaling channel between the ith ag-
gregator and the jth smart meter in the ith cluster referred to as CCi,j. The signaling and
control messages, which are used in the initialization phase, are discussed in detail in sec-
tion 2.4.1. The Zigbee medium access protocol on all AS channels is CDMA. Also, all UA
communications are on a dedicated point-to-point channel. Our signaling channel uses a
low-range wireless technology such as IEEE 802.15.4 or IEEE 802.11. The main advantage
of Wi-Fi over Zigbee is its high data rate. However, Wi-Fi’s high energy consumption is an
issue that should be considered. The Zigbee and Wi-Fi alliances have been working towards
designing a standard that promotes Zigbee to work on Wi-Fi, called Smart Energy 2.0 [48].
Finally, the ith aggregator uses a CDMA broadcast channel BCi to distribute the perturba-
tion information. n OCSs are used to broadcast random noise information on BCi. These
random numbers will be utilized by SMs to perturb their time-series data.These n random
numbers are placed in a i× j = n Perturbation Matrix, where n is the number of SMs in the
cluster. Every element of this matrix is coded with a unique OCS as described in section
2.4.3. Figure 2.3 illustrates the components implemented in different network entities.
2.3.2 Communications on the CDMA Channel
All communications take place over four separate channels, as discussed in section 2.3.1.
All smart meter data from the smart meter to the aggregator are sent over the CDMA-based
data channel, represented as the AS channel (in Fig. 2.1). The OCSs for encoding data
24

. Cluster k
UA 2
UA k
. . .
Cluster 2
Utility
Center
UC
Cluster 1
Aggregator
(Cluster-head)
Smart
Meter. . .
AS channel
UA channel
CH channel
1CH
1
UA
1,1SM 1,2SM1,nSM
1,1AS
1,2
AS
1,n
AS
1,1
CC
1,2
CC
1,n
CC
1BC1BC
BC channel
Figure 2.1: Network Architecture.
transmission on the AS channel are generated using the Golay or PCC code generation
algorithms [4, 5]. These OCSs will be used to spread the data as explained later in Section
4.4. Golay OCSs can be generated recursively, as shown in Eqn. 2.1.
**************************CL =
CL2
C̄L2
CL2−C̄L
2
CL = [ AL BL ] , C̄L = [ AL −BL ] and C1 = C̄1 = [−1] (2.1)
In Eqn. 2.1, L = 2M is the total number of available OCSs (which is also equal to the
OCS length), where M ≥ 1 is the number of chips in each OCS. AL and BL are L × L2
sub-matrices. In recursive OCS generation algorithms such as Golay (or PCC), OCSs can be
organized into groups called flock based on chip pattern similarity and chip distance between
OCSs. In Fig. 2.2-a, we can see the different flocks for 16-chip OCSs. Both Golay and PCC
algorithms are able to produce L OCSs with a length of L-chips. The PCC generator matrix
is shown in Eqn. 2.2 and OCSs of 16-chip length generated using PCC are shown in Fig.
2.2-b. OCSs generated by PCC have a uniform distribution of 1’s and -1’s, in contrast to
OCSs generated by Golay. This property, which will result in having equal number of 1’s and
-1’s, makes data transmission using PCC more fault tolerant than Golay. We can use any
25

OCS generator algorithm (synchronous or asynchronous) in our proposed method. However,
PCC and Golay are preferred because of equality in OCS length and number of generated
OCSs, and high level of orthogonality [5].
-1 -1 -1 +1 -1 -1 +1 -1 -1 -1 -1 +1 +1 +1 -1 +1 -1 +1 -1 -1 -1 +1 +1 +1 -1 +1 -1 -1 +1 -1 -1 -1 -1 -1 +1 -1 -1 -1 -1 +1 -1 -1 +1 -1 +1 +1 +1 -1 -1 +1 +1 +1 -1 +1 -1 -1 -1 +1 +1 +1 +1 -1 +1 +1 -1 -1 -1 +1 +1 +1 -1 +1 -1 -1 -1 +1 -1 -1 +1 -1 -1 +1 -1 -1 +1 -1 -1 -1 -1 +1 -1 -1 -1 +1 +1 +1 -1 -1 +1 -1 +1 +1 +1 -1 -1 -1 +1 -1 -1 -1 -1 +1 -1 +1 +1 +1 +1 -1 +1 +1 -1 +1 +1 +1 -1 +1 -1 -1 -1 -1 -1 +1 -1 -1 +1 -1 +1 +1 +1 -1 -1 -1 +1 -1 -1 +1 -1 -1 -1 +1 +1 +1 +1 -1 +1 +1 -1 +1 +1 +1 -1 -1 +1 -1 -1 -1 -1 +1 +1 +1 -1 +1 -1 -1 -1 +1 -1 +1 +1 +1 -1 +1 -1 -1 +1 -1 -1 -1 -1 +1 -1 -1 -1 -1 -1 +1 +1 +1 -1 +1 +1 +1 +1 -1 +1 +1 -1 +1 -1 +1 -1 -1 +1 -1 -1 -1 +1 -1 +1 +1 +1 -1 -1 -1 -1 -1 +1 -1 +1 +1 +1 -1 +1 +1 -1 +1 +1 +1 +1 -1
-1 +1 +1 +1 +1 -1 +1 +1 +1 -1 -1 -1 +1 -1 +1 +1
Flo
ck 1
Flo
ck 2
Flo
ck 3
Flo
ck 4
-1 -1 -1 +1 -1 -1 -1 +1 -1 -1 -1 +1 +1 +1 +1 -1 +1 -1 +1 +1 +1 -1 +1 +1 +1 -1 +1 +1 -1 +1 -1 -1 -1 -1 +1 -1 -1 -1 +1 -1 -1 -1 +1 -1 +1 +1 -1 +1 -1 +1 +1 +1 -1 +1 +1 +1 -1 +1 +1 +1 +1 -1 -1 -1 +1 +1 +1 -1 -1 -1 -1 +1 +1 +1 +1 -1 +1 +1 +1 -1 -1 +1 -1 -1 +1 -1 +1 +1 -1 +1 -1 -1 -1 +1 -1 -1 +1 +1 -1 +1 -1 -1 +1 -1 +1 +1 -1 +1 +1 +1 -1 +1 +1 -1 -1 -1 -1 +1 +1 +1 +1 -1 -1 -1 +1 -1 -1 -1 -1 -1 -1 +1 -1 -1 -1 +1 +1 +1 +1 -1 -1 -1 -1 +1 +1 -1 +1 +1 +1 -1 +1 +1 -1 +1 -1 -1 +1 -1 +1 +1 -1 -1 +1 -1 -1 -1 +1 -1 +1 +1 -1 +1 -1 -1 +1 -1 -1 +1 +1 +1 -1 +1 +1 +1 +1 -1 -1 -1 -1 +1 +1 +1 -1 -1 -1 +1 +1 +1 +1 -1 +1 +1 +1 -1 +1 +1 +1 -1 +1 -1 +1 +1 -1 +1 -1 -1 -1 +1 -1 -1 -1 +1 -1 -1 -1 -1 +1 -1 +1 +1 -1 +1 +1 +1 -1 +1 +1 +1 -1 +1 -1 +1 +1 +1 +1 -1 -1 -1 +1 -1 -1 -1 +1 -1 -1 -1
Flo
ck 1
Flo
ck 2
Flo
ck 3
Flo
ck 4
(a)
(b)
Figure 2.2: a) A 16-chip Golay OCS matrix. b) A 16-chip PCC OCS matrix.
****************P4n =
P4n−1 P4n−1 P4n−1 −P4n−1
−P4n−1 P4n−1 −P4n−1 −P4n−1
P4n−1 P4n−1 −P4n−1 P4n−1
P4n−1 −P4n−1 −P4n−1 −P4n−1
∀n ≥ 1, P1 = [−1] (2.2)
26

Let us assume that time is divided into periods of random length denoted by a random
variable ψτ . During each period, each smart meter is assigned a subset of OCSs for use in
that period by the CH. The assignment happens over the CC signaling channel. The com-
munications over the CC channels are secured, from possible sniffing nodes, using symmetric
key cryptography and shared keys between SM and CH. The OCSs for each smart meter
are randomly selected by the CH from a large pool of available OCSs. Each smart meter
will use the OCSs uniquely assigned to it in the time frame ψτ . In order to spread data
bits on the AS data channel, the smart meter calculates the inner-product of every data-bit
in appropriate OCS. Every single bit of data is coded independently with an OCS different
from the previous and next data bit. This will build the foundation of our secure scheme as
described in section 2.4.3. It should be noted that it is possible for multiple smart meters
to use the same OCS for data transmission in different parts of the network as long as their
transmission ranges do not overlap and the SMs are in two diffrent clusters. This is required
to make sure that the transmissions do not interfere with each other (in general, interference
is anything that alters, modifies or disrupts a signal as it travels between a source and a
receiver). The same CDMA concepts and principles are also deployed on the BCi channel.
This broadcast channel is used by the CH to advertise perturbation data to the SMs, as
discussed in section 2.4.2.
It should be noted that, before spreading the data on the CDMA channel using the
introduced OCSs, a scrambling code is utilized between the sender and receiver for security
purposes. This code, which is generally 242 chips long , is referred to as the Long Code. In
order to appropriately use this long code, the sender and receiver must be synchronous with
a GPS or Coordinated Universal Time (UTC) system [85].
2.3.3 Adversary Model
Based on their behavior, all entities in the proposed smart grid communication network
can fall into one of the following three broad categories. (i) honest entities that fully follow
27

Pertu
rbatio
n U
nit
ER
T- b
it Spre
ader
SM
AS
UCO
CS
dedic
ato
r
Ap
plic
atio
ns a
nd fu
nctio
ns
nth
encoded
bit
1st Bits
stream bit
s/
L
Re
ce
ive
d b
its
CH
+.
.
.
SS2
nth
encoded
signal
nth Bits
stream
2nd
encoded
signal
2nd
Bits
stream bit
s/
L
bit
s/
L
UACC
OCS Changer
.
.
.
1st bit
2nd
bit
nth bit
SS1
SSn
2O
CS
1O
CS
nO
CS
2O
CS
nO
CS
Mete
ring E
ngin
e
1st
encoded
signal 1O
CS
Assem
ble
r
Pertu
rbatio
n A
lgorith
m
BC
Figure 2.3: Entities used in the privacy-preserving aggregation.
the rules of the established protocol. (ii) malicious or cheating nodes that do not follow the
protocol. Malicious behavior includes, but is not limited to, insertion, deletion, and forging
of massages in the system. (iii) semi-honest or honest-but-curious nodes that follow the
defined protocols but they attempt to infer privacy-sensitive data from the input/output of
the protocols and the intermediate data generated due to protocol execution. In our proposed
scheme we consider the UC and the CH as honest-but-curious. In other words, they follow the
established protocol but they can also try to infer privacy-sensitive information from the time-
series data. The neighboring SMs are, generally, semi-honest. Our objective is to completely
secure all the communications from malicious and semi-honest SMs and other adversarial
nodes against possible sniffing, spoofing, and inference attacks and hence, maintain the
consumers’ privacy while still providing the UC with required aggregate values. Particularly,
we are interested in protecting the system against the following attacks: (i) inference of
individual data by CH and UC. (ii) eavesdropping (sniffing) by external adversaries. (iii)
forging (spoofing) of smart meter data.
28

2.4 Privacy-Preserving Aggregation
2.4.1 Initialization Phase
Upon initial deployment, CHi communicates control information to smart meter SMj
through CCi,j. For each time duration ψτ , the CH assigns each smart meter, SMj, a set
of attributes including, a temporary eight-bit identifier (IDi,j) and a group of valid OCSs,
denoted by Gjψτ
= {OCSj1ψτ , OCSj2ψτ, ..., OCSjζψτ}. Also, the CH advertises the OCSs it is
going to use for sharing perturbation information, denoted by OCS(λ1,λ2,...,λn),τ for timeslot
ψτ , on BCi via the same CCi,j, as will be discussed later in section 2.4.2. These OCSs
will be used by SMs to code/decode on the broadcast perturbation channel. The integrity,
authenticity, and confidentiality of the communication between the CH and the SMs during
the initialization phase are ensured using appropriate cryptographic techniques. In this
phase, every smart meter gets the information required for data transmission on the CDMA
channel and for data perturbation in the next t time-slots, as illustrated in Fig. 2.4. It
should be noted that, as this is a one-time process in every t time slots and ψt � ψτ , the
imposed overhead is negligible. Also, we are not including any frame-level error checking
mechanisms such as CRC because of the inherent fault-tolerance properties present in spread
spectrum communications.
1ψ 2ψ 3ψΓψ
1ID 2ID 3ID ΓID. . .
. . .
1
1
1
1ψ
2ψ
3ψ
OCS
OCS
OCS
2
2
2
1ψ
2ψ
3ψ
OCS
OCS
OCS
3
3
3
1ψ
2ψ
3ψ
OCS
OCS
OCS
Γ
Γ
Γ
1ψ
2ψ
3ψ
OCS
OCS
OCS
tψ
1 n( λ ,...,λ ),1OCS1 n( λ ,...,λ ),2OCS
1 n( λ ,...,λ ),3OCS1 n( λ ,...,λ ),ΓOCS
Figure 2.4: Initialization Parameters.
2.4.2 Privacy-Preserving via Random Noise Perturbation
Before discussing our secure aggregation protocol, we would like to introduce our random
noise perturbation technique. Instead of aggregating the original smart meter data and
29
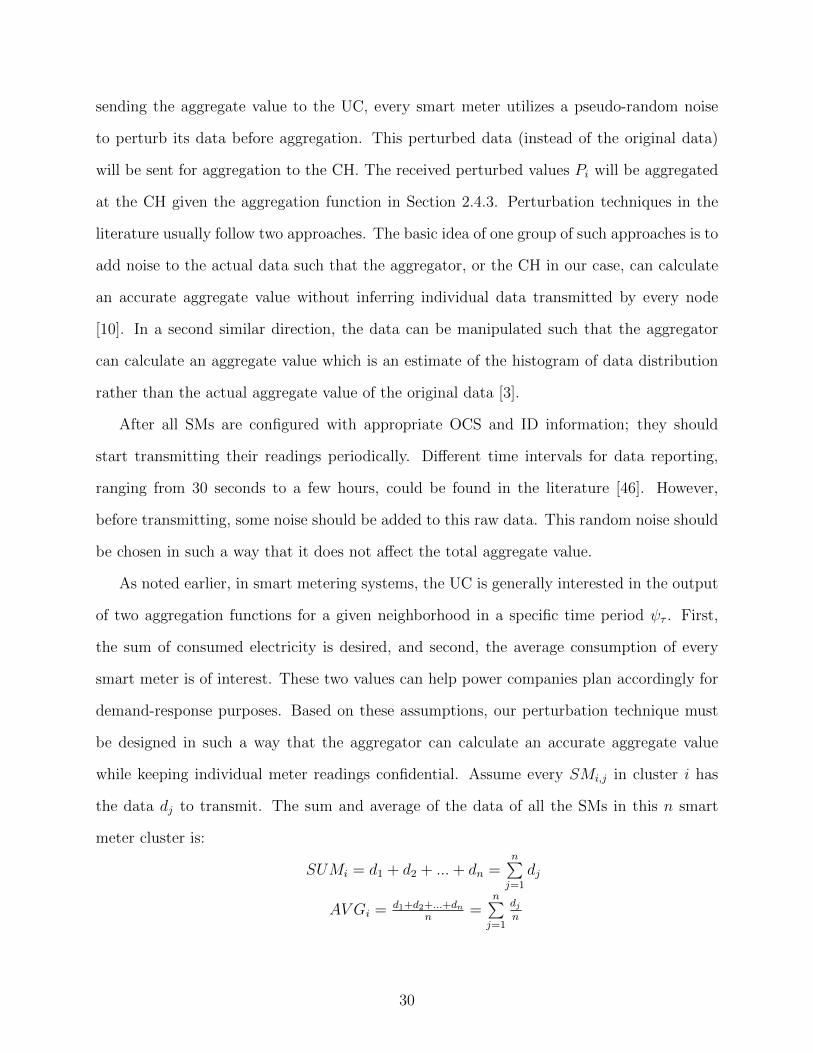
sending the aggregate value to the UC, every smart meter utilizes a pseudo-random noise
to perturb its data before aggregation. This perturbed data (instead of the original data)
will be sent for aggregation to the CH. The received perturbed values Pi will be aggregated
at the CH given the aggregation function in Section 2.4.3. Perturbation techniques in the
literature usually follow two approaches. The basic idea of one group of such approaches is to
add noise to the actual data such that the aggregator, or the CH in our case, can calculate
an accurate aggregate value without inferring individual data transmitted by every node
[10]. In a second similar direction, the data can be manipulated such that the aggregator
can calculate an aggregate value which is an estimate of the histogram of data distribution
rather than the actual aggregate value of the original data [3].
After all SMs are configured with appropriate OCS and ID information; they should
start transmitting their readings periodically. Different time intervals for data reporting,
ranging from 30 seconds to a few hours, could be found in the literature [46]. However,
before transmitting, some noise should be added to this raw data. This random noise should
be chosen in such a way that it does not affect the total aggregate value.
As noted earlier, in smart metering systems, the UC is generally interested in the output
of two aggregation functions for a given neighborhood in a specific time period ψτ . First,
the sum of consumed electricity is desired, and second, the average consumption of every
smart meter is of interest. These two values can help power companies plan accordingly for
demand-response purposes. Based on these assumptions, our perturbation technique must
be designed in such a way that the aggregator can calculate an accurate aggregate value
while keeping individual meter readings confidential. Assume every SMi,j in cluster i has
the data dj to transmit. The sum and average of the data of all the SMs in this n smart
meter cluster is:
***************************SUMi = d1 + d2 + ...+ dn =n∑j=1
dj
******************************AV Gi = d1+d2+...+dnn
=n∑j=1
djn
30

Now, assume that every SM adds a random value (noise) to its original data before trans-
mission (How this noise is generated and distributed will be explained later in this Section).
We denote the perturbed data of SMj by Pj = dj +αj, where αj is the random noise added
to the raw data by SMj. Hence, CH will be computing the sum of Pj’s denoted by SUM ′i :
**********************SUM ′i = (d1 + α1) + (d2 + α2) + ...+ (dn + αn)
****************************=n∑j=1
(dj + αj) =n∑j=1
(pj)
In order for the CH to be able to calculate an accurate aggregate value we must have:
SUMi = SUM ′i (and consequently AV Gi = AV G′i). This implies that:
**************************n∑j=1
αj = α1 + α2 + ...+ αn = 0
Thus, for every given time period ψτ the CH must generate a series of random numbers that
satisfy the above condition. These random numbers are advertised on the CDMA broadcast
channel BCi as an n element matrix where n is the number of SMs in cluster i. These n
pseudo-random numbers are generated considering the following principles. These principles
will guarantee that the summation of all the pseudo-random numbers is zero at all times.
1. If the number of SMs in the cluster is even (n is even), the CH will randomly generate
n2
positive integers αj from the range [0,max]. Then, for every positive integer αj it
will place both αj and −αj in the perturbation matrix.
2. If the number of SMs in the cluster is odd (n is odd), the CH will randomly generate
n−32
positive integers αj from the range [0,max]. Then, for every positive integer αj
it will place both αj and -αj in the perturbation matrix. Next, it produces a positive
random number ασ and puts ασ, −ασ2
, and −ασ2
in the perturbation matrix (and hence
having generated n random numbers).
After the perturbation matrix is generated by the CH, it should be advertised on BCi.
Every single element of this matrix, which includes a random number, will be encoded by
an appropriate OCS (these OCSs are already shared in the initialization phase between the
31

CH and SMs) and broadcast on the BCi channel. ξ(αj, OCSλj) denotes the jth element of
the matrix including pseudo-random number αj encoded with OCSλj . Every SM senses the
channel, picks a random element of the matrix, decodes it with appropriate OCS (which it
already learnt in the initialization phase) and uses that pseudo-random number to perturb
its data. After the jth element of the matrix is fetched and decoded, the SM will jam that
element of the matrix (representing an invalid or already-used pseudo-random number) [6].
Assume SMk has fetched and decoded pseudo-random number αj spread with OCSλj . After
this pseudo-random number αj is used by SMk, it needs to be jammed so that no other
SM in the network uses the same αj. In order for SMk to generate the jamming signal,
it transmits a packet with data value “all 1s” spread with OCSλj (the same OCS that the
pseudo-random number was encoded with), and with a higher transmit power. This will
result in the corruption of αj on the CDMA channel and will ensure that every αj is used
only by one smart meter, and hence, the summation of the added noise to the original data
of all SMs in a given cluster is zero. It is worth mentioning that this jamming signal is
transmitted without any transmitter-specific parameters, such as a source MAC address.
This will ensure that the jamming signal cannot be linked to the transmitting SM, and thus,
the pseudo-random numbers used by the smart meters are kept private and can be identified
neither by the CH, nor by passive sniffing adversaries. To make the protocol more efficient,
after αj is replaced by all 1’s, the CH can infer that this element of the matrix has been
used, and hence, will stop advertising αj. Consequently, SMk will stop jamming on that
specific OCS. Figure 2.5 illustrates the perturbation matrix.
As an alternative solution, after a smart meter fetches a pseudo-random number, it
can send a packet on the control channel back to the CH indicating that pseudo-random
number has been used. The sender of the packet has to be anonymized such that CH
cannot distinguish which SM is using that pseudo random number. Different anonymization
techniques (such as replacing the sender ID with a pseudonym) can be found in the literature
32

[2]. In the anonymization process, the packets sent from SM to CH are anonymized, i.e., the
user part (source) of each packet is replaced by a user pseudonym.
One-to-one Random Number Assignment : In order for the perturbation proposal to work
as desired, we need to make sure that there is a one-to-one relationship between the random
numbers αi and the smart meters SMj. This one-to-one assignment cannot be handled by
the CH as it will result in compromising the privacy of SM data. Thus, it is crucial to design
a mechanism to guarantee that every SM is using one unique random number and every
random number is being used by atmost one SM. Let us assume that the SMs in a given
cluster are time-synchronized. While the CH is advertising the random numbers matrix on
BCi channel, at the beginning of each time slot every SM accesses the data on each OCS
with probability p and the SM will not read the data encoded with that specific OCS with
probability (1− p). A SM can use the accessed α only if no other SM has fetched the same
α. Remember, after every αi is fetched, the SM will send a jamming signal on that specific
OCS; if more than two SMs are jamming the same OCS a collision is detected. This process
is continued until all SMs have received one unique perturbation value. Suppose there are
n′ smart meters trying to access unique pesudo-random numbers at a given time instant.
Then, the probability that accessing a given α is successful is the probability that only one
of the SMs accesses that α and the other (n′ − 1) SMs do not. The probability that an SM
reads α is p; the probability that all other SMs do not read that α is (1− p)(n′−1). Therefore
the probability that a given SM has a success is p× (1− p)(n′−1). Because there are n′ SMs,
the probability that any one SM has a success is n′ × p× (1− p)(n′−1)
7 5 2
1 8 3
9 4 6
17( , )OCS
25( , )OCS
6( , )n
OCS
.
.
.
2SM
1SM
9SM
.
.
.
.
.
.
CH
Perturbation Matrix
Figure 2.5: Perturbation Matrix.
33

2.4.3 Proposed Secure Aggregation Protocol(AgSec)
After each SM adds appropriate noise to its original metering data, this perturbed data
should be transmitted to the CH. In order to preserve data confidentiality against possible
malicious entities and also other semi-honest smart meters and aggregators, we introduce a
novel aggregation scheme that does not utilize cryptography and yet keeps the transmitted
data secure. As discussed in section 2.3.2, each node j is assigned a group of OCSs (Gjψτ
)
for each time interval ψτ . The kth bit of the (perturbed) data-stream generated by SMj will
be coded with Oj(k mod g), where g is the total number of OCSs assigned to SMj in a given
timeslot ψτ . The OCS Oi(t) assigned to any SMi at any instant of time t can be represented
as shown in Eqn. 2.3.
Oi(t) =L−1∑j=0
O(j,i).p(t− jTc) (2.3)
In Eqn. 2.3, p(t) is a rectangular pulse which is equal to 1 for 0 ≤ t < Tc and zero otherwise.
Tc is the chip duration of the OCS and O(j,i) is the jth chip of the OCS assigned to SMi
(from the set of all OCSs CL). The signal generated after encoding a data symbol of SMi
with the corresponding OCS is given by:
xi(t) = di
L−1∑j=0
O(j,i).p(t− jTc) 0 ≤ t < Tf (2.4)
where, di is the data symbol of SMi that needs to be encoded and Tf = L.Tc is the duration
of the encoded data symbol or data bit. The inner product of the sent bit with the OCS is
done bit-synchronously. Then, the overall transmitted signal x(t) of all n SMs in a cluster
can be given by Eqn. 2.5 [4].
x(t) =n∑i=0
xi(t) (2.5)
CH will receive a signal including all the bits transmitted by all the smart meters. The
received signal will be decoded by CH using all valid OCSs that it initially assigned to the
SMs. Since CH maintains a table of assigned OCSs (in the same order that was agreed in
the initialization phase) and IDs to every single SM in the network, it is able to decode the
34

data by using appropriate OCS for every bit. Hence, after decoding the received signal, CH
has all individual (perturbed) data sent by all the SMs in the cluster. Then, it adds all the
received data and sends the aggregate value to the UC on the point-to-point UA link. It
should be noted again, the perturbation noise will be cancelled out upon addition. Our pro-
posed secure aggregation technique is outlined in protocols 4, 5 and 6. (Even if data in transit
could be decoded, it would still not be useful to the adversary as they are already perturbed.)
1 : Function (UA data transmission)
2 : While data on UA channels do
3 : For all valid received aggregated data do
4 : Collect all data values;
5 : End For
6 : End While
7 : Utilize the aggregated data;
8 : End Function.******************************Protocol 4: UC function.
In protocol 4, the UC receives the aggregated data from the CH on the UA channel.
Protocol 5 elaborates how CH generates and distributes OCSs (for aggregation and pertur-
bation) to the SMs. Also, it shows how the data is despread, aggregated, and forwarded to
the UC by CH. Finally, protocol 6 elaborates how SM receives the initialization information,
perturbs data and transmits to the CH on the AS channel.
2.4.3.1 Security Analysis
Here, we would like to show that sniffing attacks against our CDMA-based aggregation
are not feasible. This argument is based on the following considerations:
1. In any CDMA system, synchronous transmitters and receivers use a scrambling code,
referred to as the Long Code or Privacy Code, which is used as a measure of security.
This code is generally 242 chips long and will return to its initial state after 41.43
35

days. For any sniffing adversary to decode the transmitted packets, it requires a prior
knowledge of this long code [85].
2. Every P bits of data in the smart meter packet is encoded with sixty four possible
OCSs resulting in LP combinations (every SM packet is P bits long). Also, every one
of these LP combinations is a valid numeric value (assuming that smart grid data only
contains numbers) that are indistinguishable from the adversary’s perspective.
Now, assume that a packet is captured by a sniffer. Every bit of this packet will be
spread with a 242 bit long code and a L chip OCS. Given the length of the packet, this
will result in (242 × L)P
possible combinations which will be infeasible to decode for sniffing
attackers. The only entity in the network that knows about the set of assigned OCSs to the
smart meters is the CH. Hence, data confidentiality, to a great extent, will be preserved and
privacy-sensitive information cannot be inferred by semi-honest and malicious entities.
1 : Function (AS operation)
2 : For each each time perioud ψτ do
3 : Generate the OCS table with Golay;
4 : Function (Initialization);
5 : For each each time period ψτ do
6 : Generate the perturbation table and advertise on BC do;
7 : For each advertised element on BC do;
8 : If receive jamming signal on OCSλi then;
9 : Stop advertising on OCSλi ;
10 : End If
11 : Function(AS data transmission);
12 : End For
13 :End For
14 :End Function
36

15 : Function (Initialization)
16 :Generate random IDs for SMs;
17 :Assign OCSs to each SN;
18 :End Function
19 : Function (AS data transmission)
20 : While data on AS channel do
21 : For all valid OCSs do
22 : Decode every received bit with appropriate OCS and reconstruct every SMs data;
23 : End For
24 : Calculate the SUM of all the received data;
25 : Forward the aggregate value to the UC;
26 : End While
27 : End Function.******************************Protocol 5: CH function.
1 : While network is ON do
2 : Function(BC data);
3 : Function(Metering engine);
4 : End While
5 : End Function.
6 : Function (BC data)
7 : For OCSλj do
8 : Decode the received αj on OCSλj ;
9 : Transmit a jamming signal on OCSλj to jam αj ;
10 : End While
11 : End Function.
37

12 : Function (Metering engine)
13 : While metering engine is ON do
14 : Add αj to the original data;
15 : Encode the kth of the perturbed data with Oj(k mod g);
16 : Spread the encoded data on the AS CDMA channel;
17 : End While******************************Protocol 6: SM function.
2.5 Evaluation and Simulation Results
Below, we present a simple analysis that compares end-to-end and hop-by-hop delays in
homomorphic approaches versus our proposed CDMA-based aggregation. We evaluate the
performance of our aggregation scheme through extensive simulations.
2.5.1 Performance Evaluation by Numerical Analysis
As discussed in section 2.2.1, existing secure aggregation schemes impose a significant
communication and computation overhead on SGNs with limited capabilities. Private ag-
gregation schemes based on the homomorphic properties of cryptosystems require fixed large
size input blocks and are not ideally suited for small-sized data generated by SMs. The 20
to 30 bit [47] output data generated by SMs has to be padded, e.g., to 2048 bits for Paillier
[19], before encryption. In our approach, by choosing OCSs with appropriate length, this
overhead can be significantly reduced. Readers should note that in our scheme each bit will
be spread to L bits after encoding.
In this section, we will numerically compare End-to-End (ETE) delay in our approach
and homomorphic-based aggregation schemes. We are evaluating our results with clusters of
ten and also twenty smart meters and assuming that each SM is assigned three OCSs to use
in every given time slot. Given that each SM is assigned three OCSs, using an OCS with
L = 32 and L = 64 will be ideal for each scenario, respectively. The OCS length L limits
the maximum number of users per cluster to L
|Gjψτ |. The total number of users in the network
38

is independent of the OCS structure used. The transmission delay (DT ) for one SM can be
calculated as:
DT =(F +HID).L
R(2.6)
where F is the frame length, HID is the ID header, L is the OCS length and R is the link
bit-rate. Given Eqn. 10, the transmission delay using L = 32 and L = 64, assuming a 200
kbps ZigBee link, is 4.8 ms and 9.6 ms, respectively. However, using traditional homorphic
cryptosystems as proposed by [50], the transmission delay(DT ) is:
DT =(HID +DC + TCRC)
R(2.7)
where HID is the identifier header, DC is the encrypted data (payload) and TCRC is the
error-checking trailer. Common SM and AMR systems generate data packets which contain
a 24-bit meter ID (HID), a 22-bit meter reading and a 16-bit CRC checksum (TCRC) [46].
This 22-bit meter reading is padded to 2048 bits before encryption and generates and output
cipher of length 2048 bits (DC). Based on these values, the transmission delay will be 10.44
ms for one SM. Another shortcoming of the privacy preserving homomorphic aggregation
schemes, such as [50], is that every node’s data should be passed hierarchically to the upper
level node in the aggregation tree. This process continues until all the data is aggregated at
the UC. However, this can increase the total delay which depends on the depth of the aggre-
gation tree. Thus, if the depth of the aggregation tree is ℘, the total transmission delay will
be DT × ℘. Given clusters of 10 or 20 SMs, in the worst case scenario, ℘ = 10 and ℘ = 20,
and consequently DT℘ = 104.4ms and DT℘ = 208.8ms, respectively. In the average case,
the length of the aggregation tree, considering clusters of ten or twenty SMs, will be ℘ = 4
and ℘ = 5. Hence, transmission delay is DT℘ = 41.76 ms and DT℘ = 52.2 ms, respectively.
Our approach overcomes this issue as all nodes are able to transmit their data simultane-
ously and independently. This shows that our protocol is independent of the depth of the
aggregation tree. Hence, using an OCS with appropriate length we are able to decrease the
39

overhead significantly, as seen in Table 2.1. It should be noted that we are only considering
the transmission delay. Moreover, given the high processing load and queuing delays due to
the non-simultaneous transmission and high BER and retransmissions, the overall delay of
the homomorphic approaches are too high compared with AgSec. Table 2.1 summarizes the
transmission delay and total communication overhead = Transmitted dataActual payload
.
Table 2.1: Transmission Delay and Communication Overhead
Agsec****L=32chips
Agsec****L=64chips
Homomorphic(Paillier)
DT for one SM (ms) 4.8 9.6 10.44DT for ten SM (ms) 4.8 9.6 104.44DT for twenty SM (ms) 4.8 9.6 208.8Communication Overhead 43.63 87.26 94.91
It is worth mentioning that Saputro and Akkaya [58] have analyzed the performance
of homomorphic aggregation through extensive simulations. Not surprisingly, their results
confirm our evaluation. The authors show that homomorphic encryption for data aggrega-
tion is very expensive in terms of communication overhead. They have also compared ETE
homomorphic data aggregation with Hop-by-Hop (HBH) decrypt, aggregate, encrypt at in-
termediate aggregator nodes via regular stream-ciphers, such as RC-4. Surprisingly, both
approaches show similar performance from a computation perspective (One multiplication
in homomorphic ETE aggregation is as expensive as three operations in HBH aggregation:
decrypt, add, encrypt) [58]. However, as our analysis also confirms, the authors show that
ETE aggregation via homomorphic encryption generates extraordinarily large data which
will result in unacceptable communication overhead on the SGN.
40

Figure 2.6: OCS Length versus Error.
Figure 2.7: OCS Length versus Communication Overhead.
2.5.2 Simulation Results
We evaluate our proposed privacy-preserving aggregation protocol in a 100 × 100 km2
simulated metropolitan area with 50000 SMs. Our first goal is to verify the efficiency of
our protocol in securely aggregating SM data as compared with existing approaches that
employ homomorphic encryption for aggregation. One of the first observations we make is
that, if appropriate parameters are chosen, our scheme performs more efficiently in terms of
communication overhead and delay. Simulation parameters can be found in Table 2.2.
41

Figure 2.8: OCS Length versus Delay.
The 50000 SMs are clustered into groups of n SMs per cluster, where n ≤ L
|Gjψτ |as every
SM will be assigned ψτ OCSs out of the all L possible OCSs. One important aspect of
the protocol that must be studied is the OCS length L which affects the number of SMs
per cluster, tolerated error at the receiver, delay, and communication overhead. We observe
that, at a constant SNR, the number of corrupted bits at the receiver decreases by increasing
OCS length (Figure 2.6). As it can be clearly seen in Fig. 2.6, at SNR = 10−3, if the OCS
length is equal to or greater than 32 chips, there will be no error at the receiver. OCS
lengths 16 and 8 will be ideal for SNR = 10−2 and SNR = 10−1, respectively. However,
there is a trade-off between error and communication overhead. An increase in the OCS
length will result in more communication overhead on the network. Our proposed scheme
will outperform homomorphic aggregation, in terms of communication overhead, if the OCS
length used is less than 128 chips. Figure 2.7 compares the communication overhead of our
proposed CDMA-based aggregation with homomorphic aggregation schemes such as [50].
This confirms our analysis that an OCS length of 32 or 64 will be ideal in terms of error and
communication overhead at SNR = 10−3.
As mentioned earlier, the delay in ETE homomorphic encryption depends on the number
of nodes and the depth of the aggregation tree. On the contrary, in our proposed scheme all
42

Table 2.2: Simulation Parameters
Parameter Value
Network size 100 × 100 km2
Cluster radius 100∼200 mNumber of SMs 50000Number of SMs per cluster bL
3c
AS Communication multi-plexing
CDMA
OCS generator algorithm 4 to 1024 chips Golay OCSsUA link point-to-pointAS, BC, CC links IEEE 802.15.4 Zigbee, FHSS, 2.4 to
2.48 GHzAS Bit rate 200 KbpsSM TX and RX power 100 mW, 20 dbmAggregator tree fixed/staticCC security public-key cryptography and digital
signiturePropagation model free space
the SMs are able to transmit their data independently and simultaneously. This will result
in a considerable decrease in the end-to-end delay. Figure 2.8 compares the delays of our
scheme with an ETE homomorphic approach such as [50]. As it can be clearly observed, our
CDMA-based aggregation scheme significantly reduces delay.
2.6 Conclusion
Existing approaches to privacy-preserving data aggregation in smart grid generally utilize
the homomorphic properties of public-key cryptosystems. However, as we have thoroughly
investigated, these approaches are expensive from a communication stand-point. In this
paper, we proposed a two- step process towards efficient private data aggregation in SGNs.
First, we introduced a random perturbation technique which is used to statistically alter
the time-series data of every SM such that individual consumption patterns could not be
inferred and yet the sum and average values of the reported power consumption in a given
neighborhood can be calculated accurately. Second, we proposed an efficient and secure data
43

aggregation scheme which utilizes the properties of spread spectrum communications. Our
evaluation and simulation results confirmed that our approach increases performance and
decreases unnecessary communication overhead on SGNs considerably, as compared with
existing homomorphic aggregation schemes.
44

CHAPTER 3QUANTIFYING SMART GRID PRIVACY WITH
INFORMATION THEORETIC METRICS
3.1 Introduction
In order to provide power reliably and efficiently to consumers, information and commu-
nication technologies (ICT) are being merged into the traditional power grid [48]. A Smart
Grid is an electrical grid that leverages communication technologies and information pro-
cessing to gather, process and act on collected information to improve reliability, efficiency,
economics, and sustainability of the power grid in generation, transmission, and distribu-
tion [44, 48, 83]. This two-way communication system enables Utility Companies (UC) to
remotely gather power consumption data from the users at short time intervals. This highly-
granular power usage data collected from the users’ Smart Meters (SM) will equip the UCs
with advanced features such as real time monitoring, fault-detection, self-healing [59, 60],
load balancing, demand-response, and peak-shaving [61, 49, 83]. The deployment of smart
grid will save energy, enable the use of dynamic pricing schemes, integrate renewable re-
sources and electric vehicles into the power grid, and provide greener and cleaner energy
[48, 83, 61].
The availability and processing of high precision energy data raises serious privacy-related
concerns from the consumers’ point of view. Due to such privacy issues, the Dutch Parliament
prohibited the deployment of smart meters [47]. Various research efforts have attempted
to study the private information that can be inferred from the fine-grained power data
[46, 47]. To bring up some tangible examples, Lisovich and Wicker [52] show that smart
meter data has a potential risk for absence/presence attack, i.e., it can be easily detected if
a residential building is vacant or not. In a similar research effort, Lisovich et al. [53] also
demonstrate that the location of the residents of a household can be easily tracked based on
the appliance they are using. Cohen [54] studies different privacy and security vulnerabilities
45

of the smart grid. The author shows that, apart from the extraction of possible private
information, the smart grid is also vulnerable to many cyber security attacks which can
target the confidentiality and integrity of the transmitted data or even the availability of the
power grid.
Many existing privacy-preserving techniques utilize the homomorphic properties of public-
key cryptosystems to perform data aggregation on encrypted SM data [50, 47, 51, 55, 56, 57].
These privacy-preserving approaches, although providing strong guarantees of confidential-
ity, are very heavy from a communication and computation standpoint [44, 58]. In another
research direction, large batteries are used between the resources (home appliances) and
the service provider (utility) in order to hide user’s usage patterns and to prevent physical
resource monitoring. Such techniques try to flatten the time-series smart grid data and hide
easily detectable usage information [63, 62, 64, 65]. It should be noted that these approaches,
although solving the problem to a great extent, do not seem to be practical as stated by
the authors in [62]. Alamatsaz et al. [44] propose an efficient and secure CDMA-based data
aggregation scheme to prevent possible sniffing and spoofing attacks using the properties of
orthogonal chip sequences.
Although there have been several efforts on designing Smart grid Privacy-Preserving
Mechanisms (SPPM), there has been very limited research on quantifying the privacy pro-
vided/lost by employing such SPPMs. It should go without saying that utilizing any mech-
anism to hide power usage information for preserving user privacy will result in a loss of
benefit (utility) from the UC’s perspective [69]. Thus, it is of paramount importance to
design a theoretical framework which can give both the consumers and the UCs the ability
to numerically evaluate the provided/lost privacy. Such privacy metrics can be utilized in
data sharing control systems, privacy visualization applications, etc.
In various other domains, such as databases [71], RFID [70], anonymity protocols [72, 82],
location-based services [67, 68], voting systems [81], and social networks [66], there have been
several contributions made to quantify privacy. Inspired by all the available privacy metrics
46

in the literature, in this chapter we thoroughly investigate the applicability of such metrics
for quantifying the privacy gained by applying different SPPMs. Then, we evaluate four
information theoretic metrics for smart grid privacy based on the concepts of information
entropy and try to analyze the certainty of the inference results of the adversary.
The rest of the chapter is organized as follows. In Section 3.2, we outline the framework
considered in this work and also look at some privacy-preserving techniques and terminolo-
gies. Then, we thoroughly investigate existing metrics for quantifying privacy in general.
In Section 3.3, we study the applicability of entropy-based metrics for quantifying smart
grid privacy. In Section 3.4, we evaluate the validity of such metrics through extensive il-
lustrations and simulations. Also, we apply this metric to study the privacy leakage of real
electricity usage data gathered from a set of smart meters deployed in the United Kingdom.
3.2 Preliminaries
3.2.1 The Framework
Here, we outline a formal framework for smart meter data and SPPMs. This abstraction
will allow us to precisely evaluate the applicability of existing privacy metrics. First off,
let us assume that SM readings are denoted with a Gaussian random variable X [69]. The
sampled instances of this random variable X take values from the set SX = {xi ∈ [0,max]},
called support or range of X. We also assume a generic Transfer Function (TF) that maps
the readings to an obfuscated value X̂ with realizations of SX̂ = {x̂i ∈ [δ, %]}, where δ and
% depend on the TF (different obfuscation mechanisms are discussed in section 3.2.2). Let
fX(x) and fX̂(x̂) denote the probability density functions (pdf) of random variables X and
X̂, respectively. The TF: X → X̂ is a one-to-one function. Different TFs for obfuscating
the data can be found in the literature [67]. The Transfer Function is a function that maps
actual metering values, xi ∈ SX , to obfuscated values x̂i ∈ SX̂ . To keep our discussion general
enough, we are not assuming any specific TF at this point. The goal of the adversary is to
infer X from observing X̂ and a set of other a priori knowledge such as partial traces of X,
47

time information, etc. denoted by {E1, E2, · · · , En}. Let AF denote the Attack Function
(AF) that takes the obfuscated values X̂ and a vector of random variables {E1, E2, · · · , En}
as inputs and generates output Y with range SY = {yi ∈ [0,max]} and pdf fY (y). We would
like to argue that a privacy metric should be general and independent from the SPPM and
the capabilities of the adversary given the fact that SPPMs and extraction and inference
techniques from smart grid data are at their early stages and such techniques are expected
to mine information from smart meter data in ways that are possibly a lot more advanced
and complicated in the future. Hence, we are not considering any specific Attack Functions
in our analysis. Given the strengths and a priori knowledge of the adversary, the output Y
of the AF differs significantly.
Transfer
FunctionX
Attack
FunctionX̂ Y
1E 2E nE
. . .
X̂
Figure 3.1: Transfer and attack functions
3.2.2 Privacy-Preserving Techniques and Terminologies
In general, privacy-preserving mechanisms can be classified into one of the following three
broad categories:
Elimination: One approach to preserving privacy is eliminating some events (based on
a specific algorithm). This will reduce the precision of the data and hence make inference
more difficult.
Obfuscation: In this category of privacy-preserving techniques, the actual data is modified
or distorted before being released to the outside world, i.e., before becoming observable,
48

the values xc ∈ SX are generally replaced with an obfuscated value x̂o ∈ SX̂ . Different
obfuscation mechanisms include, reducing precision, perturbation (adding noise), adding false
data [67], and time-series manipulation, for example, using large batteries [65].
Anonymization: In anonymization techniques, the goal is to hide the source of the data,
or the user. The user identifier is generally replaced with a user-pseudonym. One of the
well-known annonymization techniques is k-anonymity as elaborated in section 3.2.3 [80].
However, most of the privacy-preserving mechanisms in smart grid lack a formal analyt-
ical model to compute the amount of privacy gained. In other words, these methods simply
attempt to preserve consumers’ privacy without showing how private the method is. In this
section, we will present some of the existing metrics in the literature, but before doing so,
let us define three common terms that are, mistakenly, used interchangeably in the context
of quantifying privacy. There is a subtle yet important difference between the accuracy,
certainty, and correctness of the inference attack of the adversary [67].
Accuracy : Confidence intervals and confidence levels are used to measure the accuracy of
the inference. Confidence level is equal to the probability that the precise value of Pr(x|x̂) is
within the confidence interval. Suppose L and U are functions of the random sample. L and
U are determined such that the interval includes a parameter θ. In other words, if 0 < α < 1,
then, P (L < θ < U) = 1− α. The interval (L,U) represents a confidence interval for θ with
confidence level 1 − α [76]. In the worst case scenario, the confidence interval will be zero,
and hence, the confidence level will be 1. In this case the inference will be very accurate. It
can be concluded that the accuracy of the inference will be higher if the confidence level is
high and the confidence interval is small [67].
Certainty : Entropy shows how uniform or concentrated the estimated distribution is and
with how much certainty the adversary can pinpoint a single result from its inference attack.
The higher the entropy is, the lower the adversary’s certainty will be. Given the functions
introduced in Section 3.2.1, the entropy of the obfuscated values is [67, 68, 69]:
49

H(X̂) = E[− log f(X̂)] =
+∞∫−∞
[−logf(x̂)]f(x̂)dx̂ (3.1)
Correctness : In the context of location privacy, correctness is defined as the expected
distance between the actual value xc ∈ SX and the inferred value y ∈ SY and fY (y) =
Pr(x|x̂) where Y represents the results of the inference [67]:
∑x
fY (y)‖y − xc‖ (3.2)
Given that the notion of privacy can be different in different domains, privacy can be
measured by either accuracy, certainty, or correctness. Thus, before quantifying privacy, it
is important to know which of the aforementioned measures is useful in the domain being
investigated, for instance, smart grid in our case.
3.2.3 Metrics for Quantifying Privacy
Now, let us introduce some of the proposed metrics for quantifying privacy in diffrent
domains.
3.2.3.1 k-anonymity
The concept of k-anonymity is a way of releasing information to the public while main-
taining both integrity and privacy of the data by using generalization techniques [68, 80]. In
order to hide and preserve the privacy of the data released by a given user by k-anonymity
techniques, the data of that user should be indistinguishable from the data of k − 1 other
users [73]. In the context of smart grid networks, smart meters can be divided into clusters
of k SM per cluster such that the data transmitted by these k SMs are not distinguishable,
i.e. it should not be possible to identify the source of a transmitted packet out of k users.
However, such k-anonymity-based metrics seem to be not feasible for smart grid networks
for reasons such as billing, linkablity, and accountability.
50

3.2.3.2 Mutual Information Rate
Sankar et al. [69] present an abstract framework for modeling the privacy-utility tradeoff
in smart grid by utilizing concepts from information theory and a hidden Markov model.
They employ the theory of rate distortion to quantify this tradeoff. The authors demonstrate
that the aforementioned tradeoff can be modeled with an inference-aware reverse waterfilling
solution. They consider, similar to our proposed framework, a generic transfer function with
an input X and an output X̂. They assume an n-variable real Gaussian distribution for SM
readings and also consider an attack model that infers Y , correlated to X, from the observed
values X̂. Given these assumptions, they propose a privacy leakage metric as the mutual
information rate between Y and X̂. They also define the utility function of the UC which
measures the fidelity of X̂ by limiting the Euclidian distance (mean square error) between
X and X̂. The desired utility is given by an average distortion constraint:
D =1
n
n∑k=1
E[(Xk − X̂k)2] (3.3)
Also the leakage function in the following equation quantifies the information leakage:
L =1
nI(Y n; X̂n) (3.4)
where I(Y ;X) denotes the mutual information [69, 78].
3.2.3.3 Clustering Error
Fischer et al. [74] propose a metric for quantifying location privacy. In their approach,
the attacker clusters the observed events into a number of subsets, considering one subset
for every user. As the adversary does not have prior knowledge about the set partitions,
it hypothesizes multiple set partitions probabilistically. The location privacy is measured
by the adversary’s expected clustering error [68]. Since such clustering-error based metrics
estimate the adversary’s error by comparing each hypothesized set partition with the actual
one using a distance function, they do not seem to be applicable to the smart grid domain.
51

3.2.3.4 Distortion-based Metric
Shokri et al. [67] claim that in quantifying location privacy correctness of the adversary’s
attack can be used as a potential metric, instead of using certainty or accuracy-based metrics.
The authors consider an attack model which infers Y , correlated to X, from the observed
values X̂. We denote the set of possible outcomes of the inference as SY . The correctness
of the attack is measured using the expected distance between the correct xc ∈ SX and the
inferred value y ∈ SY (Eqn. 3.2). In a similar research effort, Shokri et al. [68] show that
the expected distortion in the reconstructed location of the users can be used as a metric to
quantify privacy:
ED(u, t) =∑
Υ
D(whereis(u, t), loc(tail(Υ))).πj∗(Υ) (3.5)
The above formula shows the distortion in a reconstructed trace of user u at time t denoted
by ED(u, t). Υ is a path from source to destination and loc(tail(Υ)) shows the location
of the last event in path Υ. πj∗(Υ) is a probability assigned to a trace Υ and D is a
distance function between two locations. Given the above distortion, the authors compute
the location privacy of user u at time t, with a location/time sensitivity function lts, as
follows:
LP du (t) = 1− lts(u,whereis(u, t), t).(1− ED(u, t)) (3.6)
Hence, the average location privacy of user u at any time instant t during the time period
T is:
LP du =
1
T
∑∀t∈T
LP du (t) (3.7)
3.2.3.5 Regression Analysis
Kalogridis et al. [65] propose a metric for quantifying smart grid privacy based on
regression analysis in a battery-based SPPM. In this approach, the authors combine cross-
correlation and regression procedures. The main idea is that the degree to which X̂ predicts
52

X can be quantified by shifting X̂ in order to align it with X at the point of their maximum
cross-correlation and comparing the two aligned signals using regression methods. The au-
thors consider the coefficient of determination, R2, to show the proportion of variability in
a data set that is accounted for by the statistical model. R2 is defined as follows:
R2 = 1− SSESSR + SSE
, 0 ≤ R2 ≤ 1 (3.8)
In the above equation, SSE and SSR denote the error sum of squares and the regression
sum of squares, respectively. R2 = 1 elaborates that predictions are fully explained by the
model, whereas R2 = 0 shows the opposite. The authors claim that R2 can be used as a
privacy metric. The lower R2 is, the higher the privacy protection will be.
3.2.4 Discussion
Although numerous proposals for privacy protection in smart grid can be found in the
literature, most of these approaches lack an analytical model and hence cannot answer some
important questions: (i) what are different possible attacks that will result in a loss of
privacy? (ii) how much privacy is lost in smart grid networks and how employing different
SPPMs will reduce this privacy loss? (iii) how much privacy sensitive information is enough
for the UC to be left in the smart grid data while still preserving consumer privacy? In this
chapter, we will introduce a new framework based on the entropy of the smart grid data to
formally model the privacy loss in smart metering systems.
3.3 Information-Theoretic Metric
Here we investigate the feasibility and applicability of information-theoretic metrics uti-
lizing well-established probabilistic methods [76, 77] and using concepts from the theory
of information entropy [75, 78]. First off, let us revisit the variables and notations used.
We assume that the data generated by smart meters follows the normal (Gaussian) dis-
tribution and can be modeled with a continuous random variable X ∼ N(µ, σ2) where
53

µ is the average (mean) and σ2 is the variance [69]. X takes values in the set SX and
has the probability density function fX(x) = 1√2πσ
e−1
2σ2(x−µ)2 , x ∈ R, µ ∈ R, σ > 0.
Let X ∼ N(µ, σ2), then the continuous random variable Z = X−µσ
has a standard Guas-
sian distribution. Based on the definition of the cumulative distribution function, we have:
FZ(z) = P (Z ≤ z) = P (x−µσ≤ z) = P (X ≤ σz + µ) =
σz+µ∫−∞
1√2πσ
e−1
2σ2(x−µ)2dx.
Then, with a change of variable t = x−µσ
, we have: FZ(z) =z∫−∞
1√2πe−t22 dt = φ(z). Hence,
FX(x) =x∫−∞
fQ(q)dq = φ(x−µσ
).
As the transfer function we consider a simple perturbation function that maps the input
X to the output X̂, where X+A = X̂ (we are assuming this TF for illustration purposes only
and it can be replaced by any other TF). A ∼ U(b, c) is a continuous random variable with a
uniform distribution and the pdf fA(α) =
1c−b , b ≤ α ≤ c
0 , otherwise
, that models the generated
perturbation data. The cumulative distribution function of A, FA(α), for b ≤ α ≤ c is
FA(α) = P (b ≤ α ≤ c) =α∫−∞
fA(t)dt =b∫−∞
0dt +α∫b
1c−bdt = α−b
c−b . The output of the TF is a
random variable X̂. Assuming X̂ = X+A, the probability density function of X̂ is as follows:
∗ ∗ ∗ ∗ ∗ ∗ ∗ ∗ ∗ ∗ ∗fX̂(x̂) =+∞∫−∞
fX(x̂− α)fA(α)dα
=
+∞∫−∞
fA(x̂− x)fX(x)dx (3.9)
In order to solve Eqn. 3.9, we should have b < x̂− x < c or x̂− c < x < x̂− b. Then,
fX̂(x̂) =
x̂−b∫x̂−c
1
c− bfX(x)dx
=1
c− b
x̂−b∫x̂−c
fX(x)dx =1
c− b[F (x̂− b)− F (x̂− c)]
=1
c− b[φ(
x̂− b− µσ
)− φ(x̂− c− µ
σ)] (3.10)
54
The probability density function and cumulative distribution function of the output of the
attack function (Y ) are unknown at this point as we are not assuming any specific attack
models. Given the desired attack function, one can use the appropriate distribution for Y
and apply our metric to evaluate the privacy of the SPPM. Based on the introduced notations
and functions so far, we will elaborate the information-theoretic metrics that can be used to
evaluate the privacy gained as the result of using any SPPM. As a case study, we will apply
this metric to a simple perturbation SPPM. We were able to access highly-granular real
smart meter data collected in one-minute time intervals [84]. Using this data and employing
a perturbation SPPM, we evaluate the privacy of such SPPM using the introduced metrics
by means of statistical tools, simulations, and illustrations.
3.3.1 Entropy
Shannon introduced a function of a given random variable Z which has a very well-
known and practical expectation, g(Z) = − log f(Z) [75]. Let Z be a continuous random
variable with pdf fZ(z), then, H(Z) = E[− log f(Z)] is referred to as the entropy of Z
(log is generally considered in base 2 or e). The entropy of Z is H(Z) = E[− log f(Z)] =+∞∫−∞
[− log f(z)]f(z)dz. Entropy is often-times used as a measurement for quantifying uncer-
tainty. The maximum uncertainty is achieved when H(Z) is maximized. It can be shown
that the uniform distribution has the maximum entropy, and thus, the maximum uncertainty
among all random variables with the same support or range. Uncertainty is minimized when
Z is degenerated as the observed values of Z are already known with 100% certainty. It
can be also concluded that entropy is used as a measure of dispersion as well. Now, we
would like to present an entropy analysis of the random variables assumed in our framwork
X ∼ N(µ, σ2), A ∼ U(b, c), X̂ = A+ Z, and Y = TF (X̂, E1, E2, · · · , En).
The entropy of X ∼ N(µ, σ2) is calculated as follows:
55

H(X) = E[− loge f(X)] =
+∞∫−∞
[− ln fX(x)]fX(x)dx
=
+∞∫−∞
− ln(1√2πσ
e−(x−µ)2
2σ2 )1√2πσ
e−(x−µ)2
2σ2 dx
=
+∞∫−∞
[ln(√
2πσ) +(x− µ)2
2σ2]
1√2πσ
e−(x−µ)2
2σ2 dx
= ln(√
2πσ) +1
2σ2
+∞∫−∞
(x− µ)2 1√2πσ
e−(x−µ)2
2σ2 dx
= ln(√
2πσ) +1
2σ2σ2
=1
2ln(2πσ2) +
1
2
∗ ∗ ∗ ∗ ∗ ∗ ∗ ∗ ∗ ∗ ∗ (3.11)
As it can be clearly observed in Eqn. 3.11, the entropy of a random variable with a
Gaussian distribution depends solely on the variance σ2 (or the standard deviation σ) of
the distribution and is independent from the average µ. In order to increase entropy (and
thus increase uncertainty of the adversary), σ2 must be increased. As power consumption
is related to the energy consumption patterns of the consumers, σ2 cannot be generally
manipulated or controlled by the UC or any third party entity.
Assuming the perturbation data are randomly selected from [0, l], the entropy of A ∼
U(b, c) when b = 0 and c = l, will be:
∗ ∗ ∗ ∗ ∗ ∗ ∗ ∗ ∗ ∗ ∗ ∗ ∗H(A) = E[− loge f(A)] =+∞∫−∞
[− ln fA(α)]fA(α)dα
=
l∫0
1
lln l dα = ln l (3.12)
It should go without saying that larger l will result in more entropy. In other words, in order
to increase uncertainty, the random numbers should be selected from a wider range [0, l].
56
Among all random distributions with support [0, l], the uniform distribution, as expected,
has the highest entropy, and thus, the highest uncertainty. As opposed to σ2 which cannot
be controlled, l can be used as a parameter to control the amount of privacy leakage.
Now, we would like to analyze the entropy of the output of our transfer function denoted
by the random variable X̂ = X + A. The initial goal of applying the TF on the smart
metering data was to hide the power consumption patterns of the consumers. In other
words, it is of paramount importance to numerically evaluate the results of employing the
TF (perturbation in this case). Below we evaluate the entropy of the addition of two random
variables. Assume X and A are any two discrete random variables, then:
max{H(X), H(A)} ≤ H(X +A) ≤ H(X) +H(A) (3.13)
And if X and A are any two continuous random variables, we have [75, 78]:
H(X +A) ≥ max{H(X), H(A)} (3.14)
Given Eqn. 3.11 and Eqn. 3.12, if both the random variables X ∼ N(µ, σ2) and A ∼ U(0, l)
have the same support, based on Eqn. 3.14:
∗ ∗ ∗ ∗ ∗ ∗ ∗ ∗ ∗ ∗ .H(X +A) ≥ max{H(X), H(A)}
≥ max{1
2+
1
2ln(2πσ2), ln l} ≥ ln l (3.15)
It can be clearly observed that the uniform distribution has the maximum entropy among
all distributions with support [0, l]. Based on Eqn. 3.14 and Eqn. 3.15, the entropy of any
random variable, if added with a uniform random variable, will be maximized. Hence, in
order to minimize the certainty of the results of any inference attack, it is enough to add the
random variable denoting the actual data with a uniform random variable. However, in our
57
case, the support of the random variables X and A are different, and thus, Eqn. 3.15 will
not always stand. Instead, we can write:
∗ ∗ ∗ ∗ ∗ ∗ ∗ ∗ ∗ ∗ ∗∗H(X̂) = H(X +A) ≥ max{H(X), H(A)}
∗ ∗ ∗ ∗ ∗ ∗ ∗ ∗ ∗∗ ≥ max{1
2+
1
2ln(2πσ2), ln l} (3.16)
Given Eqn. 3.16, the entropy H(X̂) = H(X + A) depends on l and σ2. Choosing a large
enough l, H(X̂) = H(X+A) ≥ ln l. It can be concluded that, independent from the support
of the random variable, l is the only parameter that can be altered in order to achieve the
maximum possible privacy, i.e., a large enough l will minimize the centainty of any inference
by the adversary. Finally, it is worth noting that the entropy of the random variable Y
(output of the AF),+∞∫−∞
[−logf(y)]f(y)dy, depends on the pdf Fy(Y ) and the capabilities of
the adversary.
3.3.2 Relative Entropy
Another information theoretic metric that can be used to compare two sources of infor-
mation is the relative entropy (or KullbackLeiber Distance) [65, 75]. The relative entropy
between X and Y , D(X‖Y ), is:
D(X‖Y ) =
+∞∫−∞
fX(x) logfX(x)
fY (y)dx (3.17)
The relative entropy, as defined above, quantifies the relation between X and Y . Relative
entropy is always positive (as opposed to entropy that can also take negative values). It
should be noted that larger relative entropy shows that the TF used has been successful in
decreasing the certainty of the adversary’s inference from SM data.
58

3.3.3 Joint Entropy
The joint entropy of two (or more) random variables with a joint pdf fX,Y (x, y) is defined
in Eqn. 3.18 and shows their joint uncertainty:
H(X, Y ) = E(− log f(X, Y )) (3.18)
Given Eqn. 3.22 and Eqn. 3.18, it can be proved that H(Y,X) = H(X|Y ) +H(Y ).
H(X|Y ) = E(− log fX|Y (X|Y ))
=
+∞∫−∞
+∞∫−∞
[− log fX|Y (x|y)]fX,Y (x, y)dy dx
=
+∞∫−∞
+∞∫−∞
[− logfX,Y (x, y)
fY (y)]fX,Y (x, y)dy dx
=
+∞∫−∞
+∞∫−∞
[− log fX,Y
(x, y)− log fY
(y)]fX,Y
(x, y)dydx
=
+∞∫−∞
+∞∫−∞
− log fX,Y (x, y)fX,Y (x, y)dx dy
+ [−+∞∫−∞
+∞∫−∞
(− log fY (y))fX,Y (x, y)dy dx]
= H(X, Y )−+∞∫−∞
(− log fY (y))
+∞∫−∞
fX,Y (x, y)dx dy
= H(X, Y )−+∞∫−∞
− log fY (y)fY (y)dy
= H(X, Y )−H(Y )
And hence,
H(X, Y ) = H(X|Y ) +H(Y ) (3.19)
59
Similarly, H(X, Y ) = H(Y |X) +H(X). Also, it can be shown that [78]:
H(X) +H(Y ) ≥ H(X, Y ) ≥ max{H(X), H(Y )} (3.20)
As the above equation explains the joint entropy of two random variables is always greater
than or equal to individual entropies of the random variables. Assuming that f(X,Y )(x, y) is
the joint distribution of the smart meter data X and the inferred values Y , H(X, Y ) can be
used as a potential privacy metric.
3.3.4 Conditional Entropy
Conditional entropy shows the average uncertainty of one or more random variables
assuming the values of the other random variables are known. The conditional entropy of X
for a known Y = y, H(X|Y = y), is:
H(X|Y = y) = E(− log fX|Y (X|y)) (3.21)
And hence:
H(X|Y ) = E(− log fX|Y (X|Y )) (3.22)
Thus, if (Y,X) is a continuous vector, we have:
H(X|Y ) =
∫ ∫SXY
[− log fX|Y (x|y)]fX,Y (x, y)fY (y)dx dy
=
∫ ∫SXY
[− log fX|Y (x|y)]fX,Y (x, y)dx dy
=
∫SY
fY (y){[− log fX|Y (x|y)]fX,Y (x, y)dx}dy
=
∫SX
fY (y)H(X|y)dy
∗ ∗ ∗ ∗ ∗ ∗ ∗ ∗ ∗∗ (3.23)
60

Eqn. 3.21, Eqn. 3.22, and Eqn. 3.23 analyze the entropy of the actual data, X (or input of
the TF), if some given values of the perturbed data, Y (or output of the AF), are known to
the adversary. The higher this conditional entropy is, the more uncertain the results of the
attack will be.
Thus far, we introduced information-theoretic metrics to quantify smart grid privacy.
Assuming a generic transfer function, comparing the entropy of the information before and
after applying the TF can be a potential metric for analyzing the privacy leakage of smart
grid networks. We would like to reiterate that these privacy metrics is general enough and
can be used independent of the transfer and attack functions.
3.4 Evaluation and Illustration
3.4.1 An Analytical Perspective
Now, we would like to analytically evaluate the validity of the aforementioned metrics.
We model the smart meter data with random variable X ∼ N(µ, σ2) with a constant µ = 500
(representing power consumption of 500Wor 0.5kW in one minute) and a variable σ changing
from 36 to 108 as depicted in Fig. 3.2. In Fig. 3.4, the pdf of the random variable X̂ is
illustrated. This random variable is generated by adding a uniformly distributed noise to
the original data, i.e. X̂ = X + A. In order to evaluate the validity of the introduced
information-theoretic metrics, representing SM privacy, we need to compare the entropy of
information before and after perturbation. As it can be seen in Figures 3.3 and 3.5, the
entropy has increased after perturbation. These results confirm what was expected based on
the information-theoretic concepts, as indicated in equations 3.15 and 3.16. This increase in
entropy is equivalent to decreasing the certainty of possible inference attacks.
For instance in Fig. 3.2, the tallest graph is the pdf of a random variable with distribution
X ∼ N(µ = 500, σ = 36). The entropy of X (before perturbation) is 5.0022, as shown in Fig.
3.3 by ?. Figure 3.4 illustrates the pdf of the perturbed random variable X̂. As indicated
by ? in Fig. 3.5, entropy has increased from 5.0022 to 6.2684 after perturbation.
61

σ= 36
σ= 42
σ= 45
σ= 58
σ= 62
σ= 85
σ= 108
Figure 3.2: pdf’s of Gaussian Distributions with µ = 500 and Variable σ2.
■•▲
♦
▼
◘
*Figure 3.3: Entropy of Smart Meter Data, H(X).
3.4.2 A Practical Experiment
In this section, we analytically evaluate the privacy metric with real smart meter data.
This analysis is based on measured electricity used at one-minute time intervals in twenty-two
houses in East Midlands, UK [84] over two complete years (2008 and 2009). Each house used
a single meter covering electricity usage of the whole house. The meters are BS EN 62053-
21002003 and measure true active power. As it could be clearly observed, sensitive private
information of the house-hold can be extracted without much effort or requiring advanced
technologies. These results confirm the findings of [52, 53, 54] regarding privacy threats
62

σ= 36
σ= 42
σ= 45
σ= 58
σ= 62
σ= 85
σ= 108
Figure 3.4: pdf’s of Random Variables X̂, fX̂(x̂) = fX+A(x+ α).
■•▲
♦▼
*
◘
Figure 3.5: Entropy of Perturbed Smart Meter Data, H(X̂) = H(X +A).
of the smart grid such as potential risks for absence/presence attacks, tracking residents
inside a house, etc. For instance in summer 2009, one of the houses was empty until around
5:35 P.M. every weekday. It could be concluded from the data that the resident usually
came back home and had dinner between 5:35 and 6:00 P.M. (there was significant sudden
increase in power consumption in the mentioned time frame which could have happened
as a result of using a device such as an oven). We analyzed the data of the smart meters
with Statgraphics [79]. Surprisingly, the power consumption of the houses did not follow
the Gaussian distribution as opposed to what we initially expected. Fig. 3.6 demonstrates
63

the power usage of one of the dwellings from 12:00 A.M. to 11:59 P.M. on 01/24/2009. We
use this example to discuss our results. We evaluated 1439 values ranging from 0.03216 to
9.8662 kW. Initially we ran several different tests for normality on the smart meter data
to determine whether the data can be adequately modeled by normal distribution. Based
on the Shapiro-Wilk test [45] and comparing the quantiles of the fitted normal distribution
to the quantiles of the data, since the smallest P-value amongst the tests performed is less
than 0.05, we can reject the hypothesis that the values comes from a normal distribution
with 95% confidence (The same process was done for several different smart meters and also
different time intervals, days, months, and seasons, in two different years. The results were
all similar in terms of normality of the data). Also using Kolmogorov-Smirnov Goodness-of-
Fit Test confirms the above result [45]. The estimated parameters of the best fitted normal
distribution for the data have a mean of 0.356934 and standard deviation of 1.07374. This
analysis shows the results of fitting a normal distribution to the data generated by the studied
smart meter in a 24 hour period. Fig. 3.7 demonstrates the histogram of the data along
with the best fitted normal distribution. Fig. 3.8 shows the Quantile-Quantile plot. A
Figure 3.6: Power Consumption in a Household in a Twenty-four Hour Period.
Q-Q plot is a probability plot for comparing two probability distributions by depicting their
quantiles against each other. As it can be observed in the figure the data do not lie on the
normal distribution. Assuming that the data comes from a normal distribution, the tolerance
limits state that, with 95.0% confidence, 99.73% of the distribution lies between −2.96759
64

Figure 3.7: The Histogram of the Power Consumption Data.
and 3.68146. This interval is computed by taking the mean of the data ±3.09622 times the
standard deviation. Without assuming that the data comes from a normal distribution, the
tolerance limits state that we can be 95.0% confident that 99.6708% of the distribution lies
between 0.03216 and 9.8662. This interval is computed from the smallest and largest values.
Figure 3.8: Quantile-Quantile Plot.
Fig. 3.9 demonstrates the pdf of X ∼ N(µ = 0.356934, σ = 1.07374) which is the best
fitted normal distribution to the real data. Also, the pdf of X̂ = X + A and the entropy of
X and X̂ are shown in Fig. 3.9. As it can be observed, employing entropy as a potential
privacy metric, the privacy of the system has increased after perturbation. Based on Fig.
3.9, the entropy of the perturbed data H(X̂) is around 2.7. According to Eqn. 3.14, we have:
H(X̂) = H(X+A) ≥ max{H(X), H(A)} ≥ max{12+1
2ln(2πσ2), ln l} ≥ max{1.4898, 2.5560}
And hence: H(X̂) = 2.7 ≥ 2.5560.
65

Figure 3.9: Distribution and Entropy of X and X̂.
Table 3.1: Comparison of Alternative Distributions
Distribution Est.*****Parameters
Log*********Likelihood
KS D
Loglogistic 2 780.222 0.101606Inverse Gaussian 2 760.408 0.170564Lognormal 2 728.591 0.120295Birnbaum-Saunders 2 554.66 0.258551Weibull 2 356.201 0.219304Gamma 2 186.854 0.263503Exponential 1 43.4622 0.340769Laplace 2 -663.191 0.353445Largest Extreme Value 2 -696.247 0.316778Logistic 2 -1155.78 0.352364Normal 2 -2143.73 0.381145Uniform 2 -3289.34 0.882466Pareto 1 −1.44× 10¹² 3.06981
We would like to reiterate that the data coming from the smart meters were not generated
by a normal distribution with 95% confidence. In Table 3.1, you can find a list of alternative
distributions. This table compares the goodness-of-fit when various distributions are fit
to the data. According to the log likelihood statistic, the best fitting distribution is the
Loglogistic distribution. However, given Eqn. 3.14 if the smart meter data is perturbed with
uniformly distributed random numbers, the entropy of the output H(X̂) is independent of
the distribution of original smart meter data.
66

3.5 Conclusion
Due to privacy and security issues from the consumers’ perspective, the deployment of
the future power grid has been delayed. Although researchers have studied miscellaneous
approaches for preserving consumer privacy in smart grid communications, to this date, most
of these SPPMs lack a formal analysis to show how much privacy is gained as a result of de-
ploying that SPPM. Thus, it is crucial to design a generic framework for quantifying smart
grid privacy. In this paper, using well-established probabilistic and information theoretic
methods, we introduced a metric that enables us to numerically evaluate the performance
of different SPPMs from a privacy point of view. This certainty-based metric leverages the
theory of information entropy and shows how uncertain the results of an inference attack by
the adversary will be. As a case study, we applied this entropy-based metric to evaluate an
SPPM that perturbs the smart metering data by simply adding the meter readings with ran-
domly generated numbers. The results confirmed that the proposed metric can successfully
measure the privacy of the smart meter data, before and after applying the perturbation
transfer function. We also used our proposed metric to evaluate real electricity usage data
gathered from twenty-two smart meters with one-minute granularity. As part of our future
research, we are investigating the applicability of such entropy based metrics for systems
with different adverserial strengths.
67

CHAPTER 4CONCLUDING REMARKS
Due to privacy and security issues from the consumers’ perspective, the deployment of
the future power grid has been delayed. Existing approaches to privacy-preserving data
aggregation in smart grid generally utilize the homomorphic properties of public-key cryp-
tosystems. However, as we have thoroughly investigated, these approaches are expensive
from a communication stand-point. In Chapter 2, we proposed a two-step approach towards
efficient private data aggregation in SGNs. First, we introduced a random perturbation
technique which is used to statistically alter the time-series data of every SM such that
individual consumption patterns could not be inferred and yet the sum and average values
of the reported power consumption in a given neighborhood can be calculated accurately.
Second, we proposed an efficient and secure data aggregation scheme which utilizes the prop-
erties of spread spectrum communications. Our evaluation and simulation results confirmed
that our approach increases performance and decreases communication overhead on SGNs
considerably, as compared with existing cryptographic-based aggregation schemes.
In another research direction in chapter 3, we observed that, although researchers have
studied miscellaneous approaches for preserving consumer privacy in smart grid communica-
tions, to this date, most of these SPPMs lack a formal analysis to show how much privacy is
gained as a result of deploying that SPPM. Thus, it is crucial to design a generic framework
for quantifying smart grid privacy. In Chapter 3, using well-established probabilistic and
information theoretic methods, we introduced a metric that enables us to numerically eval-
uate the performance of different SPPMs from a privacy point of view. This certainty-based
metric leverages the theory of information entropy and shows how uncertain the results of
an inference attack by the adversary will be. As a case study, we applied this entropy-based
metric to evaluate the SPPM that perturbs the smart metering data by simply adding the
meter readings with randomly generated numbers (introduced in chapter 2). The results
68

confirmed that the proposed metric can successfully measure the privacy of the smart meter
data, before and after applying the perturbation transfer function. We also used our pro-
posed metric to evaluate real electricity usage data gathered from twenty-two smart meters
with one-minute granularity.
69

BIBLIOGRAPHY
70

[1] Mark A. Gabriel, Visions for a Sustainable Energy Future. Fairmount Press, p.62, 2008.
[2] Xu, D., Wang, Y., Shi, X., Yin, X., (2010) 802.11 User Anonymization, Global Telecom-munications Conference (GLOBECOM 2010), 2010 IEEE, pages 1-5.
[3] Zhang, W., Wang, C., Feng, T., (2008) Generic Privacfy-Preservation Solutions forApproximate Aggregation of Sensor Data (concise contribution), Pervasive Computingand Communications, 2008. PerCom 2008. Sixth Annual IEEE International Conferenceon, pages 179-184.
[4] Chen, H. H., (2007) The Next Generation CDMA Technologies, John Wiley and Sons.
[5] Boustani, A., Sabet, J., Azizi, M., Mirmotahhary, N., Khorsandi, S., (2010) PersianCode: A new orthogonal spreading code generation algorithm for spread spectrumCDMA systems, Wireless Advanced (WiAD), 2010 6th Conference on, pages 1-5.
[6] Boustani, A., Alamatsaz, N., Jadliwala, M., Namboodiri, V. (2014) LocJam: A NovelJamming-based Approach to Secure Localization in Wireless Networks, Consumer Com-munications and Netwokring Conference (CCNC), 2014 11th IEEE.
[7] Zanjani, M.B., Monsefi, R., Boustani, A., (2010) Energy efficient/highly secure data ag-gregation method using tree-structured orthogonal codes for Wireless Sensor Networks,Software Technology and Engineering (ICSTE), 2010 2nd International Conference on,volume 2, pages V2-260-V2-265.
[8] Zanjani, M.B., Boustani, A., (2011) Energy aware and highly secured data aggregationfor grid-based asynchronous Wireless Sensor Networks, IEEE PacRim’11, pages 555-560,ISSN 1555-5798.
[9] Phulpin, Y., Barros, J., Lucani, D., (2011) Network coding in Smart Grids, SmartGrid Communications (SmartGridComm), 2011 IEEE International Conference on,pages=49-54.
[10] Wenbo H., Xue L., Hoang N., Nahrstedt, K., Abdelzaher, T., (2007) PDA: Privacy-Preserving Data Aggregation in Wireless Sensor Networks, IEEE INFOCOM, pages2045-2053, ISSN 0743-166X.
[11] Plantard, T., Susilo, W., Zhang, Z., (2013) Fully Homomorphic Encryption Using Hid-den Ideal Lattice, Information Forensics and Security, IEEE Transactions on, volume8, pages 2127-2137, ISSN 1556-6013.
[12] Rongxing, Lu, Xiaohui, L., Xu, L., Xiaodong, L., Xuemin, S., (2012) EPPA: An Efficientand Privacy-Preserving Aggregation Scheme for Secure Smart Grid Communications,EEE Tran. on Parallel and Distributed Systems, volume 23, number 9, pages 1621-1631,ISSN=1045-9219.
71

[13] Cs G., Castelluccia C., (2011) I have a DREAM! (Differentially PrivatE smart Meter-ing),ACM IH.
[14] Boneh, D.,Goh, E., Nissim, K., (2005) Evaluating 2-DNF Formulas on Ciphertexts, Pro-ceedings of the Second International Conference on Theory of Cryptography, TCC’05,isbn 3-540-24573-1, 978-3-540-24573-5, pages 325–341, Springer-Verlag.
[15] Goh, E.J., (2007) Encryption Schemes from Bilinear Maps, Department of ComputerScience, Stanford University.
[16] Naccache, D., Stern, J., (1998) A New Public Key Cryptosystem Based on HigherResidues, ACM Conference on Computer and Communications Security, isbn 1-58113-007-4, pages 59-66, ACM.
[17] El Gamal, T., (1985) A Public Key Cryptosystem and a Signature Scheme Based onDiscrete Logarithms, Proceedings of CRYPTO 84 on Advances in Cryptology, isbn0-387-15658-5, Santa Barbara, California, USA, pages 10-18, Springer-Verlag.
[18] Rivest, R. L., Shamir, A., Adleman, L., (1978) A Method for Obtaining Digital Sig-natures and Public-key Cryptosystems, Commun. ACM, volume 21, number 2, issn0001-0782, pages 120-126.
[19] Paillier, P., (1999) Public-key cryptosystems based on composite degree residuosityclasses, EUROCRYPT.
[20] Van Dijk, M., Gentry, C., Halevi, S., Vaikuntanathan, V., (2010) Fully HomomorphicEncryption over the Integers, Proceedings of the 29th Annual International Conferenceon Theory and Applications of Cryptographic Techniques EUROCRYPT’10, isbn 3-642-13189-1, 978-3-642-13189-9, French Riviera, France, pages 24-43, Springer-Verlag.
[21] Lagendijk, R.L. and Erkin, Z. and Barni, M., (2013) Encrypted signal processing forprivacy protection: Conveying the utility of homomorphic encryption and multipartycomputation, Signal Processing Magazine, IEEE, volume 30, number1, pages 82-105,ISSN 1053-5888.
[22] Agrawal, R., Srikan, R., (2000) Privacy-preserving data mining, SIGMOD, pages 49-54.
[23] Huang, Z., Du, W., Chen, B., (2005) Deriving Private Information from Ran-domized Data, Proceedings of the 2005 ACM SIGMOD International Conferenceon Management of Data SIGMOD ’05, isbn 1-59593-060-4, pages 37-48, url =http://doi.acm.org/10.1145/1066157.1066163.
[24] He, W., Nguyen, H., Liu, X., Nahrstedt, K., Abdelzaher, T., (2008) iPDA: An integrity-protecting private data aggregation scheme for wireless sensor networks, IEEE MilitaryCommunications Conference, pages 1-7.
[25] Li, N., Zhang, N., Das, S. K., Thuraisingham, B., (2009) Privacy Preservation in Wire-less Sensor Networks: A State-of-the-art Survey, Elsevier Science Publishers B. V., AdHoc Network, volume 7, number 8, issn 1570-8705, pages 1501-1514.
72

[26] Vijayan, j., (2010) Stuxnet renews power grid security concerns, Computerworld mag-azine.
[27] McDaniel, P., McLaughlin, S., (2009) Security and Privacy Challenges in the SmartGrid, Security Privacy, IEEE, volume 7, number 3, pages 75-77, ISSN 1540-7993.
[28] Molina-Markham, A., Shenoy, P., Fu, K., Cecchet, E., Irwin, D., (2010)Private Memoirs of a Smart Meter, ACM BuildSys Work shop, isbn 978-1-4503-0458-0, Zurich, Switzerland, series BuildSys ’10, pages 61–66, url=http://doi.acm.org/10.1145/1878431.1878446, New York, NY, USA.
[29] Line, M.B., Tondel, I.A., Jaatun, M.G., (2011) Cyber security challenges in Smart Grids,Innovative Smart Grid Technologies (ISGT Europe), 2011 2nd IEEE PES InternationalConference and Exhibition on, pages 1-8, ISSN 2165-4816.
[30] Li, H., Lin, K., Li, K, (2011), Energy-efficient and High-accuracy Secure Data Aggrega-tion in Wireless Sensor Networks, Elsevier Science Publishers B. V., volume 34, number4, issn 0140-3664, pages 591–597.
[31] Weng, C., Li, M., Lu, X., (2008) Data Aggregation with Multiple Spanning Trees inWireless Sensor Networks, Embedded Software and Systems, 2008. ICESS ’08. Interna-tional Conference on, pages 355-362.
[32] Mustafa, M., Zhang, N., Kalogridis, G., Fan, Z., (2014) DESA: A Decentralized, Effi-cient and SelectiveAggregation Scheme in AMI, Smart Grid, IEEE Transactions on.
[33] Fhom, H.S., Bayarou, K.M., (2011) Towards a Holistic Privacy Engineering Approachfor Smart Grid Systems, Trust, Security and Privacy in Computing and Communications(TrustCom), 2011 IEEE 10th International Conference on, pages 234-241.
[34] Bartoli, A., Hernandez-Serrano, J., Soriano, M., Dohler, M., Kountouris, A., Barthel,D., (2010) Secure Lossless Aggregation for Smart Grid M2M Networks, Smart GridCommunications (SmartGridComm), 2010 First IEEE International Conference on,pages 333-338.
[35] Yan, Y., Qian, Y., Sharif, H., (2011) A Secure Data Aggregation and DispatchScheme for Home Area Networks in Smart Grid, Global Telecommunications Conference(GLOBECOM 2011), 2011 IEEE, pages 1-6, ISSN 1930-529X.
[36] Shao, S., Pipattanasomporn, M., Rahman, S., (2011) Demand Response as a Load Shap-ing Tool in an Intelligent Grid With Electric Vehicles, Smart Grid, IEEE Transactionson, volume 2, number 4, pages 624-631, ISSN 1949-3053.
[37] Falahati, B., Yong F., Lei W., (2012) Reliability Assessment of Smart Grid ConsideringDirect Cyber-Power Interdependencies, Smart Grid, IEEE Transactions on, volume 3,number 3, pages 1515-1524, ISSN 1949-3053.
73

[38] Tabors, R.D., Parker, G., Caramanis, M.C., (2010) Development of the Smart Grid:Missing Elements in the Policy Process, System Sciences (HICSS), 2010 43rd HawaiiInternational Conference on, pages 1-7, ISSN 1530-1605.
[39] Amin, R., Martin, J., Xuehai Z., (2012) Smart Grid communication using next genera-tion heterogeneous wireless networks, Smart Grid Communications (SmartGridComm),2012 IEEE Third International Conference on, pages 229-234.
[40] Bose, A., (2010) Smart Transmission Grid Applications and Their Supporting Infras-tructure, Smart Grid, IEEE Transactions on, volume 1, number 1, pages 11-19, ISSN1949-3053.
[41] Van Engelen, A.G., Collins, J.S., (2010) Choices for Smart Grid Implementation, SystemSciences (HICSS), 2010 43rd Hawaii International Conference on, ISSN=1530-1605.
[42] Barenghi, A. and Pelosi, G. (2011) Security and Privacy in Smart Grid Infrastructures,Database and Expert Systems Applications (DEXA), 2011 22nd International Workshopon, 102-108, ISSN=1529-4188
[43] IESO, Blackout 2003, url = http://www.ieso.ca/imoweb/EmergencyPrep/ black-out2003, 2012.
[44] N. Alamatsaz, A. Boustani, M. Jadliwala, and V. Namboodiri, Agsec: Secure andefficient cdma-based aggregation for smart metering systems, in Consumer Communi-cations and Netwokring Conference (CCNC), 2014 11th IEEE, 2014.
[45] E. L. Lehmann and J. P. Romano, Testing Statistical Hypotheses. Third edition,Springer, 2005.
[46] I. Rouf, H. Mustafa, M. Xu, W. Xu, R. Miller, and M. Gruteser, Neighborhood watch:Security and privacy analysis of automatic meter reading systems, in Proceedings of the2012 ACM Conference on Computer and Communications Security, ser. CCS 12, 2012.
[47] Z. Erkin, J. Troncoso-Pastoriza, R. Lagendijk, and F. Perez-Gonzalez, Privacy-preserving data aggregation in smart metering systems: an overview, Signal ProcessingMagazine, IEEE, vol. 30, no. 2, 2013.
[48] F. Yu, P. Zhang, W. Xiao, and P. Choudhury, Communication systems for grid integra-tion of renewable energy resources, Network, IEEE, vol. 25, no. 5, pp. 2229, 2011.
[49] I. Paschalidis, B. Li, and M. Caramanis, Demand-side management for regulation serviceprovisioning through internal pricing, Power Systems, IEEE Transactions on, vol. 27,no. 3, pp. 15311539, 2012.
[50] F. Li, B. Luo, and P. Liu, Secure information aggregation for smart grids using ho-momorphic encryption, in Smart Grid Communications (SmartGridComm), 2010 FirstIEEE International Conference on, 2010.
74

[51] X. He, M.-O. Pun, and C.-C. Kuo, Secure and efficient cryptosystem for smart gridusing homomorphic encryption, in Innovative Smart Grid Technologies (ISGT), 2012IEEE PES, 2012.
[52] M. Lisovich and S. Wicker, Privacy concerns in upcoming residential and commercialdemand-response systems, in Clemson University Power Systems Conference, 2008.
[53] M. Lisovich, D. Mulligan, and S. Wicker, Inferring personal information from demand-response systems, Security Privacy, IEEE, 2010.
[54] F. Cohen, The smarter grid, Security Privacy, IEEE, vol. 8, 2010.
[55] F. D. Garcia and B. Jacobs, Privacy-friendly energy-metering via homomorphic encryp-tion, ser. STM, 2010.
[56] K. Kursawe, G. Danezis, and M. Kohlweiss, Privacy-friendly aggregation for the smart-grid, in Proceedings of the 11th International Conference on Privacy Enhancing Tech-nologies, ser. PETS11, 2011.
[57] Z. Erkin and G. Tsudik, Private computation of spatial and temporal power consump-tion with smart meters, ser. ACNS, 2012.
[58] N. Saputro and K. Akkaya, Performance evaluation of smart grid data aggregationvia homomorphic encryption, in Wireless Communications and Networking Conference(WCNC), 2012 IEEE, 2012.
[59] D. Niyato, P. Wang, and E. Hossain, Reliability analysis and redundancy design of smartgrid wireless communications system for demand side management, Wireless Commu-nications, IEEE, vol. 19, 2012.
[60] K. Moslehi and R. Kumar, A reliability perspective of the smart grid, Smart Grid, IEEETransactions on, vol. 1, no. 1, pp. 5764, 2010.
[61] S. Shao, M. Pipattanasomporn, and S. Rahman, Grid integration of electric vehiclesand demand response with customer choice, Smart Grid, IEEE Transactions on, vol. 3,2012.
[62] M. Weiss, A. Helfenstein, F. Mattern, and T. Staake, Leveraging smart meter data torecognize home appliances, in Pervasive Computing and Communications (PerCom),2012 IEEE International Conference on, 2012, pp. 190197.
[63] G. Acs, C. Castelluccia, and W. Lecat, Protecting against physical resource monitoring,in Proceedings of the 10th Annual ACM Workshop on Privacy in the Electronic Society,ser. WPES 11, 2011, pp. 2332.
[64] W. Yang, N. Li, Y. Qi, W. Qardaji, S. McLaughlin, and P. McDaniel, Minimizingprivate data disclosures in the smart grid, in Proceedings of the 2012 ACM Conferenceon Computer and Communications Security, ser. CCS 12. New York, NY, USA: ACM,2012, pp. 415 427. [Online]. Available: http://doi.acm.org/10.1145/2382196.2382242
75

[65] G. Kalogridis, C. Efthymiou, S. Denic, T. Lewis, and R. Cepeda, Privacy for smart me-ters: Towards undetectable appliance load signatures, in Smart Grid Communications(SmartGridComm), 2010 First IEEE International Conference on, 2010, pp. 232237.
[66] T. Ngoc, I. Echizen, K. Komei, and H. Yoshiura, New approach to quantification ofprivacy on social network sites, in Advanced Information Networking and Applications(AINA), 2010 24th IEEE International Conference on, 2010, pp. 556564.
[67] R. Shokri, G. Theodorakopoulos, J.-Y. Le Boudec, and J.-P. Hubaux, Quantifying loca-tion privacy, in Security and Privacy (SP), 2011 IEEE Symposium on, 2011, pp. 247262.
[68] R. Shokri, J. Freudiger, M. Jadliwala, and J.-P. Hubaux, A distortionbased metric forlocation privacy, in Proceedings of the 8th ACM Workshop on Privacy in the ElectronicSociety, ser. WPES 09. New York, NY, USA: ACM, 2009, pp. 2130.
[69] L. Sankar, S. Rajagopalan, S. Mohajer, and H. Poor, Smart meter privacy: A theoreticalframework, Smart Grid, IEEE Transactions on, vol. 4, no. 2, pp. 837846, 2013.
[70] S. Vaudenay, On privacy models for rfid, in Advances in Cryptology ASIACRYPT 2007,ser. Lecture Notes in Computer Science, K. Kurosawa, Ed. Springer Berlin Heidelberg,2007, vol. 4833, pp. 6887.
[71] C. Dwork, Differential privacy, in Automata, Languages and Programming, ser. LectureNotes in Computer Science, M. Bugliesi, B. Preneel, V. Sassone, and I. Wegener, Eds.Springer Berlin Heidelberg, 2006, vol. 4052, pp. 112.
[72] C. P. K. Chatzikokolakis and P. Panangaden, Anonymity protocols as noisy channels,in Second Symposium TGC, 2006.
[73] A. Serjantov and G. Danezis, Towards an information theoretic metric for anonymity.Springer-Verlag, 2002, pp. 4153.
[74] L. Fischer, S. Katzenbeisser, and C. Eckert, Measuring unlinkability revisited, in Pro-ceedings of the 7th ACM Workshop on Privacy in the Electronic Society, ser. WPES08, 2008, pp. 105110.
[75] T. M. Cover and J. A. Thomas, Elements of Information Theory. John Wiley and Sons,2006.
[76] S. M. Ross, Introduction to Probability and Statistics for Engineers and Scientists.Fourth Edition- Academic Press, 2009.
[77] L. B. Koralov and Y. G. Sinai, Theory of Probability and Random Processes. SecondEdition- Springer, 2007.
[78] R. M. Gray, Entropy and Information Theory. Second Edition- Springer, 2011.
[79] S. T. Inc. [ Online]. Available: http://www.statgraphics.com, 2014.
76

[80] P. Samarati and L. Sweeney, Protecting privacy when disclosing information: k-anonymity and its enforcement through generalization and suppression, in Proceedingsof the IEEE Symposium on Research in Security and Privacy, 1998. [Online]. Available:citeseer.ist.psu.edu/samarati98protecting.html
[81] D. Bernhard, V. Cortier, O. Pereira, and B. Warinschi, Measuring vote privacy, revis-ited, in Proceedings of the 2012 ACM Conference on Computer and CommunicationsSecurity, ser. CCS 12. ACM, 2012, pp. 941952.
[82] A. Serjantov and G. Danezis, Towards an information theoretic metric for anonymity.Springer-Verlag, 2002, pp. 4153.
[83] R. Schuler, Electricity markets, reliability and the environment: Smartening-up thegrid, in System Sciences (HICSS), 2010 43rd Hawaii International Conference on, Jan2010, pp. 17.
[84] I. Richardson and M. Thomson, One-minute resolution domestic electricity use data,2008-2009. colchester, essex: Uk data archive [distributor], october 2010. sn: 6583.
[85] Fazel, K., Kaiser, S., Multi-Carrier and Spread Spectrum Systems From OFDM andMC-CDMA to LTE and WiMAX, A JohnWiley and Sons, Ltd, ISBN 978-0-470-99821-2, 2008.
[86] Babak Karimi, Vinod Namboodiri, Murtuza Jadliwala, ” On the Scalable Collection ofMetering Data in Smart Grids through Message Concatenation ” in Proceedings of theIEEE SmartGridComm 2013 Symposium- Communication Networks for Smart Gridsand Smart Metering (IEEE SmartGridComm 2013 Symposium - Network), Vancouver,Canada, October 2013.
[87] W. Luan, D. Sharp, and S. Lancashire, Smart grid communication network capacityplanning for power utilities, in Transmission and Distribution Conference and Exposi-tion, 2010 IEEE PES, april 2010, pp. 1 4.
[88] M. Allalouf, G. Gershinsky, L. Lewin-Eytan, and J. Naor, Data-qualityaware volumereduction in smart grid networks, in Smart Grid Communications (SmartGridComm),2011 IEEE International Conference on, 2011, pp. 120125.
77