Embed Size (px)
Citation preview
Towards Designing PLC Networks for Ubiquitous Connectivity in Enterprises
Kamran Ali† Ioannis Pefkianakis‡ Alex X. Liu† Kyu-Han Kim‡†Dept. of Computer Science and Engineering, Michigan State University, USA
‡Hewlett Packard Enterprise Laboratories (HPE Labs), Palo Alto, California, USAE-mail: †{alikamr3, alexliu}@cse.msu.edu, ‡{ioannis.pefkianakis, kyu-han.kim}@hpe.com
Abstract—Powerline communication (PLC) provides inexpen-sive, secure and high speed network connectivity, by leveragingthe existing power distribution networks inside the buildings.While PLC technology has the potential to improve connectivityand is considered a key enabler for sensing, control, and automa-tion applications in enterprises, it has been mainly deployed forimproving connectivity in homes. Deploying PLCs in enterprisesis more challenging since the power distribution network ismore complex as compared to homes. Moreover, existing PLCtechnologies such as HomePlug AV have not been designedfor and evaluated in enterprise deployments. In this paper,we first present a comprehensive measurement study of PLCperformance in enterprise settings, by analyzing PLC channelcharacteristics across space, time, and spectral dimensions, usingcommodity HomePlug AV PLC devices. Our results uncover theimpact of distribution lines, circuit breakers, AC phases and elec-trical interference on PLC performance. Based on our findings,we show that careful planning of PLC network topology, routingand spectrum sharing can significantly boost performance ofenterprise PLC networks. Our experimental results show thatmulti-hop routing can increase throughput performance by 5xin scenarios where direct PLC links perform poorly. Moreover,our trace driven simulations for multiple deployments, show thatour proposed fine-grained spectrum sharing design can boost theaggregated and per-link PLC throughput by more than 20% and100% respectively, in enterprise PLC networks.
I. INTRODUCTION
Motivation & Background: Power line communication(PLC) technology has gained popularity as a connectivitysolution in homes and various smart grid related applications.The HomePlug Powerline Alliance is leading the standard-ization efforts, with over 100 million HomePlug devices inthe market and annual growth rate of over 30% [1]. PLCdevices nowadays can support high-bandwidth applicationssuch as HD video streaming and VoIP, while boasting ratesgreater than 1 Gbps [2], [3]. Although PLCs have been widelyadopted in home settings for extending LAN/WLAN networkcoverage and interconnecting home computers, peripherals,entertainment devices and sensors, the deployment of PLCs inlarge buildings such as enterprises remains largely unexplored.One reason for the limited industrial-scale PLC deployment isthe concern that PLC performance will not scale as more PLCnodes are added in the network [4].
PLC technology has the potential to provide high-speedubiquitous connectivity, and facilitate new applications inlarge-building settings (such as enterprises) at low cost, with-out any need for dedicated network cabling. First, PLC canaugment existing Wi-Fi enterprise networks [5], to provideconnectivity to wireless blind spots and to accommodate traffic
from overloaded Access Points. PLC is further considered asa key enabler for sensing, control, and automation in large-scale smart grid systems, which comprise of hundreds ofsensors spread over wide areas. Specifically, PLC can connectenergy meters and SCADA (Supervisory Control and DataAcquisition) sensors to the smart grid control center. In thecontext of IoT, PLC can provide a simple and cost effectiveback haul connectivity to sensors deployed at different partsof an enterprise [4].
Challenges of Enterprise PLC Networks: The deploymentof PLC networks in large buildings such as enterprises is morechallenging than home network settings for three reasons.First, the power distribution networks in enterprises are morecomplex and comprise higher dynamics as compared to thosein homes. In enterprise buildings there are typically multiplepower distribution lines coming in from main switch boards(MSBs). Each distribution line consists of 3 AC phases,which are further distributed into the building through multiplebreaker circuits. Such network components can significantlyaffect PLC performance. Second, PLC channel dynamics,which can be attributed to a multitude of electrical devicesconnected to power lines, can be significant and highly loca-tion dependent in enterprises. Third, the deployment of PLCsin large buildings requires the deployment of multiple PLCdevices to provide ubiquitous coverage, which can lead to highinter-link interferences. Routing and spectrum allocation forimproved connectivity in such scenarios remain unexplored.
Measurement Approach: In this paper, we first present anextensive and in-depth measurement study of PLC networkperformance in enterprise settings, using commodity Home-Plug AV (HPAV) hardware. We leverage open source PLCsoftware tools, which allow us to extract fine PHY-layer andMAC-layer feedback such as tonemaps (i.e. per-subcarriermodulation) from HPAV devices. Our study departs fromrecent measurement efforts [4]–[7] in two ways. First, wecharacterize the impact of the power distribution networkcomponents (distribution lines, AC phases, circuit breakers) oflarge buildings, on PLC performance. We further isolate theimpact of interfering electrical appliances on PLCs. Second,our analysis captures the a) spatial, b) temporal, and c) spec-tral (per OFDM subcarrier level) dynamics of PLC networksin enterprise settings. Finally, based on the results from ourmeasurement study, we explore multi-hop routing in PLCs andpropose a novel spectrum sharing scheme for PLCs.
Findings & Solutions: Our study uncovers several important
arX
iv:1
608.
0657
4v2
[cs
.NI]
30
Aug
201
6
findings related to the behavior of PLC networks in enterprisesettings. We first observe that the communication among PLCnodes located at different power distribution lines is oftenimpossible. Consequently, large buildings consist of multipledisconnected PLC networks. For PLC nodes located under thesame distribution line, AC phases do not have a significanteffect on PLC performance, while circuit breakers can dropPLC throughput by 20%-30%. Moreover, interfering electricalappliances are a key factor of performance degradation inenterprise PLC networks. Such power distribution networkcharacteristics and interfering appliances result into temporaldynamics and asymmetries in PLC channels. Specifically, weobserve performance variations across all the OFDM subcar-riers of the communication spectrum, even for PLC nodesin the same neighborhood. Although our measurements wereconducted with HPAV devices, our results can be generalizedfor other broadband PLC technologies.
Our experimental findings raise important, still open ques-tions related to the deployment of PLC networks in largebuilding settings. How to design PLC network topology?How to share the available spectrum among PLC nodes moreefficiently? Can PLC routing improve performance? To thisend, we first propose a PLC network (PLC-Net) topology,which can provide ubiquitous PLC connectivity in enterprisesettings. We then evaluate routing in PLC-Net, and we showusing testbed experiments that multi-hop routing (such asOLSR routing adopted in 802.11 wireless mesh networks [8])can boost connectivity, and can provide more than 5× through-put gains in certain scenarios. Finally, as HPAV networkscurrently do not support any spectrum allocation strategies,there can be scenarios where a subset of subcarriers are highlyunderutilized. Our finding that per-subcarrier performancevaries among neighboring links in PLCs makes case for adynamic spectrum sharing solution, where the low-modulatedsubcarriers of a certain PLC link can be utilized by other links,to improve the aggregated network performance. We proposeand evaluate such a spectrum sharing approach and show theperformance gains in terms of throughput and fairness.
II. RELATED WORKThere are several areas of research related to our work. We
briefly comment on them and position our contributions.The performance of PLC in larger size buildings has been
studied previously through analysis and trace-driven simu-lations. Authors in [9] investigate the impact of domesticbreakers on low voltage power line communications. Theyfind that, the impact of some breakers is more considerablein broadband ([1-100] MHz) than narrowband ([9-500] kHz).Authors in [10] show that the exact signal power attenuation isproportional to the number of branch circuits in the distributionboards. They further propose a single wire PLC solutionto shorten the communication distance and to reduce theattenuation, which requires the installation of new wiring.In [11], authors further show that the attenuation of branchlines connected to a distribution board is 20 dB, at theMHz bands. Different from the above efforts, we conductmeasurements using commodity HPAV devices and study all
aspects (i.e,. spatial, temporal and spectral) of the performanceof PLC networks in enterprise settings.
Recent studies evaluate PLC performance using HPAVcommodity testbeds. In [5], [7] authors compare HPAV withWiFi performance. They study temporal and spatial varia-tions of the throughput of PLC links and make a case forhybrid PLC-WiFi networks [5]. The measurement study in [6]shows the multi-flow performance of PLC networks. It thenpresents BOLT, which seeks to manage traffic flows in PLCnetworks. Different from our work, the above studies mainlyfocus on temporal variations and the impact of connectedelectrical devices on PLC performance, without consideringthe power distribution network components (breakers, phases,distribution lines), which highly determine PLC performancein an enterprise setting. However, the analysis in previousstudies [12], [13] shows that throughputs in PLC networksdecrease with number of contending stations. This is the mainmotivation behind our novel spectrum sharing strategy forPLCs, which has the potential to enhance the throughput aswell as fairness in enterprise level PLC deployments, whileincuring minimum changes to current HPAV protocols.
In [14], [15], authors evaluate the performance of existinggeo-routing protocols in PLC networks using simulations. In[16], authors discuss an extension of LOAD routing protocolto make it suitable for PLC networks and perform a limitedevaluation of their proposed protocol. However, all theseefforts are either related to PLCs over electric grids [14],[15] or do not take into account practical issues such astemporal variations due to electrical appliances and the impactof power distribution network components. To our knowledge,our study is the first to evaluate routing in PLC networksusing real testbed experiments. Moreover, previous work doesnot take into account spectral properties of PLC channelswhile studying medium access and routing in PLCs. To ourknowledge, there is no prior research study on bandwidthsharing in PLCs.
In summary, different from the aforementioned works, weextensively study the behavior of PLCs in spatial, temporaland spectral dimensions, using commodity PLC devices. Wefurther provide guidelines to design enterprise PLC networksby discussing PLC network topology design and possibleadvantages of multi-hop routing. Finally, we propose a novelbandwidth sharing strategy for PLCs which can improvefairness and aggregated throughput of PLC-Nets.
III. PLC DATASET
In this section, we first describe the main characteristics ofPLC networks related to our study, focusing on the widelydeployed HomePlug AV (HPAV) IEEE 1901 [17] standard.Afterwards, we explain our data collection approach.
A. PLC Background
1) PLC Channel Characteristics: A large body of workon PLC has focused on theoretical modeling of PLC channelcharacteristics [18]–[24]. Multipath is a key characteristic ofPLC channels, which is attributed to unmatched loads orbranch circuits connected to different sockets on the powerline.
In a typical power distribution network of a large building,there are multiple branch circuits with different impedances,and therefore, PLC signals are reflected from multiple reflec-tion points leading to multipath effects. On top of multipathattenuations, several different types of noise in PLC channelshave been identified [23], [24]. Harmonics of AC mains andother low power noise sources in the power lines lead tocolored background noise, which decreases with frequency.This noise is usually negligible in PLCs operating in MHzbands. Radio broadcasts in AM bands create narrow bandnoise consisting of sinusoidal signals with modulated ampli-tudes. Periodic impulsive noise is created due to rectifiers,switching power supplies and AC/DC converters, which canbe either synchronous or asynchronous with AC line cycle.Aperiodic impulsive noise also exists in PLC channels mainlydue to switching transients in electric power supplies, AC/DCconverters, etc.
2) HomePlug AV standard: The most widely adopted fam-ily of PLC standards are HomePlug AV, AV2 and Green PHYstandards [25]. HomePlug AV2, which is the latest of thesestandards, can support up to 1 Gbps PHY rates. Our studyfocuses on the HomePlug AV standard, which has been widelyused in home networks to improve coverage, and can supportmaximum PHY rates of up to 200 Mbps [2], [3].
PHY-layer: One of the main difference between PLCdevices and WiFi devices is that PLCs use the whole frequencyband for communication and WiFi-like channelization is notpossible. HPAV uses 1.8-30 MHz frequency band and employsOFDM with 917 subcarriers, where each subcarrier can useany modulation scheme from BPSK to 1024-QAM dependingon the channel conditions [25]. In order to update the modu-lation schemes for each subcarrier, two communicating HPAVPLC devices continuously exchange and maintain tonemapsbetween them. Tonemaps refer to the information about themodulation scheme used per subcarrier, i.e. the number ofbits modulated per subcarrier. The tonemaps exchanged areestimated for multiple different sub-intervals of the AC mainscycle. Tonemaps are exchanged between PLC devices througha sounding process, where the transmitter sends soundingframes to the receiver using QPSK for all subcarriers, thedestination estimates the channel quality and sends back thetonemaps corresponding to different sub-intervals of AC mainscycle back to the transmitter. The destination can communicateup to 7 tonemaps, i.e. 6 tonemaps for the different sub-intervalsof the AC line cycle called slots and one default tonemap [25].Tonemaps are continuously updated by default after 30 sec-onds or when the error rate exceeds a threshold [25]. Tonemapsprovide us with indirect information about Channel FrequencyResponse (CFR) between communicating PLC devices.
MAC-layer: Both TDMA and CSMA/CA are supportedby HPAV [25]. The CSMA protocol of HPAV devices isdifferent from 802.11 CSMA/CA used by WiFi devices. HPAVdevices increase their contention windows not only after acollision, but also after sensing the medium to be busy [12].The Request to Send (RTS) and Clear to Send (CTS) delimiterscan be enabled in HPAV stations during CSMA slots, to handle
hidden nodes. HPAV frames are 512 byte aggregated physicalblocks (PBs) of data. Reception of each PB of a frame isseparately acknowledged, so that the transmitter retransmitsonly the PBs which are corrupted, either due to collisions orchannel variations.
B. Data CollectionExperimental setup: Our study is based on measurements
with commodity HomePlug AV hardware. We use MeconetHomePlug AV mini-PCI adapters with Intellon INT6300chipsets, which can support 200 Mbps PHY rates. We connectthe PLC adapters to ALIX 2D2 boards, which run OpenWrtoperating system. We use open source PLC software toolnamed open-plc-utils, which is developed by Qualcomm, toextract PHY and MAC-layer feedback (such as tonemaps),directly from the Meconet HPAV adapters.
Experimental methodology: For our experiments we placeour PLC nodes in various locations in the floorplan of Fig-ure 1, of an enterprise building. We elaborate on the powerdistribution network of our building in the following sections.We generate saturated iperf UDP traffic among the PLC nodes(unless it is explicitly stated). The results reported in this paperare averaged over multiple runs.
Metrics: We analyze the performance of PLC networksby first collecting iperf throughput and jitter statistics. Wefurther elaborate on the per-subcarrier PLC network perfor-mance by analyzing the tonemaps extracted by the open-plc-utils software tool running on PLC nodes. For a given PLCcommunication link and for the k th sub-interval of AC linecycle, the effective PHY rate can be estimated from tonemapsas follows [17]:
R {k }phy=
[∑N
j=1 T[ j]{k }] · C {k } · (1 − B {k }err )
Ts(1)
where j is subcarrier number and N is total number ofsubcarriers. Tj is the modulation rate (i.e., bits per subcarrier)of the j th subcarrier. C is Forward Error Correction (FEC)code rate. HomePlug AV supports FEC code rates of 1/2 and16/21. Finally, Berr is the bit error rate and Ts is the symbolinterval of OFDM communication. Ts is approximately ∼46µsfor HomePlug AV including all overheads [25]. The expectedthroughput, averaged over all the sub-intervals of the AC linecycle, can be approximated as:
T hr ≈ (1 − Fo) ·∑NAC
k=1 R {k }phy
NAC(2)
where Fo accounts for HPAV protocol overheads and NAC isthe number of sub-intervals of AC line cycle. NAC is 5 or6 for USA frequencies and Fo is typically ∼ 0.4 based onour experiments. In rest of the paper, we report iperf through-put measurements and tonemaps. In all our experiments, weobserved that the FEC code rate was always 16/21 for thecommunication among our HPAV devices. Therefore, basedon equations 1, 2, the tonemaps of a PLC link reflect itsthroughput performance.
IV. EFFECTS OF POWER DISTRIBUTION NETWORK
In this section, we present our analysis of the measurementswe conducted to study the impact of different components of a
N8
N9
N7
N6N4
N5
N2
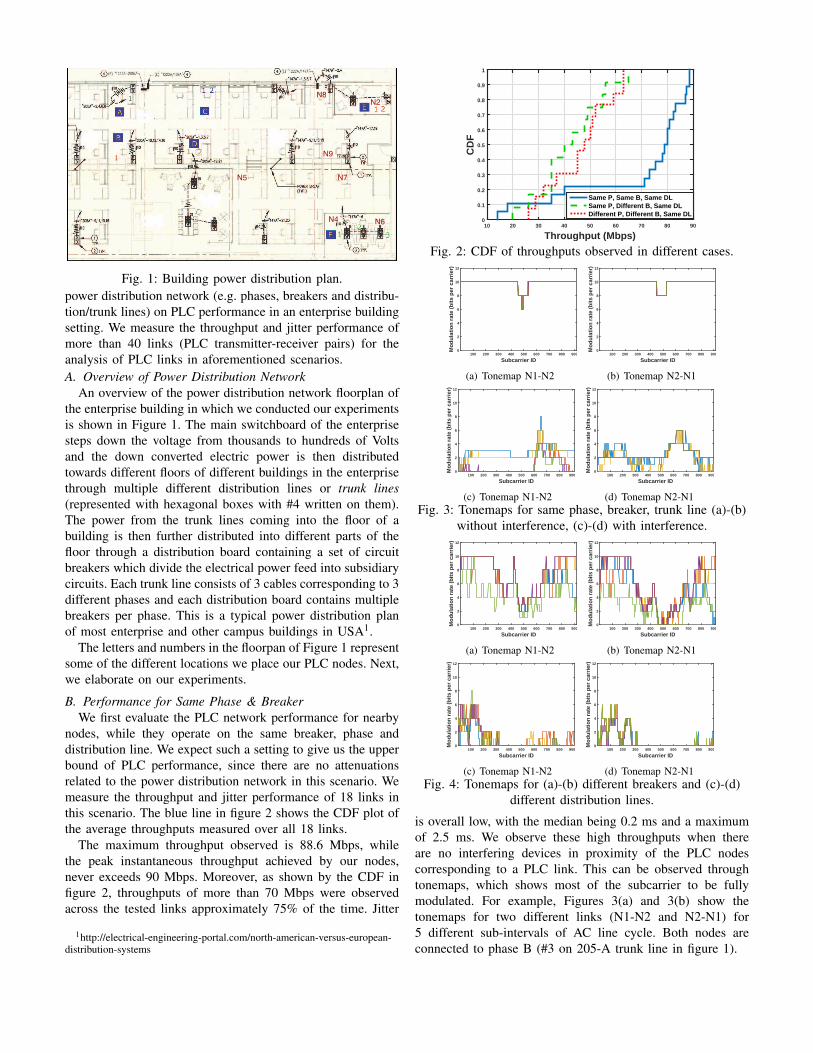
Fig. 1: Building power distribution plan.power distribution network (e.g. phases, breakers and distribu-tion/trunk lines) on PLC performance in an enterprise buildingsetting. We measure the throughput and jitter performance ofmore than 40 links (PLC transmitter-receiver pairs) for theanalysis of PLC links in aforementioned scenarios.A. Overview of Power Distribution Network
An overview of the power distribution network floorplan ofthe enterprise building in which we conducted our experimentsis shown in Figure 1. The main switchboard of the enterprisesteps down the voltage from thousands to hundreds of Voltsand the down converted electric power is then distributedtowards different floors of different buildings in the enterprisethrough multiple different distribution lines or trunk lines(represented with hexagonal boxes with #4 written on them).The power from the trunk lines coming into the floor of abuilding is then further distributed into different parts of thefloor through a distribution board containing a set of circuitbreakers which divide the electrical power feed into subsidiarycircuits. Each trunk line consists of 3 cables corresponding to 3different phases and each distribution board contains multiplebreakers per phase. This is a typical power distribution planof most enterprise and other campus buildings in USA1.
The letters and numbers in the floorpan of Figure 1 representsome of the different locations we place our PLC nodes. Next,we elaborate on our experiments.
B. Performance for Same Phase & BreakerWe first evaluate the PLC network performance for nearby
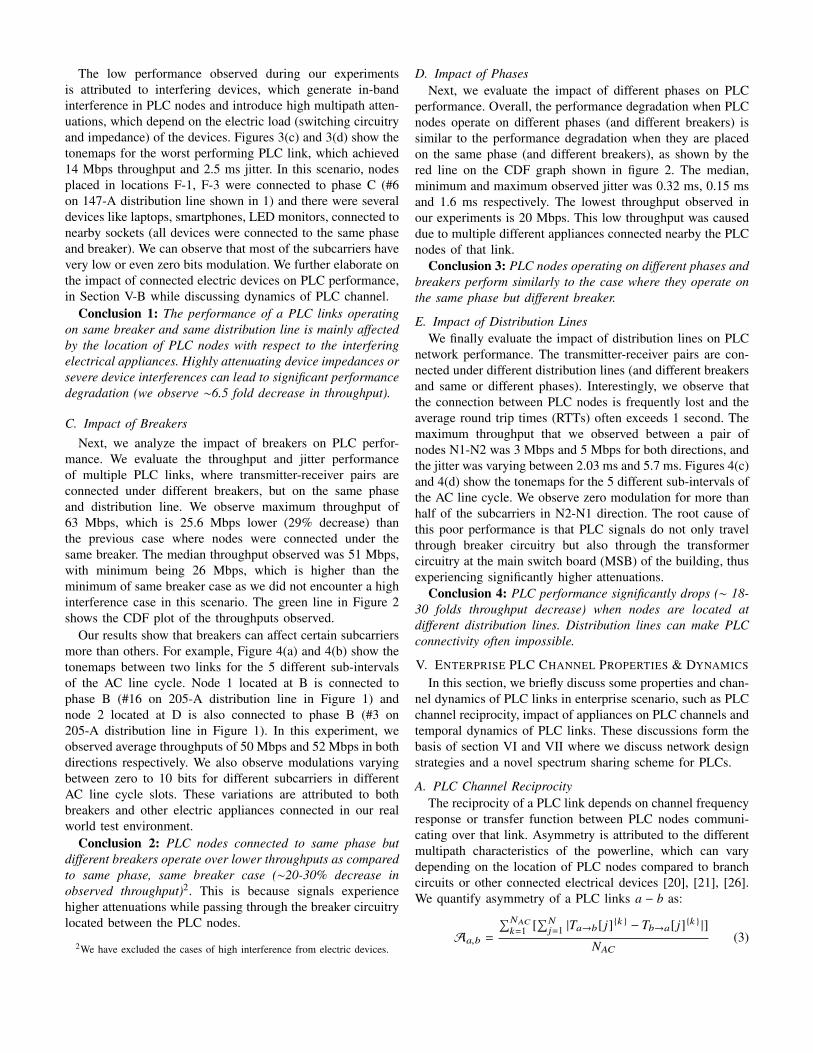
nodes, while they operate on the same breaker, phase anddistribution line. We expect such a setting to give us the upperbound of PLC performance, since there are no attenuationsrelated to the power distribution network in this scenario. Wemeasure the throughput and jitter performance of 18 links inthis scenario. The blue line in figure 2 shows the CDF plot ofthe average throughputs measured over all 18 links.
The maximum throughput observed is 88.6 Mbps, whilethe peak instantaneous throughput achieved by our nodes,never exceeds 90 Mbps. Moreover, as shown by the CDF infigure 2, throughputs of more than 70 Mbps were observedacross the tested links approximately 75% of the time. Jitter
1http://electrical-engineering-portal.com/north-american-versus-european-distribution-systems
Throughput (Mbps)10 20 30 40 50 60 70 80 90
CD
F
0
0.1
0.2
0.3
0.4
0.5
0.6
0.7
0.8
0.9
1
Same P, Same B, Same DLSame P, Different B, Same DLDifferent P, Different B, Same DL
Fig. 2: CDF of throughputs observed in different cases.
Subcarrier ID100 200 300 400 500 600 700 800 900
Mo
du
lati
on
rat
e (b
its
per
car
rier
)
0
2
4
6
8
10
12
(a) Tonemap N1-N2
Subcarrier ID100 200 300 400 500 600 700 800 900
Mo
du
lati
on
rat
e (b
its
per
car
rier
)
0
2
4
6
8
10
12
(b) Tonemap N2-N1
Subcarrier ID100 200 300 400 500 600 700 800 900
Mo
du
lati
on
rat
e (b
its
per
car
rier
)
0
2
4
6
8
10
12
(c) Tonemap N1-N2
Subcarrier ID100 200 300 400 500 600 700 800 900
Mo
du
lati
on
rat
e (b
its
per
car
rier
)
0
2
4
6
8
10
12
(d) Tonemap N2-N1Fig. 3: Tonemaps for same phase, breaker, trunk line (a)-(b)
without interference, (c)-(d) with interference.
Subcarrier ID100 200 300 400 500 600 700 800 900
Mo
du
lati
on
rat
e (b
its
per
car
rier
)
0
2
4
6
8
10
12
(a) Tonemap N1-N2
Subcarrier ID100 200 300 400 500 600 700 800 900
Mo
du
lati
on
rat
e (b
its
per
car
rier
)
0
2
4
6
8
10
12
(b) Tonemap N2-N1
Subcarrier ID100 200 300 400 500 600 700 800 900
Mo
du
lati
on
rat
e (b
its
per
car
rier
)
0
2
4
6
8
10
12
(c) Tonemap N1-N2
Subcarrier ID100 200 300 400 500 600 700 800 900
Mo
du
lati
on
rat
e (b
its
per
car
rier
)
0
2
4
6
8
10
12
(d) Tonemap N2-N1Fig. 4: Tonemaps for (a)-(b) different breakers and (c)-(d)
different distribution lines.
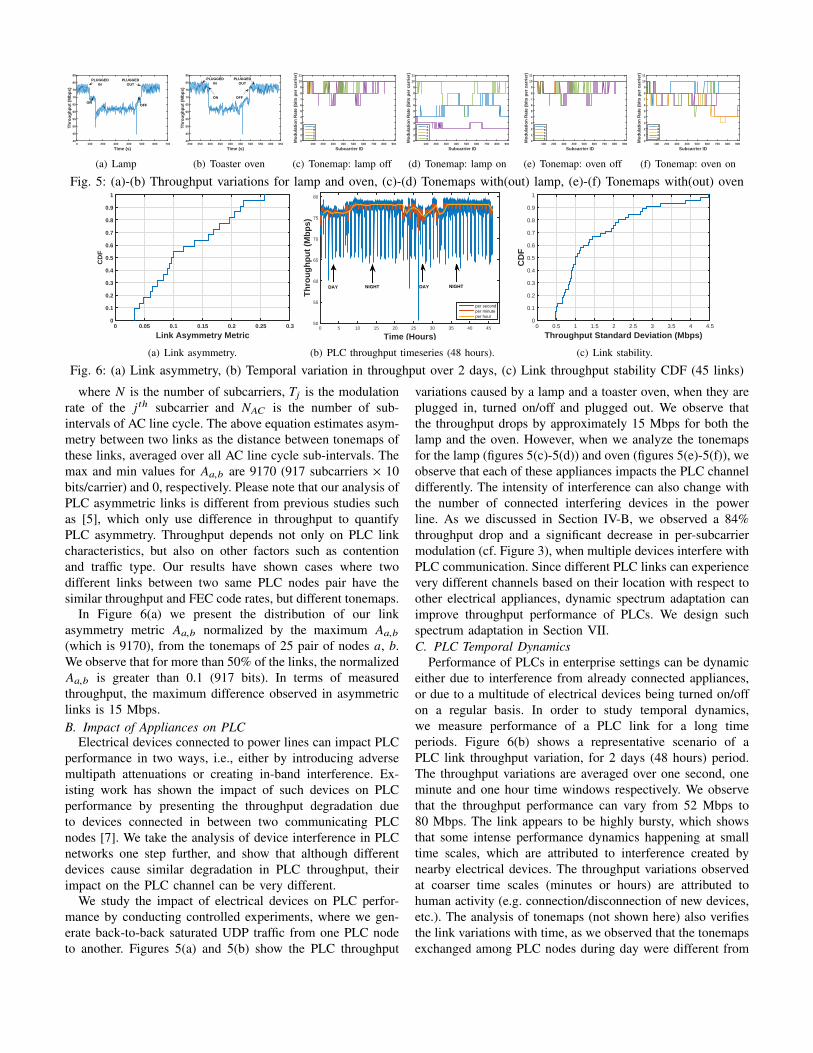
is overall low, with the median being 0.2 ms and a maximumof 2.5 ms. We observe these high throughputs when thereare no interfering devices in proximity of the PLC nodescorresponding to a PLC link. This can be observed throughtonemaps, which shows most of the subcarrier to be fullymodulated. For example, Figures 3(a) and 3(b) show thetonemaps for two different links (N1-N2 and N2-N1) for5 different sub-intervals of AC line cycle. Both nodes areconnected to phase B (#3 on 205-A trunk line in figure 1).
The low performance observed during our experimentsis attributed to interfering devices, which generate in-bandinterference in PLC nodes and introduce high multipath atten-uations, which depend on the electric load (switching circuitryand impedance) of the devices. Figures 3(c) and 3(d) show thetonemaps for the worst performing PLC link, which achieved14 Mbps throughput and 2.5 ms jitter. In this scenario, nodesplaced in locations F-1, F-3 were connected to phase C (#6on 147-A distribution line shown in 1) and there were severaldevices like laptops, smartphones, LED monitors, connected tonearby sockets (all devices were connected to the same phaseand breaker). We can observe that most of the subcarriers havevery low or even zero bits modulation. We further elaborate onthe impact of connected electric devices on PLC performance,in Section V-B while discussing dynamics of PLC channel.
Conclusion 1: The performance of a PLC links operatingon same breaker and same distribution line is mainly affectedby the location of PLC nodes with respect to the interferingelectrical appliances. Highly attenuating device impedances orsevere device interferences can lead to significant performancedegradation (we observe ∼6.5 fold decrease in throughput).
C. Impact of BreakersNext, we analyze the impact of breakers on PLC perfor-
mance. We evaluate the throughput and jitter performanceof multiple PLC links, where transmitter-receiver pairs areconnected under different breakers, but on the same phaseand distribution line. We observe maximum throughput of63 Mbps, which is 25.6 Mbps lower (29% decrease) thanthe previous case where nodes were connected under thesame breaker. The median throughput observed was 51 Mbps,with minimum being 26 Mbps, which is higher than theminimum of same breaker case as we did not encounter a highinterference case in this scenario. The green line in Figure 2shows the CDF plot of the throughputs observed.
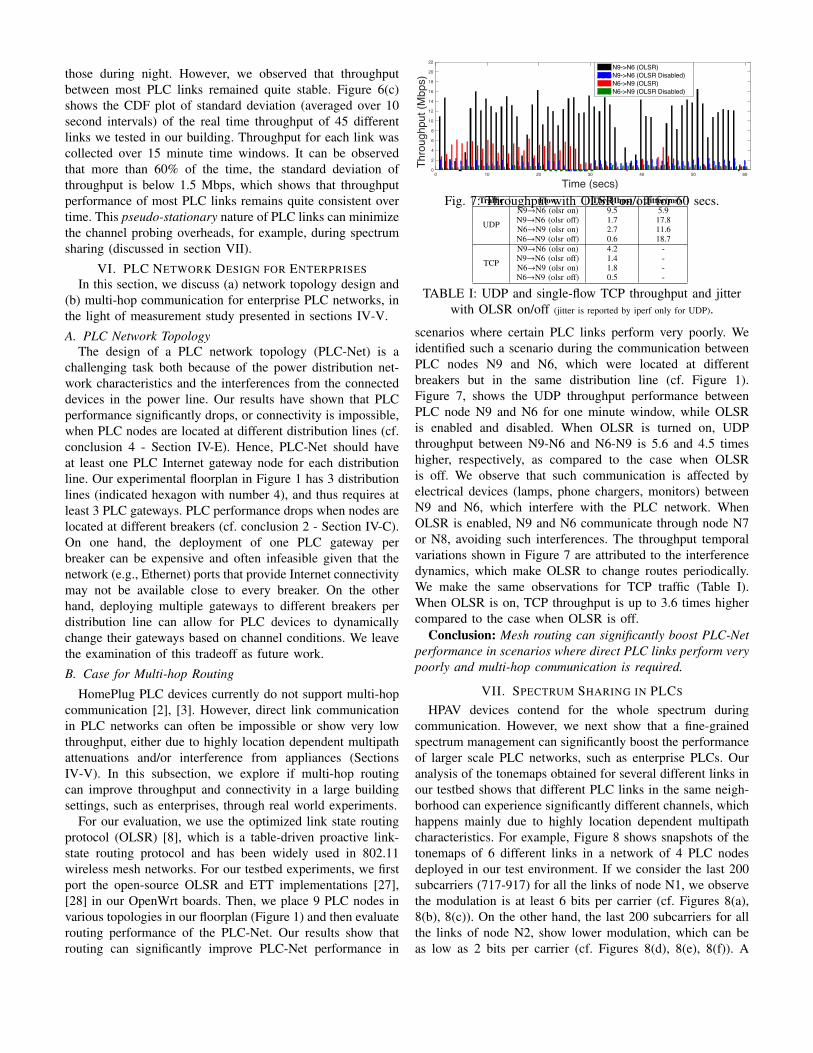
Our results show that breakers can affect certain subcarriersmore than others. For example, Figure 4(a) and 4(b) show thetonemaps between two links for the 5 different sub-intervalsof the AC line cycle. Node 1 located at B is connected tophase B (#16 on 205-A distribution line in Figure 1) andnode 2 located at D is also connected to phase B (#3 on205-A distribution line in Figure 1). In this experiment, weobserved average throughputs of 50 Mbps and 52 Mbps in bothdirections respectively. We also observe modulations varyingbetween zero to 10 bits for different subcarriers in differentAC line cycle slots. These variations are attributed to bothbreakers and other electric appliances connected in our realworld test environment.
Conclusion 2: PLC nodes connected to same phase butdifferent breakers operate over lower throughputs as comparedto same phase, same breaker case (∼20-30% decrease inobserved throughput)2. This is because signals experiencehigher attenuations while passing through the breaker circuitrylocated between the PLC nodes.
2We have excluded the cases of high interference from electric devices.
D. Impact of PhasesNext, we evaluate the impact of different phases on PLC
performance. Overall, the performance degradation when PLCnodes operate on different phases (and different breakers) issimilar to the performance degradation when they are placedon the same phase (and different breakers), as shown by thered line on the CDF graph shown in figure 2. The median,minimum and maximum observed jitter was 0.32 ms, 0.15 msand 1.6 ms respectively. The lowest throughput observed inour experiments is 20 Mbps. This low throughput was causeddue to multiple different appliances connected nearby the PLCnodes of that link.
Conclusion 3: PLC nodes operating on different phases andbreakers perform similarly to the case where they operate onthe same phase but different breaker.
E. Impact of Distribution LinesWe finally evaluate the impact of distribution lines on PLC
network performance. The transmitter-receiver pairs are con-nected under different distribution lines (and different breakersand same or different phases). Interestingly, we observe thatthe connection between PLC nodes is frequently lost and theaverage round trip times (RTTs) often exceeds 1 second. Themaximum throughput that we observed between a pair ofnodes N1-N2 was 3 Mbps and 5 Mbps for both directions, andthe jitter was varying between 2.03 ms and 5.7 ms. Figures 4(c)and 4(d) show the tonemaps for the 5 different sub-intervals ofthe AC line cycle. We observe zero modulation for more thanhalf of the subcarriers in N2-N1 direction. The root cause ofthis poor performance is that PLC signals do not only travelthrough breaker circuitry but also through the transformercircuitry at the main switch board (MSB) of the building, thusexperiencing significantly higher attenuations.
Conclusion 4: PLC performance significantly drops (∼ 18-30 folds throughput decrease) when nodes are located atdifferent distribution lines. Distribution lines can make PLCconnectivity often impossible.
V. ENTERPRISE PLC CHANNEL PROPERTIES & DYNAMICS
In this section, we briefly discuss some properties and chan-nel dynamics of PLC links in enterprise scenario, such as PLCchannel reciprocity, impact of appliances on PLC channels andtemporal dynamics of PLC links. These discussions form thebasis of section VI and VII where we discuss network designstrategies and a novel spectrum sharing scheme for PLCs.
A. PLC Channel ReciprocityThe reciprocity of a PLC link depends on channel frequency
response or transfer function between PLC nodes communi-cating over that link. Asymmetry is attributed to the differentmultipath characteristics of the powerline, which can varydepending on the location of PLC nodes compared to branchcircuits or other connected electrical devices [20], [21], [26].We quantify asymmetry of a PLC links a − b as:
Aa,b =
∑NAC
k=1 [∑N
j=1 |Ta→b[ j]{k } − Tb→a[ j]{k } |]NAC
(3)
Time (s)0 100 200 300 400 500 600 700
Th
rou
gh
pu
t (M
bp
s)
40
45
50
55
60
65
70
75
80
85
PLUGGED OUT
ON
PLUGGED IN
OFF
(a) Lamp
Time (s)200 250 300 350 400 450 500 550 600 650
Th
rou
gh
pu
t (M
bp
s)
40
45
50
55
60
65
70
75
80
85PLUGGED IN
ON OFF
PLUGGED OUT
(b) Toaster oven
Subcarrier ID100 200 300 400 500 600 700 800 900
Mo
du
lati
on
Rat
e (b
its
per
car
rier
)
0
1
2
3
4
5
6
7
8
9
10
11
ABCDE
(c) Tonemap: lamp off
Subcarrier ID100 200 300 400 500 600 700 800 900
Mo
du
lati
on
Rat
e (b
its
per
car
rier
)
0
1
2
3
4
5
6
7
8
9
10
11
ABCDE
(d) Tonemap: lamp on
Subcarrier ID100 200 300 400 500 600 700 800 900
Mo
du
lati
on
Rat
e (b
its
per
car
rier
)
0
1
2
3
4
5
6
7
8
9
10
11
ABCDE
(e) Tonemap: oven off
Subcarrier ID100 200 300 400 500 600 700 800 900
Mo
du
lati
on
Rat
e (b
its
per
car
rier
)
0
1
2
3
4
5
6
7
8
9
10
11
ABCDE
(f) Tonemap: oven on
Fig. 5: (a)-(b) Throughput variations for lamp and oven, (c)-(d) Tonemaps with(out) lamp, (e)-(f) Tonemaps with(out) oven
Link Asymmetry Metric0 0.05 0.1 0.15 0.2 0.25 0.3
CD
F
0
0.1
0.2
0.3
0.4
0.5
0.6
0.7
0.8
0.9
1
(a) Link asymmetry.
Time (Hours)0 5 10 15 20 25 30 35 40 45
Th
rou
gh
pu
t (M
bp
s)
50
55
60
65
70
75
80
per secondper minuteper hour
NIGHTDAYDAY NIGHT
(b) PLC throughput timeseries (48 hours).
Throughput Standard Deviation (Mbps)0 0.5 1 1.5 2 2.5 3 3.5 4 4.5
CD
F
0
0.1
0.2
0.3
0.4
0.5
0.6
0.7
0.8
0.9
1
(c) Link stability.
Fig. 6: (a) Link asymmetry, (b) Temporal variation in throughput over 2 days, (c) Link throughput stability CDF (45 links)
where N is the number of subcarriers, Tj is the modulationrate of the j th subcarrier and NAC is the number of sub-intervals of AC line cycle. The above equation estimates asym-metry between two links as the distance between tonemaps ofthese links, averaged over all AC line cycle sub-intervals. Themax and min values for Aa,b are 9170 (917 subcarriers × 10bits/carrier) and 0, respectively. Please note that our analysis ofPLC asymmetric links is different from previous studies suchas [5], which only use difference in throughput to quantifyPLC asymmetry. Throughput depends not only on PLC linkcharacteristics, but also on other factors such as contentionand traffic type. Our results have shown cases where twodifferent links between two same PLC nodes pair have thesimilar throughput and FEC code rates, but different tonemaps.
In Figure 6(a) we present the distribution of our linkasymmetry metric Aa,b normalized by the maximum Aa,b
(which is 9170), from the tonemaps of 25 pair of nodes a, b.We observe that for more than 50% of the links, the normalizedAa,b is greater than 0.1 (917 bits). In terms of measuredthroughput, the maximum difference observed in asymmetriclinks is 15 Mbps.B. Impact of Appliances on PLC
Electrical devices connected to power lines can impact PLCperformance in two ways, i.e., either by introducing adversemultipath attenuations or creating in-band interference. Ex-isting work has shown the impact of such devices on PLCperformance by presenting the throughput degradation dueto devices connected in between two communicating PLCnodes [7]. We take the analysis of device interference in PLCnetworks one step further, and show that although differentdevices cause similar degradation in PLC throughput, theirimpact on the PLC channel can be very different.
We study the impact of electrical devices on PLC perfor-mance by conducting controlled experiments, where we gen-erate back-to-back saturated UDP traffic from one PLC nodeto another. Figures 5(a) and 5(b) show the PLC throughput
variations caused by a lamp and a toaster oven, when they areplugged in, turned on/off and plugged out. We observe thatthe throughput drops by approximately 15 Mbps for both thelamp and the oven. However, when we analyze the tonemapsfor the lamp (figures 5(c)-5(d)) and oven (figures 5(e)-5(f)), weobserve that each of these appliances impacts the PLC channeldifferently. The intensity of interference can also change withthe number of connected interfering devices in the powerline. As we discussed in Section IV-B, we observed a 84%throughput drop and a significant decrease in per-subcarriermodulation (cf. Figure 3), when multiple devices interfere withPLC communication. Since different PLC links can experiencevery different channels based on their location with respect toother electrical appliances, dynamic spectrum adaptation canimprove throughput performance of PLCs. We design suchspectrum adaptation in Section VII.C. PLC Temporal Dynamics
Performance of PLCs in enterprise settings can be dynamiceither due to interference from already connected appliances,or due to a multitude of electrical devices being turned on/offon a regular basis. In order to study temporal dynamics,we measure performance of a PLC link for a long timeperiods. Figure 6(b) shows a representative scenario of aPLC link throughput variation, for 2 days (48 hours) period.The throughput variations are averaged over one second, oneminute and one hour time windows respectively. We observethat the throughput performance can vary from 52 Mbps to80 Mbps. The link appears to be highly bursty, which showsthat some intense performance dynamics happening at smalltime scales, which are attributed to interference created bynearby electrical devices. The throughput variations observedat coarser time scales (minutes or hours) are attributed tohuman activity (e.g. connection/disconnection of new devices,etc.). The analysis of tonemaps (not shown here) also verifiesthe link variations with time, as we observed that the tonemapsexchanged among PLC nodes during day were different from
those during night. However, we observed that throughputbetween most PLC links remained quite stable. Figure 6(c)shows the CDF plot of standard deviation (averaged over 10second intervals) of the real time throughput of 45 differentlinks we tested in our building. Throughput for each link wascollected over 15 minute time windows. It can be observedthat more than 60% of the time, the standard deviation ofthroughput is below 1.5 Mbps, which shows that throughputperformance of most PLC links remains quite consistent overtime. This pseudo-stationary nature of PLC links can minimizethe channel probing overheads, for example, during spectrumsharing (discussed in section VII).
VI. PLC NETWORK DESIGN FOR ENTERPRISESIn this section, we discuss (a) network topology design and
(b) multi-hop communication for enterprise PLC networks, inthe light of measurement study presented in sections IV-V.
A. PLC Network TopologyThe design of a PLC network topology (PLC-Net) is a
challenging task both because of the power distribution net-work characteristics and the interferences from the connecteddevices in the power line. Our results have shown that PLCperformance significantly drops, or connectivity is impossible,when PLC nodes are located at different distribution lines (cf.conclusion 4 - Section IV-E). Hence, PLC-Net should haveat least one PLC Internet gateway node for each distributionline. Our experimental floorplan in Figure 1 has 3 distributionlines (indicated hexagon with number 4), and thus requires atleast 3 PLC gateways. PLC performance drops when nodes arelocated at different breakers (cf. conclusion 2 - Section IV-C).On one hand, the deployment of one PLC gateway perbreaker can be expensive and often infeasible given that thenetwork (e.g., Ethernet) ports that provide Internet connectivitymay not be available close to every breaker. On the otherhand, deploying multiple gateways to different breakers perdistribution line can allow for PLC devices to dynamicallychange their gateways based on channel conditions. We leavethe examination of this tradeoff as future work.
B. Case for Multi-hop Routing
HomePlug PLC devices currently do not support multi-hopcommunication [2], [3]. However, direct link communicationin PLC networks can often be impossible or show very lowthroughput, either due to highly location dependent multipathattenuations and/or interference from appliances (SectionsIV-V). In this subsection, we explore if multi-hop routingcan improve throughput and connectivity in a large buildingsettings, such as enterprises, through real world experiments.
For our evaluation, we use the optimized link state routingprotocol (OLSR) [8], which is a table-driven proactive link-state routing protocol and has been widely used in 802.11wireless mesh networks. For our testbed experiments, we firstport the open-source OLSR and ETT implementations [27],[28] in our OpenWrt boards. Then, we place 9 PLC nodes invarious topologies in our floorplan (Figure 1) and then evaluaterouting performance of the PLC-Net. Our results show thatrouting can significantly improve PLC-Net performance in
Time (secs)0 10 20 30 40 50 60
Thro
ughp
ut (M
bps)
0
2
4
6
8
10
12
14
16
18
20
22N9->N6 (OLSR)N9->N6 (OLSR Disabled)N6->N9 (OLSR)N6->N9 (OLSR Disabled)
Fig. 7: Throughput with OLSR on/off for 60 secs.Traffic Flow Thr(Mbps) Jitter(ms)
UDP
N9→N6 (olsr on) 9.5 5.9N9→N6 (olsr off) 1.7 17.8N6→N9 (olsr on) 2.7 11.6N6→N9 (olsr off) 0.6 18.7
TCP
N9→N6 (olsr on) 4.2 -N9→N6 (olsr off) 1.4 -N6→N9 (olsr on) 1.8 -N6→N9 (olsr off) 0.5 -
TABLE I: UDP and single-flow TCP throughput and jitterwith OLSR on/off (jitter is reported by iperf only for UDP).
scenarios where certain PLC links perform very poorly. Weidentified such a scenario during the communication betweenPLC nodes N9 and N6, which were located at differentbreakers but in the same distribution line (cf. Figure 1).Figure 7, shows the UDP throughput performance betweenPLC node N9 and N6 for one minute window, while OLSRis enabled and disabled. When OLSR is turned on, UDPthroughput between N9-N6 and N6-N9 is 5.6 and 4.5 timeshigher, respectively, as compared to the case when OLSRis off. We observe that such communication is affected byelectrical devices (lamps, phone chargers, monitors) betweenN9 and N6, which interfere with the PLC network. WhenOLSR is enabled, N9 and N6 communicate through node N7or N8, avoiding such interferences. The throughput temporalvariations shown in Figure 7 are attributed to the interferencedynamics, which make OLSR to change routes periodically.We make the same observations for TCP traffic (Table I).When OLSR is on, TCP throughput is up to 3.6 times highercompared to the case when OLSR is off.
Conclusion: Mesh routing can significantly boost PLC-Netperformance in scenarios where direct PLC links perform verypoorly and multi-hop communication is required.
VII. SPECTRUM SHARING IN PLCS
HPAV devices contend for the whole spectrum duringcommunication. However, we next show that a fine-grainedspectrum management can significantly boost the performanceof larger scale PLC networks, such as enterprise PLCs. Ouranalysis of the tonemaps obtained for several different links inour testbed shows that different PLC links in the same neigh-borhood can experience significantly different channels, whichhappens mainly due to highly location dependent multipathcharacteristics. For example, Figure 8 shows snapshots of thetonemaps of 6 different links in a network of 4 PLC nodesdeployed in our test environment. If we consider the last 200subcarriers (717-917) for all the links of node N1, we observethe modulation is at least 6 bits per carrier (cf. Figures 8(a),8(b), 8(c)). On the other hand, the last 200 subcarriers for allthe links of node N2, show lower modulation, which can beas low as 2 bits per carrier (cf. Figures 8(d), 8(e), 8(f)). A
Subcarrier ID100 200 300 400 500 600 700 800 900
Mo
du
lati
on
Rat
e (b
its
per
car
rier
)
0
1
2
3
4
5
6
7
8
9
10
11
(a) Tonemap N1-N2
Subcarrier ID100 200 300 400 500 600 700 800 900
Mo
du
lati
on
Rat
e (b
its
per
car
rier
)
0
1
2
3
4
5
6
7
8
9
10
11
(b) Tonemap N1-N3
Subcarrier ID100 200 300 400 500 600 700 800 900
Mo
du
lati
on
Rat
e (b
its
per
car
rier
)
0
1
2
3
4
5
6
7
8
9
10
11
(c) Tonemap N1-N4
Subcarrier ID100 200 300 400 500 600 700 800 900
Mo
du
lati
on
Rat
e (b
its
per
car
rier
)
0
1
2
3
4
5
6
7
8
9
10
11
(d) Tonemap N2-N1
Subcarrier ID100 200 300 400 500 600 700 800 900
Mo
du
lati
on
Rat
e (b
its
per
car
rier
)
0
1
2
3
4
5
6
7
8
9
10
11
(e) Tonemap N2-N3
Subcarrier ID100 200 300 400 500 600 700 800 900
Mo
du
lati
on
Rat
e (b
its
per
car
rier
)
0
1
2
3
4
5
6
7
8
9
10
11
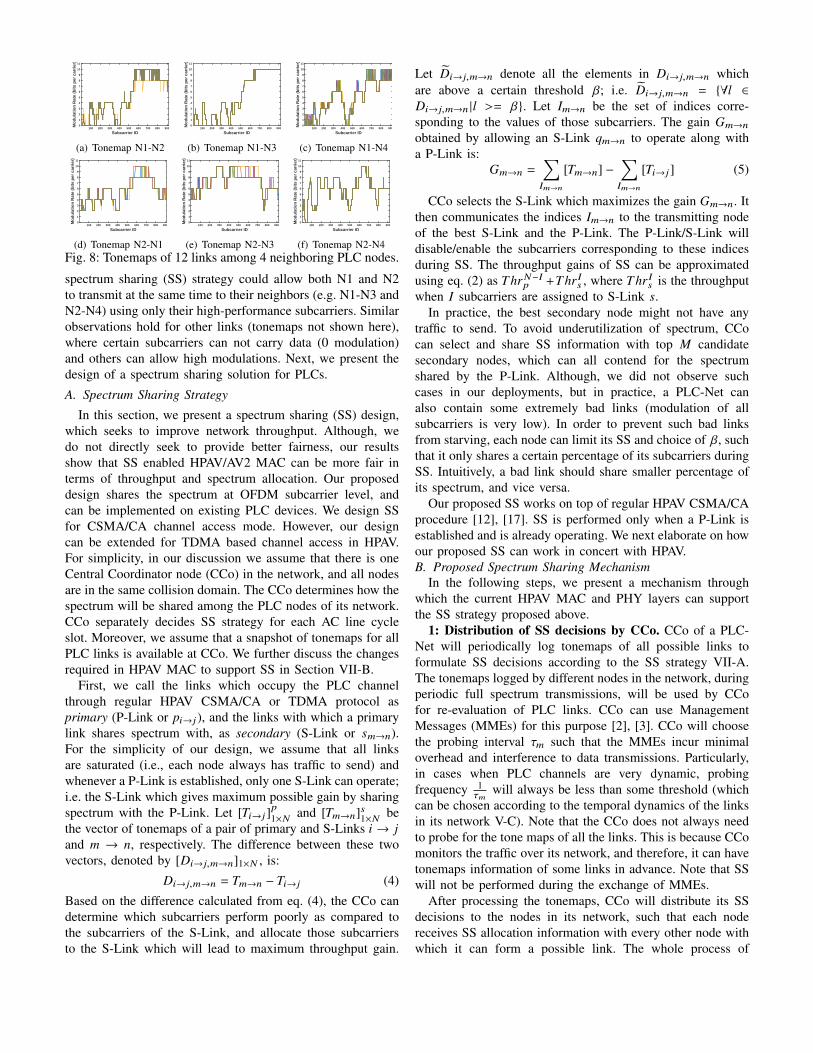
(f) Tonemap N2-N4Fig. 8: Tonemaps of 12 links among 4 neighboring PLC nodes.
spectrum sharing (SS) strategy could allow both N1 and N2to transmit at the same time to their neighbors (e.g. N1-N3 andN2-N4) using only their high-performance subcarriers. Similarobservations hold for other links (tonemaps not shown here),where certain subcarriers can not carry data (0 modulation)and others can allow high modulations. Next, we present thedesign of a spectrum sharing solution for PLCs.
A. Spectrum Sharing Strategy
In this section, we present a spectrum sharing (SS) design,which seeks to improve network throughput. Although, wedo not directly seek to provide better fairness, our resultsshow that SS enabled HPAV/AV2 MAC can be more fair interms of throughput and spectrum allocation. Our proposeddesign shares the spectrum at OFDM subcarrier level, andcan be implemented on existing PLC devices. We design SSfor CSMA/CA channel access mode. However, our designcan be extended for TDMA based channel access in HPAV.For simplicity, in our discussion we assume that there is oneCentral Coordinator node (CCo) in the network, and all nodesare in the same collision domain. The CCo determines how thespectrum will be shared among the PLC nodes of its network.CCo separately decides SS strategy for each AC line cycleslot. Moreover, we assume that a snapshot of tonemaps for allPLC links is available at CCo. We further discuss the changesrequired in HPAV MAC to support SS in Section VII-B.
First, we call the links which occupy the PLC channelthrough regular HPAV CSMA/CA or TDMA protocol asprimary (P-Link or pi→j), and the links with which a primarylink shares spectrum with, as secondary (S-Link or sm→n).For the simplicity of our design, we assume that all linksare saturated (i.e., each node always has traffic to send) andwhenever a P-Link is established, only one S-Link can operate;i.e. the S-Link which gives maximum possible gain by sharingspectrum with the P-Link. Let [Ti→j]p1×N and [Tm→n]s1×N bethe vector of tonemaps of a pair of primary and S-Links i → jand m → n, respectively. The difference between these twovectors, denoted by [Di→j,m→n]1×N , is:
Di→j,m→n = Tm→n − Ti→j (4)
Based on the difference calculated from eq. (4), the CCo candetermine which subcarriers perform poorly as compared tothe subcarriers of the S-Link, and allocate those subcarriersto the S-Link which will lead to maximum throughput gain.
Let D̃i→j,m→n denote all the elements in Di→j,m→n whichare above a certain threshold β; i.e. D̃i→j,m→n = {∀l ∈Di→j,m→n |l >= β}. Let Im→n be the set of indices corre-sponding to the values of those subcarriers. The gain Gm→n
obtained by allowing an S-Link qm→n to operate along witha P-Link is:
Gm→n =∑
Im→n
[Tm→n] −∑
Im→n
[Ti→j] (5)
CCo selects the S-Link which maximizes the gain Gm→n. Itthen communicates the indices Im→n to the transmitting nodeof the best S-Link and the P-Link. The P-Link/S-Link willdisable/enable the subcarriers corresponding to these indicesduring SS. The throughput gains of SS can be approximatedusing eq. (2) as T hrN−Ip +T hr Is , where T hr Is is the throughputwhen I subcarriers are assigned to S-Link s.
In practice, the best secondary node might not have anytraffic to send. To avoid underutilization of spectrum, CCocan select and share SS information with top M candidatesecondary nodes, which can all contend for the spectrumshared by the P-Link. Although, we did not observe suchcases in our deployments, but in practice, a PLC-Net canalso contain some extremely bad links (modulation of allsubcarriers is very low). In order to prevent such bad linksfrom starving, each node can limit its SS and choice of β, suchthat it only shares a certain percentage of its subcarriers duringSS. Intuitively, a bad link should share smaller percentage ofits spectrum, and vice versa.
Our proposed SS works on top of regular HPAV CSMA/CAprocedure [12], [17]. SS is performed only when a P-Link isestablished and is already operating. We next elaborate on howour proposed SS can work in concert with HPAV.B. Proposed Spectrum Sharing Mechanism
In the following steps, we present a mechanism throughwhich the current HPAV MAC and PHY layers can supportthe SS strategy proposed above.
1: Distribution of SS decisions by CCo. CCo of a PLC-Net will periodically log tonemaps of all possible links toformulate SS decisions according to the SS strategy VII-A.The tonemaps logged by different nodes in the network, duringperiodic full spectrum transmissions, will be used by CCofor re-evaluation of PLC links. CCo can use ManagementMessages (MMEs) for this purpose [2], [3]. CCo will choosethe probing interval τm such that the MMEs incur minimaloverhead and interference to data transmissions. Particularly,in cases when PLC channels are very dynamic, probingfrequency 1
τmwill always be less than some threshold (which
can be chosen according to the temporal dynamics of the linksin its network V-C). Note that the CCo does not always needto probe for the tone maps of all the links. This is because CComonitors the traffic over its network, and therefore, it can havetonemaps information of some links in advance. Note that SSwill not be performed during the exchange of MMEs.
After processing the tonemaps, CCo will distribute its SSdecisions to the nodes in its network, such that each nodereceives SS allocation information with every other node withwhich it can form a possible link. The whole process of
beta2 3 4 5 6 7 8
% T
hro
ug
hp
ut
imp
rove
men
t
0
5
10
15
20
25 Deployment 1Deployment 2Deployment 3Deployment 4Deployment 5Deployment 6Deployment 7
(a) Throughput improvement.
beta2 4 6 8
% T
hro
ug
hp
ut
chan
ge
-40
-20
0
20
40
60
80
100
120Link 1-2Link 1-3Link 1-4Link 2-1Link 2-3Link 2-4Link 3-1Link 3-2Link 3-4Link 4-1Link 4-2Link 4-3
(b) Per link throughput change (fig.8).
beta2 3 4 5 6 7 8
Cha
nge
in J
ain'
s F
airn
ess
Inde
x
-0.05
0
0.05
0.1
0.15
0.2
0.25 Deployment 1Deployment 2Deployment 3Deployment 4Deployment 5Deployment 6Deployment 7
(c) Jain’s Fairness Index variation.
beta2 3 4 5 6 7 8
Ch
ang
e in
FS
SE
Ind
ex
# 10-3
0
5
10
15
Deployment 1Deployment 2Deployment 3Deployment 4Deployment 5Deployment 6Deployment 7
(d) Fairness in spectrum (FSSE) variation.
Fig. 9: Spectrum Sharing throughput and fairness performance for seven 4-node PLC deployments in test environment
probing and distribution of decisions will require CCo to send2 × (N − 1)2 messages of varying lengths every τm seconds,where N = number of nodes in the network including the CCo.At the end of this step, each node in the network will knowwhich part of the spectrum to use during SS if they establish aP-Link towards any other node in the network. Moreover, eachnode will know its rank among the top M candidate secondarynodes corresponding to each possible P-Link in the PLC-Net.
2: Medium access during SS. Current HPAV MAC iscentrally controlled through beacon signals from CCo. CCobroadcasts robust and reliable beacons, to establish BeaconPeriods (BPs) consisting of TDMA and CSMA slots. Here, wefocus on the CSMA slots only. Note that in case of TDMA,the CCo can simply schedule the P-Link and one of the topM-best performing S-Links to operate in the same slot.
As we mentioned before, even with SS enabled, all nodesin a PLC-Net will always be in contention for the whole spec-trum, globally throughout the network. However, the mediumaccess and the consequent link interactions during SS willdiffer from the regular HPAV CSMA/CA as following:
(i) After a P-Link is established, the remaining nodes willgo into their backoff stages, following global CSMA/CAprocedure. However, for SS, the primary node will also enablethe Multicast Flag (MCF) in the Start-of-Frame Control (SOF)field of its MAC Protocol Data Unit (MPDU) [25], so thatall remaining nodes in the network can extract the sourceand destination IDs of the P-Link from this SOF delimiterfield. From then onwards, nodes of the established P-Link willnegotiate with each other, to use only the unshared subcarriersfor transmission, while disabling the shared subcarriers.
(ii) After knowing the link information from SOF delimiterin P-Link’s broadcast MPDU frame, nodes of the correspond-ing top M-best S-Links will disable the subcarriers being usedby their P-Link. These candidate S-Links will then wait forshort intervals, proportional to the ascending order of theirranks, to let the better links to operate first. After establishmentof the first S-Link, all M S-Links will go into CSMA/CAcontention over the shared spectrum. This contention will onlybe applicable during SS and will be managed independentlyfrom the global contention for the whole spectrum.
(iii) If the backoff counter (corresponding to the globalCSMA/CA procedure) of any node expires, it will try transmit-ting across the whole spectrum, to initiate its own P-Link. Ifthat node belongs to one of the active M-best S-Links, it willstop its previous transmission and re-enable all the subcarriers
before trying transmission across the whole spectrum.(iv) Nodes belonging to any active P-Link will come out
of their SS state (i.e. re-enable all subcarriers and enter intoglobal contention for the whole spectrum) if they hear anattempted transmission in the unshared part of the spectrum,or, if the transmission between them is finished. As soon astransmission over P-Link ends, the S-Links corresponding tothat P-Link will stop sensing transmission in the unshared partof the spectrum, and immediately come out of their SS state.
(v) The aforementioned process (i)-(iv) repeats for everynew P-Link in the PLC-Net.
3. Periodic re-evaluation of full spectrum: All nodes inthe network will periodically decide to disable SS and transmitacross full spectrum. No S-Link will operate in this case. Thefrequency of this periodic behavior can be either chosen byeach node independently or by CCo of the network, based onlocal or global temporal dynamics V-C). Such periodic useof the whole spectrum will allow each node to automaticallyupdate its full spectrum tonemaps towards other nodes inthe network, during regular data transmissions. The networkCCo will then re-evaluate the SS decisions in its network byaccessing these tonemaps as described before.
Note that SS strategy also applies to the preambles of HPAVframes exchanged between the nodes (i.e. the preambles ex-changed between nodes of the established links are transmittedonly over the allocated spectrum). However, SS will not beperformed during the establishment of a P-Link.
C. EvaluationWe perform trace driven simulations using the traces col-
lected from seven different 4-node PLC deployments (Figure 8represents Deployment#1). Our simulation does not take intoaccount frame aggregation procedures, bit loading of ethernetframes inside PLC frames, management messages and channelerrors, since these parameters are proprietary vendor-specificimplementation information. In our simulations, we choosecollision duration Tc = 2920.64µs, duration of successfultransmission Ts = 2542.64µs and frame length Fl = 2050 [12],[29]. The contention window (CW) and deferral counter (DC)values used for each HPAV CSMA/CA back off stage are[8, 16, 32, 64] and [0, 1, 3, 15], respectively.
Throughput gains. We calculate the normalized throughputT hr for each link m → n in our simulation as follows:
T hr = 100 · [∑[#SuccessTransmissions]
i=1 SFi ] · [Frame length]Total simulation time
SFi represents the fraction of spectrum utilized at i-th trans-mission. SFi =
∑Nj=1[Tm→n]/9170, such that max(SFi ) = 1 and
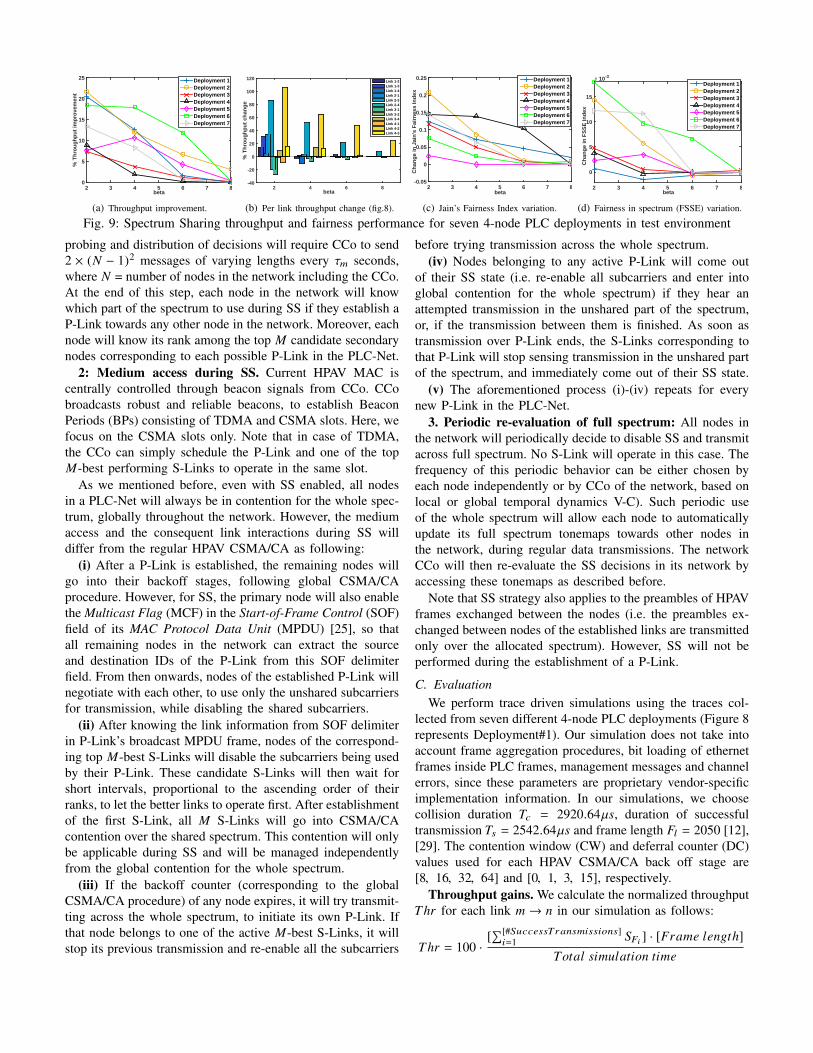
min(SFi ) = 0, where Tm→n are tonemaps of the link m → n.Figure 9(a) shows the effect of varying SS parameter β on
the overall network throughput (percentage increase) for sevendifferent deployments. We observe an improvement in overallthroughput for all seven deployments. Moreover, we observethat the throughput gains increase when β decreases, becausesmaller β allows for more low-performance subcarriers to beassigned to S-Links. Figure 9(b) shows the per-link percent-age throughput improvement for the example mentioned inFigure 8 (Deployment#1). We observe that the normalizedthroughput of 7 out of 12 links is increased for β = 2. However,we also observe a decrease in throughputs of the remaininglinks, since those links share more spectrum as comparedto others. Links such as 2-3, 4-2 and 4-3 experience highergains as compared to others. This is because whenever thespectrum is shared with these links, it happens to be in thepart of spectrum of these links, where modulation index ishigh. In this example, the highest aggregated percentage Thrgains exceeded 20% (blue line in Figure 9(a)), while per-linkthroughput gains were as high as 104% (Link 4-2, Figure 9(b)).
Improvement in fairness. We evaluate the fairness of ourspectrum sharing strategy, by calculating Jain’s fairness index(JFI) [30] and Fairly Shared Spectrum Efficiency (FSSE) [31]for the above mentioned deployments. An allocation strategyis maximally fair if all nodes in a PLC-Net allocate the samethroughput, in which case JFI = 1. On the other hand, FSSEof a PLC-Net gives the spectrum efficiency of the PLC nodewith minimum throughput in the network. In case of maximumspectrum fairness, FSSE is equal to the spectrum efficiency ofthe whole network [31].
Figures 9(c) and 9(d) show the difference in fairness be-tween SS-enabled and SS-disabled for JFI and FSSE, forthe seven PLC-Net deployments we tested. Interestingly, weobserve that SS leads to an increase of both JFI and FSSEindexes. Furthermore, fairness decreases as we increase β(and vice versa). These results show that spectrum sharing inPLCs can not only increase the overall throughput, but also thefairness in throughput and spectrum allocation for PLC-Nets.
VIII. CONCLUSIONSPLC technology has the potential to improve connectivity
and allow for new applications in enterprise settings at lowcost, without any need for dedicated network cabling. In thispaper, we first conduct a measurement study using HomePlugAV testbeds, to explore PLC performance in large buildingssuch as enterprises. Our results uncover the impact of thepower distribution network components (such as breakers,distribution lines, AC phases) and electrical interference onPLC performance, in spatial, temporal and spectral dimen-sions. The key insight gained is that careful topology planningwith multiple PLC gateway nodes per distribution line androuting are important requirements for robust connectivity inPLC networks. Furthermore, fine-grained spectrum sharing(which is not supported by existing PLCs) can significantlyboost performance of PLC-Nets, both in terms of increased
aggregated throughput as well as fairness. We expect that ourstudy will stimulate more community effort on bringing PLCsto large buildings (e.g. enterprises, university campuses, etc.).
REFERENCES
[1] Homeplug technology gains momentum. Inhttp://www.businesswire.com, 2013.
[2] Homeplug av whitepaper. http://www.homeplug.org/tech-resources/resources/, 2007.
[3] Homeplug av2 whitepaper. http://www.homeplug.org/tech-resources/resources/, 2011.
[4] Pat Pannuto and Prabal Dutta. Exploring powerline networking for thesmart building. In Ann Arbor 1001: 48109, 2011.
[5] Christina Vlachou et al. Electri-fi your data: Measuring and combiningpower-line communications with wifi. In Proc. of ACM InternetMeasurement Conf. , number EPFL-CONF-211905, 2015.
[6] Ahmed Osama Fathy Atya et al. Bolt: Realizing high throughput powerline communication networks. In Proc. of ACM CoNEXT, 2015.
[7] Rohan Murty et al. Characterizing the end-to-end performance of indoorpowerline networks. Harvard University Microsoft Research, 2008.
[8] Clausen et al. Optimized link state routing protocol (olsr). In RFC 3626,2003.
[9] Richard Nizigiyimana et al. Characterization and modeling breakerseffect on power line communications. In IEEE Int. Symp. on PowerLine Communications and Its Applications, 2014.
[10] Shinji Tsuzuki, Utsunomiya Hiroaki, and Yamada Yoshio. One wire plcsystem for inter-floor connectivity. In IEEE Int. Symp. on Power LineCommunications and its Applications, 2014.
[11] Ogawa et al. A study on application of power line communicationto lan in building. In IEEJ Transactions on Electrical and ElectronicEngineering, 2008.
[12] Christina Vlachou et al. On the mac for power-line communications:Modeling assumptions and performance tradeoffs. In IEEE Int. Conf.on Network Protocols (ICNP). IEEE, 2014.
[13] Christina Vlachou et al. Fairness of mac protocols: Ieee 1901 vs. 802.11.In IEEE Int. Symp. on Power Line Communications and Its Applications.IEEE, 2013.
[14] Mauro Biagi et al. Location assisted routing techniques for powerline communication in smart grids. In IEEE Int. Conf. on Smart GridCommunications, 2010.
[15] Mauro Biagi et al. Neighborhood-knowledge based geo-routing in plc.In IEEE Int. Symp. on Power Line Communications and Its Applications,2012.
[16] Kaveh Razazian et al. Enhanced 6lowpan ad hoc routing for g3-plc. InIEEE Int. Symp. on Power Line Communications and Its Applications,2013.
[17] Ieee standard for broadband over power line networks: Medium accesscontrol and physical layer specifications. In IEEE Std. 1901, 2010.
[18] Matthias Gtz, Rapp Manuel, and Dostert Klaus. Power line channelcharacteristics and their effect on communication system design. IEEECommunications Magazine, 2004.
[19] Holger Philipps. Modelling of powerline communication channels. InProc. of Int. Symp. on Power-Line Communications and its Applications,1999.
[20] Manfred Zimmermann and Dostert Klaus. Analysis and modelingof impulsive noise in broad-band powerline communications. IEEETransactions on Electromagnetic Compatibility, (1), 2002.
[21] Manfred Zimmermann and Dostert Klaus. A multipath model for thepowerline channel. IEEE Transactions on Communications, (4), 2002.
[22] D. Chariag et al. Channel modeling and periodic impulsive noiseanalysis in indoor power line. In IEEE Int. Symp. on Power LineCommunications and Its Applications. IEEE, 2011.
[23] Luca Di Bert et al. On noise modeling for power line communications.In IEEE Int. Symp. on Power Line Communications and Its Applications.IEEE, 2011.
[24] Hasan Basri elebi. Noise and multipath characteristics of power linecommunication channels. PhD thesis, University of South Florida, 2010.
[25] Latchman et al. Homeplug AV and IEEE 1901: A Handbook for PLCDesigners and Users. John Wiley & Sons, 2013.
[26] Manfred Zimmermann and Dostert Klaus. An analysis of the broadbandnoise scenario in powerline networks. In Int. Symp. on PowerlineCommunications and its Applications, 2000.
[27] Olsr routing protocol. In http://www.olsr.org.

[28] Olsr with link cost extensions. In http://sourceforge.net/projects/olsr-lc/.[29] Christina Vlachou et al. Analyzing and boosting the performance of
power-line communication networks. In Proc. of ACM Int. on Conf. onemerging Networking Experiments and Technologies. ACM, 2014.
[30] Raj Jain and et al.. A quantitative measure of fairness and discriminationfor resource allocation in shared computer system. Eastern ResearchLaboratory, MA, 1984.
[31] Magnus Eriksson. Dynamic single frequency networks. Selected Areasin Communications, IEEE Journal on, 2001.