Embed Size (px)
Citation preview

Towards Effective Masquerade Attack Detection
Malek Ben Salem
Submitted in partial fulfillment of the
requirements for the degree
of Doctor of Philosophy
in the Graduate School of Arts and Sciences
COLUMBIA UNIVERSITY
2012

c©2012
Malek Ben Salem
All Rights Reserved

ABSTRACT
Towards Effective Masquerade Attack Detection
Malek Ben Salem
Data theft has been the main goal of the cybercrime community for many years, and
more and more so as the cybercrime community gets more motivated by financial gain
establishing a thriving underground economy. Masquerade attacks are a common security
problem that is a consequence of identity theft and that is generally motivated by data theft.
Such attacks are characterized by a system user illegitimately posing as another legitimate
user.
Prevention-focused solutions such as access control solutions and Data Loss Prevention
tools have failed in preventing these attacks, making detection not a mere desideratum, but
rather a necessity. Detecting masqueraders, however, is very hard. Prior work has focused
on user command modeling to identify abnormal behavior indicative of impersonation.
These approaches suffered from high miss and false positive rates. None of these approaches
could be packaged into an easily-deployable, privacy-preserving, and effective masquerade
attack detector.
In this thesis, I present a machine learning-based technique using a set of novel features
that aim to reveal user intent. I hypothesize that each individual user knows his or her own
file system well enough to search in a limited, targeted, and unique fashion in order to find
information germane to their current task. Masqueraders, on the other hand, are not likely
to know the file system and layout of another user’s desktop, and would likely search more
extensively and broadly in a manner that is different from that of the victim user being
impersonated. Based on this assumption, I model a user’s search behavior and monitor
deviations from it that could indicate fraudulent behavior. I identify user search events
using a taxonomy of Windows applications, DLLs, and user commands. The taxonomy
abstracts the user commands and actions and enriches them with contextual information.

Experimental results show that modeling search behavior reliably detects all simulated
masquerade activity with a very low false positive rate of 1.12%, far better than any previ-
ously published results. The limited set of features used for search behavior modeling also
results in considerable performance gains over the same modeling techniques that use larger
sets of features, both during sensor training and deployment.
While an anomaly- or profiling-based detection approach, such as the one used in the
user search profiling sensor, has the advantage of detecting unknown attacks and fraudulent
masquerade behaviors, it suffers from a relatively high number of false positives and remains
potentially vulnerable to mimicry attacks. To further improve the accuracy of the user
search profiling approach, I supplement it with a trap-based detection approach. I monitor
user actions directed at decoy documents embedded in the user’s local file system. The
decoy documents, which contain enticing information to the attacker, are known to the
legitimate user of the system, and therefore should not be touched by him or her. Access
to these decoy files, therefore, should highly suggest the presence of a masquerader. A
decoy document access sensor detects any action that requires loading the decoy document
into memory such as reading the document, copying it, or zipping it. I conducted human
subject studies to investigate the deployment-related properties of decoy documents and to
determine how decoys should be strategically deployed in a file system in order to maximize
their masquerade detection ability. Our user study results show that effective deployment
of decoys allows for the detection of all masquerade activity within ten minutes of its onset
at most.
I use the decoy access sensor as an oracle for the user search profiling sensor. If abnormal
search behavior is detected, I hypothesize that suspicious activity is taking place and validate
the hypothesis by checking for accesses to decoy documents. Combining the two sensors
and detection techniques reduces the false positive rate to 0.77%, and hardens the sensor
against mimicry attacks. The overall sensor has very limited resource requirements (40 KB)
and does not introduce any noticeable delay to the user when performing its monitoring
actions.
Finally, I seek to expand the search behavior profiling technique to detect, not only
malicious masqueraders, but any other system users. I propose a diversified and personalized

user behavior profiling approach to improve the accuracy of user behavior models. The
ultimate goal is to augment existing computer security features such as passwords with user
behavior models, as behavior information is not readily available to be stolen and its use
could substantially raise the bar for malefactors seeking to perpetrate masquerade attacks.

Table of Contents
1 Introduction 1
1.1 Definitions . . . . . . . . . . . . . . . . . . . . . . . . . . . . . . . . . . . . . 4
1.2 Objectives . . . . . . . . . . . . . . . . . . . . . . . . . . . . . . . . . . . . . 5
1.3 Hypotheses . . . . . . . . . . . . . . . . . . . . . . . . . . . . . . . . . . . . 6
1.4 Threat Model . . . . . . . . . . . . . . . . . . . . . . . . . . . . . . . . . . . 7
1.5 Contributions . . . . . . . . . . . . . . . . . . . . . . . . . . . . . . . . . . . 8
1.5.1 Scientific Contributions . . . . . . . . . . . . . . . . . . . . . . . . . 8
1.5.2 Technical Contributions . . . . . . . . . . . . . . . . . . . . . . . . . 10
1.6 Thesis Outline . . . . . . . . . . . . . . . . . . . . . . . . . . . . . . . . . . 10
2 Related Work 13
2.1 Masquerade and Insider Attack Detection . . . . . . . . . . . . . . . . . . . 13
2.1.1 Host-based User Profiling . . . . . . . . . . . . . . . . . . . . . . . . 14
2.1.2 Network-Based User Profiling . . . . . . . . . . . . . . . . . . . . . . 24
2.1.3 Honeypots and Deception Techniques . . . . . . . . . . . . . . . . . 25
2.1.4 Integrated Approaches . . . . . . . . . . . . . . . . . . . . . . . . . . 27
2.1.5 Search Behavior Profiling . . . . . . . . . . . . . . . . . . . . . . . . 27
2.2 Redundancy and Diversity in Security . . . . . . . . . . . . . . . . . . . . . 27
2.3 Feature Selection . . . . . . . . . . . . . . . . . . . . . . . . . . . . . . . . . 29
2.4 Inductive Multi-task Learning . . . . . . . . . . . . . . . . . . . . . . . . . . 30
2.5 Dealing with Mimicry Attacks . . . . . . . . . . . . . . . . . . . . . . . . . . 31
2.6 Tamper-Resistant Software Techniques . . . . . . . . . . . . . . . . . . . . . 32
i

3 User Search Behavior Profiling 35
3.1 User Profiling Approach . . . . . . . . . . . . . . . . . . . . . . . . . . . . . 37
3.1.1 User Command and Application Taxonomy . . . . . . . . . . . . . . 38
3.1.2 One-Class Support Vector Machines . . . . . . . . . . . . . . . . . . 40
3.1.3 RUU Dataset . . . . . . . . . . . . . . . . . . . . . . . . . . . . . . . 41
3.2 User Study Methodology . . . . . . . . . . . . . . . . . . . . . . . . . . . . . 41
3.2.1 Experimental Variables . . . . . . . . . . . . . . . . . . . . . . . . . 42
3.2.2 Scenario Narratives and Control Groups . . . . . . . . . . . . . . . . 43
3.2.3 Sampling Procedures for Higher Experiment Sensitivity . . . . . . . 47
3.2.4 Reducing Confounds and Bias . . . . . . . . . . . . . . . . . . . . . . 48
3.2.5 Power Analysis and Sample Size Estimation . . . . . . . . . . . . . . 49
3.3 Data Collection . . . . . . . . . . . . . . . . . . . . . . . . . . . . . . . . . . 51
3.3.1 Host Sensor . . . . . . . . . . . . . . . . . . . . . . . . . . . . . . . . 51
3.3.2 Required Sample Size . . . . . . . . . . . . . . . . . . . . . . . . . . 51
3.3.3 Collecting Normal User Data . . . . . . . . . . . . . . . . . . . . . . 52
3.3.4 Collecting Simulated Masquerader Data . . . . . . . . . . . . . . . . 52
3.4 User Study Experiment . . . . . . . . . . . . . . . . . . . . . . . . . . . . . 53
3.5 RUU Experiment . . . . . . . . . . . . . . . . . . . . . . . . . . . . . . . . . 57
3.5.1 Modeling . . . . . . . . . . . . . . . . . . . . . . . . . . . . . . . . . 57
3.5.2 Experimental Methodology . . . . . . . . . . . . . . . . . . . . . . . 59
3.5.3 Detection Accuracy Evaluation . . . . . . . . . . . . . . . . . . . . . 59
3.6 Schonlau Data Experiment . . . . . . . . . . . . . . . . . . . . . . . . . . . 63
3.7 Performance Evaluation . . . . . . . . . . . . . . . . . . . . . . . . . . . . . 65
3.7.1 Computational Complexity . . . . . . . . . . . . . . . . . . . . . . . 65
3.7.2 Performance Results . . . . . . . . . . . . . . . . . . . . . . . . . . . 67
3.8 Conclusion . . . . . . . . . . . . . . . . . . . . . . . . . . . . . . . . . . . . 67
3.8.1 Chapter Summary . . . . . . . . . . . . . . . . . . . . . . . . . . . . 67
3.8.2 Future Research . . . . . . . . . . . . . . . . . . . . . . . . . . . . . 69
4 Evaluation of Decoy Document Properties 71
4.1 Trap-based Masquerader Detection Approach . . . . . . . . . . . . . . . . . 73
ii

4.1.1 Trap-based Decoys . . . . . . . . . . . . . . . . . . . . . . . . . . . . 73
4.1.2 Decoy Documents Access Sensor . . . . . . . . . . . . . . . . . . . . 74
4.2 Human Subject Study 1 . . . . . . . . . . . . . . . . . . . . . . . . . . . . . 75
4.2.1 Experiment Design . . . . . . . . . . . . . . . . . . . . . . . . . . . . 75
4.2.2 Experiment Findings . . . . . . . . . . . . . . . . . . . . . . . . . . . 76
4.3 User Study 2 . . . . . . . . . . . . . . . . . . . . . . . . . . . . . . . . . . . 80
4.3.1 Experiment Design . . . . . . . . . . . . . . . . . . . . . . . . . . . . 80
4.3.2 Experimental Set-Up . . . . . . . . . . . . . . . . . . . . . . . . . . . 80
4.3.3 Experiment Findings . . . . . . . . . . . . . . . . . . . . . . . . . . . 87
4.4 Discussion and Recommendations . . . . . . . . . . . . . . . . . . . . . . . . 93
4.4.1 Recommendation 1 . . . . . . . . . . . . . . . . . . . . . . . . . . . . 95
4.4.2 Recommendation 2 . . . . . . . . . . . . . . . . . . . . . . . . . . . . 95
4.5 Conclusion . . . . . . . . . . . . . . . . . . . . . . . . . . . . . . . . . . . . 96
4.5.1 Chapter Summary . . . . . . . . . . . . . . . . . . . . . . . . . . . . 96
4.5.2 Future Work . . . . . . . . . . . . . . . . . . . . . . . . . . . . . . . 96
5 Diversifying Detection Approaches 97
5.1 Introduction . . . . . . . . . . . . . . . . . . . . . . . . . . . . . . . . . . . . 97
5.2 Motivation and Approach . . . . . . . . . . . . . . . . . . . . . . . . . . . . 100
5.2.1 Detection Approach . . . . . . . . . . . . . . . . . . . . . . . . . . . 100
5.3 Experimental Evaluation . . . . . . . . . . . . . . . . . . . . . . . . . . . . . 103
5.3.1 Dataset . . . . . . . . . . . . . . . . . . . . . . . . . . . . . . . . . . 103
5.3.2 Experimental Setup . . . . . . . . . . . . . . . . . . . . . . . . . . . 104
5.3.3 Detection Accuracy . . . . . . . . . . . . . . . . . . . . . . . . . . . 105
5.4 Defending Against Evasion Attacks . . . . . . . . . . . . . . . . . . . . . . . 106
5.5 Sensor Architecture . . . . . . . . . . . . . . . . . . . . . . . . . . . . . . . . 110
5.5.1 Sensor Monitoring Infrastructure . . . . . . . . . . . . . . . . . . . . 112
5.6 Sensor Operational Costs . . . . . . . . . . . . . . . . . . . . . . . . . . . . 114
5.7 Characteristics of the RUU Sensor . . . . . . . . . . . . . . . . . . . . . . . 116
5.8 Conclusion . . . . . . . . . . . . . . . . . . . . . . . . . . . . . . . . . . . . 117
5.8.1 Chapter Summary . . . . . . . . . . . . . . . . . . . . . . . . . . . . 117
iii

5.8.2 Future Work . . . . . . . . . . . . . . . . . . . . . . . . . . . . . . . 118
6 Personalized Diversified User Models 119
6.1 Modeling Approach . . . . . . . . . . . . . . . . . . . . . . . . . . . . . . . . 120
6.1.1 Feature Vectors . . . . . . . . . . . . . . . . . . . . . . . . . . . . . . 121
6.1.2 Diversified User Behavior Profiling . . . . . . . . . . . . . . . . . . . 121
6.1.3 Personalized User Behavior Profiling . . . . . . . . . . . . . . . . . . 125
6.2 Experimental Setup . . . . . . . . . . . . . . . . . . . . . . . . . . . . . . . 125
6.2.1 Experimental Methodology . . . . . . . . . . . . . . . . . . . . . . . 126
6.3 Experimental Results . . . . . . . . . . . . . . . . . . . . . . . . . . . . . . . 127
6.3.1 Diversified Modeling Results . . . . . . . . . . . . . . . . . . . . . . 127
6.3.2 Personalized Modeling Results . . . . . . . . . . . . . . . . . . . . . 131
6.4 Conclusion . . . . . . . . . . . . . . . . . . . . . . . . . . . . . . . . . . . . 131
6.4.1 Chapter Summary . . . . . . . . . . . . . . . . . . . . . . . . . . . . 131
6.4.2 Future Work . . . . . . . . . . . . . . . . . . . . . . . . . . . . . . . 133
7 Conclusion 135
7.1 Thesis Summary . . . . . . . . . . . . . . . . . . . . . . . . . . . . . . . . . 135
7.2 Contributions . . . . . . . . . . . . . . . . . . . . . . . . . . . . . . . . . . . 138
7.3 Limitations . . . . . . . . . . . . . . . . . . . . . . . . . . . . . . . . . . . . 140
7.4 Future Work . . . . . . . . . . . . . . . . . . . . . . . . . . . . . . . . . . . 141
7.4.1 Immediate Future Work . . . . . . . . . . . . . . . . . . . . . . . . . 141
7.4.2 Long-term Future Work . . . . . . . . . . . . . . . . . . . . . . . . . 142
I Appendices 145
A User Study Scenarios 147
A.1 Malicious Scenario . . . . . . . . . . . . . . . . . . . . . . . . . . . . . . . . 147
A.2 Benign Scenario . . . . . . . . . . . . . . . . . . . . . . . . . . . . . . . . . . 148
A.3 Neutral Scenario . . . . . . . . . . . . . . . . . . . . . . . . . . . . . . . . . 149
B Post-Experiment Questionnaire 151
iv

C Decoy File Placement 157
D IRB Human Subjects Study Description Data Sheet 159
II Bibliography 161
Bibliography 163
Index 177
v

This page is intentionally left blank.
vi

List of Figures
1.1 Malicious Intent and System Knowledge for different Types of Attackers . . 8
3.1 Taxonomy of Windows applications . . . . . . . . . . . . . . . . . . . . . . . 39
3.2 Distribution of File Touches across the three User Study Groups . . . . . . 54
3.3 Distribution of Search-related Actions across the three User Study Groups . 55
3.4 Distribution of the Percentage of File System Navigation User Actions across
the three User Study Groups . . . . . . . . . . . . . . . . . . . . . . . . . . 56
3.5 The personal files accessed by masqueraders . . . . . . . . . . . . . . . . . . 57
3.6 AUC Scores By User for the Search Behavior and Application Frequency-
Based Modeling Approaches using one-class Support Vector Machines . . . 61
3.7 The number of user models with AUC values greater than the value displayed
on the x-axis for the search behavior and the application frequency model-
ing approaches using one-class SVMs. (The upper-left point shows 18 user
models with AUC scores greater than 0.5) . . . . . . . . . . . . . . . . . . . 62
3.8 The Distribution of Commands across Various Categories in the Schonlau
Dataset . . . . . . . . . . . . . . . . . . . . . . . . . . . . . . . . . . . . . . 64
3.9 Taxonomy of Linux and Unix Commands . . . . . . . . . . . . . . . . . . . 65
4.1 HMAC Embedded in the OCP Properties Section of a PDF Document . . . 74
4.2 Distribution of the Number of Decoy Document Accesses by Legitimate Users 78
4.3 Accidental False Positive Decoy Document Accessed by Legitimate Users by
Decoy Location . . . . . . . . . . . . . . . . . . . . . . . . . . . . . . . . . . 79
4.4 Placement of 40 decoy files in Experiment 1 . . . . . . . . . . . . . . . . . . 83
vii

4.5 Placement of 30 decoy files in Experiment 2 . . . . . . . . . . . . . . . . . . 84
4.6 Placement of 20 decoy files in Experiment 3 . . . . . . . . . . . . . . . . . . 85
4.7 Placement of 10 decoy files in Experiment 4 . . . . . . . . . . . . . . . . . . 86
4.8 Distribution of the Number of Decoy Document Accesses . . . . . . . . . . 88
4.9 Distribution of the Number of Decoy Document Accesses by Scenario . . . 89
4.10 Detection Time by User . . . . . . . . . . . . . . . . . . . . . . . . . . . . . 90
4.11 Decoy File First Touches . . . . . . . . . . . . . . . . . . . . . . . . . . . . . 91
4.12 Number of Decoy Document Accesses . . . . . . . . . . . . . . . . . . . . . 92
4.13 Probability of an Attacker Opening a Decoy File . . . . . . . . . . . . . . . 93
4.14 Decoy File Touch Distribution By Search Method . . . . . . . . . . . . . . . 94
5.1 Alert Generation Decision Process . . . . . . . . . . . . . . . . . . . . . . . 104
5.2 AUC Comparison By User Model for the Search Profiling and Integrated
Detection Approaches . . . . . . . . . . . . . . . . . . . . . . . . . . . . . . 107
5.3 False Alert Frequency By Modeling Epoch Length . . . . . . . . . . . . . . 108
5.4 Feature Vectors for User 13 and Masquerade Attackers . . . . . . . . . . . . 111
5.5 Anomaly Space for the Search Profiling and the Combined Approach Classifiers112
5.6 Architecture of the RUU Masquerade Attack Sensor . . . . . . . . . . . . . 113
5.7 Sensor Monitoring Infrastructure . . . . . . . . . . . . . . . . . . . . . . . . 115
6.1 Feature Weights by User Model for α=24 and 10-minute long Epochs Using
the Independent Learning Approach . . . . . . . . . . . . . . . . . . . . . . 128
6.2 Feature Weights for Multi-Task Learning Approach . . . . . . . . . . . . . . 129
6.3 AUC Scores by User Model for the Traditional, Diversified and Multitask
Modeling Approaches . . . . . . . . . . . . . . . . . . . . . . . . . . . . . . 130
6.4 AUC Scores by User Model for the Diversified and Personalized Diversified
Modeling Approaches . . . . . . . . . . . . . . . . . . . . . . . . . . . . . . 132
viii

List of Tables
2.1 Summary of Accuracy Performance of Two-Class Anomaly Detectors Using
the Schonlau Dataset . . . . . . . . . . . . . . . . . . . . . . . . . . . . . . . 19
2.2 Summary of Accuracy Performance of One-Class Anomaly Detectors Using
the Schonlau Dataset . . . . . . . . . . . . . . . . . . . . . . . . . . . . . . . 21
3.1 Comparison between Experimental Variables in all User Study Scenarios . . 46
3.2 Experimental results of ocSVM modeling approaches using search-behavior
related features and application frequency features . . . . . . . . . . . . . . 60
3.3 ocSVM Schonlau Experimental Results . . . . . . . . . . . . . . . . . . . . . 66
3.4 Performance comparison of ocSVM modeling approaches using search behavior-
related features and application frequency features . . . . . . . . . . . . . . 68
4.1 Number of Decoys and Decoy Touches . . . . . . . . . . . . . . . . . . . . . 77
4.2 Total Number of Decoy Alerts by Experiment . . . . . . . . . . . . . . . . . 81
5.1 Experimental Results of the Search Profiling and Integrated Modeling Ap-
proaches using 2-minute Quanta for Feature Vector Extraction . . . . . . . 105
5.2 Experimental Results of the Search Profiling and Integrated Modeling Ap-
proaches using 5-minute Quanta for Feature Vector Extraction . . . . . . . 106
6.1 Features Extracted for Building User Models . . . . . . . . . . . . . . . . . 122
C.1 Decoy Document Placement . . . . . . . . . . . . . . . . . . . . . . . . . . . 158
D.1 Columbia University Human Subjects Study Description Data Sheet . . . . 159
ix

This page is intentionally left blank.
x

Acknowledgments
I would like to start by thanking Prof. Sal Stolfo, my advisor, to whom I am grateful for
his great guidance in research and in life matters. I would also like to thank Prof. Angelos
Keromytis and Prof. Steve Bellovin, members of the Security Group at the Computer
Science department, and members of my PhD committee for their thoughtful insights and
inspiring conversations.
My thanks also go to Dr. Shari-Lawrence Pfleeger and Prof. Tal Malkin, who also served
on my PhD committee, for their valuable feedback and help in shaping the final version of
this dissertation.
I would also like to acknowledge the support provided by Shlomo Hershkop and Brian
Bowen with respect to the host sensor and the Decoy Documents Distribution platform.
Thanks also go to Shen Wang, Vamsi Narla, Sankha Subra Dey, and Vishal Kapoor for
their assistance in the deployment and testing of the host sensors.
This dissertation was made possible through partial support from the IBM Corporation. I
would like to offer my special thanks to Darci Rowe from IBM who supported me in getting
into the PhD program. I also thank Dr. Raminderpal Singh, my mentor at IBM, for his
pieces of advice that were crucial in helping me make some important decisions related to
my PhD studies.
I am grateful to Donald Underwood and Dr. Joseph Caruso who acted as my first mentors
at IBM and who helped me navigate through the long way of graduate school applications.
My thanks go to my officemates and members of the Intrusion Detection Systems lab,
Gabriela Cretu, Yingbo Song, Ang Cui, and Nathaniel Boggs for the thought-provoking
discussions on a variety of topics.
Finally, I am mostly thankful to my sisters, my mother, and to my late father for their
life-long support, encouragement, and unconditional love.
xi

This page is intentionally left blank.
xii

I dedicate this thesis to my mother and to the soul of my father, for
their tireless support and abundant love...
xiii

This page is intentionally left blank.
xiv

CHAPTER 1. INTRODUCTION
Chapter 1
Introduction
According to the 2010 e-crime watch survey [CERT, 2010]1 conducted by the Computer
Emergency Response Team (CERT), 35% of the 523 security executives and law enforcement
officials surveyed experienced unauthorized access and use of their information, systems, and
networks. This type of intrusions, known as a masquerade attacks, was second in the top
five list of electronic crimes perpetrated by outsiders after virus, worms and other malicious
code attacks. Knowing that the authors of the survey report defined an outsider as ‘someone
who has never had authorized access to an organization’s systems or networks’, we know
that the 35% number is just an underestimation of the scale of masquerade attacks, as these
types of attacks may be performed by former employees, service providers, or contractors.
Also, according to the same survey, 31% of insiders who commited electronic crimes used
password crackers or sniffers, 39% compromised an account, while only 35% used their own
account to commit the electronic crime. These numbers are validated by Richardson in the
2008 CSI Computer Crime & Security Survey [Richardson, 2008] and by Randazzo et al. in
their insider threat study of illicit cyber activity in the banking and finance sector [Randazzo
et al., 2005]1. The authors concluded that the most important driver for such attacks is
financial gain.
Masquerade attacks can occur in several different ways. In general terms, a masquerader
1Note that it is very difficult to get representative data from such surveys due to the limited number of
responses. Note also that many cybercrimes go unreported, and that affected organizations usually choose
not to report them due to the expected negative impact on their reputation and image.1

CHAPTER 1. INTRODUCTION
may get access to a legitimate user’s account either by stealing a victim’s credentials through
password sniffing and cracking tools, or through a break-in and installation of a rootkit or
keylogger. In either case, the user’s identity is illegitimately acquired. Another case is
obtaining the credentials through a social engineering attack, or by taking advantage of a
user’s misplaced trust when he or she leaves his or her terminal open and logged in allowing
any nearby co-worker to pose as a masquerader. In the first two cases, the identity thief
must log in with the victim’s credentials and begin issuing commands within the bounds of
one user session, while in the latter the masquerader’s activity could take place at any time
within the user session. Victims range from ordinary individuals to regular employees and
senior company executives, who are the subjects of highly-targeted attacks.
Symantec’s 2010 Internet security threat report highlighted that targeted attacks di-
rected at large enterprises and governmental organizations, as well as small businesses
(SMBs), and individuals, are evolving to be a leading cause of data breaches. The report
indicated that data breaches caused by outsiders ‘resulted in an average of over 260,000
identities exposed per breach, far more than any other cause’. An example of such tar-
geted attacks is Hydraq, the malware that attempts to steal intellectual property from large
corporations [Symantec, 2010]. The 2010 e-crime watch survey [CERT, 2010] also reports
that 22% of the respondents experienced Intellectual Property (IP) theft, and 20% reported
Personally Identifiable Information (PII) theft, showing the extent of data theft attacks.
Traditional perimeter security technologies such as access controls had little effect in pre-
venting masquerade attacks. Passwords can be easily sniffed or cracked by the numerous
password crackers readily available through the web such as L0phtcrack. Biometric solu-
tions, whether using fingerprint, iris, or face recognition, can all be easily defeated [Lane
and Lordan, 2005].
Data Loss Prevention (DLP) tools [Verdasys, 2011; Vontu, 2009; Edge, 2011], which
were designed to prevent data theft as their name suggests, are not effective in preventing
information leakage, which constitutes the objective of most masquerade attacks. Such tools
typically focus on detecting exfiltration rather than all information (mis-)use. Furthermore,
in order for these tools to work, the organization using them has to locate the data that
has to be protected. The 2010 Verizon Data Breach Investigations Report [Baker et al.,2

CHAPTER 1. INTRODUCTION
2010] shows that 90% of the data breaches involved data that the organization did not know
existed on the compromised asset.
Moreover, DLP tools work through simple rules defined by the user. Discovered data
that matches these rules are tagged as confidential. So, these tools are effective only when
the defined rules are accurate and comprehensive. For many types of sensitive data, it is
difficult to define such rules. For example, while it may be easy to implement rules that
discover data containing credit card or social security numbers, it is difficult to capture
information that contains intellectual property using a few simple rules.
The failure of such systems in preventing masquerade attacks attempting to steal in-
formation calls for the use of monitoring, detection, and mitigation technologies in order
to counter masquerade attacks motivated by data theft. According to Verizon’s 2010 Data
Breach report, 70% of data breaches were caused by external agents, i.e. outsiders to the
victim organization. One interesting finding of this report is that discovering the breach
took months in 63% of cases, with 61% of the breaches discovered by a third party. Another
surprising fact is that 85% of the data theft incidents were not the result of highly-difficult
attacks. This further demonstrates the lack of detection mechanisms within the compro-
mised organizations and the need to deploy more monitoring and detection systems. The
report also indicates that most of data breaches result from default, stolen, or weak creden-
tials. Therefore, some mechanisms are needed for distinguishing the legitimate user actions
from actions performed by masqueraders once the user is logged in, and for detecting rel-
atively simple attacks with very low latency, so that the incurred costs to victims can be
limited.
A major consequence of masquerade attacks that are motivated by data theft is Identity
(ID) fraud. The Forbes magazine [Greenberg, 2010] reported that in 2009 alone, 11.2 million
consumers were affected by fraud incidents in USA alone, causing $54 billion in ID fraud
costs.
In this thesis, I propose a sensor that detects masquerade attacks where stealing data is
the objective. The sensor, which is designed for deployment on personal computers, is highly
efficient and effective, and is able to detect such attacks with very low latency, allowing the
victim to react promptly to the attack, by potentially preventing the data theft, limiting its3

CHAPTER 1. INTRODUCTION
scope, quickly tracing the source of the attack, and potentially identifying the malefactor
potentially.
When monitoring systems to mitigate these attacks, one can collect audit data at the
host level, the network level, or both. As the observables at the network level are more
distant from the individual user, attributing a network-level event to a specific user is hard.
This suggests the need for host-based monitoring.
Unfortunately, many of the state-of-the-art defenses against masquerade attacks operate
at the network-layer [GraniteEdge Enterprise Security Platform, 2011; Appliance, 2011;
Lancope, 2011], and therefore severely suffer from the difficulty of attribution of malicious
activity and difficulty to collect evidence that could be used against the attacker. Detectors
that operate at the host level focus on forensics analysis and attribution after an attack has
occurred using techniques such as sophisticated auditing [Verdasys, 2011; PacketMotion,
2011; Oakley, 2011]. They suffer from a high operational cost caused by the amount of
logging needed and from the upfront costs incurred before deployment. As a matter of
fact, these detectors require an extensive amount of expert knowledge in order to specify
the rules and policies to be checked by the detector. An effective light-weight masquerade
attack detector needs to use anomaly detection as a detection mechanism instead.
1.1 Definitions
Before presenting the hypothesis and the threat model taken in this work, I need to define
some key terms:
• A masquerader is an attacker who succeeds in obtaining a legitimate user’s identity
and impersonates another user for illegitimate purposes. Credit card fraudsters are
perhaps the best example of masqueraders. Once a bank customer’s commercial
identity is stolen (e.g. his or her credit card or account information), a masquerader
presents those credentials for the malicious purpose of using the victim’s credit line
to steal money.
• A masquerade attack is a class of attacks, in which a user of a system illegitimately
poses as, or assumes the identity of another legitimate user. Masquerade attacks are4

CHAPTER 1. INTRODUCTION
extremely serious, especially when sensitive information gets stolen that can ruin the
reputation of an enterprise or make it lose its intellectual advantage over competitors.
• A traitor is an insider, i.e. a legitimate user within an organization, who has been
granted access to systems and information resources, but whose actions are counter to
policy, and whose goal is to negatively affect confidentiality, integrity, or availability
of some information asset or system [Maybury et al., 2005]. The traitor uses his or
her legitimate credentials when perpetrating his or her malicious actions
Note that a disgruntled insider employee may act as a traitor and a masquerader after
stealing the identity of a coworker.
1.2 Objectives
My goal in this work is therefore to design and develop a light-weight, privacy-preserving,
host-based anomaly detector, that effectively detects masquerade attacks and collects re-
lated evidence at a low operational cost. Here, I establish a set of objectives that the
masquerade attack detector has to meet in order to enable effective masquerade detection
and detector deployment:
1. Achieve high accuracy: Intrusion Detection Systems (IDS) sensors are typically
tuned to minimize false alerts by being less stringent about what is considered mali-
cious. However, it is extremely important for the masquerade attack sensor to detect
all masquerade attacks. When prevention is not possible, detection becomes impor-
tant, so that vulnerabilities in the system can be remedied, and potential extra steps
can be performed in order to limit the information leakage. It is also desirable to limit
the number of false positives in order to lower the level of annoyance to the legitimate
user.
2. Have low operational costs: A key criteria for any IDS sensor is its operational
cost [Lee et al., 2002]. The sensor should have a low runtime overhead during training,
and especially during detection. Moreover, the sensor should have a small footprint5

CHAPTER 1. INTRODUCTION
and low storage requirements for saving audit data and evidence of masquerade at-
tacks.
3. Detect the onset of a masquerade attack: Most data theft attacks get detected
after the attack has been completed by third parties or by reviewing the logs. Not
only do I aim to perform online detection of these attacks, my goal is also to detect
the onset of the attack, i.e. detect the attack at its very early stages, with very low
latency, only minutes after its beginning.
4. Support user privacy: Anomaly detectors aiming at detecting masquerade attacks
cannot rely on modeling program behavior [Forrest et al., 1996]. Instead, they have to
model user behavior. Privacy, then, emerges as an issue, which has to be addressed.
A sensor that monitors user’s actions and violates user privacy would probably not
be widely adopted. A masquerade attack detector has to be able to build and apply
user models without sharing any data collected about the user. This can be achieved
through one-class modeling techniques, so no data sharing is required.
5. Collect evidence: According to the 2010 e-crime watch survey [CERT, 2010], 35%
of the respondents reported that intrusions were not referred for legal action due to
lack of evidence deemed sufficient to prosecute, while 29% of them stated the inability
to identify the individual(s) committing the intrusion as the reason for not taking any
legal action. A masquerade attack detector becomes more valuable if it can collect
evidence against the attacker, and not just detect the occurrence of an attack, so that
the attack can be referred for legal action, therefore deterring other attackers from
committing the same crime.
1.3 Hypotheses
In this work, I aim to verify the following hypotheses:
6

CHAPTER 1. INTRODUCTION
1. Profiling classes of user activities improves masquerade detection accuracy as it reflects
malicious intent through monitoring of search activities.
2. Profiling classes of user activities lowers the operational costs of the detector.
3. Combining user behavior profiling with baiting improves detection accuracy, enables
the early detection of masquerade attacks, and hardens the masquerade detector
against mimicry attacks.
1.4 Threat Model
Masqueraders impersonate legitimate users after stealing their credentials when they access
a system. When presenting the stolen credentials, the masquerader is then a legitimate
user with the same access rights as the victim user. To that extent, masquerade attacks
represent one type of insider attacks. However, masquerade attacks can be characterized
by the low amount of knowledge the attacker has about the victim’s system and policies
in place. In this work, I focus on outside masqueraders and assume that the attacker has
little knowledge about the single-user system under attack. In particular, I assume that
the attacker does not know the structure of the local file system and whether the system
is baited or not. I do not focus on whether an access by some user is authorized since
I assume that the masquerader does not attempt to escalate the privileges of the stolen
identity, rather the masquerader simply accesses whatever the victim can access.
My objective is to detect data theft attempts performed by masqueraders on single-user
systems. It can also be expanded to detect “need-to-know”policy violations perpetrated by
traitors on multi-user systems. Note that such violations may also be due to an innocent
mistake by a legitimate user.
Masquerade attacks can be characterized by the amount of knowledge a user has about
the system and policies in place as well as by the intent of the user’s actions. Figure 1.1
is a notional figure that shows the relationship between each type of attacker, his or her
knowledge about the attacked system, and the intent of his or her actions.
I assume that the adversary knows that his or her activity on the victim’s system is
monitored. In all cases, I assume that the attacker can access the assets to be protected7

CHAPTER 1. INTRODUCTION
Figure 1.1: Malicious Intent and System Knowledge for different Types of Attackers
from inside the system via trusted access or system compromise. Therefore, I do not focus
on monitoring access attempts to the system. The protected assets could range from PII
information (e.g. customer records and employee personal data), to user credentials, to IP
files, and other sensitive data (e.g. financial records) stored on the target system. I do not
address the case of traitors that have full administrator privileges and full knowledge of the
system in multi-user systems such as file servers.
1.5 Contributions
The contributions of this work include scientific contributions and technical contributions.
1.5.1 Scientific Contributions
• Classes of different user activities on information systems that can be used to accu-
rately model user behavior on these systems and to characterize fraudulent behavior,
such as masquerader behavior.
• A taxonomy of Windows applications and DLLs: The taxonomy elicits the
classes of user activities. It is used to abstract and enrich the meaning of user activities
performed on the host system. This abstraction enables the reduction of features8

CHAPTER 1. INTRODUCTION
used for user behavior profiling, and therefore a significant decrease in computational
complexity.
• A small set of search-related features used for effective masquerade attack detec-
tion: The limited number of these features reduces the amount of sampling required
to collect training data. Reducing the high-dimensional modeling space to a low-
dimensional one allows for the improvement of both accuracy and performance over
prior approaches. I shall use standard machine learning techniques to evaluate the
performance of a system composed of these features. Other work has evaluated alter-
native algorithms. My focus in this work is on the features that are modeled. The
best masquerade attack detection accuracy was achieved using a modern ML algo-
rithm, Support Vector Machines (SVMs). SVM models are easy to update, providing
an efficient deployable host monitoring system. I shall use one-class SVM (ocSVM)
models in this work.
• Real-time monitoring of user search behavior in order to detect the onset of a mas-
querader attack.
• An empirical evaluation and measurement of how effectively these classes of user
activities can be used in modeling distinctive user behavior and detecting fraudulent
behavior.
• A personalized and diversified user behavior profiling approach using the defined
classes of user activities for improved model accuracy and generalizabiliy.
• A Windows dataset [Ben-Salem, b] collected specifically to study the masquer-
ade attack detection problem: Real-world data collection poses an important
challenge in the security field. Insider and masquerader attack data collection poses
even a greater challenge. Very few organizations acknowledge such breaches because
of liability concerns and potential implications on their market value. This caused the
scarcity of real-world datasets that could be used to study insider and masquerader
attacks. Moreover, user studies conducted to collect such data lacked rigor in their de-
sign and execution. The collected dataset consists of normal user data collected from9

CHAPTER 1. INTRODUCTION
a homogeneous user group of 18 individuals as well as simulated masquerader data
from 40 different individuals. The dataset, collected on Windows XP machines, is
the first publicly available dataset for masquerade attack detection since the Schonlau
dataset [Schonlau, 2001], which is rather suitable for the study of author identification
problems, instead of masquerade attacks.
• An integrated approach for masquerade attack detection that combines user
behavior profiling with a baiting approach that makes use of highly-crafted and well-
placed decoy documents to bait attackers. The approach improves detection accuracy
over prior techniques and is less vulnerable to mimicry attacks.
• A set of best practices and recommendations related to the strategic deployment of
decoy documents on local file system for an effective detection of masquerade attacks.
• A prescription for conducting human subject studies applied to a computer
security problems: Following this prescription enables the correct design and execution
of these user studies and increases the power of the experiment and the generalizability
of its results.
1.5.2 Technical Contributions
• A host-sensor that implements the integrated detection approach and collects potential
evidence that could be used to identify the attacker. The sensor monitors a user’s
search activity and accesses to decoy documents with embedded HMAC tags when
loaded in memory. The sensor reliably detects masquerade attacks with a very low
false positive rate, a very low latency, a small minimal footprint, and low operational
costs.
1.6 Thesis Outline
The rest of this thesis is organized as follows:
• I start by reviewing prior work related to the topics addressed in this dissertation
in Chapter 2. The prior work discussed is related to user behavior profiling, the use10

CHAPTER 1. INTRODUCTION
of honeypots and trap-based techniques for intrusion detection, and the application
of diversity in the field. I also discuss work related to mimicry attacks on anomaly
detectors, and review various techniques for feature selection, software-based tamper-
resistance, and inductive multi-task learning.
• A novel user search behavior profiling technique is introduced in Chapter 3, where
I also discuss the masquerade detection accuracy and performance improvements
achieved by this profiling technique.
• In Chapter 4, I evaluate different decoy document properties. I identify and rank
the decoy properties that are most important for masquerade attack detection. I
also demonstrate that decoy documents can be effectively used for masquerade attack
detection without interference with normal user activities.
• Chapter 5 evaluates the impact of diversifying intrusion detection approaches. I ex-
perimentally demonstrate how user search behavior profiling can be combined with
monitoring accesses to decoy documents to form a very accurate masquerade detection
approach. Furthermore, I show that combining the two techniques can be used as a
defense mechanism against mimicry attacks targeting the user behavior profiling sen-
sor. In this chapter, I also present the architecture of the masquerade attack detector,
which implements the search profiling and decoy access monitoring techniques, and
measure its footprint and operational costs.
• Chapter 6 presents an approach for personalizing and diversifying user behavior mod-
els. I show that feature diversity improves the accuracy of user models and reduces
their vulnerability to mimicry attacks.
• The thesis concludes with Chapter 7, where I summarize the contributions of this
work and present directions for future work, both immediate and long-term
11

CHAPTER 1. INTRODUCTION
This page is intentionally left blank.
12

CHAPTER 2. RELATED WORK
Chapter 2
Related Work
In this chapter, I present the literature related to the main areas of this thesis. I start by
discussing various approaches to masquerade and insider threat detection in Section 2.1.
In Section 2.2, I review how the concept of diversity has been applied in the field of in-
formation and system security. I apply the same concept in this work by diversifying
masquerade attack detection techniques and model features for profiling user behavior. I
present various feature selection methods in Section 2.3. In Chapter 6, I apply a novel
inductive-leaning based feature selection method to select the best discriminating features
while customizing the features per user model, therefore diversifying the user models. Var-
ious inductive leaning methods are presented in Section 2.4. In Section 2.5, I present the
types of mimicry attacks against anomaly-based intrusion detection systems, and I discuss
in Chapter 5, how the masquerade attack sensor that is proposed in this dissertation can
be hardened against such attacks. Finally, I conclude the chapter with Section 2.6, by dis-
cussing tamper-resistant software techniques. I show how the masquerade attack detection
sensor is protected from shutdown and tampering by the attacker using a self-monitoring
infrastructure that is integral to the sensor.
2.1 Masquerade and Insider Attack Detection
The insider attack detection research, and particularly the masquerade attack detection
research work is primarily focused on various methods of profiling user actions and the13

CHAPTER 2. RELATED WORK
systems they use. Much of the work reports on studies describing various audit sources
and algorithms to profile users that are tested on simulated masquerade attack data, while
distinguishing between network-level and host-level detection systems. Most of this work
is specific to masquerade attack detection, although some work is reported on trap-based
defenses aimed to the traitor detection problem using honeypots and honeytokens. An
extensive literature exists reporting on approaches that profile user behavior as a means of
detecting insider attacks, and identifying data theft in particular.
There are two main categories of user behavior profiling: (1) profiling based on biomet-
rics such as keystroke dynamics, voice, gait, and speaking rhythm or diction [Gunetti and
Picardi, 2005; Maiorana et al., 2011], and (2) profiling based on user goals in performing
computer commands, where profiling user command sequences is a dominant approach. Be-
havioral biometrics-based profiling approaches have limitations when dealing with changes
in keystroke behavior, for instance, due to a broken arm or hand for example. Similarly,
the user may exhibit different keystroke dynamics in different environments, such as when
using a laptop at a desk or on his or her lap. Other behavioral biometric techniques face
similar challenges.
The user behavior modeling approach presented in this work considers the means of
estimating or inferring the intent of a series of user commands and profiling the users
behavior on that basis and falls within the second category. In this section, I present user
profiling approaches that fall under the same category 1. .
2.1.1 Host-based User Profiling
One approach reported in the literature is to profile users by the commands they issue [Davi-
son and Hirsh, 1998]. In the general case of computer user profiling, the entire audit source
can include information from a variety of sources:
• Command line calls issued by users
• System call monitoring for unusual application use and events
• Database and file access monitoring
1A thorough survey of this work was published in [Ben-Salem et al., 2008].14

CHAPTER 2. RELATED WORK
• Organization policy management rules and compliance logs
The type of analysis used is primarily the modeling of statistical features, such as the
frequency of events, the duration of events, the co-occurrence of multiple events combined
through logical operators, and the sequence or transition of events. However, most of
this work failed to reveal or clarify the user’s intent when issuing commands. The focus
is primarily on accurately detecting change or unusual command sequences. I begin by
presenting the work whose primary focus is command sequence modeling, which can be
classified as either two-class or one-class modeling techniques.
Two-Class Modeling of Unix Shell Commands: Ju and Vardi proposed a hybrid
high-order Markov chain model [Ju and Vardi, 2001] . A Markov chain is a discrete-time
stochastic process. The authors aimed at identifying a ‘signature behavior’ for a particular
user, based on the command sequences that the user executed. In order to overcome the
high-dimensionality that is inherent in high-order Markov chains, they used a ‘mixture
transition distribution’ (MTD) approach to model the transition probabilities from one
command to another. When the test data contains many commands unobserved in the
training data, a Markov model is not usable. Here, a simple independence model with
probabilities estimated from a contingency table of users versus commands may be more
appropriate. The authors used a method that automatically toggled between a Markov
model and an independence model generated from a multinomial random distribution as
needed, depending on whether the test data was ‘usual’ (i.e. previously seen commands),
or ‘unusual’ (i.e. Never-Before-Seen Commands or NBSCs).
Schonlau et al. applied six masquerade detection methods to a dataset of ‘truncated’
UNIX shell commands for 70 users [Schonlau et al., 2001] collected using the UNIX acct
auditing mechanism. Each user had 15,000 commands collected over a period of time
ranging between a few days and several months. 50 users were randomly chosen to serve as
intrusion targets. The other 20 users were used as simulated masqueraders. The first 5000
commands for each of the 50 users were left intact or clean, the next 10,000 commands were
randomly injected with 100-command blocks issued by the 20 masquerade users. When
commands are grouped into blocks of 100 commands each, the block is either ‘clean’, or
‘dirty’ (i.e. all 100 commands were originated by a masquerader) [Schonlau, 2001]. The15

CHAPTER 2. RELATED WORK
complete dataset and more information about it can be found at http://www.schonlau.
net. The objective of their experiments was to accurately detect the ‘dirty’ blocks and
classify them as masquerader blocks. This dataset was widely used by several authors that
investigated different detection methods and has served as the standard benchmark dataset
for this line of research. It is important to note that this dataset does not constitute ground
truth masquerade data, but rather simulates impersonation.
One detection method explored by Schonlau, called ‘uniqueness’ relies on the fact that
half of the commands in the training data are unique (i.e used by one user only), and many
more are unpopular amongst the users (i.e. used only by a few users). The second method
investigated was the Bayes one-step Markov approach. It was based on one-step transitions
from one command to the next. The approach, originally proposed by DuMouchel [Du-
mouchel, 1999], uses a Bayes factor statistic to test the null hypothesis that the observed
one-step command transition probabilities were consistent with the historical transition
matrix. The two hypotheses modeled were the null hypothesis, which assumed that the
observed transitions probabilities stem from the historical transition matrix, and the alter-
native hypothesis which assumed that they were generated from a Dirichlet distribution.
Schonlau et al. also applied a hybrid multi-step Markov method similar to the one intro-
duced by Ju and Vardi [Ju and Vardi, 2001], and a fourth method, called the ‘compression’
method. The latter was based on the premise that test data appended to historical training
data compressed more readily when the test data stemmed from the very same user rather
than from a masquerader. They applied the method to the Schonlau dataset using the
UNIX tool ‘compress’ which implements a modified version of the Lempel-Ziv algorithm.
IPAM (Incremental Probabilistic Action Modeling), was another method applied to the
same dataset. The method is based on one-step command transition probabilities estimated
from the training data, and was first introduced by Davidson and Hirsch to build an adaptive
command line interface [Davison and Hirsh, 1998; Davison and Hirsh, 1997]. The transition
probabilities were continuously updated following an exponential decay scheme with the
arrival of a new command.
Lane and Brodley proposed a sequence-match approach, where upon the arrival of each
new command, a similarity measure between the most 10 recent commands and a user’s16

CHAPTER 2. RELATED WORK
profile is computed [Lane and Brodley, 1997]. A user’s profile consists of all 10-command
sequences that the user has issued in the past. For the Schonlau dataset, the initial user
profiles are therefore made up of 4991 command sequences. The number of matches in a
command-by-command comparison of two command sequences constitutes the similarity
measure. The matches are weighted and adjacent matches are assigned a higher weight.
With each new command, the test sequence of the last 10 commands is therefore scored
against all 4991 command sequences available in the user’s profile. The maximum of all
scores computed is then assigned to the test command sequence. As these scores are noisy,
and since the masquerade data in the Schonlau data comes in blocks of 100 commands, the
last 100 scores are averaged out. The average score is compared to a threshold that varies
by user model. If the score is lower than the threshold, the 100-command block is classified
as a masquerade block.
Maxion and Townsend applied a naıve Bayes classifier, which had been widely used in
text classification tasks, to the same dataset [Maxion and Townsend, 2002]. They provided
a thorough and detailed investigation of classification errors of the classifier in a separate
paper [Maxion and Townsend, 2004], highlighting why some masquerade victims were more
vulnerable than others, and why some masqueraders were more successful than others.
Killourhy and Maxion also investigated a shortcoming of the naıve Bayes classifier when
dealing with NBSCs [Killourhy and Maxion, 2008].
Seo and Cha experimented with combinations of sequence-based SVM kernels including
the K-gram kernel and the string kernel with some success. They managed to increase the
classification accuracy compared to the widely used RBF kernel with relatively high false
positive rates [Seo and Cha, 2007].
Table 2.1 presents the estimated accuracy of the two-class based modeling methods
which are all based on a supervised training methodology whereby data is labeled as ‘self’
or ‘non-self’ (with True Positive rates displayed rather than True Negatives). Performance
is shown to range from 1.3% - 10.4% False Positive rates, with a False Negative rate ranging
from 2.6% to 73.2% (alternatively, True Positive rates from 26.8% to 97.4%). Clearly, these
results are far from ideal.17

CHAPTER 2. RELATED WORK
The Schonlau data used is a mixture of command sequences from different users. The
classifiers produced in these studies essentially identify a specific user from a set of known
users who provided training data. Furthermore, mixing data from multiple users to train
classifiers to detect masqueraders is complicated and fraught with problems. Besides poten-
tial privacy threats, requiring the mixture of data from multiple users requires substantial
retraining of classifiers as users join and leave an organization.
One-Class Modeling of Unix Shell Commands: In a real-world setting, it is prob-
ably more appropriate to use a one-class based anomaly detection training approach. Wang
and Stolfo experimented with one-class based training methods using a naıve Bayes classi-
fier and a Support Vector Machine (SVM) model of user commands to detect masqueraders
[Wang and Stolfo, 2003]. The authors also investigated SVMs using binary features and
frequency-based features. The one-class SVM algorithm using binary features performed
best among four one-class training algorithms. It also performed better than most of the
two-class algorithms listed in Table 2.1, except the two-class multinomial naıve Bayes al-
gorithm with updating. In summary, Wang and Stolfo’s experiment confirmed that, for
masquerade attack detection, one-class training is as effective as two-class training.
Szymanski and Zhang proposed recursively mining the sequence of commands by finding
frequent patterns, encoding them with unique symbols, and rewriting the sequence using
this new coding [Szymanski and Zhang, 2004]. A signature was then generated for each user
using the first 5000 user commands. The process stopped when no new dominant patterns
in the transformed input could be discovered. They used a one-class SVM classifier for
masquerade detection. The authors used an individual intrusion detection approach with
4 features (the number of dominant patterns in levels 1 and 2, and the number of distinct
dominant patterns in levels 1 and 2), as well as a ‘communal’ intrusion detection approach,
where they added new features, such as the number of users sharing each dominant pattern
in a block. Again, the latter approach demands mixing user data and may not be ideal or
easily implemented in a real-world setting.
Dash et al. developed user profiles from command sequences [Dash et al., 2005]. Thir-
teen temporal features were used to check the consistency of patterns of commands within a
given temporal sequence. Probabilities were calculated for movements of commands within18

CHAPTER 2. RELATED WORK
Table 2.1: Summary of Accuracy Performance of Two-Class Anomaly Detectors Using the
Schonlau Dataset
Method True Pos. (%) False Pos. (%)
Uniqueness 39.4 1.4
[Schonlau et al., 2001]
Bayes one-step Markov 69.3 6.7
[Schonlau et al., 2001]
Hybrid multi-step Markov 49.3 3.2
[Schonlau et al., 2001]
Compression 34.2 5.0
[Schonlau et al., 2001]
IPAM 41.1 2.7
[Davison and Hirsh, 1998]
[Davison and Hirsh, 1997; Schonlau et al., 2001]
Sequence Match 26.8 3.7
[Lane and Brodley, 1997; Schonlau et al., 2001]
Naıve Bayes (with updating) 61.5 1.3
[Maxion and Townsend, 2002]
Naıve Bayes (without updating) 66.2 4.6
[Maxion and Townsend, 2002]
SVM with K-gram kernel 89.6 10.4
[Seo and Cha, 2007]
SVM with string kernel 97.4 2.6
[Seo and Cha, 2007]
a sequence in a predefined reordering between commands. The authors achieved a detection
rate of 76%, but did not report a false positive rate.
Coull et al. [Coull et al., 2001] modified the Smith-Waterman local alignment algorithm
and developed the semi-global alignment method, which uses a scoring system that rewards
the alignment of commands in a test segment. The bioinformatics-inspired method, how-19

CHAPTER 2. RELATED WORK
ever, does not necessarily penalize the misalignment of large portions of the signature of the
user. The authors enhanced it and presented a sequence alignment method using a binary
scoring and a signature updating scheme to cope with concept drift [Coull and Szymanski,
2008]. The computational complexity of the sequence alignment algorithm is O(m ∗ n)
where where m is the length of the sequence of audit data gathered from the normal user
and n is the length of the test sequence.
Yung chose experiment with a probabilistic method, called the self-consistent naıve
Bayes classifier [Yung, 2004]. The method is a combination of the naıve Bayes classifier and
the Expectation-Maximization (EM) algorithm. The new classifier is not forced to make
a binary decision for each new block of commands, i.e. a decision whether the block is
a masquerade block or not. Rather, it assigns a score that indicates the probability of a
masquerader block. Moreover, it can change scores of earlier blocks as well as later blocks
of commands.
Oka et al. attempted to capture the dynamic behavior of a user that appears in a
command sequence by correlating not only connected events, but also events that are not
adjacent to each other while appearing within a certain distance (non-connected events).
They developed the layered networks approach based on the Eigen Co-occurrence Matrix
(ECM) [Oka et al., 2004b; Oka et al., 2004a]. The ECM method extracts the causal relation-
ships embedded in sequences of commands, where a co-occurrence means the relationship
between every two commands within an interval of sequences of data. This type of rela-
tionship cannot be represented by frequency histograms nor through n-grams. While this
method provided relatively good accuracy results compared to all other one-class model-
ing techniques, it is computationally intensive. It takes 22.15 seconds to classify a single
command sequence as normal or anomalous.
The disadvantage of the last three methods lies in their lack of scalability due to their
high computational cost. The size of the user profile grows linearly in the former two
and exponentially in the latter with each command used by the user for the first time.
Model training and update time as well as command sequence test time grows accordingly.
Furthermore, such approaches would be even harder to apply in an operational environment,
particularly when using other operating systems such as Windows, where the number of20

CHAPTER 2. RELATED WORK
unique applications, processes, and user actions is orders of magnitude higher than the
number of commands in Unix.
The detection results achieved by the one-class modeling techniques using the Schonlau
dataset are summarized in Table 2.2.
Table 2.2: Summary of Accuracy Performance of One-Class Anomaly Detectors Using the
Schonlau Dataset
Method True Pos. (%) False Pos. (%)
Recursive Data Mining 63 7
[Szymanski and Zhang, 2004]
one-class SVM using binary features 72.7 6.3
[Wang and Stolfo, 2003; Ben-Salem and Stolfo, 2010]
Semi-Global Alignment 75.8 7.7
[Coull et al., 2001]
Sequence Alignment (with Updating) 68.6 1.9
[Coull and Szymanski, 2008]
Eigen Co-occurrence Matrix 72.3 2.5
[Oka et al., 2004b; Oka et al., 2004a]
Naıve Bayes + EM 75.0 1.3
[Yung, 2004]
Other Modeling Techniques and Analyses of Unix Shell Commands: Tan and
Maxion investigated which detector window size would enable the best detection results [Tan
and Maxion, 2001]. They uncovered that the best detector window size was dependent on
the size of the minimal foreign sequence in test data, which is not determinable a priori. A
foreign sequence is one that is not contained in the alphabet set of the training data, but
each of its individual symbols is. A minimal foreign sequence is a foreign sequence that
contains within it no smaller foreign sequences.
It was shown that the Schonlau dataset was not appropriate for the masquerade detec-
tion task. Maxion listed several reasons [Maxion and Townsend, 2004]. First, the data was
gathered over varied periods for different users (from several days to several months), and21

CHAPTER 2. RELATED WORK
the number of login sessions varied by user. Second, the source of data is not clear. One
does not know whether the users perform the same jobs or are widely spread across different
job functions. Moreover, in acct, the audit mechanism used to collect the data, commands
are not logged in the order in which they are typed, but rather when the application ends.
Hence the methods applied that focus on strict sequence analysis may be faulty.
In order to alleviate some of the problems encountered with the Schonlau dataset, Max-
ion applied naıve Bayes classifier to the Greenberg dataset, a user command dataset enriched
with flags and arguments [Maxion, 2003]. He compared the performance of the classifier
on the Greenberg dataset by using enriched commands and truncated commands. The hit
rate achieved using the enriched command data was more than 15% higher than with the
truncated data. However, the false positive rate was approximately 21% higher as well.
Nevertheless, when plotting the ROC curves for both datasets, the one for enriched data
runs above the ROC curve for truncated data, showing that a better detection performance
can be achieved using the user commands enriched with flags and arguments.
As noted, several types of attributes and statistical features can be used for modeling
a user’s actions. Ye et al. studied the attributes of data for intrusion detection [Ye et al.,
2001]. The attributes studied included the occurrence of individual events (audit events,
system calls, user commands), the frequency of individual events (e.g. number of consecutive
password failures), the duration of individual events (CPU time of a command, duration of a
connection), and combinations of events, as well as the frequency histograms or distributions
of multiple events, and the sequence or transition of events. The goal was to find out whether
the frequency property was sufficient for masquerader detection, and if so whether there
was a single event, at a given time, that is sufficient for detecting a masquerader. Five
probabilistic techniques were investigated on system call data: a decision tree, Hotelling’s
T 2 test, the chi-square test, the multivariate test, and the Markov chain. The dataset used
was made up of 250 auditable security-relevant events collected by the Solaris Basic Security
Module (BSM) and 15 simulated intrusions on the background of normal activities. The
investigation confirmed the importance of both the frequency property, and the ordering
property of events.
User Behavior and Program Profiling by Monitoring System Call Activity:22

CHAPTER 2. RELATED WORK
Nguyen et al. investigated whether monitoring system call activity is effective in detect-
ing insider threats [Nguyen et al., 2003]. Their results showed that profiling program system
call activity could be effective in detecting buffer overflow attacks. They also showed that
user file access patterns varied from day to day, and hypothesized that such patterns would
not be effective in insider threat detection. The authors did not evaluate their hypothesis.
Counter to their conjecture, I show that file access volume can be used, in conjunction with
file system search-related features, in building accurate and masquerade classifiers.
User Profiling in Windows Environments: Less research work has been applied
to Windows environments compared to work done for the Unix environment. Much of the
difference lies in the auditing methods available on each platform. Linux apparently has
cleaner auditing mechanisms (acct, BSM, etc.), whereas Windows has a plethora of system
actions that can be captured by various monitoring subsystems.
Shavlik et al. presented a prototype anomaly detection system that created statistical
profiles of users running Windows 2000 [Shavlik and Shavlik, 2004]. Their algorithm mea-
sured more than two-hundred Windows 2000 properties every second, and created about
1500 features from the measurements. The system assigned weights to the 1500 features in
order to accurately characterize the particular behavior of each user. Every user, therefore,
is assigned his or her own set of feature weights as his or her unique signature. Following
training, each second all of the features ‘vote’ as to whether an intrusion has occurred. The
weighted votes ‘for’ and ‘against’ an intrusion were compared, and if there were enough
evidence, an alarm would be raised.
Li and Manikopoulos explored modeling user profiles trained with SVMs using audit
data from a Windows environment gathered over a year [Ling and Manikopoulos, 2004].
They modeled the sequence of windows and processes over time in a manner similar to
what a process sensor would see. They simulated attack data by mixing data between
legitimate user sessions, and reported some success at modeling the user profiles. Their
approach suffered from high false positive rates though.
In most of the approaches surveyed above, either user command data or system calls
data were used. User command data fail to capture window behavior and do not include
commands executed inside a script, whereas system call data are not particularly human-23

CHAPTER 2. RELATED WORK
readable, nor easily attributed to direct user action. On the other hand, process table data
includes window behavior and anything running in a script, and can easily be interpreted
when read by a human. Moreover, window tracing provides information at a level of gran-
ularity somewhere between the levels of a command line and a system call, while most of
the system noise can be filtered out (a formidable challenge when tracing Windows), which
makes it a good candidate for user profiling. This lead Goldring to collect user data con-
sisting of successive window titles with process information (from the process table) for a
group of users over two years [Goldring, 2003]. The combination of data sources allowed
the use of the process tree structure to filter out system noise. However, it complicated the
feature selection task. The proposed system reduced the stream of data to a single feature
vector that consisted of a mixture of different feature types per session. A record was gen-
erated each time a new window was opened including information about the window title,
and all contents in a window title’s bar. Besides that, the window’s process and parent
process IDs were saved. The window titles’ data allowed one to distinguish between the
operating system’s programs such as Control Panel and Find Files, which would not be
distinguishable from inspecting the process table alone. Goldring reported no performance
results, but rather presented a proof-of-concept system.
2.1.2 Network-Based User Profiling
When an insider accesses information that they do not need to know, one may have good
evidence of an insider attack. A system for detecting insiders who violate need-to-know
policies, called ELICIT, was developed by Maloof and Stephens [Maloof and Stephens,
2007]. The focus of their work was on detecting activities, such as searching, browsing,
downloading, and printing, by monitoring the use of sensitive search terms, printing to a
non-local printer, anomalous browsing activity, and retrieving documents outside of one’s
social network. Five malicious insider scenarios were tested, that represented need-to-know
violations. Contextual information about the user identity, past activity, and the activity
of peers in the organization or in a social network were incorporated when building the
models. HTTP, SMB, SMTP, and FTP traffic was collected from within a corporate intranet
network for over 13 months, but no inbound or outbound traffic was gathered. In order to24

CHAPTER 2. RELATED WORK
identify the information deemed outside the scope of an insider’s duties, a social network was
computed for each insider based on the people in their department, whom they e-mailed,
and with whom they worked on projects. A Bayesian network for ranking the insider threats
was developed using 76 detectors. Subject matter experts defined the thresholds for these
detectors, at which an alarm gets set. A single threat score was computed for each user
based on the alerts from these detectors.
Caputo et al. studied differences in user behavior when gathering information for ma-
licious vs. benign purposes [Caputo et al., 2009a]. They conducted experiments in a com-
mercial setting with 50 human subject study participants, and found that malicious users
broke their information gathering activities into more separate sessions than the benign
users, and downloaded large amounts of data indiscriminately.
Identifying specific users from observable network events consumed considerable effort.
Event attribution proved to be a major challenge: 83% of events initially had no attribution,
and 28.6% of them remained un-attributed, even after the use of two off-line methods to
determine the originator of a particular event. The evaluation of the system used scenarios
that were executed over a short period of time, less than one day. However, attacks by
insiders who violate need-to-know policy usually occur over days, months, and even decades,
such as in the case of Robert Hanssen. Therefore, it is important to evaluate the ELICIT
system using other scenarios that occur over longer periods of time.
2.1.3 Honeypots and Deception Techniques
Honeypots are information system resources that are designed to attract malicious users.
Honeypots have been widely deployed in De-Militarized Zones (DMZs) to trap attempts to
penetrate an organization’s network carried out by external attackers. Their typical use is
for early warning and slowing down or stopping automated attacks from external sources,
and for capturing new exploits and gathering information on new threats emerging from
outside the organization.
Spitzner presented several ways to adapt the use of honeypots to the insider attack
detection problem [Spitzner, 2003]. Since insiders probably know what information they
are after, and in many cases, where that information is to be found, and how it could be25

CHAPTER 2. RELATED WORK
accessed, he recommended implanting honeytokens with perceived value in the network or
in the intranet search engine. He defined a honeytoken as ‘information that the user is not
authorized to have or information that is inappropriate’ [Spitzner, 2003]. This information
could then direct the insider to the more advanced honeypot that could be used to discern
whether the insider’s intention was malicious or not, a decision that may be determined by
inspecting the insider’s interaction with the honeypot. In order to reach such interaction
that can be used to gather information, it is important to ensure that the honeypot looks
realistic to the insider.
Decoy files, or ‘honeyfiles’, were further developed by Yuill et al. [Yuill et al., 2004;
Yuill et al., 2006]. The authors created a system that allowed users to select files from the
user space on a network file server, and change them into decoy files. Illegitimate accesses to
the honeyfiles could then be monitored by consulting a record that associated the honeyfile
with the legitimate userid.
Bowen et al. extended the notion of a decoy document system, and developed an auto-
mated system for generating decoy documents [Bowen et al., 2009b; Bowen and Hershkop,
2009]. The system generated files from different templates with various themes, including a
health-related information theme, a financial account theme, and a tax return theme. They
also proposed several decoy properties as general guidelines for the design and deployment
of decoys, such as the decoy’s conspicuousness, believability, enticingness to the adversary,
as well as the decoy’s non-interference with the the defender’s regular activities.
Cohen et al. developed a ‘framework for deception’ [Cohen et al., 2001]. In their
study of deception techniques, they identified factors affecting the nature of deceptions
and listed requirements for the success of any deception operation. They also presented a
cognitive model for higher-level deception. Although they did not conduct any experiments
or user studies, they recommended evaluating the effectiveness of deception techniques
against systems combining both people and computers.
Honeypots and baiting techniques suffer from certain shortcomings. First, the attacker
may not ever use or interact with the honeypot or honeytoken, especially if their identity is
known to or discovered by the insider. Moreover, if an attacker discovers the honeypot or
the bait, he or she can possibly inject bogus or false information to complicate detection.26

CHAPTER 2. RELATED WORK
2.1.4 Integrated Approaches
Among the first integrated systems was the one presented by Maybury et al. [Maybury et
al., 2005]. The integrated system used honeypots, network-level sensors for traffic profiling
to monitor scanning, downloads, and inside connections, and ‘Structured Analysis’, a real-
time and top-down structural analysis tool using the models of insiders and pre-attack
indicators to infer the malicious intent of an insider. Moreover, several data sources were
used in addition to auditing of cyber assets. Physical security logs, such as employee badge
readers, were also integrated to keep track of the location of a user. The program funding
this effort apparently ended prematurely. Insufficient test and evaluations were performed
on an approach that seemed quite promising.
2.1.5 Search Behavior Profiling
Search behavior has been recently studied in the context of web usage mining. Most litera-
ture focused on the behavior of a user after a web search engine returned a list of potentially
sponsored search results, i.e. the focus was on user behavior when browsing and retrieving
the search query results [O’Brien and Keane, 2007; Attenberg et al., 2009]. However, a few
studies investigated user behavior prior to the submission of a search query. Baeza-Yates et
al. analyzed web queries and modeled keywords, query and session lengths, as well as click
and query refinement patterns [Baeza-Yates et al., 2005]. Kamvar and Baluja noted how
the device used to submit a web search query influenced the user’s search behavior [Kamvar
and Baluja, 2006]. They showed that, when using a wireless device, users tended to have
directed search goals with specific URLs and short sessions with a few queries. However,
when using desktops, searchers engaged in undirected exploration.
2.2 Redundancy and Diversity in Security
Diversity is an approach that has been widely used in fault-tolerant and self-healing sys-
tems [Kelly, 1982; Kelly and Avizienis, 1983; Avizienis, 1995]. Kelly and Avizienis advo-
cated n-version programming and claimed that it would improve system robustness if the n
programs were mutually independent. Knight and Leveson, however, showed that design di-27

CHAPTER 2. RELATED WORK
versity had a limited effect on robustness [Knight and Leveson, 1986], as developers tended
to make the same errors in their designs and code. The results of n different approaches
are thus not independent of each other, because students are trained in similar ways with
similar techniques.
Littlewood and Strigini were among the first researchers to apply the concept of diver-
sity to computer security [Littlewood and Strigini, 2004]. Motivated by the application of
models of diversity in system and process design and by the work on formal probability
modeling of reliability and safety [Mitra et al., 2002], the authors studied the roles and
limits of redundancy and diversity in intrusion detection systems. They suggested that
model diversity could be utilized to build anomaly-based IDS systems that could provide
more coverage to intrusion attacks. They argued for a formal mathematical approach to
estimating the effectiveness of both approaches and for a metric for measuring the indepen-
dence of various intrusion detection systems (IDSs) by category of attack rather than by
some average mixture of attacks.
Gashi et al. [Gashi et al., 2009] studied the actual gains in detection rates that could
be obtained through the use of diverse or different off-the-shelf anti-virus engines. They
showed that when using two anti-virus engines only, almost a third of the engine pairs
performed better than the best individual engine.
Tan and Maxion studied the anomaly space of various sequence-based anomaly detec-
tors when presented with a ‘foreign sequence’, i.e. a never-before-seen-sequence of events,
as an anomaly [Tan and Maxion, 2005]. They showed that the anomaly spaces of these
anomaly detectors are highly overlapping, which limited or prevented any potential detec-
tion accuracy gains that could be achieved by combining several anomaly detectors into one
classifier.
Bloomfield and Littlewood argued that that general diversity was not enough. They
advocated the three-legged stool approach, where each approach had to use a a very different
technique and perspective from the others [Bloomfield and Littlewood, 2003].
Despite the increasing recognition of the value of diversity of sensors in intrusion detec-
tion, no experiments have been conducted to measure the effectiveness of the use of detectors
with diverse detection techniques (e.g. behavior profiling and trap-based detection) as ad-28

CHAPTER 2. RELATED WORK
vocated by Bloomfield and Littlewood[Bloomfield and Littlewood, 2003]. Furthermore, this
concept of diversity has not yet been applied to models used in anomaly detectors. I con-
jecture that diversity in user models through the selection of different features for different
users could enable modeling the unique behavior of specific users. Moreover, it could bring
additional performance gains to the sensor.
2.3 Feature Selection
There has been extensive work on feature selection approaches. Feature selection methods
can be categorized in two ways: as filter or as wrapper methods [Kohavi and John, 1997].
The former methods do not take into account the effects of the selected features on the
accuracy performance of the modeling algorithm. The latter overcome this shortcoming by
searching through the space of feature subsets while estimating the accuracy of the modeling
algorithm. This, obviously, comes with a higher computational complexity.
Guyon and Elisseeff surveyed variable and feature selection methods [Guyon and Elis-
seeff, 2003]. Due to the lack of a benchmark between the various feature selection methods,
the authors recommended the use of a linear prediction technique, such as a linear SVM,
when tackling a new problem, and then selecting features using two different methods: a
variable ranking method that uses a correlation coefficient or mutual information, and a
nested subset selection method with multiplicative updates.
Bi et al. proposed an approach for dimensionality reduction using sparse support vector
machines [Bi et al., 2003]. The approach benefits from the variable selection capability
inherent in sparse linear SVM, as well as non-linear induction. The results achieved by this
approach maintained or improved generalizability and outperformed SVMs trained with the
full set of features or the features selected by correlation ranking.
The problem of feature selection or dimensionality reduction is more challenging in an
unsupervised learning setting, as the features discarded could have a negative impact on the
accuracy of the modeling algorithm. Globerson and Tishby proposed extracting approx-
imate sufficient statistics for one variable about another from the co-occurrence matrix.
The method is used for dimensionality reduction in unsupervised learning [Globerson and29

CHAPTER 2. RELATED WORK
Tishby, 2003].
Grafting is an incremental feature selection approach that operates iteratively to opti-
mize a gradient-based heuristic used to select the most likely feature to improve a model’s
accuracy. This gradient descent-based algorithm proposed by Perkins et al. works as an
integral part of the model training or learning, which makes it efficient [Perkins et al., 2003].
It scales linearly with the number of feature vectors and quadratically with the number of
features.
Torkkola presented a feature extraction method that maximizes the non-parametric esti-
mate of mutual information between features and class labels without using any simplifying
assumptions about the densities of the classes [Torkkola, 2003]. This dimensionality reduc-
tion approach falls under the feature transform methods (as opposed to feature selection
methods), and therefore is more computationally intensive. However, the author showed
that it is computationally usable with training datasets with tens of thousands of samples.
Ranking variables for feature selection can be based on different criteria. Rakotoma-
monjy presented some of these criteria using SVMs, showing that the derivative of the weight
vector criterion performed consistently well over all tested datasets [Rakotomamonjy, 2003].
Most feature selection methods are dependent on the target machine. Stoppoiglia et
al. proposed a simple variable ranking approach for feature selection that is intuitive and
independent of the target machine [Stoppiglia et al., 2003]. The filter method works using
the orthogonalization and mutual information between features. It can also be applied to
select computed kernels such as wavelets or radial basis functions.
2.4 Inductive Multi-task Learning
Jebara and Jaakola developed a Maximum Entropy Discrimination (MED) framework to
solve log-sigmoid problems, which they enhanced later to solve SVMs problems, sparse
SVMs, and multi-task SVMs [Jebara and Jaakkola, 2000]. The framework is a generalization
of support vector machines, as it returns a distribution of parameter models P (θ) rather
than a single parameter value θ, where the expected value of the discriminant under this
distribution agrees with the labeling [Jebara, 2004]. These MED solutions can be further30

CHAPTER 2. RELATED WORK
augmented to represent join densities over parameters of several classifiers and feature and
kernel selection configurations, rather than parameters of a single classifier. For example, by
modifying the discriminant with a binary feature selection switch vector s = [s1, s2, ..., sD],
where si ∈ {0, 1}, i ∈ [1..D], and D is the number of features, we can learn the SVM model
while selecting the best discriminating features for the model. The framework provides an
iterative quadratic programming implementation and uses some tight bounds for improved
runtime efficiency.
Jacob and Bach investigated clustered multi-task learning using a convex formula-
tion [Jacob et al., 2004]. They showed that multi-task learning could improve classifier
accuracy when few training points are available. However, their results also showed, that
with large samples of data, the use of the multi-task learning approach would no be longer
useful.
Finally, Baxter argued that the average error of M tasks could potentially decrease
inversely with M [Baxter, 2000], while Ben-David and Schuller presented generalization
guarantees for each individual task for classifiers that are closely related and share a common
structure [Ben-david and Schuller, 2003].
2.5 Dealing with Mimicry Attacks
Tan et al. [Tan et al., 2002] identified two mechanisms for performing mimicry attacks:
1. Contaminating the learning and/or model update process by inserting attack data
into normal user data
2. Intertwining attacks with normal user activity so that the attacks go undetected. This
is also known as an evasion attack.
Wagner and Soto investigated the types of mimicry attacks against host-based intrusion
detection systems [Wagner and Soto, 2002]. They adopted the generally-accepted assump-
tion that the attacker knows how the system works and which IDS algorithm is being used,
as the system’s source code can be easily reverse-engineered. They distinguished six types
of evasion attacks, assuming that the attack consisted in feeding a malicious sequence of
commands or system calls to the IDS:31

CHAPTER 2. RELATED WORK
1. The lip under the radar attack: The attacker avoids causing any change to the ob-
servable behavior of the application, i.e. they do not launch any processes that the
legitimate user would not normally run. They use already running processes only, and
at the same rate as the victim user.
2. The be patient attack: The attacker waits for the time when the malicious sequence
is accepted.
3. The be patient, but make your own luck attack: This is similar to the previous attack,
but forces the application or IDS into a specific execution path in order to speed up
the acceptance of the malicious sequence.
4. The replace system call parameters attack: As its name suggests, this attack consists
in replacing the arguments in a system call in order to achieve a malicious goal.
5. The insert no-ops attack: This attack creates variants of the malicious sequence,
which may be more likely to get accepted.
6. The generate equivalent attacks attack: The authors present a few examples of this
type of attack, such as the substitution of the read() system call with a call to mmap()
followed by a memory access. Another equivalent attack can be achieved by forking
the IDS and splitting the malicious sequence between the two IDS processes.
In this thesis, I propose diversifying user models and combining orthogonal detection
techniques to protect against evasion attacks.
2.6 Tamper-Resistant Software Techniques
A few software-based solutions for verifiable code execution and for code attestation were
proposed. Code attestation is a technique, by which a remote party, the verifier, also known
as the ‘challenger,’ can verify the authenticity of the code running on a particular host, the
‘attestor.’ It is typically implemented through a set of measurements performed on the
attesting host and sent to the verifier. The verifier then validates these measurements and
the state of the system indicated by them.32

CHAPTER 2. RELATED WORK
One among the first tamper-resistant software techniques, Genuinity achieves code at-
testation through the use of a subroutine in the program that calculates the checksum of
the memory space and sends it to the “verifier [Kennell and Jamieson, 2003].” The tech-
nique assumes the existence of a virtually-paged architecture and low-level CPU counters,
making it usable in machines with high-end CPUs only. Seshadri et al. extended Genuinity,
and proposed SWATT, another SoftWare-based ATTestation technique to verify the mem-
ory contents of embedded devices [Seshadri et al., 2004]. Later, Seshadri et al. presented
Pioneer, a software-based protocol to enable verifiable code execution on untrusted legacy
systems which lack secure co-processors and virtualization support [Seshadri et al., 2005].
Although the goal of these solutions is tamper-proofing software, i.e. preventing the
unauthorized use of software, they could presumably be easily modified to detect unautho-
rized attempts to disable or shutdown the software. However, they all require the presence
of a third party which can execute code for verification, on top of their extremely high
computational cost. In this thesis, I use embedded self-monitoring monitors to protect the
proposed detection against tampering attacks.
33

CHAPTER 2. RELATED WORK
This page is intentionally left blank.
34

CHAPTER 3. USER SEARCH BEHAVIOR PROFILING
Chapter 3
User Search Behavior Profiling
A common approach to counter masquerade attacks is to apply machine learning (ML)
algorithms that produce classifiers, which identify suspicious behaviors that are potentially
indicative malfeasance of an impostor. Previous work has focused on auditing and modeling
sequences of user commands including work on enriching command sequences with infor-
mation about arguments of commands [Schonlau et al., 2001; Maxion and Townsend, 2002;
Wang and Stolfo, 2003].
I extend prior work on modeling user command sequences for masquerade detection,
and propose a novel approach to profile a user’s search behavior by auditing search-related
applications and accesses to index files, such as the index file of the Google Desktop Search
application. Prior techniques for masquerade attack detection, as reviewed in Chapter 2,
suffer from low accuracy and/or a high computational cost. This is somewhat expected, as
modeling user behavior in general implies a very high-dimensional feature space. In order
to improve the accuracy of the user models, one needs to identify ways for dimensionality
reduction that apply to all user models.
One possible approach, is to identify specific user behaviors that could be used to classify
user activities as legitimate or fraudulent. By focusing on these specific behaviors, or limited
aspects of user behavior, I was able to reduce the dimensionality of the feature space. Search
behavior is particularly promising to monitor.
I conjecture that a masquerader is unlikely to have the depth of knowledge of the victim’s
machine (files, locations of important directories, available applications, etc.), nor is he or35

CHAPTER 3. USER SEARCH BEHAVIOR PROFILING
she likely to know the victim’s search behavior when the victim uses his or her own system.
This complicates the masquerader’s task to mimic the user. Hence, a masquerader would
likely first engage in information gathering and search activities before initiating any specific
actions. On the other hand, a legitimate user will search within an environment they have
created. For example, he or she would search for a file within a specific directory. A
programmer, for instance, may search for a symbol within a specific source code file. Since
the attacker has little to no knowledge of that environment, that lack of knowledge will be
revealed by the masquerader’s abnormal search behavior.
It is this key assumption that I rely upon in order to detect a masquerader. I do not
focus on whether an access by some user is authorized since I assume that the masquerader
does not attempt to escalate the privileges of the stolen identity. Rather, the masquerader
simply accesses whatever the victim can access. My focus is rather on monitoring a user’s
behavior in real time to determine whether current user actions are consistent with the
user’s historical behavior, primarily focused on his or her unique search behavior.
While it is very difficult to gather ground truth to test my hypothesis, my experiments
aim to provide evidence that monitoring search behavior and information gathering activ-
ities makes a very useful profiling technique to identify impersonators. In this chapter, I
demonstrate that this conjecture is backed up with real user studies. I monitored eighteen
users for four days on average and collected more than 10 GBytes of computer user data,
which I analyzed and modeled. More specifically, I modeled user search behavior in Win-
dows and tested my modeling approach using a dataset collected at Columbia University,
which I claim is more suitable for evaluating masquerade attack detection methods. The
results show that indeed normal users display different search behaviors, and that search
behavior is an effective tool to detect masqueraders.
The contributions of this work include:
• A small set of search-related features used for effective masquerade attack de-
tection: The limited number of features reduces the amount of sampling required
to collect training data. Reducing the high-dimensional modeling space to a low-
dimensional one allows for the improvement of both accuracy and performance.
• A Windows dataset [Ben-Salem, b] collected specifically to study the masquer-36

CHAPTER 3. USER SEARCH BEHAVIOR PROFILING
ade attack detection problem as opposed to the author identification problem:
The dataset consists of normal user data collected from a homogeneous user group
of 18 individuals as well as simulated masquerader data from 40 different individuals.
The dataset is the first publicly available dataset for masquerade attack detection
since the Schonlau dataset [Schonlau, 2001].
The following section expands on the objective and the approach taken in this work. In
Section 3.2, I present the methodology followed while designing and conducting the human
subject studies to validate our modeling and detection approach. Then I describe the
dataset gathered at Columbia University to study masquerade attack detection techniques
in Section 3.3. This dataset is referred to as the RUU dataset. Section 3.4 shows how the
malicious intent of a masquerader, whose objective is to steal information, has a significant
effect on his or her search behavior. In section 3.5, I discuss experiments conducted by
modeling search behavior using the RUU dataset. Section 3.6 presents experiments using
the Schonlau dataset for completeness. Section 3.7 discusses the computational performance
of the proposed modeling and detection approach. Finally, Section 3.8 concludes the chapter
by summarizing our results and contributions, and discussing directions for future work 1.
3.1 User Profiling Approach
When dealing with the masquerader attack detection problem, it is important to remember
that the attacker has already obtained credentials to access a system. When presenting the
stolen credentials, the attacker is then a legitimate user with the same access rights as the
victim user. Ideally, monitoring a user’s actions after being granted access is required in
order to detect such attacks. Furthermore, if we can infer or estimate the user’s intent, we
may be able to predict whether the actions of a user are malicious or not more accurately.
Much of the prior work on modeling users and profiling their behavior was purely syn-
tactic, as there was no discernible means to extract the semantics of user-initiated events,
other than implicitly through a set of pre-defined rules or specifications as in the case of
1Portions of this chapter have been published in [Ben-Salem and Stolfo, 2011c] and [Ben-Salem and
Stolfo, 2011b].37

CHAPTER 3. USER SEARCH BEHAVIOR PROFILING
ELICIT [Maloof and Stephens, 2007]. In this work, I am focused on a specific set of com-
mands and actions issued by users that I posit tease out the user’s intent. For instance,
search should be an interesting behavior to monitor since it indicates that the user lacks in-
formation they are seeking. Although user search behavior has been studied in the context
of web usage mining [Baeza-Yates et al., 2005; O’Brien and Keane, 2007], it has not been
used in the context of intrusion detection.
I propose an approach to profile a user’s behavior, and particularly his or her search
behavior, based on a ‘taxonomy’ of Windows applications, DLLs and user commands. The
taxonomy abstracts the audit data and enriches the meaning of a user’s profile, thus re-
flecting the type of activity that the user is performing on the computer. User commands
and applications that perform similar types of actions are grouped together in one category
making profiled user actions more abstract and meaningful. Commands or user actions are
thus assigned a type or a class, and classes of user activity are modeled rather than individ-
ual user actions. I use the taxonomy to readily identify and model search behavior, which
is manifested through a variety of system-level and application-specific search functions.
In the following subsections, I present the application and command taxonomy that I
have developed for the Windows environment and the machine learning algorithm that I
use for learning user behavior and building individual user models.
3.1.1 User Command and Application Taxonomy
I abstract the set of Windows applications, Dynamic Link Libraries (DLLs), and Microsoft
Disk Operating System (MS-DOS) commands into a taxonomy of application and command
categories as presented in Figure 3.1. In particular, I am interested in identifying the specific
set of commands that reveal the user’s intent to search. Once these commands are identified,
I can extract features representing such behavior while auditing the user’s behavior.
While the focus of this work is on profiling and monitoring a user’s search behavior,
there are other behaviors that are interesting to monitor. For example, remote access
to other systems and the communication or egress of large amounts of data to remote
systems may be an indication of illegal copying or distribution of sensitive information.
Once again, the taxonomy defined allows a system to automatically audit and model a38

CHAPTER 3. USER SEARCH BEHAVIOR PROFILING
whole class of commands and application functions that represent the movement or copying
of data. Similarly the transfer of large amounts of data to a peripheral device such as
a USB drive or a printer is equally interesting to monitor. Another, perhaps more goal-
oriented behavior, is the development of new rootkits or installation of malware, if the
commands deal with compiling and executing files presumably containing code. One could
also monitor the case of changes made to the configuration and settings of security-related
applications such as an anti-virus engine, followed by the installation of new software. These
behaviors are all examples of user activities that could reveal the malicious intent of an
attacker. The taxonomy could be very useful in profiling and detecting such behaviors with
a low operational cost. However, in this thesis, I focus on profiling user search behavior.
Monitoring other user behaviors that could indicate fraudulent masquerade activity will be
the subject of my future work.
Figure 3.1: Taxonomy of Windows applications
The taxonomy includes 22 different categories or classes: Browsing, Communications,
Database Access, Development and Coding, Editing, File Conversion or Compression, File
System Management, Games, Application Installation, Media, Networking, Security, Soft-39

CHAPTER 3. USER SEARCH BEHAVIOR PROFILING
ware Management and Licensing, Web Hosting, Information Gathering, Data Mining and
Modeling, Desktop Configuration, Learning Applications, I/O Peripherals, System Man-
agement, Organization and Project Management, and Other Applications, such as mathe-
matical and scientific applications. The Information Gathering or Search category includes
commands such as find and applications such as Google Desktop Search.
Most categories were further classified into sub-categories. Each group of commands
or class of user activity is further divided into sub-classes. For example, Communications
includes E-mail, Instant Messaging, and Video Chat as subclasses. Similarly, I/O peripherals
includes Printer, Scanner, USB Drive, DVD Drive, etc., while a Networking-activity can be
a File Transfer, a Remote Desktop Access, or a Bluetooth Connection for instance. Certain
categories do not require more granularity, however, such as the Desktop Configuration or
Software Licensing category.
I use one-class support vector machines to learn user search behavior. SVMs achieved
the best accuracy results when applied to the masquerade attack detection problem. SVM
models are easy to update, providing an efficient deployable host monitoring system. Below,
I describe how one-class SVMs work.
3.1.2 One-Class Support Vector Machines
SVMs are linear classifiers used for classification and regression. They are known as maximal
margin classifiers rather than probabilistic classifiers. Scholkopf et al. proposed a way to
adapt SVMs to the one-class classification task [Scholkopf et al., 2001]. The one-class
SVM algorithm uses examples from one class only for training. Just like in multi-class
classification tasks, it maps input data into a high-dimensional feature space using a kernel
function, such as the linear, polynomial, or Radial Basis Function (RBF) kernel. The origin
is treated as the only example from another class. The algorithm then finds the hyper-
plane that provides the maximum margin separating the training data from the origin
in an iterative manner. The kernel function is defined as: k(x, y) = (Φ(x).Φ(y)),where
x, y ∈ X, X is the training dataset, and Φ is the feature mapping to a high-dimensional
space X → F . Note that SVMs are suitable for block-by-block incremental learning. As
user behavior changes and new data is acquired, updating SVM models is straightforward40

CHAPTER 3. USER SEARCH BEHAVIOR PROFILING
and efficient. With each incremental step, prior data may be expunged and the support
vectors computed from that data are retained and used to compute a new update model
using the new data [Vapnik, 1999]. Syed at.al [Syed et al., 1999] have shown that these
preserved support vectors represent a ‘succinct and sufficient set’ for handling concept drift.
Also the use of a one-class modeling approach means that I do not need to define a priori
what masquerader behavior looks like. I model normal user behavior only. I can preserve
the privacy of the user when building user models, as I do not need to intermix data from
multiple user for building models of normal and attacker behavior.
3.1.3 RUU Dataset
As I have noted, most prior masquerade attack detection techniques were tested using the
Schonlau dataset, where ‘intrusions’ are not really intrusions, but rather random excerpts
from other users’ shell histories. Such simulation of intrusions does not allow us to test the
conjecture that the intent of a malicious attacker will be manifested in the attacker’s search
behavior.
In order to address these shortcomings, I gathered user data and simulated masquerader
data by conducting a user study under IRB approval 2. I refer to this data as the RUU
(Are You You?) dataset. To gather this data, a host sensor that could audit user activity
and capture the data of interest was developed. In the following sections, I describe the
user studies designed to collect the RUU dataset and the host sensor used to collect it.
3.2 User Study Methodology
The first step in designing a user study is to state the hypothesis as well as the null hy-
pothesis. The user study is designed to explore the null hypothesis, and may lead to its
rejection. I designed two human subject studies. The goal of the first study is to show that
the intent of a masquerader can be manifested in his or her file system search behavior. The
experimental hypothesis states that if the intent of the masquerader is malicious, then they
2Human subject studies of insider threat and masquerade detection are approved at Columbia University
under Human Subjects protocol IRB-AAAC4240 presented in Appendix D.41

CHAPTER 3. USER SEARCH BEHAVIOR PROFILING
will engage in a significant search activity on the victim’s system. The null hypothesis states
that the manipulation of the masquerader’s intent does not have any significant effect on
the masquerader’s search behavior. In other words, the observed significant effect on search
activity that gets observed during the experiment can be attributed to the manipulation of
the masquerader’s intent, and cannot be the result of pure chance.
3.2.1 Experimental Variables
Stating the experimental hypotheses also requires identifying the experimental variables:
the independent variable, the dependent variable(s), and any confounding variables. The
independent variable is the one variable that gets manipulated by the researcher, while all
others are kept constant. A dependent variable is directly and tightly dependent on the
independent variable. It is an observed behavioral feature to be measured by the researcher
during the experiment.
I hypothesize that user search behavior is a behavioral feature that is impacted by
the user’s intent. If a masquerader is looking to steal information, his or her intent will
be manifested in his or her search behavior through the volume of the search activities
performed by the masquerader. The goal is to confirm this conjecture and to show that
the attacker’s search behavior is different from a normal user’s search behavior, and that
monitoring search behavior could be used for the detection of a masquerader’s attack.
So the masquerader’s intent constitutes the independent variable in our experiment,
and the search behavior of the masquerader (his or her search volume in particular) is a
dependent variable. Confounding variables are usually random variables that could affect
the observed behavioral feature, namely search, such as problems with the experimental
equipment or skill level. These variables are to be minimized or mitigated when designing
the human subject study. I discuss the approach taken to limit the effect of confounding
variables in subsections 3.2.3 and 3.2.4 .
The question then is how can the attacker’s intent be manipulated in this user study?
This is by no means a simple task. However, it can be achieved by crafting different and
detailed scenario narratives that are handed to the participants in the experiment.42

CHAPTER 3. USER SEARCH BEHAVIOR PROFILING
3.2.2 Scenario Narratives and Control Groups
When dealing with human experimental design for cyber-security studies, the scenario nar-
ratives should give the experiment participants detailed background information about the
attack and the attacker’s motives. This enables the participants to play the role of the
attacker described in the experiment, and assume their intent.
I developed a very specific attack scenario that described the masquerader’s motives
and the surrounding conditions of the attack. The masquerade attack scenario had to be:
• Representative of masquerade attacks, i.e. generalizable: When conducting a
cyber-security-related user study, it is very expensive to test all attack variants both in
effort and time. Testing each attack variant requires recruiting an additional number
of human subjects to participate in the experiment. Therefore, it is very important
that the scenario narrative used in the study is descriptive and representative of the
attack under study.
• Conforming to the threat model: Gathering quality data that can be effectively
used for empirically testing the experimental hypothesis requires that the scenario
narrative used in the human subject study accurately reflects the threat model.
• Easily executable in a user study: This means, for instance, that the execution
of the masquerader scenario had to be time-limited. Not specifying a time limit for
the attack adds a lot of uncontrolled variability to the experiments. Furthermore, it
makes the experiments costly both in participant’s and researcher’s time.
• Detailed: The scenario narrative should be as detailed as possible. Answers to
anticipated questions that could be posed by the participants should be included.
Giving the answers to these questions to the participants in advance reduces the needs
for asking such questions, and therefore limits the verbal communication between the
researcher and the study participant. Furthermore, it ensures that all participants
receive the same instructions, therefore minimizing the participant’s bias.
In our masquerade attack scenario, the masquerader gets an opportunity to access a
coworker’s computer during a 15-minute lunch break, while the coworker leaves the office43

CHAPTER 3. USER SEARCH BEHAVIOR PROFILING
and stays logged in to his or her computer. I strove to ensure that the task of the user
study participants was goal-oriented, thus revealing the malicious intent of the attacker.
One may argue that simulating a masquerade attack is not appropriate, and that it
is hard for an innocent student to act as a masquerader. I argue that, if the scenario of
the experiment is well-written, and with very clear instructions, the participants in the
experiment will follow the instructions. To this extent, the reader is referred to the very
well-known Milgram experiment, which shows how subjects generally obey an authority
figure and blindly follow instructions, even when they contradict their own values and
ethics [Milgram, 1974].
Despite Milgram’s findings, I was concerned about the use of role-playing in this ex-
periment. I wanted to ensure the validity of any experiment findings by making sure that
the study participants took the scenarios seriously enough. I followed Caputo et al.’s ap-
proach [Caputo et al., 2009a], and developed a post-study questionnaire, where I asked
participants about their experiences during the experiment. I asked them whether the sce-
nario narrative affected the way in which they performed their task. Eighty per cent of
the malicious masqueraders answered positively, and 70% indicated that they acted very
differently from their normal behavior. One participant indicated that he was extremely
nervous while searching for a colleague’s personal information. Another mentioned that she
felt the urgency to perform the task quickly before her “colleague” showed up. A third
participant indicated that he tried to hide the monitor with his body, so that no one can
see what he was doing. Many cleared the browser’s cache and/or shell command history
in order to cover their activity. These are some of the pieces of evidence showing that the
study participants took their tasks seriously.
Besides the ‘malicious attacker’ scenario, I developed a ‘benign masquerader’ scenario,
and a ‘neutral’ scenario for control purposes. All three scenarios are described below.
Malicious Scenario: The participants in this first scenario were asked to perform a
specific task, which consisted of finding any information that could be used for financial gain
from a coworker’s desktop computer. The participants had access to a coworker’s computer
for 15 minutes while he or she left out for lunch. An attacker can gain access to the
victim’s system in a different way, for instance remotely if they know the access credentials.44

CHAPTER 3. USER SEARCH BEHAVIOR PROFILING
Regardless of the access method, I am interested in the attacker’s behavior after they access
the victim’s computer. The scenario clearly described the financial difficulties that the user
was going through and the personal problems he or she was having with the coworker. In
particular, the malicious user believed that the coworker had been undeservingly promoted
instead of him or her, making any PII information theft or financial damage to his or her
colleague, that they might engage into, justifiable to him or her. The task was goal-specific
in order to capture the intent of the users. The participants in this scenario knew that
all of their actions were being monitored. While they were encouraged to find relevant
information for their task, they were also urged to hide their masquerade activity. It is also
important to mention that they were not specifically asked to search the file system
in the scenario, i.e. some users could decide to look into the computer owner’s e-mail,
which constitutes another approach for information gathering, instead of searching files.
After completing the task, the participants filled a questionnaire about their experience and
behavior during the task, and how different it was from their own normal search behavior.
Most participants indicated that they tried to leave the desktop in the same state that
they accessed it in, including the same list of recently opened documents. Many avoided
using desktop search tools and opted for manually exploring the contents of the file systems
by traversing directories of interest. Some participants also cleared the browser’s cache
and history. Others interleaved search and information gathering actions with normal user
actions that should not raise any suspicions, such as checking a news website.
Benign Scenario: Similar to the previous scenario, the participants in this scenario
acted as employees in a specific organization. While their coworker left out for a 15-minute
lunch break and stayed logged in to his or her computer, their own computer experienced
a hard drive failure. Because they had to finish working on an urgent team project, which
they had to provide an update on during a meeting occurring later in the afternoon, they
did not hesitate to use the coworker’s computer to finish working on the project.
Neutral Scenario: The participants in this scenario too had a coworker leave for 15
minutes to have lunch while staying logged in to his or her desktop computer. However, the
participants in this scenario had no compelling reason to access the coworker’s computer.
They were left to freely choose whether they wanted to access their coworker’s desktop. I ob-45

CHAPTER 3. USER SEARCH BEHAVIOR PROFILING
served the behaviors of the participants, and whether they decided to access the coworker’s
computer. In particular, I observed what they did if they decided to access it. The partic-
ipants had also to describe what they did and explain their decision after completing the
experiment.
These scenarios are the means to manipulate the intent of the attacker. Therefore, I
strove to keep all variables constant including the duration of the experiment, the type of
relationship between the attacker and the victim, etc.. I used each scenario to collect data for
a control group against which I compare the results achieved using the ‘malicious attacker’
scenario. The choice of 15 minutes in all scenarios was driven by research findings from
an insider threat study conducted in an actual commercial setting [Caputo et al., 2009b;
Caputo et al., 2009a]. The researchers studied the differences between malicious and benign
user behaviors and found that malicious users engaged in bursts of frantic behavior that
were shorter than 15 minutes by copying large amounts of text indiscriminately for example.
Table 3.1 summarizes and compares the controlled experimental variables across all
three scenario narratives.
Table 3.1: Comparison between Experimental Variables in all User Study Scenarios
Experimental Variable Value Same/Different
Scope Local File System Same
of Colleague’s Computer
Environmental Constraints IDS Lab Computer Same
Desktop Configuration Same Recent Documents Same
and Applications
Relationship to Victim Coworker Same
Time Constraints 15 minutes Same
Intent Malicious, Benign, or Neutral Different
or Neutral
46

CHAPTER 3. USER SEARCH BEHAVIOR PROFILING
3.2.3 Sampling Procedures for Higher Experiment Sensitivity
In order to increase the sensitivity of our experiment, I must reduce uncontrolled variability.
This in turn requires controlling user bias, which makes up the largest source of error
variance in user study experiments [Keppel, 2004]. In behavioral sciences, there are three
different techniques or sampling procedures used to reduce subject variability and user
bias. The first and preferred technique is the use of the same subject in all ‘treatment
conditions’ of the experiment, that is, in all three scenarios. This procedure cannot be used
in our experiment as it undermines the assumption that masqueraders are not familiar with
the file system under attack. Using the same subjects in different treatment conditions of
the experiment means that they will be exposed to the file system more than once. This
implies that, in the second and third treatment condition or scenario, the subjects have
prior knowledge about the file system, which violates the assumptions made in the threat
model. Recall that the threat model assumes that the masquerade attacker is not familiar
with the victim’s file system.
The second approach, and probably the most obvious approach, is to select a homo-
geneous group of subjects, i.e. subjects with similar characteristics that are relevant to
the experiment, such as their familiarity with the use of computers, their ability to search
for information in a file system, and their acuity or sense of cyber-security. Finally, the
third approach for reducing subject variability is the use of several small subject sets with
characteristics that are highly homogeneous within one set, but widely varying between
sets.
I have chosen the second approach, and selected subjects who were all students at the
Computer Science department of Columbia University, so that they have comparable skills.
This should minimize the variability between subjects with respect to their familiarity with
computer usage, and how to search a desktop in order to steal information, or how to
perform a data theft attack without being detected, which in turn limits the confounds and
bias in the results of this user study.
I was concerned, nonetheless, that there still could be some variety of ages, experience
levels, and access to technology even within this set of participants. In order to evaluate
the extent of this variety, I asked the participants in a post-study questionnaire about their47

CHAPTER 3. USER SEARCH BEHAVIOR PROFILING
familiarity with desktop search tools, with various operating systems, and with Linux shell
commands. Their answers indicated that everyone was very familiar with the use of desktop
search tools, although experience levels with user shell commands varied: Two participants,
out of sixty, rarely used shell commands for search. I estimated that this lack of familiarity
with shell commands would not significantly affect our results, as our experiments were
conducted on a Windows system, and not on a Linux/Unix system, where typically certain
shell commands are used for information gathering.
3.2.4 Reducing Confounds and Bias
Besides reducing subject variability, I strove to reduce the experimental treatment vari-
ability by presenting each user study participant with the same experiment conditions. In
particular, I used the same desktop and file system in all experiments. I also ensured that
the desktop accessed by the subjects looked the same to each participant. In particular, I
cleaned up the list of recently accessed documents, and opened Microsoft Office documents
before the beginning of each experiment, and automated the data collection and uploading
to a file server, so that the user data collected for one study participant does not reside on
the desktop used in the experiment and does not bias the results of the experiment. Finally,
I strove to limit the number for unanalyzed control factors. For example, I ensured that all
the experiments were run by the same research assistant.
The need to clean up and standardize the list of recently opened documents was revealed
through the answers of study participants to the post-experiment questionnaire. When
asked about their strategy for finding relevant information, a few participants indicated that
they started by checking out the list of recent documents. This underlines the importance of
running a pilot experiment before conducting the entire human subject study, as well as the
importance of designing a questionnaire with the objective of identifying additional sources
of variability and ensuring that the participants performed the experiment correctly. These
questionnaires revealed an important detail that was missing in our scenario narratives,
namely the name of the victim colleague. Study participants indicated that this piece of
information would have helped them in their search for PII. This detail that was missing
in the pilot experiment, was later added when conducting the full human subject study.48

CHAPTER 3. USER SEARCH BEHAVIOR PROFILING
3.2.5 Power Analysis and Sample Size Estimation
Power analysis is an important step in designing a user study, which usually gets neglected
by many researchers working on cyber-security user studies. An experiment’s power is an
indication of how statistically significant its results may be, and it varies normally between
0.5 and 0.9. The higher the power, the more statistically significant the results are. I have
to determine the desired power of the experiment, in order to calculate the required number
of samples, or human subjects, needed for each experimental condition of the user study.
Obviously, reaching a higher power value requires a higher number of samples.
The adequate sample size for the experiment depends on several parameters:
• Form of the experiment: The number of independent variables manipulated in
the experiment and the number experimental conditions drive the number of subjects
needed for the user study. The more treatment conditions analyzed, the higher the
number of participants needed in the experiment.
• Hypothesis to be tested and the null hypothesis: This requires identifying the
desired effect size w2 that the researcher wishes to detect. The effect-size measure is
a measure of the size of an effect in the overall population, regardless of the specific
details of the human subject study.
• Desired power: Achieving a higher power value for the experiment results requires
a higher number of samples. A power of about 0.8 seems to be reasonable for human
behavioral experiments [Keppel, 2004].
The sample size n needs to be large enough, so that the experiment can produce a
reasonable accuracy, i.e. limit the sampling errors. Using a larger sample size may only
add to the recruiting costs without adding more accuracy.
3.2.5.1 Calculating the Effect Size
There are several effect size measures such as Hedges’ g, Cohen’s f2, and w2 . Some of
these measures estimate the effect size for the sample rather than the population. Others are
biased and tend to overestimate the effect size. I use the w2 effect size, which is considered
a rather unbiased effect size measure for populations, and not for samples only.49

CHAPTER 3. USER SEARCH BEHAVIOR PROFILING
I measure the population effect size w2 of this feature by calculating the standardized
difference between means of measured features within the populations of each scenario. The
standardized difference takes into account the variability of the feature from one user to
another.
The effect size is measured as follows:
w2 =µ1 − µ2σ12
(3.1)
where µ1 is the mean of a feature f in scenario 1 (e.g. the malicious scenario), µ2 is the
mean of feature f for users in scenario 2 (e.g. the benign scenario), and σ12 is the standard
deviation based on both user populations of the two scenarios. Considering the sample sizes
s1 and s2 of the two populations or groups, then σ12 can be defined:
σ12 =
√SS1 + SS2df1 + df2
(3.2)
where df1 and df2 are the degrees of freedom in both populations 1 and 2 respectively, i.e,
dfi = si − 1 where i ∈ {1, 2} and SSi is defined as
SSi =
si∑j=1
y2i,j (3.3)
where yi,j is the value of feature f for user j in population i.
3.2.5.2 Estimating the Sample Size
Once the effect size has been estimated and the desired power value determined, the required
sample size n can be calculated as follows:
n = φ21− w2
w2(3.4)
where φ is known as the non-centrality parameter.
The non-centrality parameter φ indicates to which extent the user study provides evi-
dence for differences among the two population means. It can be extracted from the power
function charts developed by Pearson and Hartley based on the desired power [Pearson and
Hartley, 1951]. Using the right sample size is important for reaching the desired power of
the experiment (usually between 0.5 and 0.9). However, increasing the sample size to reach50

CHAPTER 3. USER SEARCH BEHAVIOR PROFILING
very high power values beyond 0.9 may be very costly, as it becomes much harder to reach
power values beyond that value.
3.3 Data Collection
After describing the human subject study methodology and the data collection planning
phases, I discuss in this section how I conducted the user study, and present the RUU
dataset that I collected during that process. I start by describing the host sensor developed
to collect this dataset.
3.3.1 Host Sensor
We have developed a host sensor for Windows platforms that monitors all registry-based
activity, process creation and destruction, window GUI and file accesses, as well as DLL
libraries’ activity. It gathers various process-related data items including process name and
ID, the process path, the parent of the process, the type of process action (e.g. type of
registry access, process creation, process destruction, window title change, etc.), the process
command arguments, action flags (success or failure), and registry activity results. A time
stamp was also recorded for each audit record. The Windows sensor uses a low-level system
driver, DLL registration mechanisms, and a process table hook to monitor process activity.
3.3.2 Required Sample Size
It was hard to accurately predict the effect size of the different search-related features prior
to conducting the human subject study, as there were no published results from similar
studies. For instance, I could not predict how many more files would be touched by a
masquerader as opposed to a user conducting his or her regular activities. So I made
some assumptions in order to roughly estimate the required number of participants in the
user study. It turned out that I needed more than 17.7 participants in order to achieve
an 88% probability of achieving a significant result, assuming that the number of files
touched by a masquerader would double on average (which was indeed validated by our
experiments). Based on this guideline, I had eighteen students participate in the ‘normal51

CHAPTER 3. USER SEARCH BEHAVIOR PROFILING
user’ data collection exercise, and forty students participate in the ‘capture-the-flag’ exercise
for masquerader data collection.
3.3.3 Collecting Normal User Data
Eighteen computer science students installed the Windows host sensor on their personal
computers. The host sensor collected the data described in the previous subsection and
uploaded it to a server, after the students had the chance to review the data and the
upload. The students agreed to share their data with the research community. This unique
dataset with a size of more than 10 GBytes is available for download after signing a usage
license agreement. The data collected for each student spanned 4 days on average. An
average of more than 500,000 records per user were collected over this time period.
3.3.4 Collecting Simulated Masquerader Data
To obtain masquerader data, I recorded the activity of forty students who posed as masquer-
aders by participating in a ‘capture the flag’ exercise and following the malicious attacker
scenario of the human subject study described in Section 3.2.2. Recall that in order to
ensure the validity of the experiment and the resulting data, I controlled the ‘user’s intent.’
A total of sixty computer science students were randomly selected to participate in the
exercise from a list of volunteers. The participants were randomly assigned to one of three
groups. All participants had unlimited access to the same file system of a lab computer for
15 minutes each. None of the users had access to this file system before, which was designed
to look very realistic and to include potentially interesting patent applications, personally
identifiable information, as well as account credentials. The file system had more than
100,000 files indexed by desktop search tools installed on the system, and totaling a size of
more than 70 GBytes. The files were copied from a modern Windows XP machine routinely
used in a university research environment. They were created over a period of 5 years. The
file system included at least 80 files containing personal information that could be used for
identity theft or financial gain. The contents of certain personal files were sanitized, so
that no personal information was leaked. I also installed applications that typical computer
science students would have on their own machines, such as programming APIs, media52

CHAPTER 3. USER SEARCH BEHAVIOR PROFILING
players, etc., together with code projects, games, music, and video files. The goal was to
make this machine look similar to the ones that the normal users in our experiment were
using. Special care was taken to make sure that the desktop appeared in the same state
to all participants in the experiment. The study participants were asked not to share any
information about the experiment with others until the data collection exercise was com-
pleted. The objective was to limit user bias due to influence from other participants in the
experiments. While simulating masquerader attacks in the lab is not ideal, it was the best
available option. None of the students who shared their normal usage data were willing to
lend their computers in order to run masquerade attack experiments on them.
3.4 User Study Experiment
The objective of this experiment is to explore the validity of the conjecture that a masquer-
ader’s intent has a significant effect on his or her search behavior. I extracted three features
from the data collected in the user study after experimenting with several features such as
the frequencies of different types of user actions and application events, the total size of
touched files in bytes, the number of search windows and search window touches, etc.. The
three selected features are:
1. The number of files touched during an epoch of two minutes
2. The number of automated search-related actions initiated by the masquerader within
two minutes
3. The percentage of manual search actions during the same epoch
Automated search actions are search actions launched using a desktop search tool such
as Google Desktop Search. Manual search actions are file system navigation or exploration
activities. I display the distribution of these features for the malicious, benign, and neu-
tral scenario participants of the user study in Figures 3.2, 3.3, and 3.4. The experiment
demonstrates that the manipulation of the user intent has demonstrated a significant effect
on user search behavior.53

CHAPTER 3. USER SEARCH BEHAVIOR PROFILING
Figures 3.2, 3.3, and 3.4 are box-and-whisker plots where the horizontal line in the
middle of each of the boxes in these plots corresponds to the median value of the displayed
feature. Fifty per cent of the data falls within this box, while the top and bottom quartiles
(25% of the data) of the data are represented by the whisker lines above and below this
box. Data points whose value is above 1.5 times the upper quartile or lower than 1.5 times
the lower quartile are considered outliers and are represented as small crosses. The short
horizontal lines above and below the box represent the maximum and minimum data values
excluding outliers.
Figure 3.2 depicts the distribution of the number of accesses to all files residing on the
file system per a 2-minute epoch. It is clear that the average number of file touches amongst
the malicious scenario group is much higher than in the other two groups. The z-test with
means of 140, 40, and 35 decoy touches for the three respective groups rejects the null
hypothesis at the 99% confidence level (p ≤ 0.01).
Figure 3.2: Distribution of File Touches across the three User Study Groups
54

CHAPTER 3. USER SEARCH BEHAVIOR PROFILING
Figure 3.3 shows the distribution of search-related queries to the registries and accesses
to search-related DLLs and applications for the different groups in the human subject study.
The average number of search-related records in the first group is comparable to that in the
other groups, which might be unexpected. However, this could be explained by the fact that
the participants in the first group were penalized if their illegal masquerade activities were
discovered, which explains why most of them decided to refrain from using desktop search
tools to find relevant information. However, Figure 3.4 reflects the extensive information
exploration and gathering activities conducted by the participants in the first group.
Figure 3.3: Distribution of Search-related Actions across the three User Study Groups
In the latter figure, one can clearly notice that the percentage of user actions related to
navigating through the file system, in order to explore its contents, is much more significant
in the first group. The participants in the second group did not have the intention to steal
any information, which is why they did not engage in file system exploration activities.
Most of them only tried to access the work file they had to review in order to finish working
on their presentation. The percentage of file system navigation activities is minimal, except55
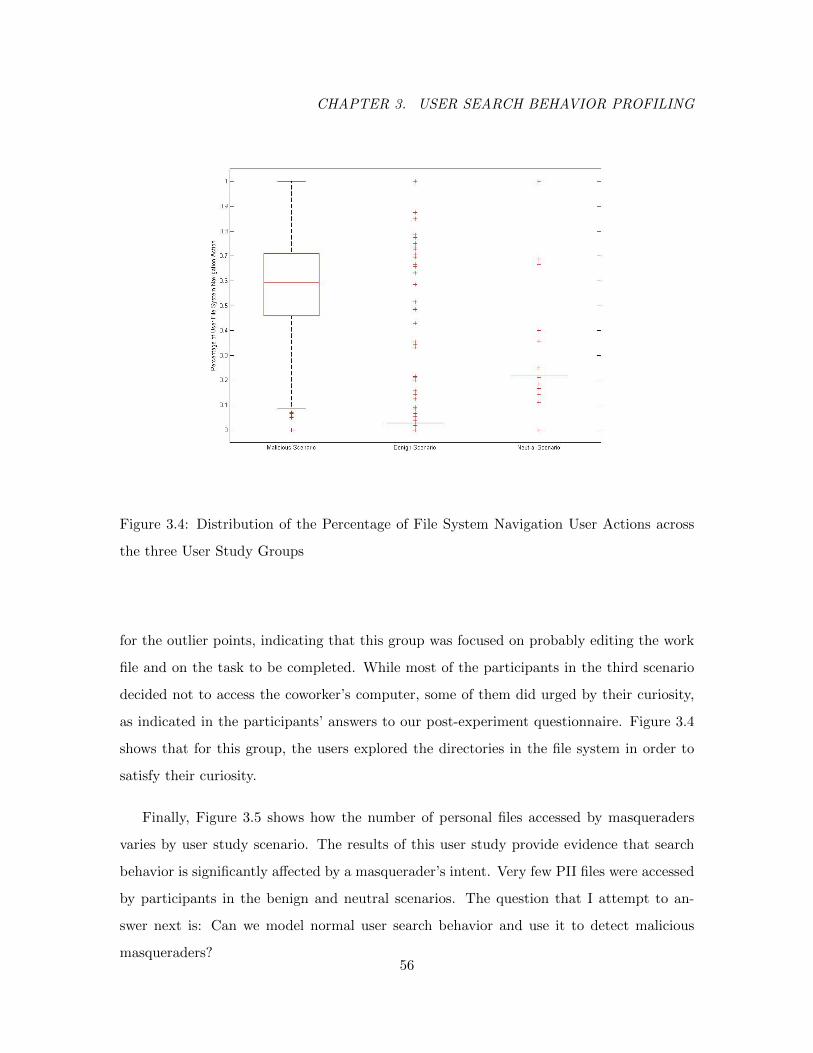
CHAPTER 3. USER SEARCH BEHAVIOR PROFILING
Figure 3.4: Distribution of the Percentage of File System Navigation User Actions across
the three User Study Groups
for the outlier points, indicating that this group was focused on probably editing the work
file and on the task to be completed. While most of the participants in the third scenario
decided not to access the coworker’s computer, some of them did urged by their curiosity,
as indicated in the participants’ answers to our post-experiment questionnaire. Figure 3.4
shows that for this group, the users explored the directories in the file system in order to
satisfy their curiosity.
Finally, Figure 3.5 shows how the number of personal files accessed by masqueraders
varies by user study scenario. The results of this user study provide evidence that search
behavior is significantly affected by a masquerader’s intent. Very few PII files were accessed
by participants in the benign and neutral scenarios. The question that I attempt to an-
swer next is: Can we model normal user search behavior and use it to detect malicious
masqueraders?56
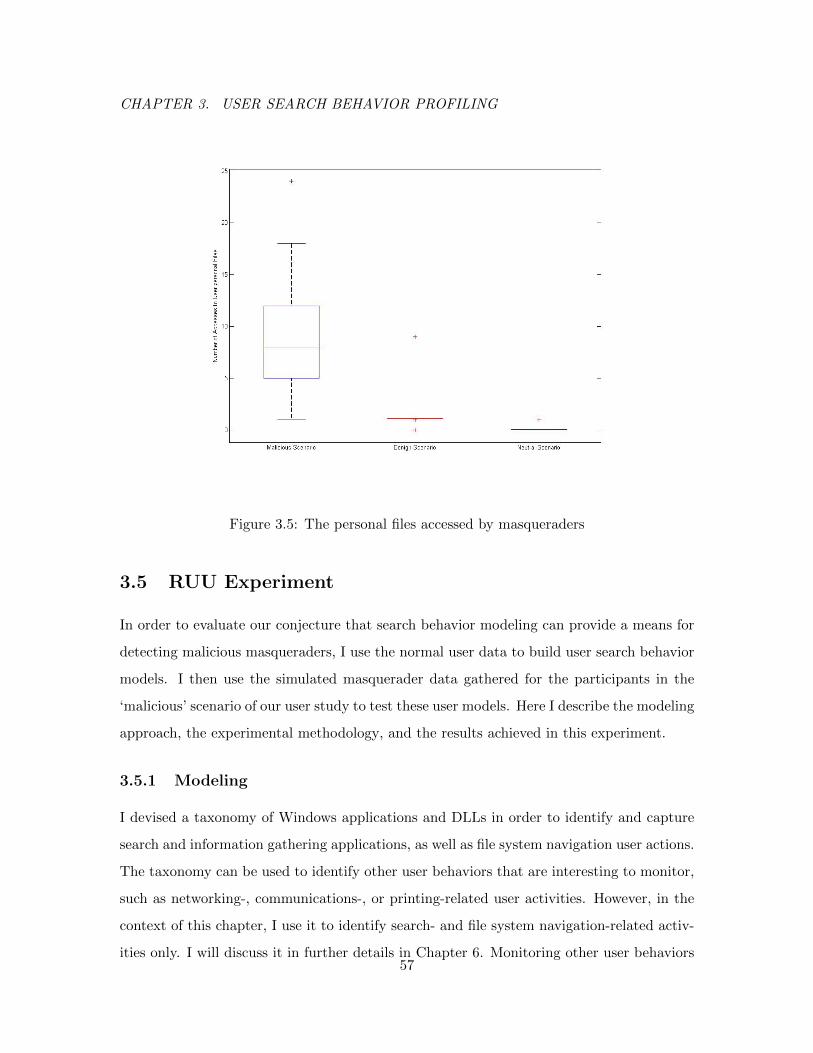
CHAPTER 3. USER SEARCH BEHAVIOR PROFILING
Figure 3.5: The personal files accessed by masqueraders
3.5 RUU Experiment
In order to evaluate our conjecture that search behavior modeling can provide a means for
detecting malicious masqueraders, I use the normal user data to build user search behavior
models. I then use the simulated masquerader data gathered for the participants in the
‘malicious’ scenario of our user study to test these user models. Here I describe the modeling
approach, the experimental methodology, and the results achieved in this experiment.
3.5.1 Modeling
I devised a taxonomy of Windows applications and DLLs in order to identify and capture
search and information gathering applications, as well as file system navigation user actions.
The taxonomy can be used to identify other user behaviors that are interesting to monitor,
such as networking-, communications-, or printing-related user activities. However, in the
context of this chapter, I use it to identify search- and file system navigation-related activ-
ities only. I will discuss it in further details in Chapter 6. Monitoring other user behaviors57

CHAPTER 3. USER SEARCH BEHAVIOR PROFILING
will be the subject of future work. The use of the taxonomy abstracts the user actions and
helps reveal the user’s intent.
I grouped the data into 2-minute quanta of user activity, and I counted all events
corresponding to each type of activity within each of the 2-minute epochs. I also explored
other features such as the size of files touched and the number of processes running or
launched during this epoch among other features. Eventually, a total of three features were
selected for each of the 2-minute epochs. Each of the features is related to some aspect
of the user’s search or information gathering and information access behavior. The three
features that provided the best accuracy results in our experiments are:
1. Number of automated search-related events: Specific sections of the Windows reg-
istry, specific DLL’s, access to specific index files, and specific programs, particularly
desktop search tools, are correlated with system searching. Within the 2-minute
epoch, I model all search-related activity.
2. Number of file touches: Any file fetch, read, write, or copy action causes the requested
file to be loaded into memory. I count the number of times files are touched and loaded
into memory by any process within each 2-minute epoch.
3. Percentage of file system navigation user actions: Not all search is performed using
a desktop search tool. Navigating through the file system to explore its contents is
also a form of user search. I model all manual search or file system navigation user
activity occurring during the 2-minute epoch.
To identify the automated and manual search applications and user activities, I referred
to our Windows applications taxonomy. The chosen features are simple search features
that characterize search volume and velocity to test our hypothesis. While no single feature
could be used to achieve high detection rates, the combination of the three features could
be very effective. More complex search features that describe user search patterns could be
extracted. Such features include, but are not limited to search terms and specific directory
traversals. Evaluation of these features is the subject of my future work.58

CHAPTER 3. USER SEARCH BEHAVIOR PROFILING
3.5.2 Experimental Methodology
For each of the 18 normal users, the first 80% of their data was used for training a one-class
SVM model. The user’s test data and the masquerader data were kept separate. After the
baseline models were computed, the same features used in the model were extracted for
the test data after dividing them into 2-minute quanta of user activity. The models were
tested against these features, and an empirically identified threshold was used to determine
whether the user activity during the two-minute period was normal or abnormal. If the user
activity was performed by the normal user, but was classified as abnormal by the ocSVM
model, a false positive was recorded.
3.5.3 Detection Accuracy Evaluation
For evaluation purposes, I conducted two experiments. In the first one, I used one-class
SVM models using the three features listed in Section 3.5.1. In the second experiment, I
used the frequency of applications and processes within the 2-minute epoch as features for
the ocSVM models. This is the modeling approach that achieved results comparable to
those achieved by the naıve Bayes approach when applied to the Schonlau dataset [Wang
and Stolfo, 2003], even though it is a one-class modeling approach, i.e. it uses less data for
training the user models.
3.5.3.1 Accuracy Results
Using the search-behavior modeling approach, 100% of the two-minute quanta that included
masquerader activity were detected as abnormal, while 1.1% of the ones with legitimate user
activity were flagged as not conforming to the user’s normal behavior. The results achieved
are displayed in Table 3.2. The false positive (FP) rate is significantly reduced compared
to the application frequency-based modeling approach, while a perfect detection rate is
achieved. These results substantially outperform the results reported in prior work (see
Chapter 2).
Monitoring file access and fetching patterns turned out to be the most effective feature
in these models. Consider the case where a user types ‘Notepad’ in the search field in order
to launch that application. Such frequent user searches are typically cached and do not59

CHAPTER 3. USER SEARCH BEHAVIOR PROFILING
Table 3.2: Experimental results of ocSVM modeling approaches using search-behavior re-
lated features and application frequency features
Method True Pos. (%) False Pos. (%)
Search-behavior ocSVM 100 1.1
App.-freq. ocSVM 90.2 42.1
require accessing many files on the system. Note that if the attacker follows a different
strategy to steal information, and decides to copy whole directories in the file system to
a USB drive for later investigation, instead of identifying files of interest during one user
session, then the ‘file touches’ feature will reflect that behavior.
A typical means to visualize the performance of any classification algorithm is the Re-
ceiver Operating Characteristic (ROC) curve, which plots the sensitivity against 1- speci-
ficity. The specificity is defined as nTNnTN+nFP
and the sensitivity is defined as nTPnTP+nFN
where
nTN , nFP , nTP , nFN are the numbers of true negatives, false positives, true positives, and
false negatives respectively. A true positive is a masquerade activity that has been correctly
identified as so by the classifier. A false positive is a normal user’s activity that was mis-
classified as a masquerader’s. Similarly a true negative is a normal user’s activity that the
detector classifies as normal, and a false negative is a masquerade activity that the classifier
fails to detect, the latter being perhaps the worst case of failure.
Since each user has his or her own model with his or her own detection threshold, it
is not possible to build a single ROC curve for each modeling approach. However, we can
compare the ROC curves for individual user models using the two modeling approaches
investigated. One way to compare the ROC curves is to compare the Area Under Curve
(AUC) values. The AUC, also known as the ROC score, is the integral of the ROC curve,
i.e. it is a measure of the area under the ROC curve. It reflects the accuracy of the detection
method or classifier used. The higher the AUC is, the better the overall accuracy of the
classifier.
Figure 3.6 displays the AUC scores for all user models. The search behavior modeling
approach outperforms the application frequency based modeling approach for each user
model. The average AUC score achieved for all ROC curves when modeling search behav-60

CHAPTER 3. USER SEARCH BEHAVIOR PROFILING
ior is 0.98, whereas the average AUC score for the application frequency-based models is
0.63. The bad performance of the application frequency-based modeling approach can be
explained by the high-dimensional feature vectors used in this modeling approach. This
suggests that a lot more data may be needed for training.
Figure 3.6: AUC Scores By User for the Search Behavior and Application Frequency-Based
Modeling Approaches using one-class Support Vector Machines
Figure 3.7 depicts the number of ROC curves having AUC scores higher than a certain
value for both modeling approaches. Note that for 12 user search behavior models, the AUC
score is equal to 1 indicating a perfect detection rate and the absence of any false positives.
The RUU dataset consists of user data with varying amounts of data for different users.
The amount of search behavior information varied from user to user. False positives were
higher for users who contributed less data in general and less search-related data in par-
ticular, such as users 11 and 14, than for those for whom a large amount of such data
was collected. For a 100% detection rate, the FP rate scored by these user models ranged
between 11% and 15%, which proves the need for more training data for these users, in
order to improve the performance of the classifiers.
In summary, the significant accuracy improvement achieved can be explained by the61

CHAPTER 3. USER SEARCH BEHAVIOR PROFILING
Figure 3.7: The number of user models with AUC values greater than the value displayed
on the x-axis for the search behavior and the application frequency modeling approaches
using one-class SVMs. (The upper-left point shows 18 user models with AUC scores greater
than 0.5)
fact that features used for modeling are good discriminators between normal user behavior
and fraudulent behavior. Masqueraders were focused on a clear objective, namely finding
information that could be used for financial gain, and by the tight link between the mas-
querader’s intent and his or her search behavior, as demonstrated through the user study
described in section 3.4. Despite the simplicity of the search features used, which charac-
terize search volume and velocity only, I was able to reliably detect malicious masqueraders
trying to steal information. Note that many masqueraders indicated in the post-experiment
questionnaires that their strategy for finding relevant information started by quickly scan-
ning the most recently opened documents, or the list of bookmarks. However, they still
engaged in a wider search activity eventually when these sources proved fruitless.62

CHAPTER 3. USER SEARCH BEHAVIOR PROFILING
3.6 Schonlau Data Experiment
The results achieved by profiling user search behavior require careful thought when con-
sidering the prior results of techniques that model sequences of user commands from the
Schonlau dataset. It is difficult to compare my results with the results presented in Ta-
bles 2.1 and 2.2 which were evaluated using the Schonlau dataset. Recall that the Schonlau
dataset is not a ‘true’ masquerader dataset, since its ‘intrusions’ or ‘masquerade’ com-
mand blocks are just sequences of commands generated by randomly selected normal users.
Moreover, information gathering and search activities of the users are not significant in this
dataset as can be deduced from Figure 3.8. Furthermore, the Schonlau dataset does not
include any timestamps, so temporal statistics cannot be extracted.
However, for completeness, I model specific user behaviors such as search, and test
classifiers based on this modeling approach against the Schonlau dataset. To do so, I assign
user commands to command categories, thus abstracting the user actions and identifying
the specific user behaviors to be modeled. Therefore, I focus on the analysis of types or
categories of user commands, rather than on simple user commands.
To accomplish the goal of accurately modeling user behavior I developed a taxonomy of
Linux commands similar to the one I created for Windows applications and DLLs. The tax-
onomy is displayed in Figure 3.9. I conducted an experiment where I followed the methodol-
ogy described in prior work of Schonlau et al. [Schonlau et al., 2001] and Wang&Stolfo [Wang
and Stolfo, 2003]. In this experiment, I measured the accuracy of one-class SVM models
using frequencies of simple commands per command block as features, and I compared the
performance of ocSVM models using frequencies of command categories or specific behav-
iors (per the command taxonomy) as features. I also used the same one-class modeling
technique with binary feature vectors. The features indicate the presence or absence of a
specific simple user command or command category within a 100-command block.
I used the first 5000 commands of a user as positives examples for training the model. No
negative examples were used for training. Then I tested the classifier using the remaining
10,000 commands of the user, which may have injected command blocks from other users
under a probability distribution as described in [Schonlau, 2001].
Table 3.3 summarizes the results achieved by the one-class SVM classifiers. The results63

CHAPTER 3. USER SEARCH BEHAVIOR PROFILING
Figure 3.8: The Distribution of Commands across Various Categories in the Schonlau
Dataset
show that the performance of one-class SVMs using command categories per the taxonomy
is essentially the same as the performance of ocSVM that uses simple commands. This
demonstrates that the information that is lost by compressing the different user shell com-
mands into a few categories does not affect the masquerade detection ability significantly.
In section 3.7, I show how modeling search behavior by using the taxonomy of commands
and applications reduces computational complexity, both for training and for testing the
classifier. This is possible thanks to the smaller number of features used for modeling, which
reduces the amount of sampled data required for training, as the data becomes less sparse
in the new feature space.64

CHAPTER 3. USER SEARCH BEHAVIOR PROFILING
Figure 3.9: Taxonomy of Linux and Unix Commands
3.7 Performance Evaluation
3.7.1 Computational Complexity
Our experiment can be divided into four main steps that cover building and testing the
classifiers:
1. Identifying the features to be used for modeling
2. Extracting the features to build the training and testing vectors
3. Building a ocSVM model for each normal user
4. Testing each user model against the test data
I discuss the computational complexity of each of these steps for one user model.
Let o be the total number of raw observations in the input data. I use this data to
compute and output the training vectors xi ∈ Rn, i = 1, ..., l and testing vectors xj ∈65
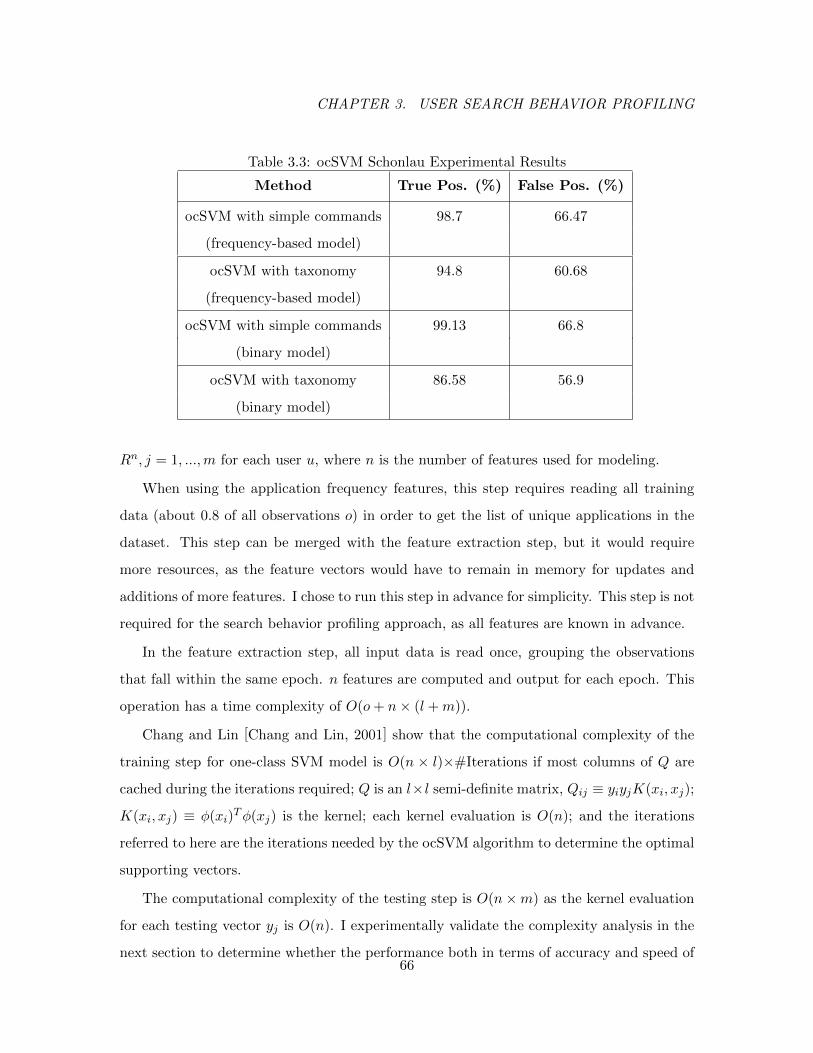
CHAPTER 3. USER SEARCH BEHAVIOR PROFILING
Table 3.3: ocSVM Schonlau Experimental Results
Method True Pos. (%) False Pos. (%)
ocSVM with simple commands 98.7 66.47
(frequency-based model)
ocSVM with taxonomy 94.8 60.68
(frequency-based model)
ocSVM with simple commands 99.13 66.8
(binary model)
ocSVM with taxonomy 86.58 56.9
(binary model)
Rn, j = 1, ...,m for each user u, where n is the number of features used for modeling.
When using the application frequency features, this step requires reading all training
data (about 0.8 of all observations o) in order to get the list of unique applications in the
dataset. This step can be merged with the feature extraction step, but it would require
more resources, as the feature vectors would have to remain in memory for updates and
additions of more features. I chose to run this step in advance for simplicity. This step is not
required for the search behavior profiling approach, as all features are known in advance.
In the feature extraction step, all input data is read once, grouping the observations
that fall within the same epoch. n features are computed and output for each epoch. This
operation has a time complexity of O(o+ n× (l +m)).
Chang and Lin [Chang and Lin, 2001] show that the computational complexity of the
training step for one-class SVM model is O(n × l)×#Iterations if most columns of Q are
cached during the iterations required; Q is an l×l semi-definite matrix, Qij ≡ yiyjK(xi, xj);
K(xi, xj) ≡ φ(xi)Tφ(xj) is the kernel; each kernel evaluation is O(n); and the iterations
referred to here are the iterations needed by the ocSVM algorithm to determine the optimal
supporting vectors.
The computational complexity of the testing step is O(n×m) as the kernel evaluation
for each testing vector yj is O(n). I experimentally validate the complexity analysis in the
next section to determine whether the performance both in terms of accuracy and speed of66

CHAPTER 3. USER SEARCH BEHAVIOR PROFILING
detection has improved using the proposed search behavior modeling approach.
3.7.2 Performance Results
I ran the experiments on a regular desktop with a 2.66 GHz Intel Xeon Dual Core processor
and 24 GB of memory on a Windows 7 platform. I measure the average running time of
each step of the experiment over ten runs. The results are recorded in table 3.4. As I
point out in the previous subsection, the very first step is not executed in the proposed
search behavior modeling approach. This step takes more than 8 minutes when using the
application frequency modeling approach. The running time of the feature extraction step
shows that the number of raw observations in the raw data dominates the time complexity
for this step. Note that the RUU dataset contains more than 10 million records of data.
The training and testing vectors are sparse, since only a limited number of the 1169
different applications could conceivably run simultaneously within a two-minute epoch. This
explains why the 389.7 ratio of features does not apply to the running time of the training
and testing steps, even though these running times depend on the number of features n.
While one might argue that, in an operational system, testing time is more important
than training time, I remind the reader that a model update has the same computational
complexity as model training. For the latter, the use of a very small number of features as
in our proposed approach clearly provides significant advantages.
All of these differences in running time culminate in a total performance gain of 74%
when using the search behavior model versus the application frequency model typical of
prior work. This computational performance gain coupled with improved accuracy could
prove to be a critical advantage when deploying the sensor in an operational environment
if a system design includes automated responses to limit damage caused by an attacker.
3.8 Conclusion
3.8.1 Chapter Summary
In this chapter, I showed that user search behavior can be used to reveal the malicious intent
of a masquerader. I used a modeling approach that aims to capture the intent of a user67

CHAPTER 3. USER SEARCH BEHAVIOR PROFILING
Table 3.4: Performance comparison of ocSVM modeling approaches using search behavior-
related features and application frequency features
Step ocSVM app. freq. ocSVM search-beh.
Identifying Features (min) 8.5 0
Extracting Features (min) 48.2 17.2
Training (min) 9.5 0.5
Testing (min) 3.1 0.5
Total (min) (Rounded) 69 18
more accurately based on the insight that a masquerader is likely to perform untargeted and
widespread search. Recall that I conjecture that user search behavior is a strong indicator
of a user’s true identity. I modeled search behavior of the legitimate user with three simple
features, and detected anomalies deviating from that normal search behavior.
The use of search behavior profiling for masquerade attack detection permits limiting the
range and scope of the profiles computed about a user. This limits potentially large sources
of error in predicting user behavior that would be likely in a far more general setting. Prior
work modeling user commands shows very high false positive rates with moderate true posi-
tive rates. User search behavior modeling produces far better accuracy. With the use of the
RUU dataset [Ben-Salem, b], a more suitable dataset for the masquerade detection problem,
I achieved the best results reported in literature to date: 100% masquerade detection rate
with 1.1% of false positives only.
In an operational monitoring system, the use of a small set of features limits the system
resources needed by the detector, and allows for real-time masquerade attack detection.
Note that the average size of a user model is about 8 KB when the search-behavior modeling
approach is used. That model size grows to more than 3 MB if an application and command
frequency modeling approach is used. Furthermore, it can be easily deployed as profiling in
a low-dimensional space reduces the amount of sampling required: An average of four days
of training data was enough to train the models and build effective detectors.68

CHAPTER 3. USER SEARCH BEHAVIOR PROFILING
3.8.2 Future Research
In my future work, I will explore more complex search features that describe user search
patterns. Such features include, but are not limited to search query contents, parameters
used, and specific directory traversals that could improve accuracy results and extend them
to other masquerade attack scenarios. Other potential features to model include the use of
bookmarks and most recently opened documents, which could also be used by masquerade
attackers as a starting point for their search. The models reported here are primarily
volumetric statistics characterizing search volume and velocity.
My focus in this work was on monitoring a user’s search behavior in real time to deter-
mine whether current user actions are consistent with the user’s historical behavior. Note
that, while the list of search applications and commands may have to be updated occasion-
ally (just like an Anti-Virus needs periodic signature updates) for best detection results,
most of the search-related activity would be manifested in accesses to search index files and
regular user files on the system.
Monitoring other user behaviors, such as the ones discussed in Section 3.1.1 will be
the subject of future work. A masquerader could choose to copy data to a USB drive for
later examination. They may choose to access the victim computer remotely and ex-filtrate
data over the network. They could even try to evade the monitoring system by renaming
DLLs and applications so that they are assigned to a different category per our applications
taxonomy, other than the search or information gathering category. I could easily use the
application taxonomy to monitor these specific behaviors in case the attacker resorts to
such strategies. As noted in section 3.5.3.1, the ‘file touches’ feature already captures some
aspect of this behavior. The applications taxonomy could be used to extract ‘Networking’-,
‘Communications’- and I/O-related features to be included in the user model, so that such
masquerade behavior gets detected easily.
69

CHAPTER 3. USER SEARCH BEHAVIOR PROFILING
This page is intentionally left blank.
70

CHAPTER 4. EVALUATION OF DECOY DOCUMENT PROPERTIES
Chapter 4
Evaluation of Decoy Document
Properties
In the previous chapter, I investigated how user search behavior profiling can be used for
masquerade detection. Another approach for detecting masqueraders is the use of baits
such as honeynets and honeypots. Honeypots are information system resources designed
to attract malicious users. They have been widely deployed in DMZs to trap attempts by
external attackers to penetrate an organization’s network. Some researchers proposed the
use of honeyfiles, a type of honeypot, to detect malicious insider activity [Bowen et al.,
2009b]. They introduced the concept of perfectly believable decoys and proposed several
properties to guide the design and deployment of decoys, namely:
1. Believability: The attacker will not use the bait information if it does not appear
authentic to the attacker.
2. Enticingness: No attack detection will be possible if the attacker does not access the
bait information because it does not look attractive enough.
3. Conspicuousness: Decoys should be easily located or retrieved in order to maximize
the likelihood that an attacker takes the bait.
4. Detectability: If the access to the bait asset is not detectable than the deployment of
the decoys is useless.71

CHAPTER 4. EVALUATION OF DECOY DOCUMENT PROPERTIES
5. Variability: Decoys should not be easily identifiable to an attacker due to some shared
invariant.
6. Non-interference: Decoys should not interfere with the legitimate user’s normal activ-
ity. Non-interference is defined as the likelihood that legitimate users access the real
documents after decoys are introduced [Bowen et al., 2009b].
7. Differentiability: Legitimate users should be able to easily distinguish decoy docu-
ments from authentic documents, which has a direct effect on non-interference.
8. Shelf-life: Decoys may have a limited time period during which they are effective.
While all of the above are important decoy properties, it can be difficult to design and
deploy decoy documents that would optimize these properties, which in turn would assure
effective detection of a masquerade attack. One has to find the right trade-offs between
these properties in order to use them effectively. Such trade-offs may vary depending on
the type of attack.
For example, while believability is a very important property of decoys when used for
detecting insider attacks that aim to exfiltrate sensitive information, it becomes of a lesser
importance when the decoys are aimed at detecting masquerade attacks. In the case of an
insider attack, the attacker already has legitimate access to the system where the sensitive
information assets are located. Access to such assets does not necessarily constitute evidence
of malicious intent or activity. However, subsequent exfiltration and use of such information
does. If the attacker identifies the decoy document as bogus, then they would not use
the information contained in that document, which is why the believability of the decoy
document is important. In the case of a masquerade attack, the mere access to the decoy
document does constitute evidence of an attack as the masquerader is not a legitimate user
of the system, and therefore should not be accessing any assets residing on that system.
Whether the masquerader finds the decoy document believable or not, after having accessed
it, is irrelevant to the detection of the attack, since the evidence of the malicious activity
has been already established 1.
1This work was published in [Ben-Salem and Stolfo, 2011a].72

CHAPTER 4. EVALUATION OF DECOY DOCUMENT PROPERTIES
4.1 Trap-based Masquerader Detection Approach
4.1.1 Trap-based Decoys
The trap-based technique used by our sensor relies on trap-based decoys [Bowen et al.,
2009b] that contain ‘bait information’ such as online banking logins, social security numbers,
and web-based email account credentials. Users can download such decoy files from the
Decoy Document Distributor (D3) [Bowen and Hershkop, 2009], an automated service that
offers several types of decoy documents such as tax return forms, medical records, credit
card statements, e-bay receipts, etc. The decoy documents carry a keyed-Hash Message
Authentication Code (HMAC) [Krawczyk et al., 1997] embedded in the header section
of the document, and visible if the document is opened using a hex editor only. The
HMAC is computed over a file’s contents using a key unique to the user, and is hidden
in the header section of the file. For instance, the use of the full version of the SHA1
cryptographic function in combination with a secret key to tag the decoy documents with
an HMAC tag prevents the attacker from distinguishing the embedded HMAC from a
random function [Kim et al., 2006]. It is this marker or HMAC tag that our sensor uses to
detect access to a decoy document. An example of a decoy document with an embedded
HMAC is shown in Figure 4.1. In the next section, I describe how the sensor makes use of
this marker.
Besides the embedded HMAC tag, the decoy files carry a visible marker that is used to
prove data leakage through screen-capture in case the masquerader manages to exfiltrate
data without being detected. This marker is a string generated from a regular expression
that is unique to the legitimate user. They also have a beacon that signals a remote website
upon the opening of the decoy document. This can be disabled if we suspect that the
attacker might notice that the beacon document is phoning this remote website. Noticing
this informs the attacker that his or her activity has been discovered.
We have architected a Decoy Documents Access (DDA) sensor and designed decoy
documents in such a way that a sophisticated attacker with more knowledge and higher
capabilities, in particular an inside attacker, would not be able to escape detection if they
touched a decoy document. A sophisticated attacker with wide resources would not be able73

CHAPTER 4. EVALUATION OF DECOY DOCUMENT PROPERTIES
to distinguish the HMAC tags of decoy documents from random functions. Both types of
attackers, i.e. the sophisticated outsider or the malicious insider, would have to know that
the system under attack is baited. The detection of this class of attack is beyond the scope
of this thesis. Here, I devise user studies for attackers, who have no knowledge whether the
system is baited or not, with the objective of investigating the decoy deployment properties.
Figure 4.1: HMAC Embedded in the OCP Properties Section of a PDF Document
4.1.2 Decoy Documents Access Sensor
The DDA sensor detects malicious activity by monitoring user actions directed at HMAC-
embedded decoy documents, since any action directed towards a decoy document is sug-
gestive of malicious activity [Ben-Salem, a]. When a decoy document is accessed by any
application or process, the host sensor initiates a verification function. This function is re-
sponsible for distinguishing between decoys and normal documents by computing a HMAC
for that document and comparing it to the one embedded within the document. If the
two HMACs match, the document is deemed a decoy and an alert is triggered; otherwise,
the document is deemed normal and no action is taken. The DDA sensor alerts when de-
coy documents are being read, copied, or zipped. The sensor was built for the Windows
XP platform and relies on hooks placed in the Windows Service Table. The hooking is
performed by injecting code into the address space of the processes, and by replacing the74

CHAPTER 4. EVALUATION OF DECOY DOCUMENT PROPERTIES
address of the file open system call which is present in the kernel (.dll) library of windows.
This code injection guarantees that our code will be executed first, and post processing it
will call the actual system call. This approach also enables the configuration of the list of
processes that should be hooked into or should be excluded from hooking into.
4.2 Human Subject Study 1
4.2.1 Experiment Design
My first human subject study aims to measure decoy document accesses performed by the
legitimate users of the system, which can be considered as false positives. I seek to answer
two questions through this study:
1. Does the number of decoy files planted in a file system have an impact on their non-
interference with the legitimate user’s normal activities?
2. What are the best locations for planting decoys on a file system, so as to minimize
their non-interference?
To answer these questions, I designed an experiment where I controlled the number of de-
coy documents n planted in a file system. I followed the same prescription outlined in
Section 3.2. I postulate that non-interference is a variable that is dependent on the number
of decoy documents n. I do not measure non-interference as a probability. However, I
measure the average number of decoy accesses per one week of computer usage. To that
extent, I asked four user groups of thirteen computer science students each, to plant ten,
twenty, thirty, or forty decoy documents generated by D3 on their own file systems. The
fifty-two students downloaded a total of 1300 decoy documents from D3. I encouraged the
participants in the user study to carefully consider where to place the decoy files and how
to name them by taking into account the desired properties of such documents, particu-
larly enticingness, conspicuousness and non-interference [Bowen et al., 2009b]. Recall that
the objective, when placing such decoy files, is to maximize the likelihood that a potential
masquerader will get detected when he or she illegitimately accesses the victim’s computer,
while minimizing the likelihood that the legitimate user accidentally accesses these docu-75

CHAPTER 4. EVALUATION OF DECOY DOCUMENT PROPERTIES
ments due to confusion or interference with his or her normal activity. For instance, the user
can choose file names that are easily recognizable as decoy by him or her, while remaining
enticing to the adversary. The file name could, for example, include the name of a person
who is outside the social network of the user. For instance, one participant renamed a decoy
file to TaxReturnSylvia.pdf, while he did not file any tax returns jointly with Sylvia, nor
did he know anyone with that name. Carefully selecting the file names would make the file
easily recognizable as a decoy file by the legitimate user, but could make it intriguing for
the attacker.
The participants in the user study, who installed the DDA sensor before downloading
the decoy documents, agreed to share their data. The experiment lasted for about seven
days on average, during which access to decoy files was monitored. The data collected by
the DDA sensor was uploaded to a central server for analysis.
4.2.2 Experiment Findings
At the end of the human subject study, the participants reported the directories under
which they placed the downloaded decoy files. I have summarized the results of these
reports and selected the 40 directories with the highest number of placed decoys. These
directories are shown in a directory tree in Figure 4.4. The ranking of these file locations
is shown in Appendix C. Subdirectories under the My Documents and Desktop directories
seemed to be the most popular choices by the participants. In the following, I summarize
the main findings of this study.
4.2.2.1 Interference Increases Super-Linearly with More Decoy Files:
Recall that non-interference is defined as the likelihood of the legitimate user accessing
the authentic files after installing the decoy files. Decoy files planted on a file system for
masquerade detection are not supposed to be accessed by the legitimate user. They are
placed there in order to entice attackers to open and use them. Any accidental accesses
to decoy files by the legitimate user of the system, i.e. accesses that are not caused by an
attacker gaining access to the file system, are considered false positives. I have ignored all
alerts issued within the first hour of the students installing the decoy documents on their76

CHAPTER 4. EVALUATION OF DECOY DOCUMENT PROPERTIES
systems. This gives the participants an opportunity to decide where to place the decoy
documents and how to rename them, based on the recommendations given to them in the
user study description. Table 4.1 presents the number of false positives and shows that it
grows super-linearly with the number of decoy files planted in the file system. The higher
the number of decoy files placed in the file system, the higher the likelihood of a legitimate
user accidentally accessing one of these decoy files, thus, the lower the non-interference of
these decoy files with the normal activities of the legitimate user. While a more longitudinal
study is needed to investigate the relationship between the number of decoys planted and
their impact on non-interference, our preliminary results show that interference increases
super-linearly with the number of decoys planted.
Table 4.1: Number of Decoys and Decoy Touches
Number of Placed Number of Participants Number of Decoy
Decoys in Experiment Accesses
10 13 2
20 13 6
30 13 9
40 13 24
4.2.2.2 Distribution of False Positives:
Figure 4.2 is a box-and-whisker plot of the decoy file accesses by the legitimate users for
the four different values of decoys planted in the file system. The figure shows that for the
case of ten decoys, only one false positive was recorded for any single user, whereas that
number reaches up to nine false positives-point when 40 decoys are placed in the file system.
Although the ”‘nine false positives”’ data point is considered an outlier in this figure, more
than 50% of the users who placed 40 decoy documents in their file systems did accidentally
access at least one decoy file and experienced some level of interference with their normal
activities. As the figure shows, not only does the likelihood of interference for each user
grow with the number of decoy documents placed in the file system, but the amount of
interference for each affected user increases super-linearly as well.77

CHAPTER 4. EVALUATION OF DECOY DOCUMENT PROPERTIES
Figure 4.2: Distribution of the Number of Decoy Document Accesses by Legitimate Users
4.2.2.3 Placement of Decoy Files:
Figure 4.3 shows the number of false positives by decoy location. The specific directory
locations are listed in Appendix C.
The number of false positives varies widely by decoy document path or location. It is
noteworthy that fifteen of the top 40 decoy file locations only were accidentally accessed by
the legitimate users. Many decoy files were never accessed by these users, demonstrating
that non-interference of the decoy documents varies by the chosen decoy placement in the file
system. While the ideal decoy placement that minimizes interference should be customized
by the user based on his or her file system access habits, it seems that certain locations
should be avoided such as the high traffic locations or locations that get automatically
scanned by applications installed on the system.
The highest number of false positives are due to accesses to decoy files placed in location
number 14, i.e. under the Downloads directory. While eight of the nine false positives in this
location were triggered by a single user, the results show that decoy files in this location can
introduce a high level of interference. This is not surprising knowing that most browsers save
downloaded files in the Downloads directory by default, thus forcing a lot of user activity78

CHAPTER 4. EVALUATION OF DECOY DOCUMENT PROPERTIES
and traffic on files in this directory.
4.2.2.4 Differentiability to the User is not Enough:
The second decoy file location that exhibited a high number of false positives according to
Figure 4.3 is the My Music directory. These false positives can be accidentally triggered by
the legitimate users when manually browsing the directory, but they are more likely to be
triggered by media players that are scanning the directory in order to discover recently added
music files. Even though this scanning for media files is initiated by the user who knows
exactly which files are decoy files, the media player or application performing a thorough
scan cannot identify these decoy files, and therefore will access them in an attempt to
identify whether they are indeed music or video files.
I will further investigate the decoy placement strategies in the next section, where I will
show that decoy placement, and consequently decoy conspicuousness, is also tightly linked
with the ability to detect masqueraders.
Figure 4.3: Accidental False Positive Decoy Document Accessed by Legitimate Users by
Decoy Location
79

CHAPTER 4. EVALUATION OF DECOY DOCUMENT PROPERTIES
4.3 User Study 2
4.3.1 Experiment Design
In this experiment, I investigate two decoy deployment-related properties, namely enticing-
ness and conspicuousness. Evaluating the design-related properties such as believability,
particularly as it pertains to the contents of the decoy document, is not very relevant to
the masquerade attack problem. Recall that I detect access to the decoy files before the
attacker sees the contents of the file. I ensure variability by tagging all files on the system
with a pseudo-random HMAC tag. Detectability can be ensured through the use of the
DDA sensor, by the protection of the sensor, and the protection of the HMAC key (used to
compute the HMAC tags of the decoy files) from any tampering attempts. Note that any
attempt to modify the HMAC tag by the attacker requires access to the decoy file and its
loading into memory, which triggers an alert by the DDA sensor.
I seek to answer the following questions through this experiment:
1. How many decoy documents are needed to detect, with a high probability, masquer-
aders looking to steal information?
2. Where are decoy documents most likely to trap masquerade attackers, i.e. in which
directories should one place the decoys in order to maximize the likelihood of catching
a masquerader, while not interfering with the legitimate user’s normal activities?
3. What is the number of decoy documents that leads to the best trade-off between
masquerade detection while not interfering with the legitimate user’s activities?
4. To what extent do decoy file accesses reveal a masquerader’s malicious intent?
4.3.2 Experimental Set-Up
I conducted a set of experiments where I simulated masquerader attacks, as described in
Section 3.3.4. I installed the DDA sensor on the lab computer used in the human subject
study, and planted n decoy files in the local file system. I monitored when and where the
masqueraders accessed these decoy files. Table 4.2 shows how I varied the number of decoy80

CHAPTER 4. EVALUATION OF DECOY DOCUMENT PROPERTIES
documents n for the four experiments. Each experiment involved ten participants acting as
masqueraders.
In order to reduce experimenter bias when placing these decoy documents, I have sur-
veyed 52 computer science students as to where they would place decoy documents on their
file systems. The directory trees, shown in Figures 4.4, 4.5, 4.6 and 4.7, indicate where I
placed the decoy documents for each experiment. Recall that these decoy locations have
been selected based on the reports collected from the fifty-two student participants in the
first human subject study.
The number of decoy documents n is the independent variable that I control in this user
study. The number of decoy file touches is the dependent variable on the number of decoys
n planted in the file system.
The file system used in our lab had more than 100,000 files indexed by desktop search
tools installed on the system, and totaling a size of more than 70 GBytes. The file system
included at least eighty files containing personal information that could be used for identity
theft or financial gain. The contents of certain personal files were sanitized, so that no
personal information was leaked.
Table 4.2: Total Number of Decoy Alerts by Experiment
Experiment Number of Placed Decoys Number of Decoy Alerts
1 40 96
2 30 90
3 20 71
4 10 56
Before conducting the experiments, I ensured that all non-decoy documents on the file
system were tagged with a random tag, that is indistinguishable from the HMAC tag of the
decoy documents. This was done so that a more knowledgeable attacker cannot distinguish
the decoy files from the normal files by editing them through a hex editor and looking for
the HMAC tag within the document. This ensures the fifth desirable property of decoy
documents, namely that they are not easily distinguishable as decoys to the attacker.
Besides tagging the real non-decoy files, I have indexed all the decoy files using the81

CHAPTER 4. EVALUATION OF DECOY DOCUMENT PROPERTIES
available desktop search tools on the system. Recall that the DDA sensor issues an alert
if the contents of the decoy file are read or if the file gets loaded into memory. Therefore,
indexing the decoy files during the deployment phase can reduce potential false positive
alerts that might be issued by the DDA sensor during the experiments. The goal is to
have more reliable and accurate results, where the sensor alerts are truly caused by the
masquerader’s activity, and not by desktop search tools suddenly scanning the decoy files.
82

CHAPTER 4. EVALUATION OF DECOY DOCUMENT PROPERTIES
Fig
ure
4.4:
Pla
cem
ent
of40
dec
oyfi
les
inE
xp
erim
ent
1
83

CHAPTER 4. EVALUATION OF DECOY DOCUMENT PROPERTIES
Fig
ure
4.5:
Pla
cem
ent
of30
dec
oyfi
les
inE
xp
erim
ent
2
84
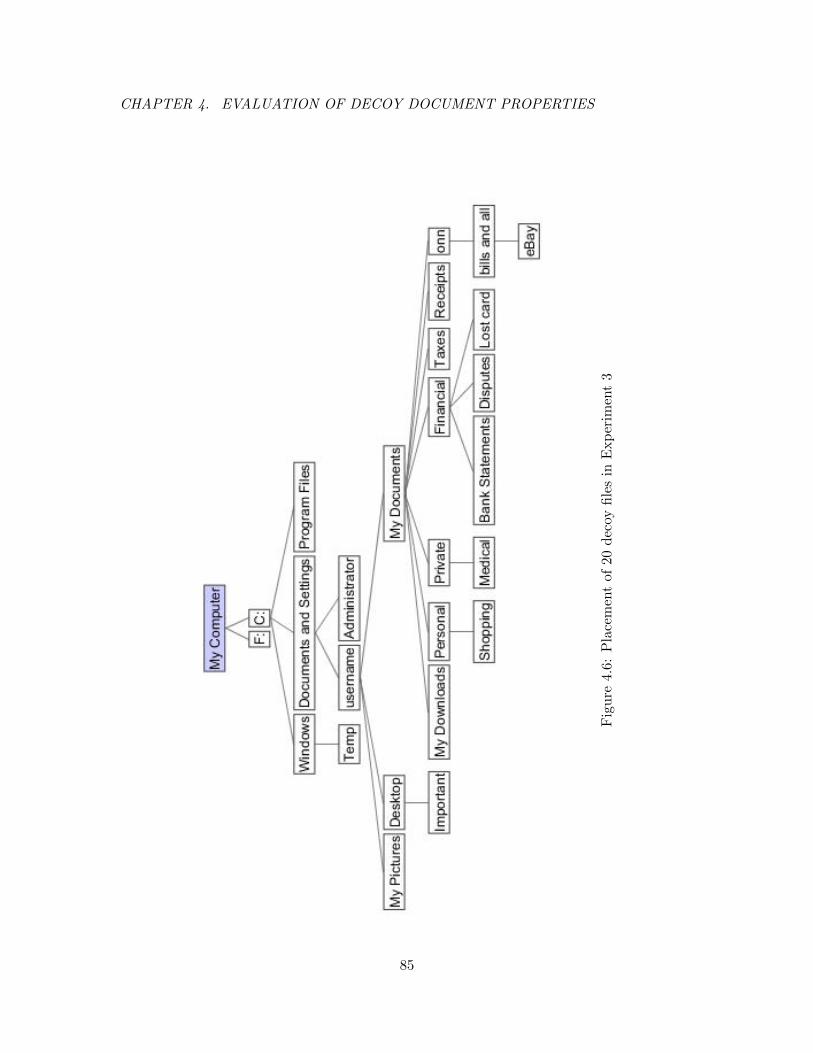
CHAPTER 4. EVALUATION OF DECOY DOCUMENT PROPERTIES
Fig
ure
4.6:
Pla
cem
ent
of20
dec
oyfi
les
inE
xp
erim
ent
3
85

CHAPTER 4. EVALUATION OF DECOY DOCUMENT PROPERTIES
Fig
ure
4.7:
Pla
cem
ent
of10
dec
oyfi
les
inE
xp
erim
ent
4
86

CHAPTER 4. EVALUATION OF DECOY DOCUMENT PROPERTIES
4.3.3 Experiment Findings
In the following section, I list the major findings of this human subject study.
4.3.3.1 The Use of Decoys is Effective:
The main purpose of the use of decoy files is to detect masquerade attacks. While non-
interference with legitimate users’ activities is desirable, decoys would be useless if they
fail to attract masqueraders by being enticing and conspicuous. The results displayed in
Figure 4.8 suggest that at least one access to a decoy document was detected by the DDA
sensor for every masquerader, regardless of the number of decoys planted in the file system.
This finding shows that well-placed decoys can be very effective for masquerade detection.
When combined with other intrusion detection techniques, they could potentially provide
even more effective and accurate detectors.
4.3.3.2 Recommended Number of Decoys:
Figure 4.8 shows the distribution of the number of decoy file accesses by attackers in the four
experiments by the number of decoy files placed in the file system. One could clearly see that
the average number of touched decoys (horizontal line within each box) is comparable in
the case of 20, 30, and 40 decoys. Whereas it is slightly lower (5.6 touches) when 10 decoys
are planted in the file system. Considering Figures 4.2 and 4.8 then, one can conclude that
the use of twenty decoy documents provides the best trade-off between detection capability
and non-interference. Although the minimum number of touched decoys jumps from 1 or 2
to 5 in the case of 40 planted decoys, this high number could be attributed to the location
of the planted decoys and not merely to the higher number of decoys. This can be clearly
seen in Figures 4.12 and 4.13 which show the conspicuousness of decoy files 33 and 37 for
instance. I will elaborate on this point in the following subsection.
4.3.3.3 High Number of Decoy Accesses is Indicative of Attacker’s Malicious
Intent:
The question is how many of these decoy file accesses are caused by the masquerader’s
malicious activity. To answer this question, I conducted an experiment with three groups87

CHAPTER 4. EVALUATION OF DECOY DOCUMENT PROPERTIES
Figure 4.8: Distribution of the Number of Decoy Document Accesses
of ten participants each. Each group was given a different scenario to execute: a ‘malicious
attacker’ scenario, a ‘benign masquerader’ scenario, or a ‘neutral’ scenario. The scenarios
are described in Appendix A. In all three scenarios, I placed 30 decoys in the file system
of the lab computer that served as the participant’s coworker’s computer. The benign and
malicious scenarios can provide a baseline to compare the decoy touches of a malicious
masquerader to. Figure 4.9 shows the distribution of decoy touches by scenario. One can
clearly see that the number of decoy touches is very low in the benign and neutral scenarios
when compared to the malicious scenario. For the following mean decoy touch values, the
p-value of the statistical z-test is lower than p=0.001: 9 decoy touches in the malicious case,
0.05 touches in the benign case and 0 touches in the neutral case).
4.3.3.4 The Use of Decoys is Efficient:
According to the results shown in Figure 4.10, seventeen attackers were detected during the
first minute of their masquerade activity, while another ten were detected during the second
minute after accessing the victim’s computer. All masqueraders were detected within ten
minutes of their accessing the system under attack. Figure 4.10 also shows that for attackers
31-40, who participated in experiment 4 with 10 planted decoy documents only, the average88

CHAPTER 4. EVALUATION OF DECOY DOCUMENT PROPERTIES
Figure 4.9: Distribution of the Number of Decoy Document Accesses by Scenario
period of undetected masquerade activity (3.6 minutes) is much longer, than for attackers
1-10 (1.3 minutes), 11-20 (1.6 minutes), and 21-30 (1.2 minutes).
Attackers 1 and 14 recorded the longest times of undetected masquerade activity. These
attackers had a different strategy for finding personal information. One attacker was mostly
after information related to the victim’s online banking activity, rather than after informa-
tion that existed locally on the file system. The attacker, therefore did not navigate or
search the My Documents directory, where most decoys were located. Not surprisingly, the
first decoy that the masquerader hit was decoy number 16, located under Internet Explorer’s
Favorites directory. Attacker 14, on the other hand, suspected that no important informa-
tion would be stored under the user’s file system, but rather under the administrator’s file
system, which is why he or she hit a single decoy document, namely decoy number 8 (see
Appendix C for the exact decoy location). Note that attacker 1 took part in the first exper-
iment where 40 decoys were planted, and attacker 14 participated in experiment 2, where
30 decoys were used. So even with a larger number of decoys, the attackers managed to89

CHAPTER 4. EVALUATION OF DECOY DOCUMENT PROPERTIES
escape detection for 10 minutes, which suggests the need for a well thought-out placement
of decoys that covers all potential attacker strategies for locating and stealing information.
Consider the null hypothesis that all masquerade activity within a 10-minute time win-
dow gets missed with at least 10% probability. Based on the observed results, we can reject
this hypothesis at the 2% significance level with a p-value=0.0148. In other words, we can
claim that with a 98% probability, the probability of detecting a masquerader within 10
minutes of his or her activity on the victim’s system is at least 90%.
Figure 4.10: Detection Time by User
4.3.3.5 Decoy Placement is Important:
The objective is to identify the decoy document locations that would be less interfering with
the normal activity of the legitimate user, while being conspicuous to potential attackers.
While the experiments have not been conducted on the same system, and the decoy file
locations vary by normal user (customized for his or her own non-interfering use of the
system), I argue that the cumulative results do provide ground for comparison, as I have90

CHAPTER 4. EVALUATION OF DECOY DOCUMENT PROPERTIES
Figure 4.11: Decoy File First Touches
monitored the use for about seven days on average for each user, for a total of 52 users.
Figure 4.12 shows the number of accesses to each decoy file by experiment. Note that
the first ten decoy documents were present during all four experiments, whereas the decoys
31-40, for instance were in place during the last experiment only. This explains the falling
blue line in Figure 4.12, which depicts the maximum number of potential attackers accessing
these decoys, knowing that there were ten masqueraders in each experiment.
The number of decoy file accesses varies widely by file location. Again, the file locations
are available in Appendix C. Some files were accessed more than 25 times, while others,
namely nine out of the forty decoy files, have never been touched by any attacker. This
underlines the importance of decoy placement in highly conspicuous locations.
Considering figures 4.12 and 4.2 for instance, one can notice that the decoy placed in
location 18 was touched by 28 masqueraders. Decoys placed in the same location by the
participants in the first user study were not touched by the legitimate users and did not
trigger any false positives. On the other hand, decoys placed in locations 19, 23, 25, and
31 for instance caused several false positives without catching any masquerader. The two
figures clearly show that the location of the decoy document plays an important role in its
detection capability and non-interference with normal user activities. While the locations
that yield the least interference depend on the legitimate user’s file system access patterns,
there is clearly room for placing decoys under directories, so that high detection rates can91

CHAPTER 4. EVALUATION OF DECOY DOCUMENT PROPERTIES
be achieved with very low interference rates.
Figure 4.12: Number of Decoy Document Accesses
4.3.3.6 Conspicuousness Comes First:
In order to understand how effective each decoy file was in catching masqueraders, I have
ranked the decoy files based on the probability of an attacker accessing them in Figure 4.13.
Recall that an access in this case refers to viewing, editing, copying, zipping, or moving
the decoy file. Considering Figure 4.13 and the table in Appendix C, the top three decoy
files that are most likely to be accessed by an attacker reside on the Desktop. These three
files reside respectively in the Important, Notes and Insurance directories. The first file is a
payment receipt. The second file includes a budget plan, and the third file is a copy of test
results from a medical lab. Other decoys with contents similar to the contents of decoy 18,
such as decoys 4 and 5 which constitute payment receipts also, did not achieve the same
detection capability as decoy 37. This leads us to the conclusion, that conspicuousness is
more important than enticingness. Although the attackers were mostly after information
with financial value, they were more likely to access files with health-related information,
which were highly conspicuous (located on the desktop), than other decoys with more92
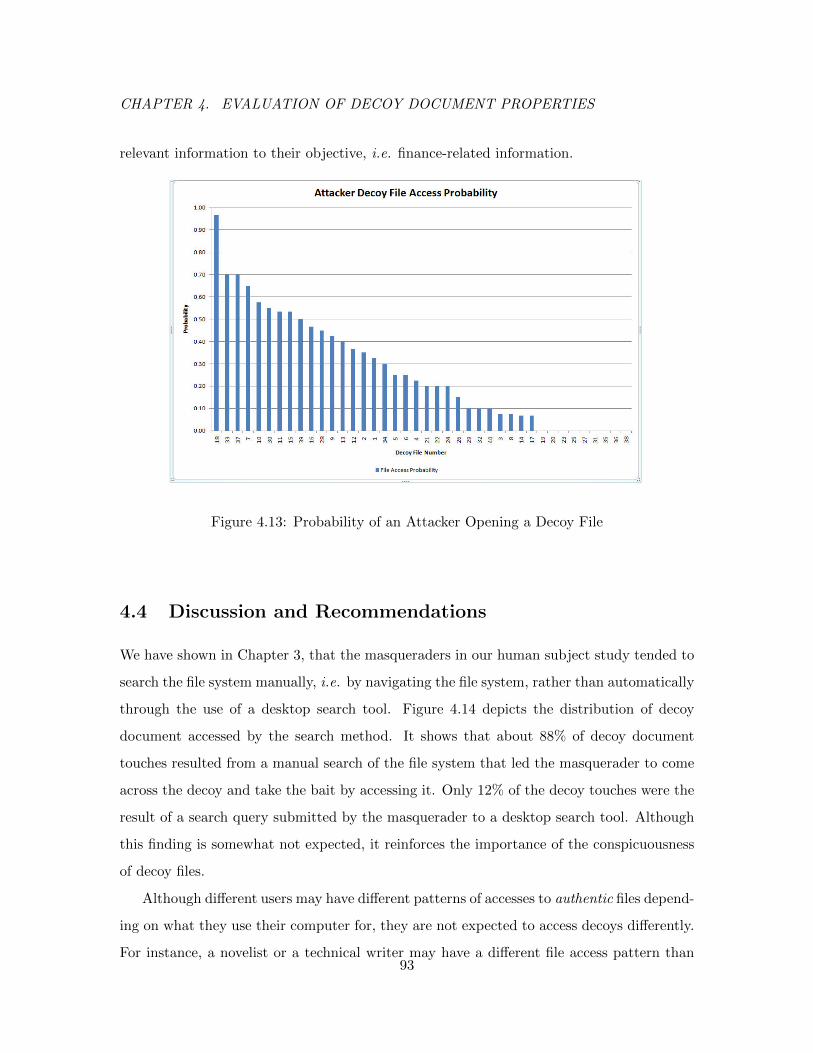
CHAPTER 4. EVALUATION OF DECOY DOCUMENT PROPERTIES
relevant information to their objective, i.e. finance-related information.
Figure 4.13: Probability of an Attacker Opening a Decoy File
4.4 Discussion and Recommendations
We have shown in Chapter 3, that the masqueraders in our human subject study tended to
search the file system manually, i.e. by navigating the file system, rather than automatically
through the use of a desktop search tool. Figure 4.14 depicts the distribution of decoy
document accessed by the search method. It shows that about 88% of decoy document
touches resulted from a manual search of the file system that led the masquerader to come
across the decoy and take the bait by accessing it. Only 12% of the decoy touches were the
result of a search query submitted by the masquerader to a desktop search tool. Although
this finding is somewhat not expected, it reinforces the importance of the conspicuousness
of decoy files.
Although different users may have different patterns of accesses to authentic files depend-
ing on what they use their computer for, they are not expected to access decoys differently.
For instance, a novelist or a technical writer may have a different file access pattern than93

CHAPTER 4. EVALUATION OF DECOY DOCUMENT PROPERTIES
Figure 4.14: Decoy File Touch Distribution By Search Method
someone who writes music, makes videos, or runs large statistical analyses. However, these
users are not necessarily more or less likely to access self-planted decoys than others. The
results are not expected to vary based on the user’s file access pattern as long as the decoys
are strategically placed by the user according to the guidelines and best practices described
in this chapter. However, I note that the threat model I considered focused on attackers
looking to steal PII information. If a computer is used for business for instance, it may
contain intellectual property information or other highly confidential files, besides PII in-
formation. The optimal number of decoys required in this case may slightly change in order
to effectively cover the various types of files and directories that a masquerader might be
interested in stealing information from.
Below, I list a few recommendations related to the deployment of decoy documents for
effective masquerade attack detection based on the findings of the human subject studies.94

CHAPTER 4. EVALUATION OF DECOY DOCUMENT PROPERTIES
4.4.1 Recommendation 1
While, the detectability property of the decoy documents is the most important property,
the second user study has shown how important the conspicuousness property is. The latter
is even more important than the enticingness property, as revealed by the user study.
I recommend considering the following ranking of decoy properties when designing and
deploying decoy documents for masquerade attack detection. The ranking is based on
decreasing importance of the decoy properties.
1. Detectability
2. Conspicuousness
3. Enticingness
4. Non-Interference and Differentiability
5. Believability
The importance of the variability property varies by attacker sophistication. Similarly,
the importance of the decoy shelf-life depends on the deployment environment.
4.4.2 Recommendation 2
While the number of false positives varies widely by user and by decoy document location,
overall less than 1 false positive per user per week was recorded on average. This is a very
encouraging number, but it could be reduced even further with more intelligent placement
of the decoy documents. For example, the decoy files placed under the My Pictures and My
Music directories could be accessed by applications scanning the file system for picture or
music files respectively. Such accesses are not deliberate accesses by the legitimate user and
could be avoided, if the decoy files were placed under directories that do not get scanned
by such applications by default.95

CHAPTER 4. EVALUATION OF DECOY DOCUMENT PROPERTIES
4.5 Conclusion
4.5.1 Chapter Summary
In this chapter, I presented an experimental evaluation of the different deployment-related
properties of decoy documents. I also made a few recommendations based on the find-
ings from my experiments. These recommendations should guide the deployment of decoy
documents for effective masquerade attack detection. By way of summary, I presented:
• a host-sensor that detects access to decoy documents when loaded in memory using
stealthy HMACs embedded in the decoy documents,
• a measurement of how effective decoys can be in detecting masquerade activity,
• an investigation of the trade-offs between deployment properties of decoy documents
when applied to the masquerade attack detection problem through human subject
studies, and
• a set of recommendations for the effective use of decoy documents for masquerade
attack detection.
4.5.2 Future Work
In my future work, I will repeat the human subject studies in different environments other
than universities, in order to determine to what extent my results are generalizable.
I will also evaluate other decoy document properties, including the believability of doc-
uments. Furthermore, I will investigate the decoy document properties for masquerade
attacks perpetrated through the installation of rootkits and malware such as Torpig. Fi-
nally, I will study how attacker behavior changes based on the attacker’s knowledge about
the monitoring mechanisms running on the victim’s system and the perception of risk and
expected financial gain.
96

CHAPTER 5. DIVERSIFYING DETECTION APPROACHES
Chapter 5
Diversifying Detection Approaches
In this chapter, I investigate the combination of search behavior anomaly detection with
the monitoring of trap-based decoy files. I evaluate the effect of the combined detection
approach on detection accuracy. I postulate that this provides stronger evidence of malfea-
sance, and therefore improves the detector’s accuracy. Not only would a masquerader not
know the file system, they would also not know the detailed contents of that file system
especially if there are well placed traps that they cannot avoid. I conjecture that detecting
abnormal search operations performed prior to an unsuspecting user opening a decoy file
will corroborate the suspicion that the user is indeed impersonating another victim user.
Furthermore, an accidental opening of a decoy file by a legitimate user might be recognized
as an accident if the search behavior is not deemed abnormal. In other words, detecting
abnormal search and decoy traps together may make a very effective masquerade detection
system 1.
5.1 Introduction
In the previous chapter, I studied the placement of decoy files in order to maximize the
detection probability and speed of fraudulent activity on a local file system. Monitoring
decoy files alone however, may not provide enough evidence for fraudulent activity. A
legitimate user may accidentally access a decoy file, or a masquerader may be able to
1Portions of this chapter were published in [Bowen et al., 2009a].97

CHAPTER 5. DIVERSIFYING DETECTION APPROACHES
escape detection if the decoy files are not well-placed on the file system. Several measures
can be taken to maximize the likelihood that an adversary stumbles upon the decoy file,
such as increasing the conspicuousness and enticingness of the file [Bowen et al., 2009b;
Ben-Salem and Stolfo, 2011a]. However, the risk that an intrusion goes unnoticed or does
not get detected quickly enough still exists. Moreover, if the adversary knows that the
system is baited, he or she may be more careful with accessing decoy files. For these
reasons, I propose to supplement monitoring access to decoy files on a host with profiling
user behavior in order to get more coverage for suspicious activity that could be indicative
of a masquerade attack.
On the other hand, anomaly detectors suffer from low accuracy, and particularly from
high false positive rates. Combining several base classifiers into one ensemble classifier
should aid in overcoming this shortcoming. Each classifier uses a different modeling algo-
rithm to profile user behavior. Base models can be aggregated by learning from labeled
data or by achieving consensus among the individual models. The ensemble methods out-
put collectively one classification label that reflects the meta-learning from these models or
the consensus amongst them.
Techniques for creating ensemble classifiers using multiple diverse classifiers have been
studied extensively [Chawla et al., 2001; Dzeroski and Zenko, 2002; Dietterich, 2000; Domin-
gos, 2000]. The objective of using such ensemble methods is to improve robustness and
classification accuracy over single-model methods. Improvement in classification accuracy,
however, can be achieved only if the base models are mutually independent. This conditional
independence assumption may not always hold true though.
In the absence of the independence condition, how effective are these ensemble anomaly
detectors, i.e. how effective is model diversity? Tan and Maxion studied the effects of
using diverse anomaly detection algorithms on detector performance [Tan and Maxion,
2005]. They investigated how various sequence-based anomaly detectors dealt with a spe-
cific anomaly, namely a ‘foreign’ sequence, i.e. a sequence that has never been seen during
the training phase of the detection algorithm. Their results showed that limited perfor-
mance/anomaly coverage gains can be achieved by combining various anomaly detection
algorithms. The anomaly coverage gains are mostly seen at the edges of the anomaly space.98

CHAPTER 5. DIVERSIFYING DETECTION APPROACHES
This indicates that such gains are highly dependent on the characteristics of the detected
anomaly and on the parameter settings of the anomaly detector. Furthermore, these limited
gains may not justify the additional classifier training and deployment cost and performance
overhead that are likely introduced through the combination of different classifiers.
Moreover, if the anomaly space of various classifiers is mostly overlapping, the ensemble
method does not offer any additional protection mechanism against evasion attacks. Note
that anomaly detectors are subject to mimicry attacks, where the attacker tries to mimic
the legitimate user’s behavior. In this case, the attacker’s activities will not be detected as
abnormal, and consequently the attacker can escape detection. If the different classifiers
have highly overlapping anomaly spaces, then, when mimicking normal user behavior to
successfully evade detection by one classifier, an attacker is likely to escape detection by the
other classifiers. Combining different classifiers in this case does not constitute a defense
mechanism against mimicry attacks.
To overcome the limitations of model diversity, I propose diversifying the detection
techniques. I combine the following two detection techniques for the purpose of detecting
masquerade attacks: (1) the user search behavior profiling technique presented in
Chapter 3, and (2) the baiting technique presented in Chapter 4, where access to decoy
documents is monitored. Decoys files are strategically placed by the legitimate user in his
or her own file system. The user is not supposed to touch these files after installing them
on his or her system. Any access to these decoy documents is then considered indicative of
masquerade activity and triggers an alert.
The two detection techniques are orthogonal. Recall that I conjectured that, if a
masquerade attack takes place, it can be manifested in both data streams that are monitored
and modeled by the individual detection techniques, namely user search behavior on the
victim’s system, and touches to decoy documents. Despite this, the two data streams remain
relatively independent in the absence of masquerade attacks. Based on this conjecture, I
show that combining the two techniques can be used to improve the accuracy results of
a masquerade attack detector. The search behavior profiling approach alone achieved a
100% detection rate with a 1.12% FP rate [Ben-Salem and Stolfo, 2011b]. My objective
is to substantially reduce this FP rate, without significanlty affecting the true positive or99

CHAPTER 5. DIVERSIFYING DETECTION APPROACHES
detection rate. I also show that the combination of the two techniques can be used as a
defense mechanism against evasion attacks targeted at any user behavior anomaly detector.
5.2 Motivation and Approach
In systems, the concept of diversity is applied to system design, process, as well as argu-
ment diversity. Similarly, in anomaly detection, diversity can be applied along different
dimensions listed below:
1. Diversity in the design of IDSs, thus providing reliability when sensors are subject to
the same software/system attack.
2. Diversity in modeling algorithms, as some algorithms are more suitable for certain
user profiles and behaviors than others. For example, support vector machines, while
making very effective classifiers in the general case, may not make the best classifier
in the case of a user whose behavior is closest to the ‘average’ user behavior as has
been demonstrated in our prior work [Ben-Salem and Stolfo, 2010].
3. Diversity of features used by one modeling algorithm in order to accurately model the
unique and distinct user behavior.
4. Diversity of data streams and events used for modeling by the anomaly detector.
‘Algorithmic diversity’ does not necessarily improve detection accuracy due to the highly
overlapping anomaly spaces [Tan and Maxion, 2005]. However, combining diverse and
orthogonal detection technique may provide such improvements.
5.2.1 Detection Approach
A sensor was developed to detect data theft attempts performed by masqueraders on single-
user systems. The sensor may be expanded to detect ‘need-to-know’ policy violations per-
petrated by traitors on multi-user systems, such as file servers. We refer to this sensor as the
RUU (Are You You?) sensor. The RUU sensor is composed of two sensors. The first sensor
is the User Search Behavior (USB) sensor which uses the modeling approach described in100

CHAPTER 5. DIVERSIFYING DETECTION APPROACHES
Chapter 3. As its name indicates, this sensor profiles user search behavior, and detects any
abnormal search activity. The second sensor is the Decoy Documents Access (DDA) sensor
described in Chapter 4, which monitors any access to the decoy documents embedded in the
file system. It acts as an oracle to the USB sensor. The sensor also includes a monitoring
infrastructure, which I describe in Section 5.5.1. The monitoring infrastructure ensures that
the sensor does not get tampered with.
The integrated RUU sensor provides three mitigation strategies when it suspects mali-
cious masquerade activity. These strategies can be selectively implemented depending on
the confidence level of the sensor that malicious activity is taking place:
1. Sending an alert message to a remote server
2. Displaying a set of challenge-response questions that the user must correctly respond
to: The answers to these questions are given by the owner of the system during the
installation of the sensor.
3. Stealthily recording audio and taking a picture, if a webcam is available: The data
will be kept on the system and could be used as evidence against the malefactor if a
masquerade attack did indeed take place.
Here I describe how each component of the RUU sensor works, and how the USB and
DDA sensors are integrated in order to detect masquerade attacks.
5.2.1.1 USB Sensor
The USB sensor implements the modeling and detection approaches described in Chapter 3.
It detects abnormal user search behavior after profiling user actions and forming a baseline
of search behavior. Then, it detects abnormal search behaviors that exhibit large deviations
from the baseline. Such deviations signal a potential masquerade attack.
The sensor builds a one-class Support Vector Machine model that profiles the user’s
search behavior. Vectors with three search-related features are extracted for each two
minute quantum of user activity. Recall that the three search behavior-related features
described in Section 3.5.1 are:101

CHAPTER 5. DIVERSIFYING DETECTION APPROACHES
1. The number of automated search-related events
2. The number of file touches
3. The percentage of file system navigation user actions
I identify two thresholds per user model which I use to classify the observed user search
activity as normal, abnormal, or non-identifiable. The first threshold thr1 is determined
empirically, so that the miss rate or false negative rate is minimized. A second threshold thr2
is also set to minimize the FP rate. During the detection phase, I continuously monitor user
search activity, and extract a feature vector v every two minutes. I measure the deviation
d between current user behavior (as capture in vector v) and the historical user behavior
as defined by the user model u. The distance d is compared to thr1 and to thr2 in order
to determine whether there is enough evidence for masquerade activity. Further details are
given in Section 5.2.1.3 .
5.2.1.2 Monitoring Access to Decoy Documents
I use the decoy documents described in Section 4.1.1 and downloaded from the Decoy
Document Distributor (D3) [Bowen and Hershkop, 2009] to bait the masquerader. Recall
that the DDA sensor detects when decoy documents are being read, copied, or zipped by
validating the HMAC tag embedded in the header section of the file.
During the deployment of the decoy documents, the user can take certain actions to
increase the conspicuousness and the enticingness of these decoys. For instance, the user
can strategically place them in the file system so that they are easy to spot. Furthermore,
the user can protect them using passwords to increase their enticement. They can also
carefully choose the file names so that they are easily recognizable as decoys for him or
her, while remaining enticing for the adversary. For instance, the file name could include
the name of a person who is outside the social network of the user. This would make the
file easily recognizable as a decoy file for the user, but could make it intriguing for the
attacker. Also, during deployment, the user tags all non-decoy documents on the file with
a random tag, that is indistinguishable from the HMAC tag of the decoy document. This
is done so that a more knowledgeable attacker cannot distinguish the decoy files from the102

CHAPTER 5. DIVERSIFYING DETECTION APPROACHES
normal files by editing them using a hex editor and looking for the HMAC tag within the
document. Moreover, file indexing during the deployment phase can reduce potential false
positive alerts. False positives may arise when the user submits search requests that would
require indexing processes to access the decoy files.
Other actions can also be taken to reduce the interference of these decoys with the
user’s normal activities and to minimize false alerts by the sensor that are not related to
masquerade activities. I already presented some recommendations and best practices for
maximizing the effectiveness of decoy documents in detecting masquerade activity based on
the human subject studies presented in the previous chapter.
5.2.1.3 Integrated Masquerade Detection Approach
I use the DDA sensor as an oracle for the USB sensor. I explained in Section 5.2.1.1 that
two detection thresholds are defined for each user search model thr1 and thr2. Recall that
thr1 is set, so as to minimize the miss rate or false negative rate. If the user behavior
captured in feature vector v is similar enough to the user model u which captures the user’s
historical behavior, then the user behavior should be deemed normal. In other words, if
the distance d between the v and user model u is smaller than thr1, then no masquerade
activity is suspected, and no alert is generated. If, on the other hand, feature vector u
exhibits a highly abnormal search, i.e. if d > thr2, then an alert is generated. However,
if thr1 < d ≤ thr2, then the USB sensor checks whether any excessive access to decoy
documents has been recorded by the DDA sensor. If so, then an alert is generated and
the right mitigation strategy is initiated. Otherwise, the user search activity is not deemed
suspicious enough. Figure 5.1 describes the overall decision process related to masquerade
alert generation using the two sensors.
5.3 Experimental Evaluation
5.3.1 Dataset
Recall that I use the RUU dataset which consists of both normal user data and simulated
masquerader data. The normal user data has been collected for 18 users over a period of one103

CHAPTER 5. DIVERSIFYING DETECTION APPROACHES
Figure 5.1: Alert Generation Decision Process
week on average, while simulated masquerader data has been collected for 40 masqueraders.
To gather the latter dataset, I ran four experiments as detailed in Chapters 3 and 4. I started
with 40 decoy files in the first experiment and randomly selected 10 participants from the
volunteers to act as masqueraders. In the second experiment, I reduced the number of
decoy files to 30, all located in the top 30 most popular locations selected by the normal
user population. Similarly, the third and fourth experiments included 20 and 10 decoy files
respectively.
5.3.2 Experimental Setup
I use 80% of the data to train one-class SVM models using the three search-related features.
I used the LibSVM tool kit to build the models [Chang and Lin, ]. I build a linear decoy
access classifier for each user, which checks the history of accidental accesses of the user to
the decoy documents on his or her file system. Based on this historical behavior, I select
a threshold, beyond which access to decoy documents is considered excessive or suspicious,
in other words indicative of masquerade acivity. These models are also developed for each104

CHAPTER 5. DIVERSIFYING DETECTION APPROACHES
individual user by using 80% of the decoy access data. The remainder of the user data, as
well as the simulated masquerader data, are used for testing the user models.
5.3.3 Detection Accuracy
I ran an experiment where I supplemented the one-class user search behavior models with a
linear classifier based on decoy file accesses, as described in Section 5.2.1.3 and Figure 5.1.
Table 5.1 shows that using this combined or integrated approach achieves a 99.94% detection
rate or TP rate with a 0.77% FP rate. The TP rate is almost equivalent to that achieved by
the search profiling approach only, while the FP rate is 36% lower. The FP rate translates
to one false positive every 260 minutes, or every 4 hours and 20 minutes, as opposed to one
false positive every 180 minutes or 3 hours.
Table 5.1: Experimental Results of the Search Profiling and Integrated Modeling Ap-
proaches using 2-minute Quanta for Feature Vector Extraction
Method True Pos. (%) False Pos. (%)
Search Profiling 100 1.12
Combined Approach 99.94 0.77
I can further reduce the frequency of false positives to one every 512 hours approximately
(338 minutes), if I use the same modeling approach over 5-minute quanta. This is derived
from the 1.48 false positives recorded every 5*100=500 minutes, as reported in Table 5.2.
While this is still a relatively high frequency of false positives, it can be even further reduced
if I increase the look-ahead time window where I check for decoy accesses. Recall that I
postulated that detecting a high-volume search followed by a decoy file access corroborates
the suspicion that the user is impersonating another victim user. In the current modeling
scheme using 2-minute (or 5-minute) time epochs, I account for decoy accesses that happen
simultaneously with abnormal search actions only. If I use a lookahead window to check
for potentially imminent decoy file accesses, I can improve the accuracy performance even
further.
To compare the individual classifiers for each user using the two detection schemes, I
build a ROC curve for each classifier and calculate the corresponding AUC score for each.105

CHAPTER 5. DIVERSIFYING DETECTION APPROACHES
Table 5.2: Experimental Results of the Search Profiling and Integrated Modeling Ap-
proaches using 5-minute Quanta for Feature Vector Extraction
Method True Pos. (%) False Pos. (%)
Search Profiling 100 2.38
Combined Approach 100 1.48
Figure 5.2 displays the AUC scores achieved by both detection approaches by user model.
The results show that each user model using the combined detection approach achieves a
higher or equal AUC score, i.e. equal or better accuracy results than the user model based
on the search profiling approach alone. The best accuracy improvements are achieved for
users 5, 11, 13 and 14. These user models scored the top four FP rates amongst all user
models based on search profiling alone. For these specific users, the FP reduction rates
ranged between 33% and 67% when using the combined detection approach. This confirms
the efficacy of using this combined approach to limit the number of false positives and
improve the accuracy of the masquerade attack detector.
Figure 5.3 depicts the relationship between the frequency of the occurrence of false alerts
and the length of the modeling epoch. The figure shows that the longer the modeling epoch,
the lower the frequency of false alerts issued by the masquerade detector for 100% detection
rates.
5.4 Defending Against Evasion Attacks
Any anomaly-based intrusion detection system (AIDS) is subject to mimicry attacks. Tan
et al. [Tan et al., 2002] identified two mechanisms for performing mimicry attacks: (1)
contaminating the learning and/or model update process by inserting attack data into
normal user data, and (2) intertwining attacks with normal user activity so that the attacks
go undetected, which is also known as an evasion attack. I assume that the classifier
training process has not been subject to a poisoning or data contamination attack, and
focus the analysis here on evasion attacks. Wagner and Soto listed six types of evasion
attacks against host-based intrusion detection systems using a malicious sequence of user106

CHAPTER 5. DIVERSIFYING DETECTION APPROACHES
(a) Modeling Using Feature Vectors per 2-minute
Quanta
(b) Modeling Using Feature Vectors per 5-minute
Quanta
(c) Modeling Using Feature Vectors per 15-minute
Quanta
Figure 5.2: AUC Comparison By User Model for the Search Profiling and Integrated De-
tection Approaches
commands or system calls as previously noted in Section 2.5. Most of these attacks do not
apply to the RUU sensor, as I model only frequencies of user activities and not sequences
of user commands. Below I discuss whether the RUU sensor is vulnerable to these attacks.
1. The lip under the radar attack: The attacker avoids causing any change to the observ-
able behavior of the application, i.e. he or she does not launch any processes that the
legitimate user would not normally run. The attacker uses already running processes
only, and at the same rate, as the victim user. This is equivalent to the ‘slow-and-low’107

CHAPTER 5. DIVERSIFYING DETECTION APPROACHES
Figure 5.3: False Alert Frequency By Modeling Epoch Length
attack. When trying to evade the RUU sensor, the attacker would then have to refrain
from engaging in any large-scale search activities. He or she would also have to access
files at a slow rate, so that his or her activity goes undetected. Consequently, it would
take them longer to find any interesting or relevant information that could be stolen.
Although masquerade activity in this case would take much longer, the adversary is
still very likely to access decoy files. Based on the human subject studies described
in Chapter 4, every attacker who accessed the victim’s system was detected within 10
minutes, regardless of his or her search behavior. The user study results demonstrated
that 90% of masqueraders could be detected by monitoing decoy files accesses alone
with 98% confidence as noted in Chapter 4.
2. The be patient attack: The attacker waits for the time when the malicious sequence
is accepted. The RUU sensor does not implement sequence-based modeling, and,
therefore, is not vulnerable to this type of attack.
3. The be patient, but make your own luck attack: The same argument applied to the
previous attack is valid also for this attack.
4. The replace system call parameters attack: This is also not applicable to the RUU
sensor as the detection approach does not rely on monitoring system calls.108

CHAPTER 5. DIVERSIFYING DETECTION APPROACHES
5. The insert no-ops attack: Since the features used by the USB sensor are based on
frequencies of certain user-initiated activities and processes rather than on modeling
sequences of system calls, inserting does not have a significant impact on the RUU
sensor, and can potentially only slow down user activities. An extreme case of this
could turn into a slow-and-low attack, which I discussed under the first type of evasion
attacks.
6. The generate equivalent attacks attack: An attacker might decide to load the entire
search index file at once into memory and directly read it instead of searching for files
using the desktop search tool user interface. This would reduce the number of user
search actions detected by the RUU sensor, and may impact its ability to detect the
attacker’s fraudulent activity if relying on modeling search behavior only. Again in
this case, monitoring accesses to decoy files becomes more significant in detecting the
attacker’s activity.
I conjectured that combining the baiting technique with the user search behavior pro-
filing technique serves as a defense mechanism against mimicry attacks, or evasion attacks
in particular. I assume that user models and training data were not contaminated with
masquerader data during the model training or update phases. In order to validate my
conjecture, one would ideally have a masquerader mimic a legitimate user’s behavior. How-
ever, when simulating masquerade attacks as described in the ‘capture-the-flag’ exercise, it
was extremely difficult to make the volunteers participating in the user study mimic the
behavior of a specific user. To evaluate my conjecture though, I reviewed all search be-
havior models and identified the user who had the most similar search behavior to that
exhibited by masquerade attackers. To identify this user, I measured the similarity between
the legitimate user behavior and masquerade behavior by applying the probability product
kernel to the distribution of their feature vectors [Jebara et al., 2004]. User 13 showed the
closest behavior to that of masqueraders as can be seen from Figure 5.4. This figure depicts
the distribution of the three search-related features for user 13, and for all masqueraders
combined. I can support my conjecture by reviewing the results achieved by this user’s
model in Figure 5.2, which are indeed significantly better than the results achieved using109

CHAPTER 5. DIVERSIFYING DETECTION APPROACHES
the search behavior modeling technique alone, particularly when I extend the monitoring
and modeling window to 15 minutes.
Figure 5.2(c) clearly shows how all attacks are detected for user 13 when using the
combined detection approach, while a high number of false positives are still recorded if
only the search profiling approach is used.
One might expect that hardening the detector against mimicry attacks could drive
higher FP rates. The experimental results show the opposite effect. Figure 5.5 helps in
understanding how this can be achieved. When using the search profiling approach only,
the circular point above the threshold line in Figure 5.5(a) triggers a false positive. If I use
a lower threshold beyond which search behavior is considered suspicious as in Figure 5.5(b),
I can widen the anomaly space for the detector. This in turn means that the adversary
has to work harder in order to faithfully mimic the legitimate user’s behavior. However,
this alone may introduce false positives. By combining search profiling with the baiting
technique, I can use a second threshold for the highly abnormal search behavior, beyond
which a 100% TP rate is achieved. For points that fall in the ‘ambiguous’ space between
the two thresholds, the access to decoy information can be used to inform the classification
decision. The key to this process is the use of decoy documents that are strategically placed,
highly-enticing and conspicuous in the file system, so that the attacker is very likely to touch
them. The ‘capture the-flag’ exercise showed that all masqueraders did indeed touch at least
one of the placed decoy files as reported in Figure 4.10.
5.5 Sensor Architecture
In Sections 5.2 and 5.3 of this chapter, I discussed how I combine the USB and DDA
sensors into one classifier, the RUU sensor, which makes a single classification decision. In
this Section, I present the remaining components of the RUU sensor. The full host sensor
is shown in Figure 5.6. Besides the USB and DDA sensors, one of the main components of
the RUU sensor is its integrated monitoring infrastructure,which serves for the detection of
any tampering attempts.110

CHAPTER 5. DIVERSIFYING DETECTION APPROACHES
(a) Feature Vectors for User 13
(b) Feature Vectors for Masquerade Attackers
Figure 5.4: Feature Vectors for User 13 and Masquerade Attackers
111

CHAPTER 5. DIVERSIFYING DETECTION APPROACHES
(a) Search Profiling Classifier Example
(b) Search Profiling and Baiting Classifier Example
Figure 5.5: Anomaly Space for the Search Profiling and the Combined Approach Classifiers
5.5.1 Sensor Monitoring Infrastructure
Research shows that host sensors are increasingly being disabled by malware [Llet, February
9 2005], and could similarly be disabled by masqueraders. In order to prevent, or at least
detect any tampering attempts directed against the RUU sensor, I implemented a set of self-
monitoring monitors that monitor the critical processes of both sensors. The monitors can
be shutdown only using a unique random sequence that is accessible only to the legitimate112

CHAPTER 5. DIVERSIFYING DETECTION APPROACHES
Figure 5.6: Architecture of the RUU Masquerade Attack Sensor
user of the system, on which the host sensor is running. Any attempt to shutdown the
sensor or one of the monitors not according to the right shutdown sequence results in an
alert and is highly indicative of potential malicious activity on the system.
Several solutions for tamper-proofing software exist as noted in Section 2.6. They are
designed to prevent the unauthorized use of software, but they could presumably be easily
modified to detect unauthorized attempts to disable or shutdown the software. However,
they all require the presence of a third party that can execute code for verification. More-
over, they are computationally expensive, and if used with the RUU sensor, they could
significantly slow it down to the point where it becomes vulnerable to overload attacks. In
my work, I seek to protect the sensor from being illegitimately disabled, without necessarily
having to rely on a third party for monitoring. To that extent, I use a novel approach
based on a set of self-monitoring monitors and inspired by the mechanisms used in safety
devices for nuclear weapons [Laboratories, 1992; Plummer and Greenwood, 1998], which
were designed to prevent the unauthorized launch of such weapons.
Given that adversaries may be aware of system monitoring, special care must be taken113

CHAPTER 5. DIVERSIFYING DETECTION APPROACHES
to prevent the sensor from being shut down or to detect when it gets shut down. To that
extent, a random directed cycle of n monitors, x1 through xn protects the RUU sensor as
proposed by Chinchani et al. [Chinchani and Upadhyaya, 2003] and Stolfo et al. [Stolfo et
al., 2009]. The directed cycle of monitors is created based on a seed known only to the
owner of the system. It defines a unique shutdown sequence that must be followed in order
to shut down the sensor without any alerts.
Let xi be the monitor watching the critical process of the sensor, where 1 ≤ i ≤ n. If
an attacker attempts to shut down the critical process, xi will issue an alert. Monitor xi is
itself monitored by xj as defined by the directed cycle of monitors, where 1 ≤ j ≤ n, and
i 6= j. So if xi is shutdown by the attacker, xj issues an alert. Therefore the attacker has
to know the entire shutdown sequence in order to be able to shutdown the sensor and all
monitors without getting detected. The attacker has a 1n! probability of guessing the right
shutdown sequence. So the higher the number of monitors n, the less likely the sensor may
be shutdown without any alert.
In order to prevent an attacker from identifying the right shutdown sequence by observ-
ing inter-process traffic, each monitor pings all other n−1 monitors periodically. Moreover,
all monitors ‘monitor’ the sensor’s critical processes as shown in Figure 5.7, while only
one would actually issue an alert if the sensor is shut down. The threat model assumes
that the time span between process pings is less than the time needed by the attacker to
shut down two processes. In my future work, I will extend the monitoring infrastructure
in order to protect the sensor’s logs, the user behavior model, and the files containing col-
lected evidence. More important, this monitoring infrastructure should be pushed down to
the hardware level in order to prevent any highly-privileged user from shutting down all
monitoring processes at once.
5.6 Sensor Operational Costs
The host sensor performs tasks similar to anti-virus programs. In evaluating the perfor-
mance of the sensor, I use overhead comparisons of anti-virus programs as a benchmark,
since the task of comparing an HMAC code is not substantially different from testing for114

CHAPTER 5. DIVERSIFYING DETECTION APPROACHES
Figure 5.7: Sensor Monitoring Infrastructure
an embedded virus signature. With regard to the resource consumption of the sensor, the
components of the sensor use an average 40 KB of memory during testing, a negligible
amount compared to Symantec’s anti-virus. The additional file access time introduced by
the sensor is unnoticeable when opening or writing document files. It averages 26 ms per
file. Based on these numbers, I assert that the sensor has a negligible performance impact
to the system and user experience.
This overhead can be further reduced. Note that there is a fundamental difference
between the task of detecting malware and that of detecting decoy activity. Anti-virus pro-115

CHAPTER 5. DIVERSIFYING DETECTION APPROACHES
grams are designed to quarantine and prevent the execution of malicious software whenever
any process is initiated. In decoy detection, the objective is merely to trigger an alert when
a decoy file is loaded into memory. Thus, the decoy detection does not need to serialize
execution. For example, it may be executed asynchronously and in parallel by running on
multiple cores, which would reduce the file access delay even further.
5.7 Characteristics of the RUU Sensor
The architectural decisions made during the design phase of the sensor enabled certain
properties and characteristics.
1. High Accuracy, Fast Training, and Low Operational Costs: The use of a
limited number of features by focusing on search behavior helps in constraining the
problem and thus improving detection rates. It also induces a lower runtime overhead,
requires limited system resources, and allows for real-time detection. Furthermore, it
speeds up deployment as profiling in a low-dimensional space reduces the amount of
sampling required to train the detector.
2. Efficient Model Updates to handle Concept Drift: SVMs are suitable for block-
by-block incremental learning. With the advent of new data and the potential need
for updating the model in order to deal with concept drift, SVMs do not have to
be retrained with the whole set of new and old data. Instead, it is sufficient to use
the most recent data for re-training in addition to the support vectors identified in
the old SVM model [Vapnik, 1999; Syed et al., 1999]. This in turn makes the use of
meta-learning techniques using several models easier. The use of such techniques may
be necessary for handling concept drift. Therefore, the choice of SVMs for building
user models helps in satisfying both the low operational costs and the adjustment
to new behavior requirements. Moreover, they enable one-class modeling, another
critical feature of the sensor.
3. Privacy-Preservation: The use of data from multiple users to train classifiers for
masquerade attack detection is complicated and introduces potential privacy threats.116

CHAPTER 5. DIVERSIFYING DETECTION APPROACHES
Furthermore, requiring the mixture of data from multiple users necessitates substantial
retraining of classifiers as users join and leave an organization. The application of
one-class modeling avoids such problems and preserves user privacy, besides reducing
training time.
4. High Accuracy and Protection Against Mimicry Attacks: The perfect detec-
tion rate with a very low FP rate can be attributed to the combination of two comple-
mentary detection techniques. The motivation for user behavior profiling comes from
the fact that user behavior is not readily available for stealing and use (assuming the
historical information profiled is kept secret). The use of an anomaly detector applied
to user behavior, however, may trigger a large amount of false positives, something
that most anomaly detectors suffer from. On the other hand, trap-based techniques
are known for their very low false positive rates. The correlation of search behavior
anomaly detection with trap-based decoy files provides stronger evidence of malfea-
sance, and therefore improves the detector’s accuracy. Furthermore, this combination
of two orthogonal techniques hardens the sensor against mimicry attacks.
5. Tamper-Resistance: The implementation of the self-monitoring monitors protects
the sensor from being disabled by issuing an alert to a remote system or several
systems. It can also protect the collected evidence in case of masquerade attacks as
well as the logs and the user model.
5.8 Conclusion
5.8.1 Chapter Summary
In this chapter, I presented a privacy-preserving sensor for effective and efficient masquerade
attack detection. The sensor has a very high accuracy with very low operational costs, and
was able to detect all masquerade attacks at their onset. It implements a user search profiling
technique with a baiting technique that uses decoy documents embedded in the victim’s
file system. By combining these two orthogonal detection techniques, false positives were
reduced by 36% over the search profiling approach alone. A 99.94% masquerade detection117

CHAPTER 5. DIVERSIFYING DETECTION APPROACHES
rate was achieved with only 0.77% of false positives, the best results ever reported in the
literature.
5.8.2 Future Work
In my future work, I will extend the monitoring infrastructure of the sensor in order to
protect the sensor’s logs, the user behavior model, and the files containing collected evidence.
Protecting the user model is extremely important, and the lack thereof exposes the user
behavior to the threat of being stolen just like other credentials can be. If an attacker
steals a user model, they could craft a mimicry attack against the sensor by poisoning and
contaminating the model.
Another improvement to the sensor involves running the HMAC validation function of
the sensor when opening files in parallel with other code, so that delays are minimized for
the user.
Finally, I also plan on upgrading the sensor, so that it makes use of user feedback for
user model updates. Abnormal user search events, especially those that culminate in an
access to a decoy document, are a cause for concern. A challenge to the user, such as asking
one or a number of personalized questions, may establish whether a masquerade attack
is occurring. If the user answers the challenge questions, the sensor will assume that the
abnormal user search events are indicative of a user behavior change, and will update the
user model accordingly.
118

CHAPTER 6. PERSONALIZED DIVERSIFIED USER MODELS
Chapter 6
Personalized Diversified User
Models
User behavior profiling has been the preferred approach taken in most prior work for de-
tecting masquerade attacks. Various techniques have been used to build user models that
reflect that behavior. However, despite the increasing recognition of the value of diversity
in intrusion and anomaly detection, this concept has not been applied to user models, to
our knowledge, yet. The same modeling technique and the same features are generally used
to build user models. Even detection thresholds may not be user-dependent in many user
models.
User behavior naturally varies for each user. I conjecture that each user has a very
personal way of using his or her computer, and believe that no single model can capture the
inherent vagaries of human behavior. I also posit that diversity in user models through the
selection of different features for different users, not only could enable modeling the unique
behavior of specific users, but could also bring additional detection accuracy gains to the
anomaly detector. I aim to automatically learn a distinct user’s behavior, much like a credit
card customer’s distinct buying patterns. To achieve this goal, I propose diversifying the
features used to build user models. Furthermore, I propose personalizing these features and
customizing them to the behavior of the user in order to accurately model individual and
unique user behavior.119

CHAPTER 6. PERSONALIZED DIVERSIFIED USER MODELS
To that extent, I propose an approach to profile a user’s behavior based on the ‘taxon-
omy’ of Windows applications and user commands presented in Section 3.1.1. Recall that
the taxonomy abstracts the audit data and enriches the meaning of a user’s profile, thus
reflecting the type of activity that the user is performing on the computer. User commands
and applications that perform similar types of actions are grouped together in one category
making profiled user actions more abstract and meaningful. Commands are thus assigned a
type or a class, and classes of user activity are modeled rather than individual user actions.
Furthermore, I use a maximum entropy discrimination approach to determine the classes
of user activity that should be monitored for each user. This approach, which I describe in
the following Section, provides a formal basis for comparing user models and for identifying
the best ‘separating’ or discriminative features to diversify user models.
6.1 Modeling Approach
I postulate that each computer user has their personal way of using his or her computer. For
instance, the activities that the user performs on his or her computer, such as programming,
editing a file, or playing a game, and how frequently he or she engages in those activities, may
be tightly related to his or her job description, or his or her personal preferences. Moreover,
the frequency and speed at which the user emits commands or uses certain applications
may be related to his or her proficiency with those commands or programs. Furthermore,
he or she may have certain habits such as checking e-mail at the beginning of a user session
or checking the online news early in the morning or late in the evening for example.
I use the Windows applications taxonomy to profile user behaviors, since it can readily
identify and model specific computer user activities. The user activity abstraction enabled
by the taxonomy also reduces the number of features extracted to profile user activities,
and therefore decreases computational complexity.
I am interested in all different classes of user activity, and particularly those that reveal
the user’s computer usage habits. For instance, one interesting behavior that I monitor is
user search behavior, as already presented in Chapter 3. Other examples of user behaviors
that I monitor include browsing behavior, networking, and remote access behavior. Again120

CHAPTER 6. PERSONALIZED DIVERSIFIED USER MODELS
the taxonomy allows a system to automatically audit and model a whole class of commands
and application functions corresponding to a specific type of user activity.
Note that modeling classes of user activities, in lieu of modeling the use of specific
applications, eliminates the artificats of the dataset, caused by the collection of data from
different systems. Suppose user A has the Firefox browser installed on their computer,
while user B installed Google Chrome. If I model the use of each browser, then the resulting
classifier can easily identify that the presented data belongs to a different user. Therefore,
it is imperative to model the type of user activity, rather than the application used, in
order to build reliable user models for masquerade detection.
In the following subsection, I describe the feature vectors used for training the user
models.
6.1.1 Feature Vectors
I audit and model the volume and frequency of user activities within epochs or time quanta
of fixed length, assuming that other users will exhibit a different behavior from the legitimate
user. A total of 22 features, displayed in Table 6.1 are therefore extracted for each epoch.
I hypothesize that this could characterize certain users, as some users might start their
session with checking their e-mails, others might prefer to check their online newspaper,
while yet others may prefer to plunge into work as soon as they power their computers on.
6.1.2 Diversified User Behavior Profiling
In the general case of feature selection, select the best predictive features for a classifier
serves two purposes: (1) improving the accuracy of the classifier, and (2) reducing the
computational cost caused by the high-dimensionality of the original feature space. Max-
ion pointed out that most prior profiling approaches apply the same features to all user
models [Maxion, 2005]. I posit that diversifying features by selecting the best features for
a specific user model independently from all other user models improves the overall aggre-
gated accuracy of all classifiers. Furthermore, diversifying the model features also hardens
the classifier against mimicry attacks. Now, an adversary has to identify the specific features
modeled for the individual victim before being able to launch a mimicry attack successfully.121
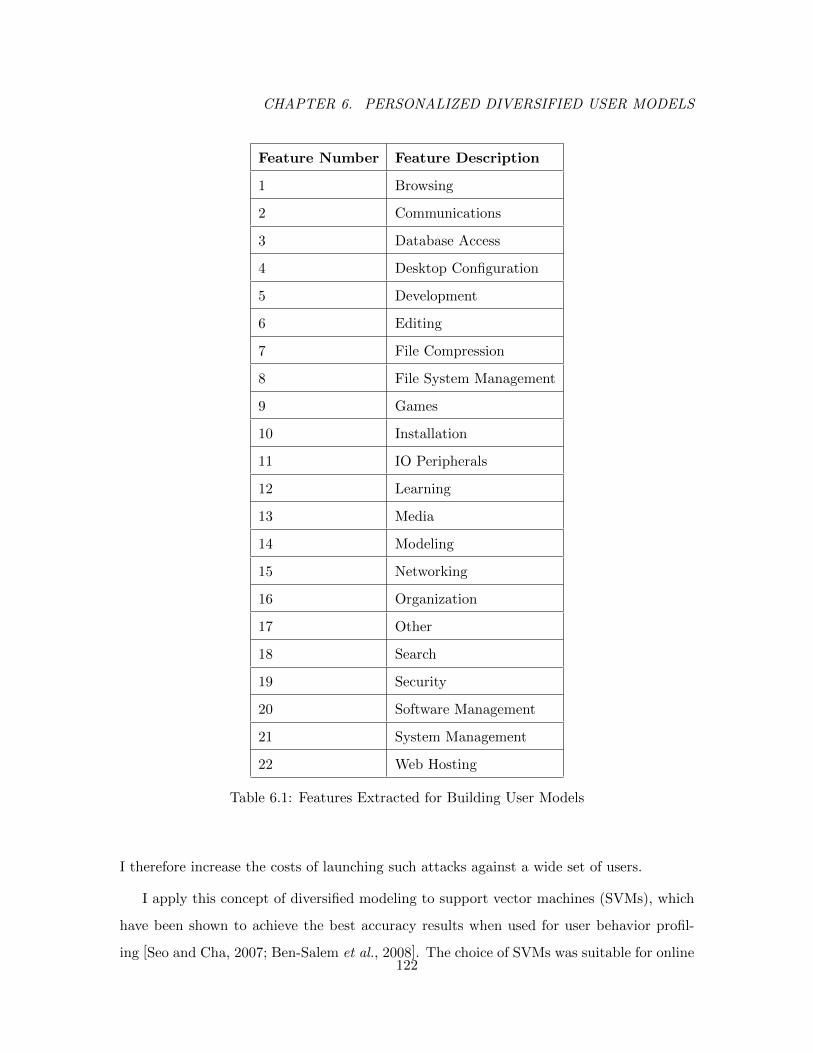
CHAPTER 6. PERSONALIZED DIVERSIFIED USER MODELS
Feature Number Feature Description
1 Browsing
2 Communications
3 Database Access
4 Desktop Configuration
5 Development
6 Editing
7 File Compression
8 File System Management
9 Games
10 Installation
11 IO Peripherals
12 Learning
13 Media
14 Modeling
15 Networking
16 Organization
17 Other
18 Search
19 Security
20 Software Management
21 System Management
22 Web Hosting
Table 6.1: Features Extracted for Building User Models
I therefore increase the costs of launching such attacks against a wide set of users.
I apply this concept of diversified modeling to support vector machines (SVMs), which
have been shown to achieve the best accuracy results when used for user behavior profil-
ing [Seo and Cha, 2007; Ben-Salem et al., 2008]. The choice of SVMs was suitable for online122

CHAPTER 6. PERSONALIZED DIVERSIFIED USER MODELS
learning due to their adequacy for block-by-block incremental learning: With the advent
of new data and the potential need for updating the model in order to deal with concept
drift, SVMs do not have to be retrained with the whole set of new and old data. Instead,
it is sufficient to use the most recent data for re-training in addition to the support vectors
identified in the old SVM model [Vapnik, 1999; Syed et al., 1999].
To implement the concept of diversified modeling, I use the maximum entropy discrim-
ination framework. In the following subsections, I briefly introduce this framework, and
explain how I use it to apply the diversified modeling approach.
6.1.2.1 Maximum Entropy Discrimination Framework
Jebara and Jaakola developed a Maximum Entropy Discrimination (MED) framework for
support vector machines and large-margin linear classifiers, which they later extended to
sparse SVMs and to multi-task SVMs [Jebara and Jaakkola, 2000].
Solving a regular quadratic convex problem returns a SVM model Θ = {θ, b}. The MED
framework can be used to return a distribution of parameter models P (θ) in lieu of a single
parameter value θ, such that the expected value of the discriminant under this distribution
matches the labeling of the feature vectors [Jebara, 2004]. The framework can therefore be
considered as a generalization of support vector machines.
As the developers of the framework note, one can augment the discriminant with a
feature selection switch vector s, which becomes a part of the more complex model Θ =
{θ, b, s} [Jebara, 2004]. The switch vector represents weights corresponding to the features
used to train the model. If the weight is equal to zero, then the corresponding feature is
not included in the model and can be discarded from the input data. I use these augmented
models to select the best features for the user models. This is done for each user model
independently from the remainder of user models.
The model returned by the MED framework can be further augmented to include joint
densities over parameters of several classifiers and feature and kernel selection configura-
tions, rather than parameters of a single classifier only [Jebara, 2011]. This constitutes the
multi-task learning variant of the framework. Instead of learning each classifier or task
independently, one can pool all tasks and corresponding data together to form one global123

CHAPTER 6. PERSONALIZED DIVERSIFIED USER MODELS
prediction problem and learn a single classifier for all of them.
Although the models are conditionally independent given the data, the model represen-
tation used makes them dependent otherwise. Observing the data with the latent shared
parameter s introduces such dependencies among the multiple tasks or classifiers. For exam-
ple, in the simple case of multi-task learning with two models (Θ1 → D1 → s← D2 ← Θ2),
observing the data D1 and D2 links the two user models Θ1 and Θ1 unless the shared fea-
ture binary switch s is also observed. This shared classifiers or shared models setup may be
particularly beneficial in the case of a limited number of training examples for each task.
6.1.2.2 Feature Selection
I use the MED framework in order to select the best features for the user models. I
apply the MED’s feature selection capability in two different ways. The first is to select
the best features for individual user models independently. I call this the independent
learning technique, which results in the diversified modeling approach, as the selected
features for each classifier vary from one user model to another. In the second approach,
I present the MED framework with training data from all the users, i.e. for all classifiers
or tasks, and use it to select the best features for all user models. The MED framework
returns one global solution for all user models where the same features get selected for
all classifiers. I call this the multi-task learning, or more accurately in this case, the
meta-learning approach, since no additional samples are made available to the learner.
Meta-learning improves accuracy through the inter-dependencies between the binary tasks,
and not through additional data samples.
To apply the MED framework, I build a Gram matrix G, whose entries are given by the
kernel function evaluated over all pairs of data points G (x, x) =∑D
d=1 s (d) kd (x, x), where
kd (x, x) = x (d) ∗ x (d) is the scalar product of the d’th dimension of the input data needed
for feature selection. The MED framework will return the optimal weighted combination of
features s.124

CHAPTER 6. PERSONALIZED DIVERSIFIED USER MODELS
6.1.3 Personalized User Behavior Profiling
As explained above, I count the frequencies of user actions corresponding to certain classes
of user activity, within a time window w of fixed length. The average length of a user session
varies from one user to another, and the speed at which they emit user commands and work
with applications also varies.
Therefore, an epoch or time window w of length l may be appropriate for user A, but
could yield poor results when used in building a model for user B, whose average session is
much longer than that of user A for example. In order to improve the accuracy of the user
models, I define a user-specific epoch length. The selected features using the diversified
profiling approach are then extracted within these epochs of length wu for each user u. I
call this the personalized modeling approach, as wu is personalized or customized for
each user.
I use a metric called the Mahalanobis distance to determine the epoch length wu. The
distance is defined as MD(x) =√
(x−mx)′C−1x (x−mx) where x is the feature vector
whose elements are the frequencies of commands and applications with the time window.
The vector mx is the mean vector of frequencies of commands for all the training set. Cx
is the covariance matrix for x. The metric is used to measure the similarity between an
unknown sample set and a target distribution. It takes into account the correlations of the
data set, as opposed to the Euclidean distance. The distance is computed for consecutive
windows using window sizes of various lengths. The best window size wu is selected for each
user u, such that the mean of all distances is minimized after five-fold cross-validation.
6.2 Experimental Setup
To evaluate personalized diversified modeling, I use the portion of the RUU dataset that was
collected for normal computer usage behavior profiling. I implement the MED framework
in Matlab. I follow the approach taken by the authors of the framework, and solve the MED
problem by exploiting a convenient upper bound on logistic-quadratic functions. This effec-
tively turns them into regular quadratic functions, which in turn allows for the application
of standard quadratic programming to solve the MED problem. I used the Mosek software125

CHAPTER 6. PERSONALIZED DIVERSIFIED USER MODELS
package to solve the convex quadratic optimization problem and find the best MED solu-
tion [MOSEK, 2009]. I also interleave bounding the logistic-quadratic function with finding
the support vector machine solution, thus iteratively maximizing the objective function.To
initialize my program, I use white Gaussian priors with zero mean and identity covariance
for user models, and I initialize the binary feature switch vector with Bernoulli priors. The
algorithm used is described in detail in [Jebara, 2011] together with all the optimizations
used.
I start by setting the regularizers α = 0 and C = 1, then I increase both parameters
iteratively until the error is minimized on a cross validation set. C is the regularizer that
bounds the Lagrange multipliers from above in the non-separable classification case, while
α is a regularizer that corresponds to the level of sparsity, and where higher values of α
indicate sparser feature selection. I explore multiple values of C for the independent learner
and multiple values of C and α for the multi-task learner. The final values of C and α
were determined by five-fold cross-validation on held out data and then tested against a
previously unseen data set. To speedup my algorithm, I warm-start each iteration and seed
the SVM solver with a solution from the previous iteration, or from a previous final solution
of the algorithm that converged for a smaller setting of C or α.
6.2.1 Experimental Methodology
I ran three experiments to evaluate the diversified personalized modeling approach. For
each of the eighteen users, I build three user models. For the first user model, parame-
ters and features were selected for each user model independently from all other models.
For the second user model, I pooled all data for all users to select the best features and
model parameters for all users. In this multi-task feature selection exercise, I converted the
problem (and dataset) into eighteen binary ‘one-versus-all-others’ classification problems.
Here, instead of training SVMs on each binary classification, I estimate a feature selection
configuration for the aggregate dataset and have all eighteen SVM models share the same
configuration. This turns the task into a meta-learning problem. All resulting models share
a common feature selection vector s. Therefore the same features are selected and have the
same weights for all user models. Finally, in the third model, I use independent model train-126

CHAPTER 6. PERSONALIZED DIVERSIFIED USER MODELS
ing and feature selection, however with personalized epoch lengths for feature extraction,
as explained in the previous section.
Once the baseline models were computed, they were tested on previously unseen data,
and a threshold was used to determine whether the user activity was deemed as self or non-
self, i.e. performed by a different user. If the user activity was performed by the normal
user, but was classified as performed by some other user by the SVM model, a false positive
was recorded.
6.3 Experimental Results
6.3.1 Diversified Modeling Results
In Figure 6.1, I plot the weights of the twenty-two features (extracted for 10-minute epochs)
in the resulting user models for the feature selection SVMs with α = 24 and after optimizing
over the regularization parameter C for all eighteen user models. As can be seen in the
figure, many feature weights are equal to 0, making the corresponding features ineffective
when classifying user activity as self, or non-self. Most importantly, one can clearly see that
user models for different users emphasize different features. This shows that user activities
vary by user. For example, for user 7, one can conclude that their use of Media applications
makes them relatively distinguishable from other users, while for user 8, their Networking
behavior seems to provide that advantage more than any other behavior.
One can also notice that some features are consistently not good predictors of user behav-
ior, such as features 3, 8, 12, 16, 19, 20 and 22. These features correspond to the Database
Access, File System Management, Learning, Organization, Security, Software Management,
and Web Hosting activities respectively. Note also that the Games feature weight is max-
imized for user 8 and nullified for all other users, confirming my conjecture that different
users use their computers for different purposes, even though the dataset was collected from
a homogeneous group of graduate computer science students.
The feature weights optimized for the multi-task learning approach with a common
feature configuration for all SVM user models are displayed in Figure 6.2. Recall, that
this feature selection method chooses a sparse subset of the twenty-two features that are127

CHAPTER 6. PERSONALIZED DIVERSIFIED USER MODELS
(a) Feature Weights for User Models 1-3 (b) Feature Weights for User Models 4-6
(c) Feature Weights for User Models 7-9 (d) Feature Weights for User Models 10-12
(e) Feature Weights for User Models 13-15 (f) Feature Weights for User Models 16-18
Figure 6.1: Feature Weights by User Model for α=24 and 10-minute long Epochs Using the
Independent Learning Approach
128

CHAPTER 6. PERSONALIZED DIVERSIFIED USER MODELS
consistently good at predicting the label for the 18 different tasks or classes. One can notice
that features 3, 8, 12, 16, 19, 20, and 22 are discarded, while the remainder of the features
are retained with different weights.
Figure 6.2: Feature Weights for Multi-Task Learning Approach
Figure 6.3 depicts the AUC scores for the diversified modeling approach optimized over
the feature selection level α. The figure also shows the AUC scores for the traditional SVM
approach, i.e. with no feature selection, and for the meta-learning (or multi-task learning)
with a common feature weight configuration as displayed in Figure 6.2.
The results show that diversifying the features per user model improves the accuracy
of the resulting classifier, when compared to the multi-task learning approach and the
traditional SVMs. While the classification accuracy of these models is not very high, I
stress that I only use a very limited set of features. The user models are also simple and
only based on user activity volumetrics. I do not model any sequences of activities, nor do
I take timing information into account. However, regardless of the overall accuracy of these
models, the results do demonstrate that diversifying the features per user model achieves129

CHAPTER 6. PERSONALIZED DIVERSIFIED USER MODELS
(a) AUC Scores for User Models 1-6
(b) AUC Scores for User Models 7-12
(c) AUC Scores for User Models 13-18
Figure 6.3: AUC Scores by User Model for the Traditional, Diversified and Multitask Mod-
eling Approaches
130

CHAPTER 6. PERSONALIZED DIVERSIFIED USER MODELS
better classification accuracy overall.
In my future experiments, I will use a more extensive set of features. In particular, I
will extract features that measure user activities in a more detailed manner by using the
subcategories of Windows applications, in lieu of the higher-level categories. Furthermore, I
will use timing information to model when certain activities are performed by users. I expect
the use of these features to improve the accuracy of the models overall, regardless of the
machine learning approach used, while confirming the advantage of the diversified modeling
approach. In the following subsection, I investigate whether the results of the diversified
modeling approach can be improved upon by customizing the epoch length, which is used
for extracting feature vectors, to individual user activity patterns.
6.3.2 Personalized Modeling Results
Diversified modeling achieves even better accuracy results when the epoch length, for which
I extract feature vectors, is customized by user. I measure the variability of user activities
for various epoch lengths: 5, 10, 20, and 30 minutes, and select the epoch length that yields
the smallest average Mahalanobis distance computed per Section 6.1.3. I use that epoch
length for extracting feature vectors to build the model for the corresponding user. Once
the feature vectors are extracted, I apply the diversified modeling approach and test the
user models using the same feature weights determined in Section 6.3.1. I call this approach
personalized diversified modeling. Figure 6.4 demonstrates that personalizing the epoch
length improves the accuracy of the resulting classifier. Note that for users 5, 14, and 18,
the diversified model and personalized diversified model achieve the same accuracy, since a
10-minute epoch length was determined as most appropriate for these users. Recall that the
diversified user models presented in Section 6.3.1 are built based on 10-minute long epochs.
6.4 Conclusion
6.4.1 Chapter Summary
In this chapter, I present a new approach for diversifying and personalizing computer user
models, with the objective of profiling unique and personal user behavior. I hypothesize131

CHAPTER 6. PERSONALIZED DIVERSIFIED USER MODELS
Figure 6.4: AUC Scores by User Model for the Diversified and Personalized Diversified
Modeling Approaches
that each user has a unique way of using their computer, a footprint, that is distinguishable
from the behavior of any other computer user. I present a modeling approach that aims to
profile this personal user behavior using a taxonomy of Windows applications, DLLs, and
MS-DOS commands. The taxonomy captures the types of activities that a user performs
on a computer, abstracts them, and enriches the meaning of user activities performed
on the host system. More importantly, the use of the taxonomy significantly reduces
the dimensionality of the feature space, and thereby reduces the complexity of the
computation.
I use the maximum entropy discrimination framework to identify the best discriminative
features for each model, thus diversifying the user models. I further personalize these
models based on the lengths of user sessions and the speed at which users emit commands.
The results show that the personalized diversified modeling approach improves classifier
accuracy. Furthermore, by diversifying the features used and personalizing the user models,132

CHAPTER 6. PERSONALIZED DIVERSIFIED USER MODELS
I make the anomaly detector based on these models less vulnerable to mimicry attacks. The
adversary is now less likely to know the exact features being modeled for the victim user.
While the models I use are built using a very small set of simple features which limits the
accuracy of the resulting classifier, I expect these results to improve when I expand the set
of features and model user activities in more granularity. My plan for further improvements
is briefly explained in the following subsection.
6.4.2 Future Work
My ultimate objective is to build more secure and dependable systems that (de)-authenticate
legitimate users by their behavior, rather than exclusively by their possibly stolen creden-
tials. In my future work, I will continue exploring new features that could be used for
profiling user behavior, so that user models can reflect a user’s truly unique behavior. In
particular, I will account for the time of the day and the time elapsed since the start of a
user session when a user action is performed. Including this information, when building a
user model, helps in capturing individual user habits, such as checking e-mail at the begin-
ning of a user session, etc. I will also refine the user models by adding more granularity to
the classes of user activities. The taxonomy of Windows applications can be further lever-
aged in this regard, so that I model user command sub-categories or sub-classes instead of
modeling the command high-level categories.
133

CHAPTER 6. PERSONALIZED DIVERSIFIED USER MODELS
This page is intentionally left blank.
134

CHAPTER 7. CONCLUSION
Chapter 7
Conclusion
Masquerade attacks resulting in identity theft are a serious computer security problem.
This dissertation introduced a novel approach for detecting masquerade attacks that are
motivated by data theft. As the focus of this thesis has been on effective and efficient
masquerade attack detection, there are several interesting directions for future work. In
the following sections, I review the results, contributions, and limitations of this work, and
propose several directions for future work.
7.1 Thesis Summary
In this thesis, I presented a set of light-weight effective sensors for masquerade attack de-
tection. In doing so, I introduced new ideas and approaches for maximizing the efficiency
and effectiveness of the sensors. I demonstrated that masquerade attacks that are moti-
vated by data theft can be detected reliably, efficiently, and with very low latency. Prior
work on masquerade detection focused on profiling sequences of user commands. Sequence-
based modeling of user command data may not be very scalable considering the poten-
tially unbounded number of possible commands or applications to be modeled especially
in Windows-based environments. Scalability becomes a challenge particularly in multi-user
environments or computationally limited devices.
Access control mechanisms failed in preventing masquerade attacks. Consequently, user
behavior profiling becomes important in detecting these attacks. One advantage of using this135

CHAPTER 7. CONCLUSION
approach for masquerade attack detection is the fact that behavior is not readily available
for stealing and use, unlike any user credentials, assuming that the historical information
profiled is kept secret.
I presented an efficient search-behavior modeling technique specifically developed for
masquerade attack detection. I showed that search volume is correlated with masquerade
activity. A legitimate user of a system should be familiar with the files on the system and
where they are located. Any search for specific files is likely to be targeted and limited.
Whereas, a masquerader, who gets access to the victim’s system illegitimately, and who is
not familiar with that environment, is likely to engage in widespread and untargeted search
and in an information gathering exercise before launching any attack.
While I did not conduct a human psychological study to show that the real intent
could be established by profiling user behavior, I approximated this kind of user study by
conducting a set of user experiments following an established scientific protocol to provide
evidence that monitoring search behavior works well in identifying malicious masqueraders.
My results showed that user search behavior profiling can detect masquerade attacks reliably
with low FP rates and a very low latency. The question of whether the true intent of a user
is established is beyond the scope of this work.
I developed an anomaly-based intrusion detection system using one-class SVM models
trained with vectors using three search-related features to profile users’ search behaviors.
Modeling specific classes of commands and user-initiated events, as opposed to modeling all
classes of commands and events, provided significant operational improvements in detection
performance over prior work. Moreover, reducing feature space dimensionality allowed for
building accurate classifiers, with four days-worth of training data only, thanks to the limited
amount of sampling required. In an operational monitoring system, this also minimizes
the system resources needed by the detector, and allows for real-time masquerade attack
detection. Furthermore, it improves the generalizability of the classifier and enables its quick
deployment, besides reducing its operational costs and footprint. Recall that the average
user model size is about 8 KB when the search-behavior modeling approach is used. That
model size grows to more than 3 MB if an application and command frequency modeling
approach is used.136

CHAPTER 7. CONCLUSION
One of the important strengths of this approach is that detection happens within two
minutes of the malicious activity, thus limiting the harm that the attacker can do. The
victim can immediately take steps to limit the damage when the attack is detected, by
changing his or her online banking passwords or canceling his or her credit cards. If the at-
tack remains undetected for a long time, it is more likely that information gets compromised
and potentially used for monetary gain by the attacker.
My approach is generalizable as it does not specify what bad behavior looks like. Instead,
I model normal behavior only and detect deviations from that behavior. The use of one-
class modeling approach preserves the privacy of the users. A sensor that monitors user’s
actions and violates user privacy would probably not be widely adopted. A masquerade
attack detector has to be able to build and apply user models without sharing any data
collected about the user. This can be achieved using one-class modeling techniques, so no
data sharing is required.
The user search profiling approach achieved a 100% detection rate and with a 1.12%
FP rate, i.e. one false positive every three hours on average. In order to reduce the
frequency of false positives and improve the user experience, wihout negatively affecting
the detection capability of the masquerade detector, I monitored accesses to decoy files
that are strategically placed by the user on his or her own file system. Once the decoys
containing ‘bait information’ are in place, the legitimate users of the system are supposed
to avoid any access to the decoys. Any decoy file access, then, suggests that a masquerader
is trying to access highly enticing information. I note that using this approach alone, I was
able to detect all masqueraders within 10 minutes of launching their attacks. Thirty-five per
cent of masqueraders were detected during the very first minute of their frauduent activity.
I used the access patterns to decoy files as an oracle to validate the alerts issued by
the search behavior profiling sensor, since the correlation of abnormal search behavior with
decoy file touches should provide stronger evidence of malfeasance, and therefore improve
the detector’s accuracy.
Besides detecting masqueraders, placing monitorable decoy files on the system has a
deterrence effect that may not be easily measurable, but that definitely plays a role in
preventing potential masquerade activity by risk-averse attackers.137
CHAPTER 7. CONCLUSION
Combining the two orthogonal techniques also serves as a defense mechanism against
mimicry attacks. Anomaly detection-based techniques are vulnerable to evasion attacks. If
a sophisticated adversary attempts to evade the search behavior sensor by mimicking the
victim’s behavior, he or she is likely to get trapped, as he or she does not know where the
decoys were placed.
I proposed a masquerade attack sensor that integrates the two complementary and
orthogonal techniques that aim to detect evasive adversaries. The diversity of detection
techniques can increase the likelihood of detection of malicious activity and dramatically
reduces the number of false positives associated with a malicious event, typically a challenge
for any anomaly detection system. My results confirmed the improvement in detection
accuracy: the overall FP rate was reduced to 0.77%, while all masquerade attacks were
being detected.
The sensor has a negligible performance overhead. Empirical tests show that the sensor
uses 40 KB of memory only, a negligible overhead compared to Anti-Virus tools for instance.
The detection capabilities of this light-weight host sensor can be further leveraged when
combined with other network-level sensors to cover other insider threat models [Bowen et
al., 2009a].
7.2 Contributions
In summary, the main contributions of this dissertation include the following:
• Taxonomies of Windows applications, DLLs and Linux/Unix user commands that
elicit classes of user activities on information systems. These classes of user activi-
ties can be used to accurately model user behavior, characterize fraudulent behavior,
and tease out the intent of malicious users. Abstracting the user commands and ac-
tions and modeling the classes of user behaviors (as opposed to modeling simple user
commands) enables the reduction of features used for user behavior profiling, and
introduces significant gains in computational complexity.
• A set of search-related features whose limited number reduces the amount of sampling
required to collect training data. Reducing the set of features required for profiling138

CHAPTER 7. CONCLUSION
user behavior enables improved detector accuracy and significant performance gains
over prior user profiling techniques.
• A set of guidelines for conducting user studies applied to cyber-security that
assists researchers in designing and executing generalizable and powerful computer
security-related experiments involving human subjects.
• A real-world Windows dataset made available to the research community for the
study and evaluation of novel masquerade attack detection approaches. The dataset
consists of normal user data collected from a homogeneous user group of 18 individuals
and simulated masquerader data from 40 different individuals. The dataset is the first
publicly available dataset for masquerade attack detection since the Schonlau dataset.
The Schonlau dataset, unlike the RUU dataset, does not include any masquerader
data, and was rather used for the study of author identification problems.
• A set of guidelines, best practices, and recommendations related to the strategic
deployment of decoy documents on local file systems for an effective detection of
masquerade attacks, based on an empirical evaluation of how effective decoys can be
in detecting masquerade attacks.
• A privacy-preserving masquerade attack detection approach based on the integration
of two orthogonal detection techniques: user search behavior profiling and monitor-
ing access to highly-crafted and well-placed decoy documents used to bait attackers.
The approach improves detection accuracy over prior techniques, is less vulnerable to
mimicry attacks, and provides stronger evidence of fraudulent activity.
• A light-weight, privacy-preserving, tamper-resistant host-sensor that detects the onset
of masquerade attacks within two minutes of fraudulent activity. The host sensor
implements the two orthogonal detection techniques and collects potential evidence
that could be used to identify the attacker. The sensor reliably detects masquerade
attacks with a very low false positive rate, a very small footprint, and low operational
costs.139

CHAPTER 7. CONCLUSION
• A diversified and personalized user behavior profiling approach for improved classifier
accuracy and higher user model generalizabiliy.
7.3 Limitations
While the proposed masquerade attack detector offers high accuracy and low detection
latency, we recognize a few limitations for certain attack scenarios. For instance, the sensor,
just like any anomaly-based IDS is subject to a training data poisoning attack, albeit to a
much more limited extent. A training data poisoning attack is an attack whereby the
adversary injects malicious data into the dataset that is used for training the classifier and
building the user model. It leads the machine learning or statistical algorithm used to learn
the wrong model, therefore, eventually classifying potentially fraudulent activity as normal,
and failing to detect masquerade attacks.
The user search behavior profiling sensor is vulnerable to such an attack if the adversary
manages to induce high-volume search activity into the data that is used to train the sensor.
When the detector is deployed, the search behavior profiling sensor may fail to properly
classify extensive file system search by the attacker as abnormal. However, the attacker is
still very likely to access decoy documents, which will be detected by the DDA sensor. This
makes the masquerade attack detector less vulnerable to training data poisoning attacks,
but not completely immune to them.
In Section 5.2.1 I mentioned the possibility of enhancing the detector and adapting it to
multi-user environments. Consider a file server within an enterprise’s network. The detector
can develop user models for all users that have access to the file server, and use them to
detect need-to-know policy violations. In this setting, if an adversary gets access to several
user credentials belonging to different users of the file server, then he or she can impersonate
many users when conducting their attack. He or she can ‘divide’ their fraudulent activity
between different sessions for various victims. By doing so, the attacker may manage to
stay under the radar during each user session by limiting his or her information gathering
activity to normal user search activity levels. However, by aggregating all the information
gathered during the different user sessions, the adversary may be successful in his or her140

CHAPTER 7. CONCLUSION
attack. The same result may be achieved if the masquerader colludes with several malicious
insiders.
7.4 Future Work
7.4.1 Immediate Future Work
In the concluding section of each chapter, I presented several short-term and medium-term
extensions to the masquerade attack detector presented in this work. Here I review some
of the main extensions discussed in the previous chapters.
In most cases, the attacker’s objective is to steal data that could be used for financial gain
from home users or enterprise users, such as financial credentials or intellectual property.
When developing and evaluating the sensor, the objective was to detect masquerade at-
tacks with the purpose of stealing sensitive and confidential data perpetrated by individuals
illegitimately. Many of these attacks resulted in fraud incidents, which affected 11.2 million
consumers in the United States in 2009 according to a Forbes report, causing $54 billion in
ID fraud costs [Greenberg, 2010].
However, many identity theft incidents are caused by malware installed on the victim’s
computer systems. In 2009, researchers, who have monitored the Torpig botnet, affirmed
that within the span of 10 days only, Torpig obtained the credentials of 8,310 accounts at 410
different institutions [Stone-Gross et al., 2009]. Enterprise users have also been targeted by
different malware such as Confickr/Downadup [Higgins, 2009]. I expect the sensor proposed
here to detect data theft attacks caused by such malware, based on the malware’s file
touch, file system navigation, and decoy access patterns, just like human masqueraders get
detected. However, this has to be validated with a new set of experiments, including human
subject studies to study the strategic decoy placement for such threat models.
An interesting problem to study is how to calibrate the modeling and detection frequency
to reduce the detector’s false positive rate with its false negative rate. False negatives in
this context, i.e. an undetected masquerader, are far more dangerous than an annoying
false positive. A thorough evaluation of the right model checking and alerting frequency in
light of average search times on a file system inter alia, is the subject of my future research.141

CHAPTER 7. CONCLUSION
One critical enhancement is the protection of the user model from unauthorized changes.
The user model on the user’s system has to be adequately secured and monitored, just
like the sensor itself, in order to prevent the attacker from modifying the user model and
launching a mimicry attack based on the new model.
Another important enhancement to the sensor, is the integration of user feedback in
model update operations. User feedback is important for distinguishing whether any surge
in false alerts is the result of a real attack or merely a consequence of a change in normal
user behavior.
Finally, I seek to generalize the detection techniques used in this sensor to other com-
puting platforms such as Mac OS.
7.4.2 Long-term Future Work
In the long-run, I envision several directions that my research work can take. In this work,
my objective is to detect data theft attempts performed by masqueraders on single-user
systems. One interesting direction, it to enhance the sensor to detect ‘need-to-know’ policy
violations perpetrated by traitors on multi-user systems.
In the threat model, I assumed that the attacker has no knowledge whether the victim’s
system is baited or not. One interesting line of work is the study of attacker behavior and
his or her perception of risk and expected gain if the adversary knows that the system under
attack is baited.
The development of adaptive behavioral sensors that could be generated online when
fraudulent behavior is suspected, based on abnormal search patterns, will also be the subject
of future work. One could adaptively change the location of the decoy files based on the
file system navigation patterns of the attacker, or change the results that get returned by a
desktop search tool to include decoys generated in real-time.
I pointed out in Chapter 1 that the observables at the network level are more distant
from a distinct user, as attributing a network level event to a distinct user is hard. Detecting
masqueraders from network-level data alone remains a challenge. However, network-level
events are valuable in detecting malicious or unusual activities such as massive download-
ing of information that an insider does not have a need to know, or the dissemination142

CHAPTER 7. CONCLUSION
of information outside the organization’s network. Integrating the RUU host sensor with
network-level sensors may allow for more accurate detection and a wider coverage of attacks.
Finally, I plan on extending the combined detection approach from a local file system
setting to a Cloud setting. The Cloud is intended to be as transparent to the user as a local
file system, and experimental results suggest that the approach proposed here may allow
for the detection of illegal data accesses and industrial espionage attacks from insiders in
the Cloud as well.
Ultimately, I hope the that work presented in this thesis eventually enables the develop-
ment of highly accurate masquerade attack detectors for human masqueraders and rootkits
as well, potentially integrated with anti-virus engines. I also hope that it will eventually
help in the adoption of behavioral models as another factor in user authentication, in order
to harden existing access control mechanisms.
143

CHAPTER 7. CONCLUSION
This page is intentionally left blank.
144

Part I
Appendices
145


APPENDIX A. USER STUDY SCENARIOS
Appendix A
User Study Scenarios
A.1 Malicious Scenario
You have been going through rough financial times lately. You have lost all of your invest-
ments in the stock market, after going through loss after loss. You had an accident two
months ago and your brand new car has been totaled. That car has not even been paid for.
You have only put a small down-payment. You have been charging up your credit cards just
to pay your monthly bills. Debts have been accumulating and your monthly salary hardly
covers 70% of your living expenses and monthly bills. You really have to do something, or
otherwise you will be facing bankruptcy.
You have been sharing your office with your co-worker ‘John Smith’ for the last three
months. John has been getting on your nerves for the last several months. Although you
know that you have been working harder than him, he has received a better appraisal than
yours, and has been promoted recently. He’s your supervisor’s favorite even though he does
not deserve it.
You do recall that your office-mate once mentioned that he can’t remember all of his user
IDs and passwords, whether they are for e-mail accounts or for online-banking accounts,
etc. That is why he stores them all on his computer. You know also that he uses his
work laptop for personal business. He takes care of his personal business during work
hours anyway. So you have been recently thinking that, if you can get the passwords to
his financial accounts, you can get yourself some money. You may also find some valuable147

APPENDIX A. USER STUDY SCENARIOS
PII information (Personally Identifiable Information) that could be very valuable. This can
solve all of your financial problems. After all, your officemate is in a much better financial
position. Stealing a few thousand dollars from his bank account is not going to make him
bankrupt. But if you don’t do that, you will be facing bankruptcy.
Yesterday, and after reviewing your bills and notices for payment, you have made your
decision. You will give this a try. Today, during lunch hour, your office mate left the office
during and left his laptop on. He is driving to a near-by fast food restaurant to buy lunch.
So you know that he will not be back before at least 15 minutes. It may take him even
longer. This is really your chance. Your financial problems will be soon over, and you can
start enjoying your life again, if you manage not to get caught. You just need to make sure
that your unauthorized access does not get detected.
P.S.: All of your actions will be monitored for later investigation.
A.2 Benign Scenario
You have been working for company ABC for one year. You have been sharing your office
with your co-worker ‘John Smith’ for the last three months. Today, during lunch hour,
‘John’ left the office and left his laptop on. He is driving to a near-by fast food restaurant
to buy lunch. So you know that he will not be back before at least 15 minutes. It may take
him even longer than that.
Your machine has suddenly stopped working. You have a meeting this afternoon with
representatives of an important client and you need to give them an update on the yield
improvement project, which you have been working on with John. The report that you will
be presenting to the client reps is not ready yet. Now you can get access to your colleague’s
machine for 15 minutes. Think about what you will do and do it. Please indicate your
choice. If you decide to take a look at his laptop, please describe what you did, (e.g. just
browsing, sending e-mail, searching for specific information), and for how long you did it.
In 15 minutes, you will answer a questionnaire, and describe exactly what you did.
P.S.: All of your actions will be monitored for later investigation.148

APPENDIX A. USER STUDY SCENARIOS
A.3 Neutral Scenario
You have been working for company ABC for one year. You have been sharing your office
with your co-worker ‘John Smith’ for the last three months. Today, during lunch hour,
your office mate left the office and left his laptop on. He is driving to a near-by fast food
restaurant to buy lunch. So you know that he will not be back before at least 15 minutes.
It may take him even longer than that.
You have the option of using his laptop for whatever purpose, or you can decide to do
something else.
If you decide to take a look at his laptop, please note what you did. In 15 minutes, you
will answer a questionnaire, and describe exactly what you did.
P.S.: All of your actions will be monitored for later investigation.
149

APPENDIX A. USER STUDY SCENARIOS
This page is intentionally left blank.
150

APPENDIX B. POST-EXPERIMENT QUESTIONNAIRE
Appendix B
Post-Experiment Questionnaire
1. Which scenario have you been given (Please circle the right choice)?
a) Scenario 1
b) Scenario 2
c) Scenario 3
2. Please indicate date and time of the experiment.
3. Please describe what you did during the 15 minutes:
4. Please indicate why you did so:
5. Please list relevant documents (with respect to the task performed) that you were
able to find:
Filename Path
6. What’s you major?151

APPENDIX B. POST-EXPERIMENT QUESTIONNAIRE
7. What program are you in?
a) Undergraduate
b) Masters
c) PhD
d) Other. Please specify: .
8. How would you rate your knowledge of Linux?
a) No Knowledge
b) Basic knowledge
c) Moderate knowledge
d) Deep knowledge
e) Expert
9. Which operating system do you have running on your personal computer(s)? (Select
all that apply)
a) Linux .. Please specify:
b) Windows XP
c) Windows Vista
d) Mac OS
e) Other .. Please specify:
10. How familiar are you with Linux commands?
a) Unfamiliar
b) Somewhat unfamiliar
c) Neutral
d) Familiar
e) Very familiar152

APPENDIX B. POST-EXPERIMENT QUESTIONNAIRE
11. How many years/months of experience do you have using Linux/Unix commands?
(Years or months)
12. How many years/months of experience do you have using MS-DOS commands? (Years
or months)
13. How often do you use user commands to search for information in a Linux environ-
ment?
a) Never
b) Rarely
c) Monthly
d) Weekly
e) Daily
14. How often do you use Google Desktop Search on your personal computer?
a) Never
b) Rarely
c) Monthly
d) Weekly
e) Daily
15. How often do you use other Desktop Search tools on your personal computer?
a) Never
b) Rarely
c) Monthly
d) Weekly
e) Daily153

APPENDIX B. POST-EXPERIMENT QUESTIONNAIRE
16. Did you feel that there was enough background information for you to perform the
task effectively?
a) No, needed a lot more information
b) No, needed a bit more information
c) Just right
d) Yes, a bit more information might have helped
e) Yes, plenty of information was provided
17. Did you feel that you had enough time to complete the task?
a) No, needed a lot more time
b) No, needed a bit more time
c) Just right
d) Yes, a bit more time might have helped
e) Yes, plenty of time was provided
18. What time period do you think would have been more appropriate to perform this
task?
19. What would you have done differently (if anything) if you had more time to perform
the task?
20. What would you have done differently (of anything) if you had less time to perform
the task?
21. Did the scenario narrative affect the way in which you performed the task?
a) Yes
b) No
22. If you were to perform the same task without the assigned narrative (i.e. you have
access to someone else’s computer, not necessarily your office mate, or someone you
know, and not necessarily limited to 15 minutes), would there be any differences in
your approach?154

APPENDIX B. POST-EXPERIMENT QUESTIONNAIRE
a) Yes
b) No
If yes, please explain:
23. How do you feel you were performing the task compared to your own normal behavior?
a) Very differently
b) Somewhat differently
c) Neutral
d) Somewhat similar
e) Very similar
24. Which portions of the task differed from your own normal methodology?
25. Did anything else influence your decision to use a certain approach to complete the
task?
a) Yes
b) No
If yes, please list:
26. If you wanted to prevent others from discovering the purpose of your task, what would
you do?
27. If you wanted to prevent others from discovering the purpose of your task, would you
have performed the task incrementally (e.g. on different days)?
a) Yes
b) No
If yes, how?
155

APPENDIX B. POST-EXPERIMENT QUESTIONNAIRE
This page is intentionally left blank.
156
APPENDIX C. DECOY FILE PLACEMENT
Appendix C
Decoy File Placement
157

APPENDIX C. DECOY FILE PLACEMENT
Table C.1: Decoy Document PlacementDecoy File Number Directory where Decoy was Placed
1 C:\Documents and Settings\username \My Documents\Personal\Shopping\
2 C:\Documents and Settings\username\My Documents\Taxes\3 C:\4 F:\5 C:\Documents and Settings\username\My Documents\Receipts\6 C:\Documents and Settings\username\Desktop\7 C:\Documents and Settings\username\My Documents\Financial\
Bank Statements\8 C:\Documents and Settings\Administrator\9 C:\Documents and Settings\username\My Documents\10 C:\Documents and Settings\username\My Documents\Financial\11 C:\Documents and Settings\username\My Documents\Private\12 C:\Documents and Settings\username\My Documents\Personal\13 C:\Documents and Settings\username\My Documents\Private\
Medical
14 C:\Documents and Settings\username\My Documents\Downloads\15 C:\Documents and Settings\username\My Documents\Financial\
Lost Card\16 C:\Documents and Settings\username\My Documents\Financial\
Disputes\17 C:\Documents and Settings\username\My Documents\
onn\bills and all\eBay\18 C:\Documents and Settings\username\Desktop\Important\19 C:\Program Files\License \20 C:\Windows\Temp\21 C:\Documents and Settings\username\My Documents\Personal\
Visa Applications\22 C:\Documents and Settings\username\My Documents\Private Vacation \23 C:\Windows\24 C:\Documents and Settings\username\My Documents\Confidential\25 C:\Documents and Settings\username\Cookies\26 C:\Documents and Settings\username\Favorites\27 C:\Documents and Settings\username\workspace\28 C:\Documents and Settings\username\My Documents\Investments\29 C:\Documents and Settings\username\My Documents\Resume\30 C:\Documents and Settings\username\Desktop\My Journal\31 C:\Backup\32 C:\Documents and Settings\username\My Pictures\33 C:\Documents and Settings\username\Desktop\Notes\34 C:\Documents and Settings\username\My Documents\Confidential\
Employee Evaluations\35 C:\Documents and Settings\username\Recent\36 C:\Documents and Settings\username\Start Menu\37 C:\Documents and Settings\username\Desktop\Insurance\38 C:\Documents and Settings\username\Local Settings\39 C:\Documents and Settings\username\My Documents\401K\40 C:\Documents and Settings\username\My Documents\Mortgage\41 C:\Documents and Settings\username\My Music\42 C:\Documents and Settings\username\My Documents\Miscellaneous\158

APPENDIX D. IRB HUMAN SUBJECTS STUDY DESCRIPTION DATA SHEET
Appendix D
IRB Human Subjects Study
Description Data Sheet
Table D.1: Columbia University Human Subjects Study Description Data SheetProtocol IRBAAAC4240(Y1M00)
Protocol Status Approved
Effective Date 05/28/2007
Initial Expiration Date 05/27/2009
Originating Department COMPUTER SCIENCE (167)
Submitting To Morningside
Title Insider Threat/Masquerader Detection
Sponsor Protocol Version#
Abbreviated title Insider Threat Detection
IRB of record Columbia University Morningside
IRB number used
Affiliated Institutions Standard Columbia Submission
Protocol Begin Date 05/01/2007
Initial Protocol End Date 11/30/2009
Principal Investigator Salvatore Stolfo (167)
Study Description The study will assess proposed statistical features used to represent the
behavior of a typical computer user and to use said features to
model a specific user’s actions.
We seek to augment typical computer security features (such as user names
and passwords or pins) with behavior information to authenticate a user
and prevent unwanted harmful actions.
159

APPENDIX D. IRB HUMAN SUBJECTS STUDY DESCRIPTION DATA SHEET
This page is intentionally left blank.
160

Part II
Bibliography
161


BIBLIOGRAPHY
Bibliography
[Appliance, 2011] CounterStorm-1 Appliance. http://www.counterstorm.com/technology/counterstorm-
1-appliance.html, 2011.
[Attenberg et al., 2009] Josh Attenberg, Sandeep Pandey, and Torsten Suel. Modeling and
predicting user behavior in sponsored search. In Proceedings of the 15th ACM SIGKDD
international conference on Knowledge discovery and data mining, KDD ’09, pages 1067–
1076, New York, NY, USA, 2009. ACM.
[Avizienis, 1995] Algirdas A. Avizienis. The methodology of n-version programming. In
Software Fault Tolerance, pages 23–46, New York, NY, 1995. John Wiley & Sons.
[Baeza-Yates et al., 2005] Ricardo Baeza-Yates, Carlos A. Hurtado, Marcelo Mendoza, and
Georges Dupret. Modeling user search behavior. In Proceedings of the Third Latin
American Web Congress, LA-WEB ’05, pages 242–251. IEEE Computer Society, 2005.
[Baker et al., 2010] Wade Baker, Mark Goudie, Alexander Hutton, C. David Hylender, Jelle
Niemantsverdriet, Christopher Novak, David Ostertag, Christopher Porter, Mike Rosen,
Bryan Sartin, Peter Tippett, and Men and women of the United States Secret Service.
2010 data breach investigations report, 2010.
[Baxter, 2000] Jonathan Baxter. A model of inductive bias learning. Journal of Artificial
Intelligence Research, 12:149–198, 2000.
[Ben-david and Schuller, 2003] Shai Ben-david and Reba Schuller. Exploiting task related-
ness for multiple task learning. In Proceedings of the Conference on Learning Theory and
Kernel Machines, 2003.163

BIBLIOGRAPHY
[Ben-Salem, a] Malek Ben-Salem. DDA Sensor: http://www1.cs.columbia.edu/ids/ruu/software/windows/.
[Ben-Salem, b] Malek Ben-Salem. RUU dataset: http://www1.cs.columbia.edu/ids/RUU/data/.
[Ben-Salem and Stolfo, 2010] Malek Ben-Salem and Salvatore J. Stolfo. Detecting mas-
queraders: A comparison of one-class bag-of-words user behavior modeling techniques. In
Proceedings of the Second International Workshop on Managing Insider Security Threats,
Morioka, Iwate, Japan, MIST ’10, pages 3–13, June 2010.
[Ben-Salem and Stolfo, 2011a] Malek Ben-Salem and Salvatore J. Stolfo. Decoy document
deployment for effective masquerade attack detection. In Proceedings of the Eighth Con-
ference on Detection of Intrusions and Malware & Vulnerability Assessment, DIMVA ’11,
pages 35–54, Heidelberg, July 2011. Springer.
[Ben-Salem and Stolfo, 2011b] Malek Ben-Salem and Salvatore J. Stolfo. Modeling user
search-behavior for masquerade detection. In Proceedings of the 14th International Sym-
posium on Recent Advances in Intrusion Detection, pages 1–20, Heidelberg, September
2011. Springer.
[Ben-Salem and Stolfo, 2011c] Malek Ben-Salem and Salvatore J. Stolfo. On the design and
execution of cyber-security user studies: Methodology, challenges, and lessons learned.
In Proceedings of the Fourth Workshop on Cyber Security Experimentation and Test, San
Francisco, California, USA, CSET ’11, pages 1–11, August 2011.
[Ben-Salem et al., 2008] Malek Ben-Salem, Shlomo Hershkop, and Salvatore J. Stolfo. A
survey of insider attack detection research. In Salvatore J. Stolfo, Steven M. Bellovin,
Shlomo Hershkop, Angelos D. Keromytis, Sara Sinclair, and Sean W. Smith, editors,
Insider Attack and Cyber Security: Beyond the Hacker, pages 69–90, Heidelberg, 2008.
Springer.
[Bi et al., 2003] Jinbo Bi, Kristin Bennett, Mark Embrechts, Curt Breneman, and Minghu
Song. Dimensionality reduction via sparse support vector machines. Journal of Machine
Learning Research, 3:1229–1243, march 2003.164

BIBLIOGRAPHY
[Bloomfield and Littlewood, 2003] Robin Bloomfield and Bev Littlewood. Multi-legged ar-
guments: The impact of diversity upon confidence in dependability arguments. In Pro-
ceedings of the 2003 International Conference on Dependable Systems and Networks, DSN
’03, pages 25–34, June 2003.
[Bowen and Hershkop, 2009] Brian M. Bowen and Shlomo Hershkop. Decoy Document
Distributor: http://sneakers.cs.columbia.edu/ids/fog/, 2009.
[Bowen et al., 2009a] Brian M. Bowen, Malek Ben-Salem, Shlomo Hershkop, Angelos D.
Keromytis, and Salvatore J. Stolfo. Designing host and network sensors to mitigate the
insider threat. IEEE Security & Privacy, 7(6):1–1, 2009.
[Bowen et al., 2009b] Brian M. Bowen, Shlomo Hershkop, Angelos D. Keromytis, and Sal-
vatore J. Stolfo. Baiting inside attackers using decoy documents. In Proceedings of the
5th International ICST Conference on Security and Privacy in Communication Networks,
SecureComm ’09, 2009.
[Caputo et al., 2009a] Deanna D. Caputo, Marcus Maloof, and Gregory Stephens. Detect-
ing insider theft of trade secrets. IEEE Security and Privacy, 7:14–21, November 2009.
[Caputo et al., 2009b] Deanna D. Caputo, Greg Stephens, Brad Stephenson, Megan
Cormier, and Minna Kim. Experimental design of technology studies: Insider threat
example. In Proceedings of the 2011 Cyber Security Through a Behavioral Lens Work-
shop, pages 1–5, June 2009.
[CERT, 2010] CERT. 2010 e-crimes watch survey, 2010.
[Chang and Lin, ] Chih-Chung Chang and Chih-Jen Lin. Libsvm:
http://www.csie.ntu.edu.tw/ cjlin/libsvm/.
[Chang and Lin, 2001] Chih-Chung Chang and Chih-Jen Lin. Libsvm: a library for support
vector machines. http://www.csie.ntu.edu.tw/ cjlin/papers/libsvm.pdf, 2001.
[Chawla et al., 2001] Nitesh V. Chawla, Steven Eschrich, and Lawrence O. Hall. Creating
ensembles of classifiers. In Proceedings of the 2001 IEEE International Conference on165
BIBLIOGRAPHY
Data Mining, ICDM ’01, pages 580–581, Washington, DC, USA, 2001. IEEE Computer
Society.
[Chinchani and Upadhyaya, 2003] Ramkumar Chinchani and Shambhu Upadhyaya. A
tamper-resistant framework for unambiguous detection of attacks in user space using
process monitors. In Proceedings of the First IEEE International Workshop on Informa-
tion Assurance., IWIA ’03, pages 25–36, March 2003.
[Cohen et al., 2001] Fred Cohen, Dave Lambert, Charles Preston, Nina Berry, Corbin
Stewart, and Eric Thomas. A Framework for Deception - White Paper http://all.net.
http://all.net, 2001.
[Coull and Szymanski, 2008] Scott E. Coull and Boleslaw K. Szymanski. Sequence align-
ment for masquerade detection. Computational Statistics and Data Analysis, 52(8):4116–
4131, 2008.
[Coull et al., 2001] Scott E. Coull, Joel Branch, Boleslaw Szymanski, and Eric Breimer.
Intrusion detection: A bioinformatics approach. In ACSAC ’01: Proceedings of the 19th
Annual Computer Security Applications Conference, ACSAC ’01, pages 24–33, 2001.
[Dash et al., 2005] Subrat Kumar Dash, Sanjay Rawat, G. Vijaya Kumari, and Arun K.
Pujari. Masquerade Detection Using IA Network. In First International Workshop on
Applications of Constraint Satisfaction and Programming to Computer Security Problems,
pages 18–30, 2005.
[Davison and Hirsh, 1997] Brian D. Davison and Hyam Hirsh. Toward an adaptive com-
mand line interface. In Proceedings of the Seventh International Conference on Human-
Computer Interaction, HCI ’97, pages 505–508. Elsevier Science Publishers, 1997.
[Davison and Hirsh, 1998] Brian D. Davison and Hyam Hirsh. Predicting sequences of
user actions. In Working Notes of the Joint Workshop on Predicting the Future: AI
Approaches to Time Series Analysis, Fifteenth National Conference on Artificial Intelli-
gence/Fifteenth International Conference on Machine Learning, pages 5–12. AAAI Press,
1998.166

BIBLIOGRAPHY
[Dietterich, 2000] Thomas G. Dietterich. Ensemble methods in machine learning. In Inter-
national Workshop on Multiple Classifier Systems, pages 1–15. Springer-Verlag, 2000.
[Domingos, 2000] Pedro Domingos. Bayesian averaging of classifiers and the overfitting
problem. In Proceedings of the Seventeenth International Conference on Machine Learn-
ing, ICML ’00, pages 223–230, San Francisco, CA, USA, 2000. Morgan Kaufmann Pub-
lishers Inc.
[Dumouchel, 1999] William Dumouchel. Computer intrusion detection based on bayes fac-
tors for comparing command transition probabilities. Technical report, National Institute
of Statistical Sciences, TR-91, 1999.
[Dzeroski and Zenko, 2002] Saso Dzeroski and Bernard Zenko. Is combining classifiers bet-
ter than selecting the best one. In Proceedings of the Nineteenth International Conference
on Machine Learning, ICML ’02, pages 123–130, San Francisco, CA, USA, 2002. Morgan
Kaufmann Publishers Inc.
[Edge, 2011] Vericept Edge. https://www.vericept.com/index.php?id=62, 2011.
[Forrest et al., 1996] Stephanie Forrest, Steven A. Hofmeyr, Anil Somayaji, and Thomas A.
Longstaff. A sense of self for unix processes. In Proceedings of the 1996 IEEE Symposium
on Security and Privacy, pages 120–128. IEEE Computer Society Press, 1996.
[Gashi et al., 2009] Ilir Gashi, Vladimir Stankovic, Corrado Leita, and Olivier Thonnard.
An experimental study of diversity with off-the-shelf antivirus engines. In Proceedings of
the 2009 Eighth IEEE International Symposium on Network Computing and Applications,
NCA ’09, pages 4–11, Washington, DC, USA, 2009. IEEE Computer Society.
[Globerson and Tishby, 2003] Amir Globerson and Naftali Tishby. Sufficient dimensionality
reduction. Journal of Machine Learning Research, 3:1307–1331, March 2003.
[Goldring, 2003] Tom Goldring. Authenticating users by profiling behavior.
http://www.galaxy.gmu.edu/interface/i03/i2003html/goldringtom/
goldringtom.presentation.ppt. In Proceedings of the ICDM Workshop on Data Mining
for Computer Security, DMSEC ’03, 2003.167

BIBLIOGRAPHY
[GraniteEdge Enterprise Security Platform, 2011] GraniteEdge Enterprise Security Plat-
form. http://products.enterpriseitplanet.com/security/security/1131398540.html, 2011.
[Greenberg, 2010] Forbes Magazine Andy Greenberg. ID Theft: Don’t Take it Person-
ally. http://www.forbes.com/2010/02/09/banks-consumers-fraud-technology-security-id-
theft.html, February 2010.
[Gunetti and Picardi, 2005] Daniele Gunetti and Claudia Picardi. Keystroke analysis of
free text. ACM Transactions on Information and System Security, 8:312–347, August
2005.
[Guyon and Elisseeff, 2003] Isabelle Guyon and Andre Elisseeff. An introduction to variable
and feature selection. Journal of Machine Learning Research, 3:1157–1182, 2003.
[Higgins, 2009] Kelly Jackson Higgins. Widespread Confickr/Downadup Worm Hard
To Kill. http://www.darkreading.com/security/attacks-breaches/212901489/index.html,
January 2009.
[Jacob et al., 2004] Laurent Jacob, Francis Bach, and Jean-Philippe Vert. Clustered multi-
task learning: a convex formulation. In Advances in Neural Information Processing
Systems, NIPS ’04, pages 745–752, 2004.
[Jebara and Jaakkola, 2000] Tony Jebara and Tommi Jaakkola. Feature selection and du-
alities in maximum entropy discrimination. In Proceedings of the 16th Conference on
Uncertainty in Artificial Intelligence, UAI ’00, pages 291–300, San Francisco, CA, USA,
2000. Morgan Kaufmann Publishers Inc.
[Jebara et al., 2004] Tony Jebara, Risi Kondor, and Andrew Howard. Probability product
kernels. Journal of Machine Learning Research, 5:819–844, December 2004.
[Jebara, 2004] Tony Jebara. Multi-Task Feature and Kernel Selection for SVMs. In Proceed-
ings of the twenty-first international conference on Machine learning, ICML: ’04, pages
55–62, New York, NY, USA, 2004. ACM.
[Jebara, 2011] Tony Jebara. Multitask sparsity via maximum entropy discrimination. Jour-
nal of Machine Learning Research, 12:75–110, February 2011.168

BIBLIOGRAPHY
[Ju and Vardi, 2001] Wen-Hua Ju and Yehuda Vardi. A hybrid high-order markov chain
model for computer intrusion detection. Journal of Computational and Graphical Statis-
tics, June:277–295, 2001.
[Kamvar and Baluja, 2006] Maryam Kamvar and Shumeet Baluja. A large scale study of
wireless search behavior: Google mobile search. In Proceedings of the SIGCHI conference
on Human Factors in computing systems, CHI ’06, pages 701–709, New York, NY, USA,
2006. ACM.
[Kelly and Avizienis, 1983] John P. J. Kelly and Algirdas A. Avizienis. A specification-
oriented multi-version software experiment. In Proceedings of the Thirteenth Annual
International Symposium Fault-Tolerant Computing, FTCS ’83, pages 120–126. IEEE,
1983.
[Kelly, 1982] John P. J. Kelly. Specification of fault-tolerant multi-version software: Ex-
perimental studies of a design diversity approach, 1982. PhD Dissertation, University of
California, Los Angeles, 1982.
[Kennell and Jamieson, 2003] Rick Kennell and Leah H. Jamieson. Establishing the gen-
uinity of remote computer systems. In Proceedings of the 12th conference on USENIX
Security Symposium, SSYM ’03, pages 21–21, Berkeley, CA, USA, 2003. USENIX Asso-
ciation.
[Keppel, 2004] Geoffrey Keppel. Design and analysis : a researcher’s handbook. Pearson
Prentice Hall, 2004.
[Killourhy and Maxion, 2008] Kevin S. Killourhy and Roy A. Maxion. Naive Bayes as a
masquerade detector: Addressing a chronic failure. In Insider Attack and Cyber Security:
Beyond the Hacker, pages 91–112. Springer, 2008.
[Kim et al., 2006] Jongsung Kim, Alex Biryukov, Bart Preneel, and Seokhie Hong. On the
security of hmac and nmac based on haval, md4, md5, sha-0 and sha-1 (extended ab-
stract). In Proceedings of the 5th International Conference on Security and Cryptography
for Networks, SCN ’06, pages 242–256, Berlin, Heidelberg, January 2006. OUP Oxford.169

BIBLIOGRAPHY
[Knight and Leveson, 1986] John C. Knight and Nancy G. Leveson. An experimental eval-
uation of the assumption of independence in multiversion programming. IEEE Transac-
tions on Software Engineering, 12:96–109, January 1986.
[Kohavi and John, 1997] Ron Kohavi and George H. John. Wrappers for feature subset
selection. Artificial Intelligence, 97(1):273–324, 1997.
[Krawczyk et al., 1997] Hugo Krawczyk, Mihir Bellare, and Ran Canetti. RFC2104,
HMAC: Keyed-Hashing for Message Authentication, February 1997.
[Laboratories, 1992] Sandia National Laboratories. The unique signal concept for deto-
nation safety in nuclear weapons. In System Studies Department, 331, SAND91-1269.
Sandia National Laboratories, 1992.
[Lancope, 2011] Lancope. Lancope’s StealthWatch, 2011.
[Lane and Brodley, 1997] Terran Lane and Carla E. Brodley. Sequence matching and learn-
ing in anomaly detection for computer security. In Proceedings of AAAI 1997 Workshop
on AI Approaches to Fraud Detection and Risk Management, pages 43–49. AAAI Press,
1997.
[Lane and Lordan, 2005] Mark Lane and Lisa Lordan. Practical techniques for defeating
biometric devices. Master’s thesis, Dublin City University, 2005.
[Lee et al., 2002] Wenke Lee, Wei Fan, Matthew Miller, Salvatore J. Stolfo, and Erez Zadok.
Toward cost-sensitive modeling for intrusion detection and response. Journal of Computer
Security, 10:5–22, July 2002.
[Ling and Manikopoulos, 2004] Li Ling and Constantine N. Manikopoulos. Windows NT
one-class masquerade detection. In Proceedings of the Fifth Annual IEEE SMC Informa-
tion Assurance Workshop, pages 82–87, June 2004.
[Littlewood and Strigini, 2004] Bev Littlewood and Lorenzo Strigini. Redundancy and di-
versity in security. In Proceedings of the 9th European Symposium on Research in Com-
puter Security, ESORICS ’04, pages 423–438. Springer, 2004.170

BIBLIOGRAPHY
[Llet, February 9 2005] D. Llet. Trojan attacks microsoft’s anti-spyware. CNET News,
February 9, 2005.
[Maiorana et al., 2011] Emanuele Maiorana, Patrizio Campisi, Noelia Gonzalez-Carballo,
and Alessandro Neri. Keystroke dynamics authentication for mobile phones. In Proceed-
ings of the 2011 ACM Symposium on Applied Computing, SAC ’11, pages 21–26, New
York, NY, USA, 2011. ACM.
[Maloof and Stephens, 2007] Marc A. Maloof and Gregory D. Stephens. elicit: A system
for detecting insiders who violate need-to-know. In Proceedings of the Tenth International
symposium on Recent Advances in Intrusion Detection, RAID ’07, pages 146–166, 2007.
[Maxion and Townsend, 2002] Roy A. Maxion and Tahlia N. Townsend. Masquerade detec-
tion using truncated command lines. In Proceedings of the 2002 International Conference
on Dependable Systems and Networks, DSN ’02, pages 219–228. IEEE Computer Society,
2002.
[Maxion and Townsend, 2004] Roy A. Maxion and Tahlia N. Townsend. Masquerade de-
tection augmented with error analysis. IEEE Transactions on Reliability, 53(1):124–147,
2004.
[Maxion, 2003] R. A. Maxion. Masquerade detection using enriched command lines. In
Proceedings of the 2003 International Conference on Dependable Systems and Networks,
volume 0 of DSN ’03, pages 5–14, Los Alamitos, CA, USA, 2003. IEEE Computer Society.
[Maxion, 2005] Roy A. Maxion. Use of diversity as a defense mechanism. In Proceedings of
the 2005 workshop on New security paradigms, NSPW ’05, pages 21–22, New York, NY,
USA, 2005. ACM.
[Maybury et al., 2005] Mark Maybury, Penny Chase, Brant Cheikes, Dick Brackney, Sara
Matzner, Tom Hetherington, Brad Wood, Conner Sibley, Jack Marin, and Tom Longstaff.
Analysis and detection of malicious insiders. In Proceedings of the International Confer-
ence on Intelligence Analysis, 2005.171

BIBLIOGRAPHY
[Milgram, 1974] Stanley Milgram. Obedience to Authority: An Experimental View. Harper-
collins, New York, January 1974.
[Mitra et al., 2002] Subhasish Mitra, Nirmal R. Saxena, and Edward J. McCluskey. A
design diversity metric and analysis of redundant systems. IEEE Transactions on Com-
puters, 51(5):498–510, May 2002.
[MOSEK, 2009] MOSEK. The MOSEK software package: http://www.mosek.com/, 2009.
[Nguyen et al., 2003] Nam Nguyen, Peter Reiher, and Geoffrey H. Kuenning. Detecting
insider threats by monitoring system call activity. In Proceedings of the 2003 IEEE
Workshop on Information Assurance, IWIA ’03, pages 18–20. United States Military
Academy West Point, 2003.
[Oakley, 2011] Oakley. Oakley network’s sureview, 2011.
[O’Brien and Keane, 2007] Maeve O’Brien and Mark T. Keane. Modeling user behavior
using a search-engine. In Proceedings of the 12th international conference on Intelligent
user interfaces, IUI ’07, pages 357–360, New York, NY, USA, 2007. ACM.
[Oka et al., 2004a] Mizuki Oka, Yoshihiro Oyama, Hirotake Abe, and Kazuhiko Kato.
Anomaly detection using layered networks based on eigen co-occurrence matrix. In Pro-
ceedings of the 7th International Symposium on Recent Advances in Intrusion Detection,
RAID ’04, pages 223–237, 2004.
[Oka et al., 2004b] Mizuki Oka, Yoshihiro Oyama, and Kazuhiko Kato. Eigen co-occurrence
matrix method for masquerade detection. In Proceedings of the 7th JSSST SIGSYS
Workshop on Systems for Programming and Applications (SPA), 2004.
[PacketMotion, 2011] PacketMotion, 2011.
[Pearson and Hartley, 1951] Egon S. Pearson and Herman O. Hartley. Charts of the power
function for analysis of variance tests, derived from the non-central F-distribution.
Biometrika, 38(1):112–130, July 1951.172

BIBLIOGRAPHY
[Perkins et al., 2003] Simon Perkins, Kevin Lacker, and James Theiler. Grafting: fast,
incremental feature selection by gradient descent in function space. Journal of Machine
Learning Research, 3:1333–1356, March 2003.
[Plummer and Greenwood, 1998] David W. Plummer and William H. Greenwood. The
history of nuclear weapon safety devices. Technical report, Sandia National Laboratories,
Surety Components and Instrumentation Center, SAND98-1184C, 1998.
[Rakotomamonjy, 2003] Alain Rakotomamonjy. Variable selection using svm based criteria.
Journal of Machine Learning Research, 3:1357–1370, March 2003.
[Randazzo et al., 2005] Marissa R. Randazzo, Michelle Keeney, Elleen Kowalski, Dawn
Cappelli, and Andrew Moore. Insider threat study: Illicit cyber activity in the banking
and finance sector, June 2005.
[Richardson, 2008] Robert Richardson. Csi computer crime and security survey, 2008.
[Scholkopf et al., 2001] Bernhard Scholkopf, John C. Platt, John Shawe-Taylor, Alex J.
Smola, and Robert C. Williamson. Estimating the support of a high-dimensional distri-
bution. Neural Computation, 13(7):1443–1471, July 2001.
[Schonlau et al., 2001] Matthias Schonlau, William Dumouchel, Wen-Hua Ju, Alan F. Karr,
Martin Theus, and Yehuda Vardi. Computer intrusion: Detecting masquerades. Statis-
tical Science, 16:58–74, 2001.
[Schonlau, 2001] Matthias Schonlau. Schonlau dataset: http://www.schonlau.net, 2001.
[Seo and Cha, 2007] Jeongseok Seo and Sungdeok Cha. Masquerade detection based on svm
and sequence-based user commands profile. In Proceedings of the 2nd ACM symposium
on Information, computer and communications security, ASIACCS ’07, pages 398–400,
2007.
[Seshadri et al., 2004] Arvind Seshadri, Adrian Perrig, Leendert Van Doorn, and Pradeep
Khosla. Swatt: Software-based attestation for embedded devices. In Proceedings of the
2004 IEEE Symposium on Security and Privacy, 2004.173

BIBLIOGRAPHY
[Seshadri et al., 2005] Arvind Seshadri, Mark Luk, Elaine Shi, Adrian Perrig, Leendert van
Doorn, and Pradeep Khosla. Pioneer: verifying code integrity and enforcing untampered
code execution on legacy systems. In Proceedings of the Twentieth ACM symposium on
Operating systems principles, SOSP ’05, pages 1–16, New York, NY, USA, 2005. ACM
Press.
[Shavlik and Shavlik, 2004] Jude Shavlik and Mark Shavlik. Selection, combination, and
evaluation of effective software sensors for detecting abnormal computer usage. In Pro-
ceedings of the tenth ACM SIGKDD International Conference on Knowledge Discovery
and Data Mining, KDD ’04, pages 276–285, New York, NY, USA, 2004. ACM.
[Spitzner, 2003] Lance Spitzner. Honeypots: Catching the insider threat. In Computer
Security Applications Conference, 2003. Proceedings. 19th Annual, pages 170 – 179, Los
Alamitos, CA, USA, dec. 2003. IEEE Computer Society.
[Stolfo et al., 2009] Salvatore J. Stolfo, Isaac Greenbaum, and Simha Sethumadhavan. Self-
monitoring monitors. In Columbia University Computer Science Department, Technical
Report # cucs-026-09, 2009.
[Stone-Gross et al., 2009] Brett Stone-Gross, Marco Cova, Lorenzo Cavallaro, Bob Gilbert,
Martin Szydlowski, Richard Kemmerer, Christopher Kruegel, and Giovanni Vigna. Your
botnet is my botnet: analysis of a botnet takeover. In Proceedings of the 16th ACM
Conference on Computer and Communications Security, CCS ’09, pages 635–647, New
York, NY, USA, 2009. ACM.
[Stoppiglia et al., 2003] Herve Stoppiglia, Gerard Dreyfus, Remi Dubois, and Yacine Ous-
sar. Ranking a random feature for variable and feature selection. Journal of Machine
Learning Research, 3:1399–1414, March 2003.
[Syed et al., 1999] Nadeem Ahmed Syed, Huan Liu, Syed Huan, Liu Kah, and Kay Sung.
Handling concept drifts in incremental learning with support vector machines. In Pro-
ceedings of the ACM SIGKDD International Conference on Knowledge Discovery and
Data Mining, KDD ’09, pages 317–321, New York, 1999. ACM Press.174

BIBLIOGRAPHY
[Symantec, 2010] Symantec. Hydraq - An Attack of Mythical Proportions:
http://www.symantec.com/connect/blogs/hydraq-attack-mythical-proportions, Jan-
uary 2010.
[Szymanski and Zhang, 2004] Boleslaw K. Szymanski and Yongqiang Zhang. Recursive
data mining for masquerade detection and author identification. In Proceedings of the
Fifth Annual IEEE Information Assurance Workshop, pages 424–431. IEEE Computer
Society Press, 2004.
[Tan and Maxion, 2001] Kymie M. C. Tan and Roy A. Maxion. ‘why 6?’ defining the
operational limits of stide, an anomaly-based intrusion detector. In Proceedings of the
IEEE Symposium on Security and Privacy, pages 188–202, 2001.
[Tan and Maxion, 2005] Kymie M.C. Tan and Roy A. Maxion. The effects of algorithmic
diversity on anomaly detector performance. In Proceedings of the 2005 International
Conference on Dependable Systems and Networks, DSN ’05, pages 216–225, June 2005.
[Tan et al., 2002] Kymie Tan, Kevin Killourhy, and Roy Maxion. Undermining an anomaly-
based intrusion detection system using common exploits. In Recent Advances in Intrusion
Detection, RAID ’05, pages 54–73. Springer, 2002.
[Torkkola, 2003] Kari Torkkola. Feature extraction by non parametric mutual information
maximization. Journal of Machine Learning Research, 3:1415–1438, March 2003.
[Vapnik, 1999] Vladimir N. Vapnik. The Nature of Statistical Learning Theory (Information
Science and Statistics). Springer, 1999.
[Verdasys, 2011] Verdasys. http://www.verdasys.com/, 2011.
[Vontu, 2009] Vontu. http://go.symantec.com/vontu/, 2009.
[Wagner and Soto, 2002] David Wagner and Paolo Soto. Mimicry attacks on host-based
intrusion detection systems. In CCS ’02: Proceedings of the 9th ACM conference on
Computer and Communications Security, CCS ’02, pages 255–264, New York, NY, USA,
2002. ACM.175
BIBLIOGRAPHY
[Wang and Stolfo, 2003] K. Wang and S. J. Stolfo. One-class training for masquerade detec-
tion. In Proceedings of the 3rd IEEE Workshop on Data Mining for Computer Security,
2003.
[Ye et al., 2001] Nong Ye, Xiangyang Li, Qiang Chen, S.M. Emran, and Mingming Xu.
Probabilistic techniques for intrusion detection based on computer audit data. Systems,
Man and Cybernetics, Part A: Systems and Humans, IEEE Transactions on, 31(4):266–
274, Jul 2001.
[Yuill et al., 2004] J. Yuill, M. Zappe, D. Denning, and F. Feer. Honeyfiles: deceptive files
for intrusion detection. In Information Assurance Workshop, 2004. Proceedings from the
Fifth Annual IEEE SMC, pages 116 – 122, June 2004.
[Yuill et al., 2006] Jim Yuill, Dorothy Denning, and Fred Feer. Using Deception to Hide
Things from Hackers: Processes, Principles, and Techniques. Journal of Information
Warfare, 5:26–40, 2006.
[Yung, 2004] K. H. Yung. Using self-consistent naıve bayes to detect masqueraders. In
Proceedings of the Eighth Pacific-Asia Conference on Knowledge Discovery and Data
Mining, PAKDD ’08, pages 329–340, 2004.
176

INDEX
Index
D3, 73, 75
access, 36
accidental, 76–78, 104
authorized, 36
control, 2
mechanisms, 135, 143
legitimate, 72
acct, 15, 22, 23
accuracy, 5, 36, 40, 68, 98, 100, 117, 125
improvement, 106
adversary, 76, 98, 110, 121, 133
alert, 76, 99, 101, 103, 113, 114, 116, 117
generation, 103
anomaly, 28, 68, 98
coverage, 98
detection, 4, 18, 100, 119, 138
detector, 6, 100, 119, 133
space, 28, 98–100, 110
anti-virus, 69, 114
engine, 28, 143
tools, 138
Area Under Curve, see AUC
assumption, 36, 47, 51, 98
attack, 100
evasion, 31
overload, see overload attack
social engineering, 2
attacker, 36, 99
objective, 141
strategy, see strategy
attribution, 4
AUC, 60–62, 105, 106, 129
audit, 35
authentication, 133
availability, 5
bait, 71, 73, 98
baiting, 99, 109, 110, 117, 139
baseline, 88, 101
model, 127
Bayes
model, 16
naıve, see naıve Bayes
Bayesian network, 25
behavior
attacker, 96
fraudulent, 8, 62, 138
historical, 104
human, 119177

INDEX
masquerader, 8, 41
program, 6
suspicious, 35
user, 8, 138
believability, 71, 72, 80, 95, 96
best practices, 139
bias, 43, 47, 48
biometrics, 2
bogus, 72
bookmark, 69
box-and-whisker, 54, 77
browser, 78
buffer overflow, 23
calibration, 141
capture-the-flag, 52, 110
challenge-response question, 101, 118
Chi-square test, 22
classification, 40, 98
multi-class, 40
one-class, 40
classifier, 98, 100, 104, 116, 121, 123
accuracy, 31, 121
ensemble, see ensemble classifier, 98
large-margin, 123
linear, 40, 105, 123
maximal margin, 40
probabilistic, 40
Cloud, 143
code
attestation, 32, 33
injection, 75
verifiable execution, 32, 33
command
sequence, 35
truncated, 15
communication, 69
compress, 16
Compression, 16
computational
complexity, 65–67, 120, 132, 138
cost, 35, 121
concept drift, 20, 116, 123
condition
experimental, 49
treatment, 47, 49
conditional independence, 98
Confickr, 141
confidence, 108
confidential, 141
confidentiality, 5
confounds, 47, 48
conjecture, 36, 53, 57, 97, 99, 109, 119
conspicuous, 87, 90–92
conspicuousness, 71, 75, 79, 80, 87, 92, 95,
98, 102
contextual information, 24
contribution, 8, 36
control group, 43
convex quadratic problem, 123
covariance matrix, 125178

INDEX
coverage, 98
credentials, 2, 3, 5, 7, 37, 44, 52, 73, 118,
133, 136
critical process, 112, 114
cross-validation, 126
data
exfiltration, 2, 69, 72
sharing, 137
streams, 100
theft, 2, 45, 47, 100, 135, 141, 142
Data Loss prevention, see DLP
DDA sensor, 73, 74, 76, 80, 87, 101, 103
de-authentication, 133
De-Militarized Zone, see DMZ
decision process, 103
decision tree, 22
decoy, 26, 74–77, 80, 92, 97–99, 101, 104, 142
access, 77, 137
believable, 71
deployment, 71, 95
strategic, 139
location, 78
placement, 78, 79, 90, 91, 97, 99
properties, 71, 72, 74, 96
believability, see believability
conspicuousness, see conspicuousness
detectability, see detectability
differentiability, see differentiability
enticingness, see enticingness
non-interference, see non-interference
shelf-life, see shelf-life
variability, see variability
trap-based, 73
Decoy Document Access sensor, see DDA
sensor
Decoy Document Distributor, see D3
defense mechanism, 99
design
user study, 41
desktop, 92
search tool, 81
detectability, 71, 80, 95
detection
latency, 135
online, 6
probability, 97
rate, 61, 68, 99, 100, 105, 106, 118
real-time, 68, 116, 136
detector, 110
accuracy, 97
deterrence, 137
differentiability, 72, 79, 95
dimension, 100
dimensionality reduction, 29, 30, 35, 36
directory
traversal, 58, 69
tree, 81
Dirichlet distribution, 16
discriminant, 31, 123
distribution, 123179
INDEX
diversified modeling, 122, 124, 131
diversity, 27, 100, 119, 138
algorithmic, 100
argument, 100
data, 100
design, 100
features, 100
model, 98
process, 100
sensors, 28
DLL, 38, 51, 55, 57, 58, 63, 69, 75, 132, 138
DLP, 2, 3
DMZ, 25, 71
Downadup, 141
Dynamic Link Library, see DLL
ECM, 20
effect size, 49, 50
efficacy, 106
efficiency, 135
eigen co-occurrence matrix, see ECM
ELICIT, 24
EM algorithm, 20
embedded, 96
enhancement, 142
ensemble method, 99
enticement, 76
enticing, 76, 87
enticingness, 71, 75, 80, 95, 98, 102
epoch, 105, 106
length, 125, 127
error source, 68
Euclidean distance, 125
evasion, 99
attack, 31, 69, 99, 100, 106
slow-and-low, 108
evasive adversary, 138
evidence, 5, 6, 56, 72, 101, 102, 117, 118, 139
Expectation Maximization, see EM algorithm
experiment
design, 41, 43, 75
sensitivity, 47
exponential decay, 16
face recognition, 2
false
alert, 5, 82, 103, 106, 142
negative, 141
rate, 102, 103
positive, 61, 75–79, 95, 105, 106, 110,
117, 139
frequency, 105, 137
rate, see FP rate
feature, 104
behavioral, 42
discriminative, 120, 132
diversity, 119, 121
extraction, 30, 66, 127
search, 42
selection, 24, 29–31, 121, 123, 124, 127
filter method, 29
wrapper method, 29180

INDEX
space, 36, 40, 64
dimensionality, 121, 132, 136
transform methods, 30
vector, 102, 103, 109, 121
feedback, 118, 142
file
authentic, 76
contents, 80
decoy, see decoy
server, 8, 100
system, 75, 77, 80, 87, 89, 91, 97, 101,
104, 139, 143
exploration, 55
navigation, 53, 58
financial
credentials, 141
gain, 44, 52, 62, 81, 141
fingerprint recognition, 2
footprint, 132, 136, 139
foreign sequence, 21, 28
forensics, 4
FP rate, 61, 68, 98, 99, 102, 105, 106, 110,
136–138, 141
fraudulent
activity, 97, 139
behavior, 142
generalizability, 136, 140
Genuinity, 33
Google Desktop Search, 35, 53
gradient descent, 30
grafting, 30
Gram matrix, 124
Greenberg dataset, 22
guidelines, 139
hardening, 110
Hash Message Authentication Code, see HMAC
HMAC, 73, 74, 96, 114
pseudo-random tag, 80
tag, 73, 74, 81
validation, 118
honey
file, 26, 71
net, 71
pot, 25–27, 71
token, 26
hook, 51, 74
hooking, 74, 75
Hotelling’s T 2, 22
human subject, 43
Hydraq, 2
hyperplane, 40
hypotheses, see hypothesis
hypothesis, 6, 41
experimental, 42, 43
null, 16, 41, 42, 49, 90
identity, 68
stolen, 36
theft, 52, 81, 135
IDS, 5, 100181

INDEX
anomaly-based, 106, 136
impersonation, 105
imposter, 35
Incremental Probabilistic Action Modeling,
see IPAM
independence
condition, 98
model, 15
index, 58
file, 35, 69
indexing, 52, 81, 82
induction
non-linear, 29
information
gathering, 36, 45, 136
PII, 45
stealing, 42, 90
theft, 60, 80
insider, 1, 5, 24, 27
attack, 7, 72
detection, 13, 25
threat, 1
detection, 23
installation, 101
integrity, 5
intellectual property, 3, 141
intent, 7, 42–44, 53
attacker, 46, 62, 67
malicious, 7, 72, 80
interference, 76, 77, 80, 92, 103
interleaving, 45
intrusion detection, 38
host-based, 31, 106
systems, see IDS
IPAM, 16
iris recognition, 2
kernel, 30, 40, 66
function, 40, 124
library, 75
linear, 40
polynomial, 40
probability product, 109
RBF, 40
selection, 31, 123
keylogger, 2
L0phtcrack, 2
learning
incremental, 40, 116
independent, 124, 129
inductive, 30
machine, see ML
meta-, 98, see meta-learning
multi-task, 30, 31, 123, 124, 129
unsupervised, 29
Lempel-Ziv algorithm, 16
LibSVM, 104
local alignment, 19
log-sigmoid, 30
logistic-quadratic function, 126182

INDEX
logs, 117, 118
longitudinal study, 77
low-and-slow attack, 109
machine learning, see ML
Mahalanobis distance, 125
malefactor, 101
malfeasance, 35, 97
malicious
activity, 74, 87, 101, 113, 137
scenario, 88
user, 71
malware, 96, 112, 115, 141
Markov
chain, 15, 22
hybrid, 15, 16
model, 15
multi-step, 15, 16
one-step, 16
masquerade
activity, 88–90, 98, 99, 101–103
attack, 1–4, 6, 7, 43, 44, 72, 87, 101, 135
detection, 5–7, 13, 35–37, 96
detector, 4, 6
masquerader, 1, 2, 4, 7, 36, 42, 44, 97, 100,
142
data, 105
Matlab, 125
Maximum Entropy Discrimination, see MED
MED, 120
framework, 30, 123–125, 132
media player, 79
meta-learning, 124, 126, 129
methodology, 57
metric, 28, 125
Microsoft Disk Operating System commands,
see MS-DOS commands
Milgram experiment, 44
mimicry, 36
attack, 31, 106, 109, 110, 118, 121, 133,
138, 139, 142
miss rate, 102, 103
mitigation, 3, 101
strategy, 101, 103
mixture transition distribution, 15
ML, 35
algorithms, 35
model, 98
base, 98
diversity, 99
generalizability, 29
update, 40, 41, 69, 106, 142
modeling
algorithm, 100
approach, 105
diversified, see diversified modeling, 140
one-class, 6, 18, 41, 59, 116, 117, 137
personalized, see personalized modeling,
140
scheme, 105
sequence-based, 135183

INDEX
two-class, 15
monetary gain, 137
monitoring, 3, 7, 42, 45, 57, 59, 69, 98, 102
infrastructure, 101, 112
mechanisms, 96
self-monitoring, 112
system, 40, 69, 136
Mosek, 125
motive, 43
MS-DOS commands, 132
multi-user
environment, 135
system, 142
multinomial distribution, 15
multivariate test, 22
mutual information, 30
naıve Bayes, 17, 18, 22, 59
multinomial, 18
self-consistent, 20
NBSCs, 15, 17, 28
need-to-know
policy, 100
violation, 24, 25, 100, 142
networking, 69
Never-Before-Seen-Commands, see NBSCs
non-centrality parameter, 50
non-interference, 72, 75, 76, 78, 87, 91, 95
objective function, 126
online banking, 73, 89
operational, 67
cost, 4, 5, 7, 116, 117, 136, 139
oracle, 103, 137
orthogonal techniques, 117, 138, 139
orthogonalization, 30
outsider, 1
overhead, 114, 115, 138
overload attack, 113
p-value, 54, 88
password
cracker, 1, 2
online-banking, 137
sniffer, 1, 2
performance, 36, 98, 114
gain, 67, 139
perimeter security, 2
personalized modeling, 125, 126, 131
PII, 48, 81
ping, 114
Pioneer, 33
poisoning, 118
policy, 5
power, 49–51
analysis, 49
privacy, 6, 117, 137
preservation, 5, 41, 116
privacy-preserving, 117, 139
privilege escalation, 36
probability, 90, 92
profiling, 66184

INDEX
program, 22
search behavior, 137
traffic, 27
user, 7, 22, 23, 119
commands, 135
host-based, 14
network-based, 24
search, 68
property, 95
questionnaire, 45, 48, 56, 62
Radial Basis Function, see RBF
ranking, 95
RBF, 30, 40
Receiver Operating Curve, see ROC curve
recommendation, 94, 96, 139
registry, 55, 58
access, 51
activity, 51
regression, 40
reliability, 100
risk perception, 142
ROC curve, 60, 61, 105
rootkit, 2, 96, 143
runtime overhead, 5
RUU dataset, 61, 67, 68, 103
RUU sensor, 100, 101, 110
sample, 31, 49
size, 49–51
estimation, 49, 50
sampling, 36, 47, 64, 116, 136, 138
amount, 68
error, 49
procedure, 47
scalable, 135
scanning, 79, 95
scenario, 47, 88
attack, 43, 52
benign, 88
malicious, 88
masquerader, 43
narrative, 42, 43
neutral, 88
Schonlau dataset, 15–18, 21, 22, 139
search
activity, 36, 63, 108
behavior, 27, 35, 36, 38, 42, 45, 53, 59,
60, 62, 63, 66, 67, 97, 101, 108, 109,
120
desktop, 52, 82
features, 36, 62
high-volume, 105
profiling, 105, 106, 110, 117
query, 27
tool, 52, 53, 58, 82
untargeted, 136
velocity, 62
volume, 42, 62
widespread, 136
self-healing systems, 27185

INDEX
semi-global alignment, 19
sensitive data, 3
sensitivity, 60
sensor, 100, 113
adaptive behavioral, 142
DDA, see DDA sensor
host, 51, 96
light-weight, 135, 138, 139
network-level, 27, 138, 143
USB, see USB sensor
sequence
foreign, 98
random, 112
shutdown, 113, 114
sequence alignment, 20
serialization, 116
SHA1, 73
shelf-life, 72, 95
signature, 18, 23
update, 69
significant effect, 56
similarity measure, 16
simulation, 53, 57
Smith-Walterman, see local alignment
social
network, 24
security number, 73
space
high-dimensional, 36, 40
low-dimensional, 36, 68, 116
sparsity, 64, 67
specificity, 60
speedup, 126
storage, 6
strategy, 89, 90
Support Vector Machine, see SVM
suspicious activity, 98, 104
SVM, 18, 23, 29, 30, 40, 100, 116, 122, 123,
126
kernel
K-gram, 17
RBF, 17
sequence-based, 17
string, 17
multi-task, 30, 123
one-class, 9, 18, 40, 59, 61, 63, 65, 101,
136
model, 104
sparse, 29, 30, 123
SWATT, 33
Symantec, 115
system
call, 22, 23, 75, 108
multi-user, 8, 100
single-user, 7, 100, 142
tamper-proofing, 33, 113
tamper-resistant, 139
software techniques, 32, 33
Genuinity, see Genuinity
Pioneer, see Pioneer186

INDEX
SWATT, see SWATT
tampering, 101, 110, 112
taxonomy, 8, 57, 58, 64, 69, 120, 138
Linux, 63
Windows, 38, 63, 120, 132, 133
third party, 113
threat, 116
model, 7, 43, 47, 114, 142
insider, 138
threshold, 102–104, 110
Torpig, 96, 141
TP rate, 105, 110
trade-off, 72, 80, 87, 96
traffic, 78
traitor, 5
transition probability, 15, 16
traps, 71, 97
Uniqueness, 16
USB sensor, 101, 103
user
activity, 8, 78, 121, 138
behavior, 8, 35, 68, 100, 102, 103, 119,
138
average, 100
historical, 102
profiling, 98, 101, 135
command, 35, 138
feedback, 118, see feedback
intent, 7, 37, 45, 52, 53, 58, 67
legitimate, 7, 36, 37, 68, 75–77, 87, 90,
95, 97, 121, 133
model, 6, 102, 103, 105, 118
privacy, 6
search, 102
study, 36, 43, 74–77, 87, 94
victim, 7, 75
variability, 47, 72, 80, 95
experimental treatment, 48
subject, 47, 48
uncontrolled, 43
variable
confounding, 42
dependent, 42
experimental, 42, 46
independent, 42, 49
random, 42
ranking, 30
vector
high-dimensional feature, 61
support, 116, 123
supporting, 66
verification, 74, 113
victim, 36, 105
web mining, 38
whisker, see box-and-whisker
window size, 21
Windows Service Table, 74
z-test, 54, 88
187


![Chapter 16 Attack Detection and Prevention - CCS Labs · Chapter 16 Attack Detection and Prevention ... (2) Host Intrusion ... Application Layer Anomaly Detection (ALAD) [Mahoney2002]](https://img.pdfslide.net/doc/110x75/5b1484dd7f8b9a437c8d6500/chapter-16-attack-detection-and-prevention-ccs-chapter-16-attack-detection.jpg)