Embed Size (px)
Citation preview
Towards Evidence-Based Assessment of Factors
Contributing to the Introduction and Detection of
Software Vulnerabilities
Matthew Finifter
Electrical Engineering and Computer SciencesUniversity of California at Berkeley
Technical Report No. UCB/EECS-2013-49
http://www.eecs.berkeley.edu/Pubs/TechRpts/2013/EECS-2013-49.html
May 8, 2013
Copyright © 2013, by the author(s).All rights reserved.
Permission to make digital or hard copies of all or part of this work forpersonal or classroom use is granted without fee provided that copies arenot made or distributed for profit or commercial advantage and that copiesbear this notice and the full citation on the first page. To copy otherwise, torepublish, to post on servers or to redistribute to lists, requires prior specificpermission.
Towards Evidence-Based Assessment of Factors Contributing to theIntroduction and Detection of Software Vulnerabilities
by
Matthew Smith Finifter
A dissertation submitted in partial satisfaction of the
requirements for the degree of
Doctor of Philosophy
in
Computer Science
in the
Graduate Division
of the
University of California, Berkeley
Committee in charge:
Professor David Wagner, ChairProfessor Vern PaxsonProfessor Brian Carver
Spring 2013
Towards Evidence-Based Assessment of Factors Contributing to theIntroduction and Detection of Software Vulnerabilities
Copyright 2013by
Matthew Smith Finifter
1
Abstract
Towards Evidence-Based Assessment of Factors Contributing to the Introduction andDetection of Software Vulnerabilities
by
Matthew Smith Finifter
Doctor of Philosophy in Computer Science
University of California, Berkeley
Professor David Wagner, Chair
There is an entire ecosystem of tools, techniques, and processes designed to improve soft-ware security by preventing, finding, mitigating, and/or eliminating software vulnerabilities.Software vendors have this entire ecosystem to choose from during each phase of the softwaredevelopment lifecycle, which begins when someone identifies a software need, ends when thesoftware vendor decides to halt support for the software, and includes everything in between.
Unfortunately, guidance regarding which of these tools to choose is often non-existent orbased solely on anecdotal evidence. In this dissertation, we present three studies to demon-strate that empirical studies can be used to enhance our understanding of the effectivenessof various tools and techniques intended to improve software security.
In our first study, we use a data set of 9 implementations of the same software specifica-tion in order to explore the relationship between web application development tools and thesecurity of the applications developed using those tools. We found evidence that frameworksupport for avoiding security vulnerabilities influences application security, that we can ex-pect manual framework support to continue to be problematic, and that manual code reviewand black-box penetration testing are complementary techniques.
In our second study, we hire 30 code reviewers to perform manual security reviews of acontent management system in an effort to better understand the effectiveness of manualsecurity review as a technique for vulnerability discovery. We found that level of experi-ence and education do not correlate with reviewer effectiveness at code review, that overallreviewer effectiveness is low, and that there is significant variation amongst reviewers.
Finally, in our third study, we analyze a data set of rewards paid out over the course oftwo exemplar vulnerability rewards programs (VRPs), that of Google Chrome and MozillaFirefox, in an effort to better understand the costs and benefits of such programs. Wefound that these VRPs appear economically efficient, comparing favorably to the cost ofhiring full-time security researchers, that both programs have successfully encouraged broadcommunity participation, and that Chrome’s VRP has uncovered more vulnerabilities thanthat of Firefox despite costing almost exactly the same amount.

2
i
Contents
Contents i
List of Figures iii
List of Tables v
1 Introduction 11.1 Web development languages and frameworks . . . . . . . . . . . . . . . . . . 21.2 Vulnerability-finding techniques . . . . . . . . . . . . . . . . . . . . . . . . . 31.3 Vulnerability rewards programs . . . . . . . . . . . . . . . . . . . . . . . . . 4
2 Related work 52.1 Efficacy of tools and techniques . . . . . . . . . . . . . . . . . . . . . . . . . 52.2 Comparisons between different tools . . . . . . . . . . . . . . . . . . . . . . . 62.3 Vulnerability ecosystem . . . . . . . . . . . . . . . . . . . . . . . . . . . . . . 9
3 Web application development tools 103.1 Introduction . . . . . . . . . . . . . . . . . . . . . . . . . . . . . . . . . . . . 103.2 Goals . . . . . . . . . . . . . . . . . . . . . . . . . . . . . . . . . . . . . . . . 123.3 Methodology . . . . . . . . . . . . . . . . . . . . . . . . . . . . . . . . . . . 133.4 Results . . . . . . . . . . . . . . . . . . . . . . . . . . . . . . . . . . . . . . . 223.5 Conclusion and future work . . . . . . . . . . . . . . . . . . . . . . . . . . . 30
4 Manual security review 324.1 Introduction . . . . . . . . . . . . . . . . . . . . . . . . . . . . . . . . . . . . 324.2 Goals . . . . . . . . . . . . . . . . . . . . . . . . . . . . . . . . . . . . . . . . 324.3 Experimental methodology . . . . . . . . . . . . . . . . . . . . . . . . . . . . 344.4 Results . . . . . . . . . . . . . . . . . . . . . . . . . . . . . . . . . . . . . . . 384.5 Conclusion and future work . . . . . . . . . . . . . . . . . . . . . . . . . . . 45
5 Vulnerability rewards programs 475.1 Introduction . . . . . . . . . . . . . . . . . . . . . . . . . . . . . . . . . . . . 475.2 Background . . . . . . . . . . . . . . . . . . . . . . . . . . . . . . . . . . . . 48
ii
5.3 Methodology . . . . . . . . . . . . . . . . . . . . . . . . . . . . . . . . . . . 515.4 Results . . . . . . . . . . . . . . . . . . . . . . . . . . . . . . . . . . . . . . . 535.5 Discussion and recommendations . . . . . . . . . . . . . . . . . . . . . . . . 725.6 Conclusion and future work . . . . . . . . . . . . . . . . . . . . . . . . . . . 74
6 Conclusion 75
A Demographic and Other Factors in Code Review Study 77
B Post-Review Questionnaire Administered in Code Review Study 79
Bibliography 82
iii
List of Figures
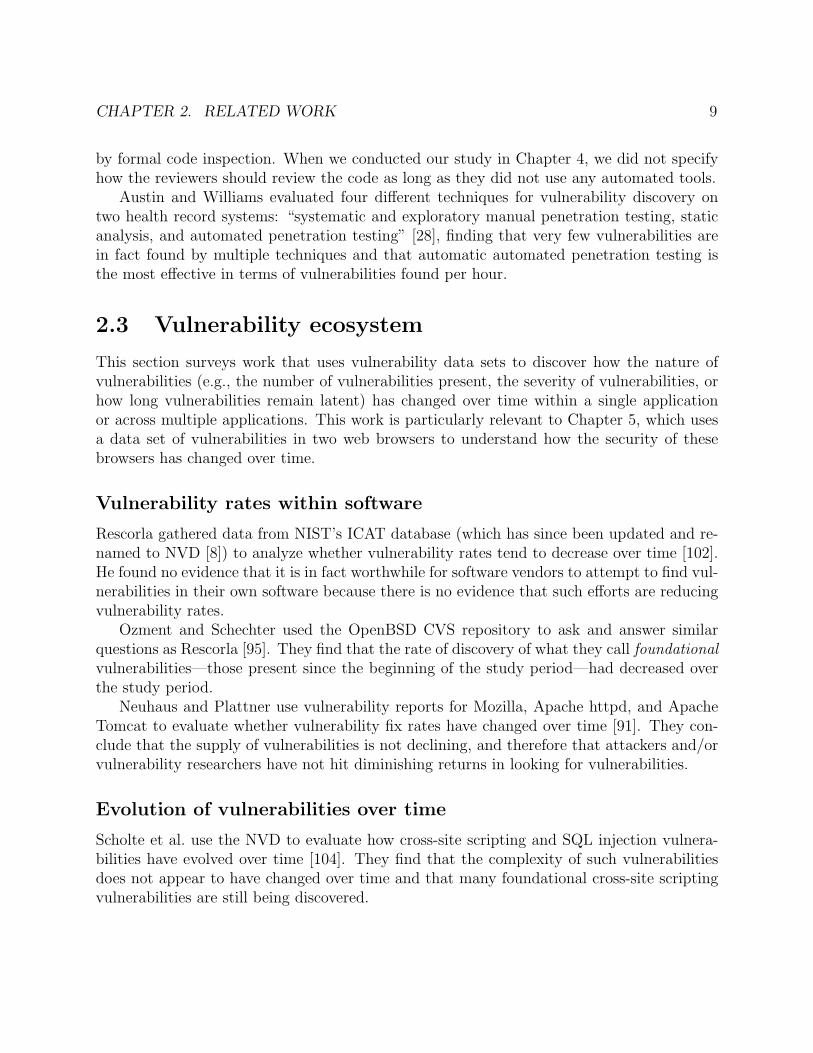
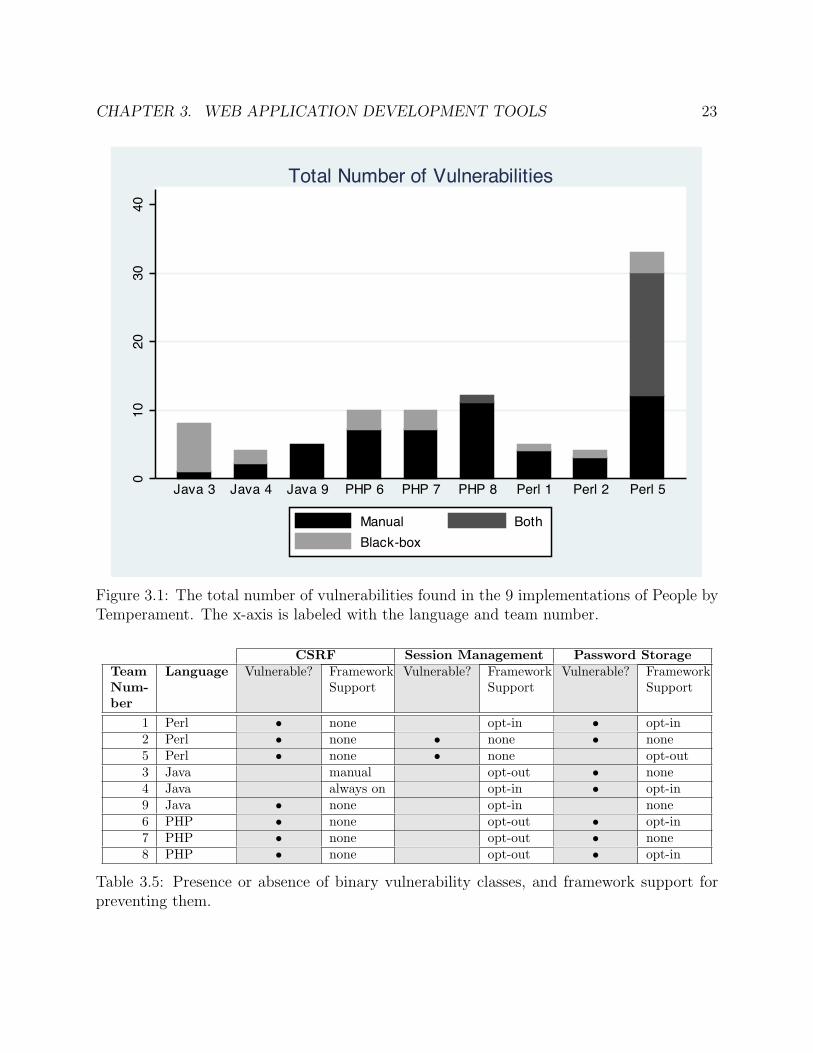
3.1 The total number of vulnerabilities found in the 9 implementations of People byTemperament. The x-axis is labeled with the language and team number. . . . . 23
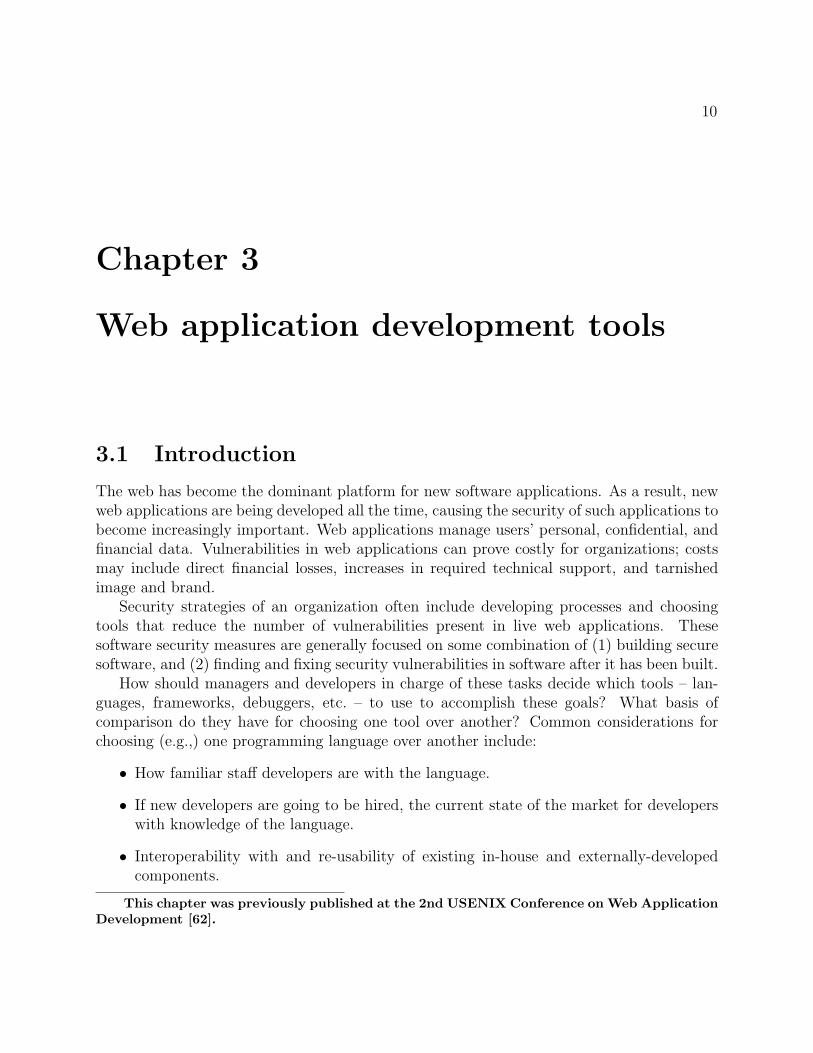
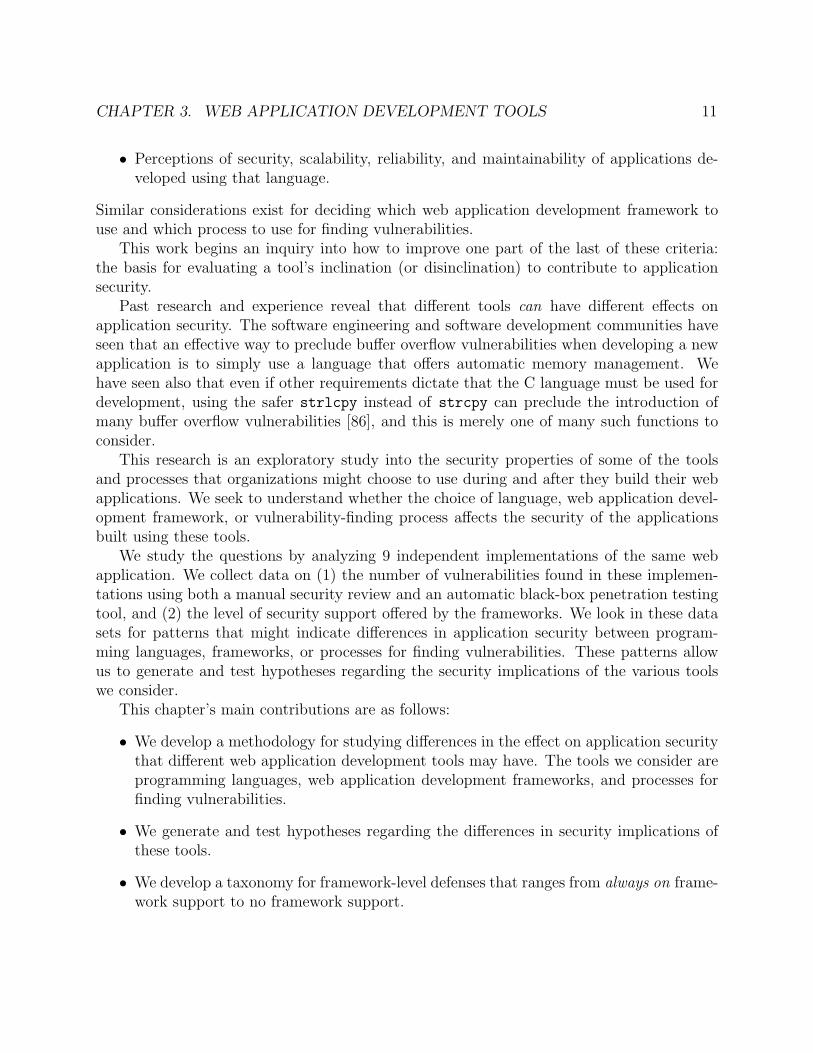
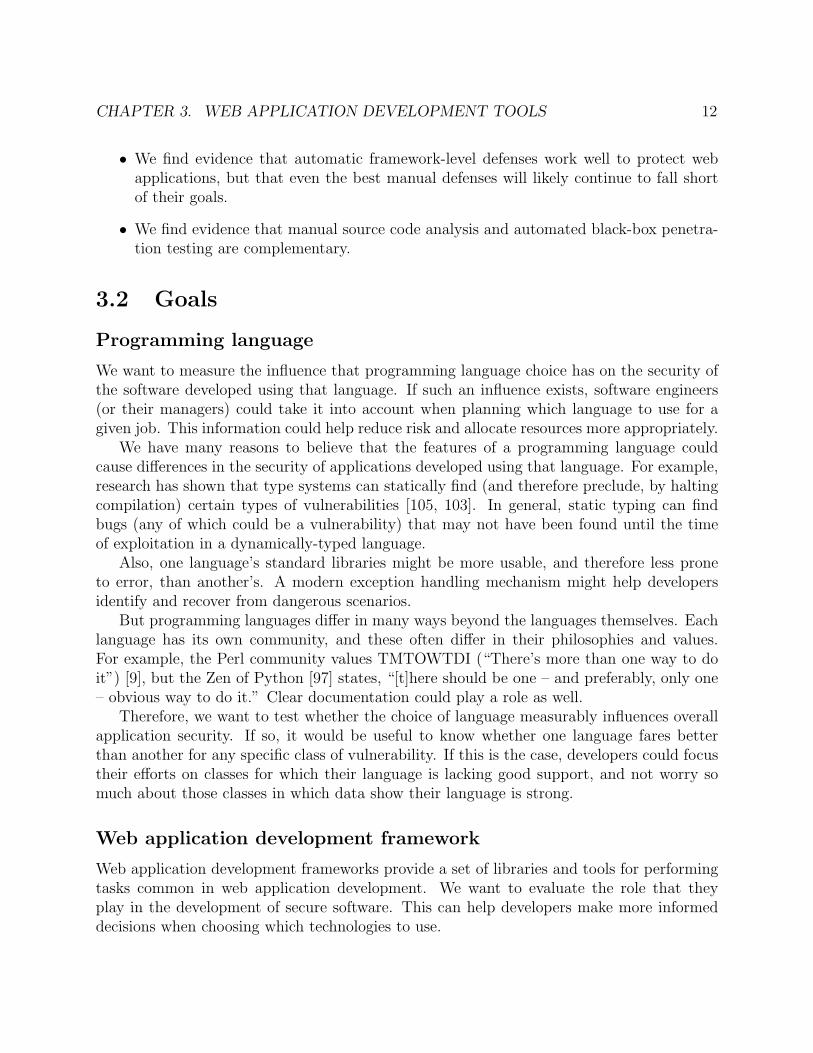
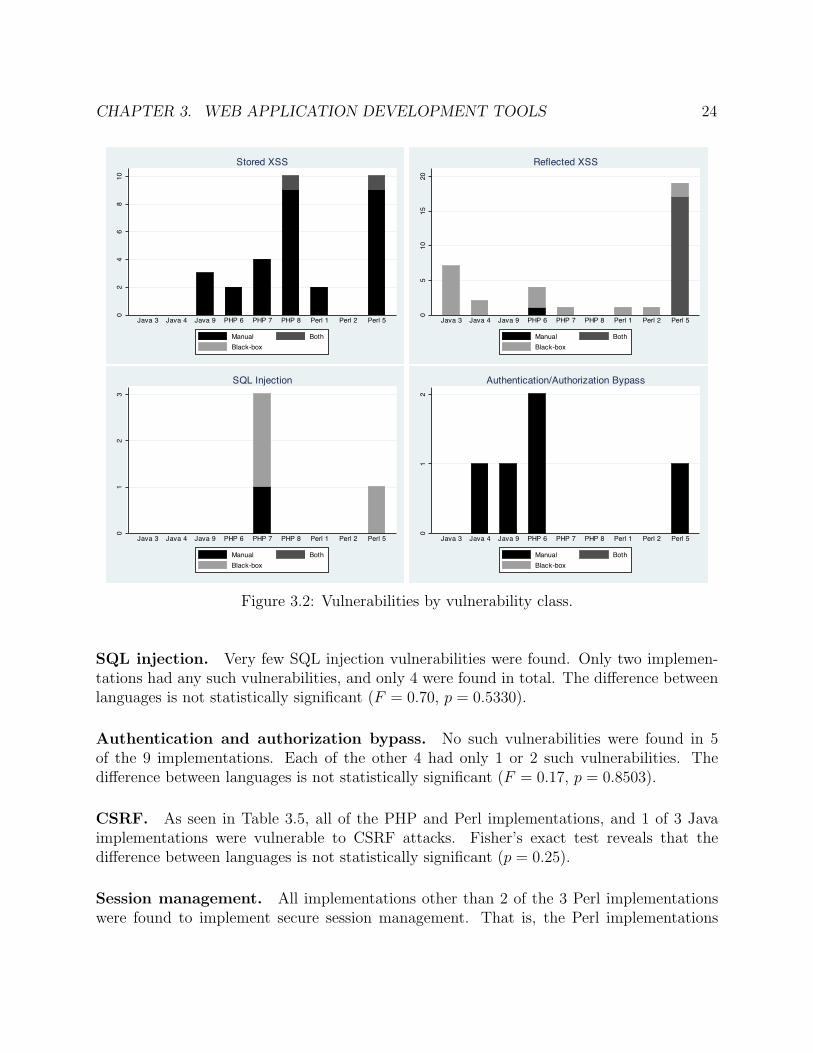
3.2 Vulnerabilities by vulnerability class. . . . . . . . . . . . . . . . . . . . . . . . . 243.3 Vulnerabilities found by manual analysis and black-box penetration testing. . . . 263.4 Level of framework support vs. number of vulnerabilities for integer-valued vul-
nerability classes. The area of a mark scales with the number of observations atits center. . . . . . . . . . . . . . . . . . . . . . . . . . . . . . . . . . . . . . . . 28
3.5 For each vulnerability found, how far developers would have to stray from thetechnologies they used in order to find framework support that could have pre-vented each vulnerability, either manually (left) or automatically (right). . . . . 29
4.1 The number of vulnerabilities found by individual reviewers. . . . . . . . . . . . 394.2 The percentage of reported vulnerabilities that were correct. . . . . . . . . . . . 414.3 The relationship between correctly reported vulnerabilities and falsely reported
vulnerabilities. . . . . . . . . . . . . . . . . . . . . . . . . . . . . . . . . . . . . 424.4 Probability of finding all vulnerabilities depending on the number of reviewers
hired. . . . . . . . . . . . . . . . . . . . . . . . . . . . . . . . . . . . . . . . . . 434.5 The relationship between years of experience in computer security and accuracy
of reports. Accuracy is defined as the fraction of correctly reported vulnerabilitiesout of the total number of reported vulnerabilities. . . . . . . . . . . . . . . . . 44
4.6 The correlation between the number of previously conducted security code reviewsand the number of correctly reported vulnerabilities. . . . . . . . . . . . . . . . 45
5.1 Moving average over the current plus 5 previous months of the percentage ofvulnerabilities at each severity level (low is blue solid line, medium is red long-dashed line, high is green short-dashed line, and critical is yellow dash-dottedline). . . . . . . . . . . . . . . . . . . . . . . . . . . . . . . . . . . . . . . . . . . 55
5.2 Number of high- plus critical-severity vulnerabilities reported over time, discov-ered internally (blue long-dashed line), externally (red short-dashed line), andtotal (green solid line). . . . . . . . . . . . . . . . . . . . . . . . . . . . . . . . . 56
iv
5.3 Number of critical-severity vulnerabilities reported over time, discovered inter-nally (blue long-dashed line), externally (red short-dashed line), and total (greensolid line). . . . . . . . . . . . . . . . . . . . . . . . . . . . . . . . . . . . . . . . 57
5.4 Cumulative rewards paid out for Chrome (blue solid line) and Firefox (red dashedline), excluding rewards for vulnerabilities not affecting stable versions. . . . . . 60
5.5 Cumulative rewards paid out for vulnerabilities affecting a stable release (bluelong-dashed line), vulnerabilities not affecting any stable release (red short-dashedline), and the sum of the two (green solid line). . . . . . . . . . . . . . . . . . . 61
5.6 Average daily cost to date since first reward. . . . . . . . . . . . . . . . . . . . . 635.7 Cumulative number of vulnerabilities rewarded, as reported by (1) first-time VRP
contributors (blue short-dashed line), (2) repeat contributors (red long-dashedline), and (3) all contributors (green solid line). . . . . . . . . . . . . . . . . . . 65
5.8 Box and whisker plots depicting the distributions of time between vulnerabilityreport and release that patches the vulnerability, for each severity level. . . . . . 68
5.9 Scatter plots depicting the time between vulnerability report and release thatpatches the vulnerability vs. time, for each severity level. . . . . . . . . . . . . . 69
5.10 Standard deviation of time to patch over time. For a given release date, they-value is the standard deviation of all bugs patched in that release or up to fiveprior releases. The red solid line is for Firefox, and the blue dashed line is forChrome. . . . . . . . . . . . . . . . . . . . . . . . . . . . . . . . . . . . . . . . . 70
5.11 Independent vulnerability discoveries within the Chrome VRP data set. Each dotrepresents an individual contributor in our data set. Its x-value gives the numberof vulnerabilities contributed by this individual, and its y-value gives the numberof these contributions that were independently discovered by another contributorin our data set. . . . . . . . . . . . . . . . . . . . . . . . . . . . . . . . . . . . . 72
v
List of Tables
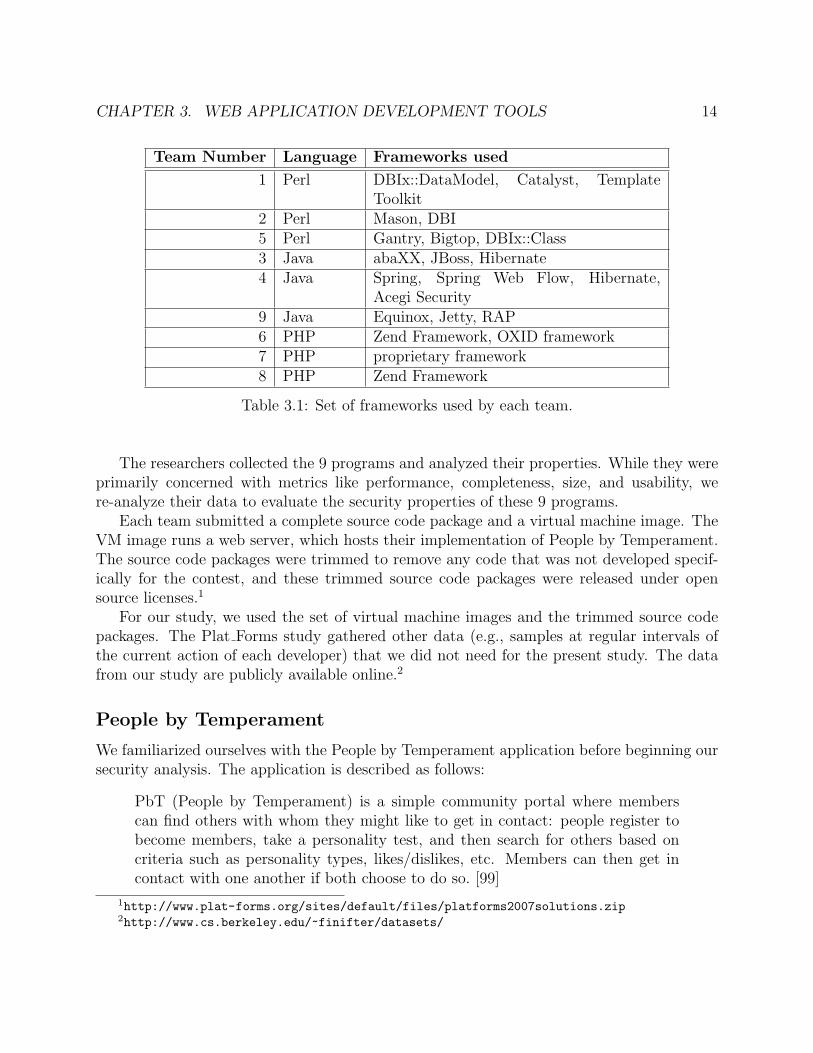
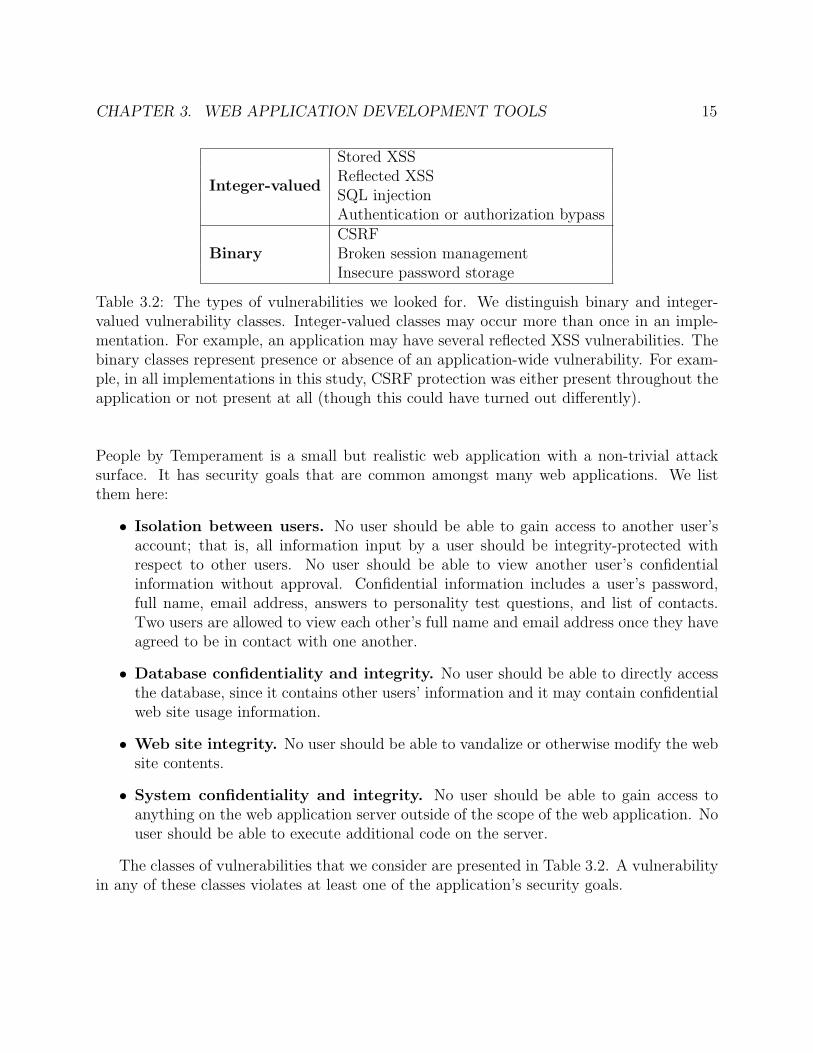
3.1 Set of frameworks used by each team. . . . . . . . . . . . . . . . . . . . . . . . . 143.2 The types of vulnerabilities we looked for. We distinguish binary and integer-
valued vulnerability classes. Integer-valued classes may occur more than once inan implementation. For example, an application may have several reflected XSSvulnerabilities. The binary classes represent presence or absence of an application-wide vulnerability. For example, in all implementations in this study, CSRFprotection was either present throughout the application or not present at all(though this could have turned out differently). . . . . . . . . . . . . . . . . . . 15
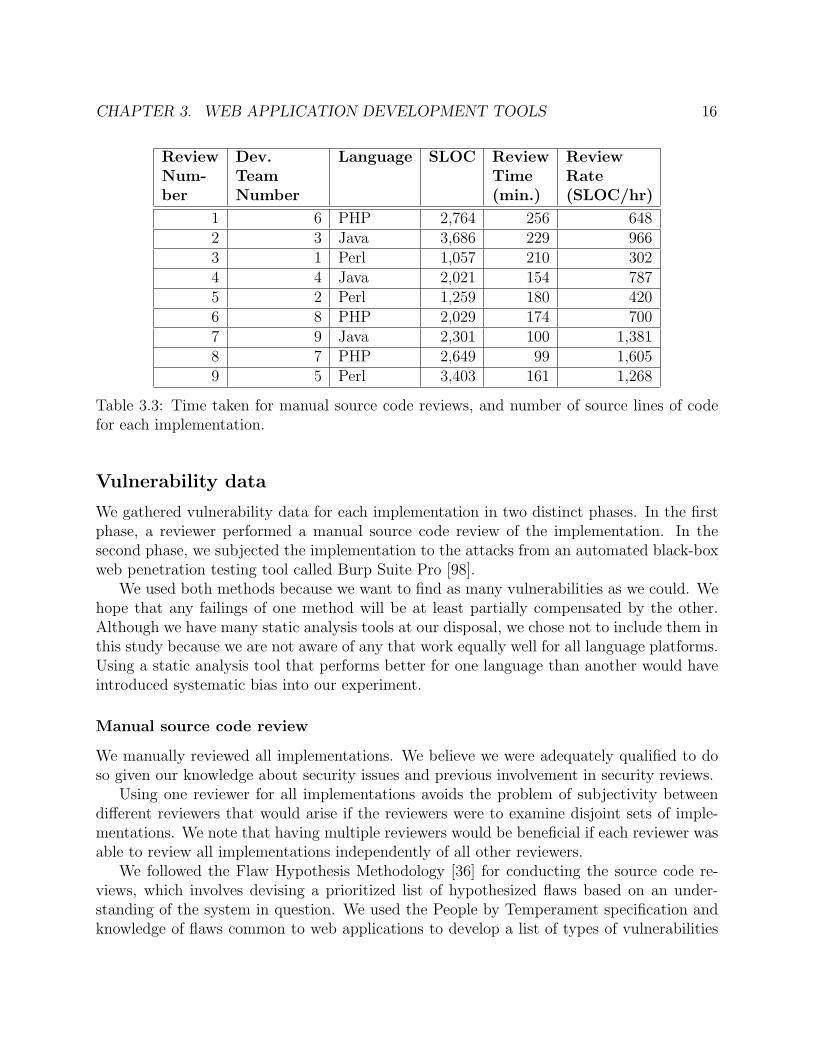
3.3 Time taken for manual source code reviews, and number of source lines of codefor each implementation. . . . . . . . . . . . . . . . . . . . . . . . . . . . . . . . 16
3.4 Statistics of the programmers. . . . . . . . . . . . . . . . . . . . . . . . . . . . . 203.5 Presence or absence of binary vulnerability classes, and framework support for
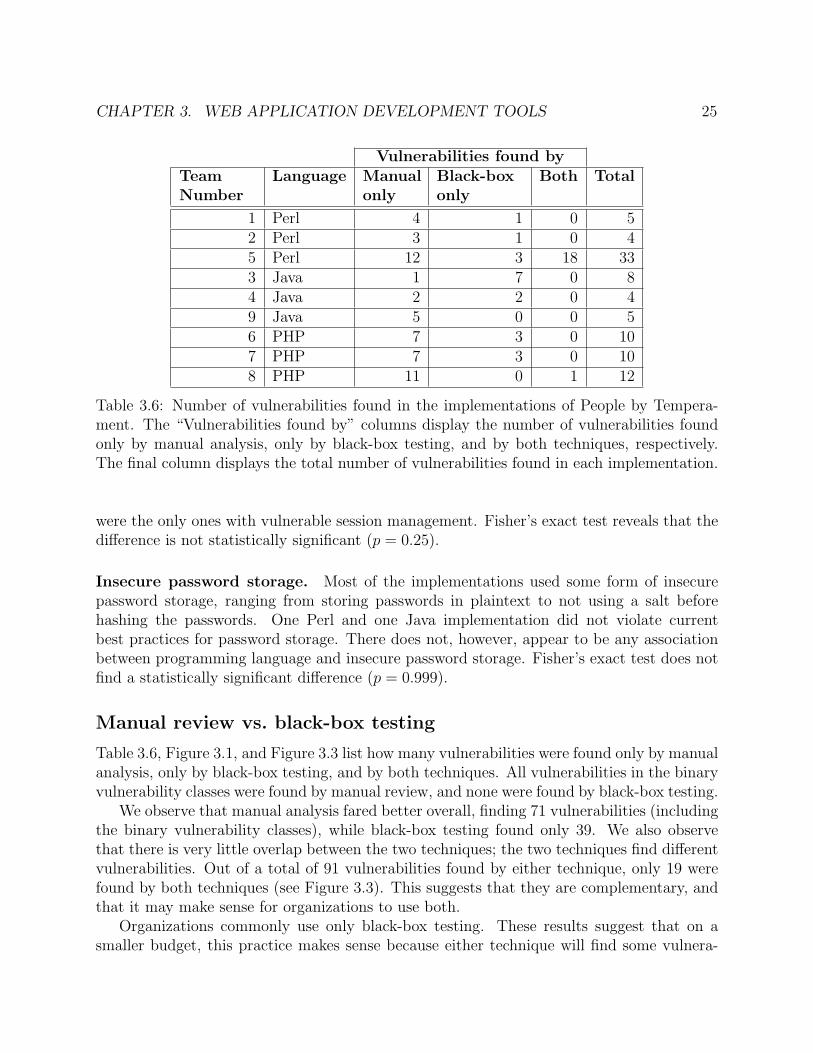
preventing them. . . . . . . . . . . . . . . . . . . . . . . . . . . . . . . . . . . . 233.6 Number of vulnerabilities found in the implementations of People by Tempera-
ment. The “Vulnerabilities found by” columns display the number of vulnera-bilities found only by manual analysis, only by black-box testing, and by bothtechniques, respectively. The final column displays the total number of vulnera-bilities found in each implementation. . . . . . . . . . . . . . . . . . . . . . . . . 25
4.1 The proportion of reviewers who reported each vulnerability. . . . . . . . . . . . 404.2 Pairs of vulnerabilities for which finding one correlates with finding the other. . 404.3 The p-values for correlation tests between experience in different areas and the
number of correct vulnerabilities reported. . . . . . . . . . . . . . . . . . . . . . 44
5.1 Number of observations in our data set. . . . . . . . . . . . . . . . . . . . . . . 535.2 Frequency distribution of number of high- or critical-severity vulnerabilities found
by external contributors. . . . . . . . . . . . . . . . . . . . . . . . . . . . . . . . 585.3 Frequency distribution of number of high- or critical-severity bugs found by in-
ternal contributors. . . . . . . . . . . . . . . . . . . . . . . . . . . . . . . . . . . 595.4 Frequency distributions of total amounts earned by external VRP contributors. 645.5 Percentage of rewards given for each dollar amount in Chrome VRP. . . . . . . 66
vi
5.6 Median and standard deviation of number of days between vulnerability reportand release that patches the vulnerability, for each severity level. . . . . . . . . . 67
vii
Acknowledgments
My first thanks goes to my advisor, David Wagner. You gave me the freedom to explorewhatever I found interesting. Your positive attitude and pleasant demeanor set a greatexample for me, and I’ll be lucky if I can emulate even a few of your personality traits.
Thanks to the National Science Foundation for supporting me through a Graduate Re-search Fellowship. This award contributed greatly to my academic freedom.
Thanks to all my co-authors. You improved my research and made it more fun.Thanks to all the friends I made during graduate school. You know who you are. Let’s
stay in touch.A huge thanks to my family. You have provided the support I needed to achieve every-
thing I have achieved.Finally, thanks to my wife, Nancy. Nothing in particular, just everything. I love you.
1
Chapter 1
Introduction
Software defects are as old as software itself. They happen because software developers arehuman, and humans make mistakes. When a software defect enables a malicious actor toviolate a security goal of the software, the defect is considered a security vulnerability.
By definition, a software vulnerability enables an attacker to circumvent intended securitymechanisms, thereby giving the attacker a basis for mounting an attack. We have seen attacksthat steal money [90], perform corporate espionage [76], extort companies [77], and even takeactions that have been labeled by some as “cyber-warfare” [89, 43].
The exact technical details of software vulnerabilities vary widely, and are often catego-rized into broad vulnerability classes including memory safety, command injection, incorrectuse of cryptography, and cross-site scripting, to name a few. Potential defenses vary accord-ing to the vulnerability class, and we have seen enormous amounts of research effort goinginto improving existing defenses and devising new ones.
The presence of software vulnerabilities has become a fact of life. In response to this re-ality, the software engineering community has built up a significant amount of infrastructurewhose purpose is to (1) reduce the incidence of vulnerabilities introduced during softwaredevelopment, (2) find vulnerabilities, (2) pinpoint their root cause, (3) reproduce them, (4)patch them, and (5) deliver the patched software that fixes them. This infrastructure in-cludes development frameworks (e.g., Django [48]), static and dynamic analysis tools (e.g.,Coverity Security Advisor [44] and HP Fortify Program Trace Analyzer [74]), version controlsoftware (e.g., git [6]), bug-tracking software (e.g., Bugzilla [19]), vulnerability databases(e.g., the NVD [8]), and auto-update mechanisms (e.g., Chrome’s automatic updater [25]),among many other things, far too numerous to list here.
There is an entire ecosystem of tools, techniques, and processes designed to improve soft-ware security by preventing, finding, mitigating, and/or eliminating software vulnerabilities.Software vendors have this entire ecosystem to choose from during each phase of the softwaredevelopment lifecycle, which begins when someone identifies a software need, ends when thesoftware vendor decides to halt support for the software, and includes everything in between.
Unfortunately, guidance regarding which of these tools to choose is often non-existent orbased solely on anecdotal evidence. In this dissertation, we present three studies to demon-
CHAPTER 1. INTRODUCTION 2
strate that empirical studies can be used to enhance our understanding of the effectivenessof various tools and techniques intended to improve software security.
Toward this end, this dissertation additionally takes steps toward:
• Developing methodologies for testing the security implications of various software de-velopment and vulnerability remediation techniques.
• Supplementing opinions, recommendations, anecdotes, and “best practices” with em-pirical evidence that some technique tends to yield more secure software than someother technique.
• Improving the state of software security by providing actionable recommendationsregarding which tools or techniques to choose.
1.1 Web development languages and frameworks
The web has become one of the premier application development platforms, due to its cross-platform nature and its astonishing growth over the last several years. Web applicationdevelopers have a wide variety of programming languages and development frameworks tochoose from. Different programming languages offer web developers different trade-offs re-garding available libraries, how quickly a prototype can be developed, and which frameworksare available. Frameworks offer the developer useful tools for common tasks in web devel-opment, such as displaying common forms, validating user input, managing a user’s session,and deploying an administrative panel.
In principle, web application development frameworks occupy a valuable position forpreventing the introduction of security vulnerabilities. Frameworks can, for example, au-tomatically sanitize untrusted user input to prevent cross-site scripting attacks [5]. Theycan transparently and correctly manage a user’s session, thereby disallowing session fixationattacks. In short, there is reason to believe that choosing one framework instead of anothermay help to avoid common classes of vulnerabilities and may therefore influence applicationsecurity.
These development tools—programming languages and web application developmentframeworks—are the focus of the first empirical study we discuss, presented in Chapter 3.Using a data set consisting of 9 implementations of the same web application specification,we search for differences in security that correlate with differences in programming languageand available framework security features. Our study reveals that manual security featuresexposed by frameworks, such as providing sanitizers the developer must manually invoke,do not appear very effective at preventing the types of vulnerabilities they are intended toprevent. On the other hand, the presence of more automatic features, like CSRF protectionand secure session management, correlate almost perfectly with security against these classesof attacks. Based on the evidence from this study, we recommend choosing a framework that
CHAPTER 1. INTRODUCTION 3
has fully automatic support for as many vulnerability classes as possible, and we encour-age future research into developing more automated support for more vulnerability classes.We believe this study should serve as a valuable reference for software developers who areconcerned about security and looking for guidance as to which web development tools tochoose.
1.2 Vulnerability-finding techniques
There are a variety of techniques available to software vendors to locate vulnerabilities intheir software. These include (1) manual source code review, (2) static analysis tools, (3)dynamic analysis tools, and (4) black-box penetration testing tools. In order to reducethe number of vulnerabilities in their software, software vendors would like to choose thetechnique or combination of techniques that permits them to locate as many vulnerabilitiesin their software as possible at the lowest cost possible.
Manual source code review is one such technique. Opinions vary as to how it comparesto other techniques, e.g., automated black-box penetration testing. Our study on web ap-plication development tools, mentioned above, contributes empirical evidence to discussionsof the relative costs and benefits of these two vulnerability-finding techniques. In our study,the two techniques found largely different sets of vulnerabilities, making the two techniquesappear to be complementary.
After improving our understanding of manual source code review relative to black-boxpenetration testing, we devised another study that focused only on manual security review,which we present in Chapter 4. The goal of this study was to better understand how well thisparticular technique fares in an absolute sense. We hired 30 developers to manually reviewcode that had several known vulnerabilities, and we analyzed the distribution of the numberof vulnerabilities found by these developers. In addition, we sought potential predictors ofthese developers’ efficacy at manual security review, including number of years of education,certifications held, and number of security reviews previously performed.
We learned from this study that the overall effectiveness of these outsourced code re-viewers was rather low in an absolute sense; a reviewer found on average only 2.33 of the7 known vulnerabilities. Furthermore, the distribution of the fraction of valid vulnerabilityreports appeared bimodal; several developers reported very few false positives, while anotherlarge group reported mostly false positives. None of our survey questions (e.g., asking thereviewer how many years of experience they had working in the field of computer security)proved predictive of the effectiveness of our reviewers, which indicates that hiring outsourcedcode reviewers is, unfortunately, somewhat of a gamble. We believe this study should serveas a valuable reference for software vendors considering outsourcing their code review in amanner similar to that used in the study.
CHAPTER 1. INTRODUCTION 4
1.3 Vulnerability rewards programs
A vulnerability rewards program (VRP) is a commitment by a software vendor to pay forthe responsible disclosure of software vulnerabilities in one or more of its products. VRPstypically include a set of eligibility criteria, program rules, guidelines for reward amounts,and instructions for responsible vulnerability disclosure.
VRPs represent an emerging strategy for organizations to cost-effectively outsource thesearch for vulnerabilities to the security community. Because of their relative immaturityas a technique, the costs and benefits of VRPs are not yet clear. The study we present inChapter 5 adds empirical evidence to the discussion by studying two successful VRPs indepth. Using available data, we uncover information about the cost-effectiveness of theseVRPs, the number and types of vulnerabilities they find, and how much money individualparticipants can expect to earn, among other things. We believe this study should serveas a valuable reference for software vendors considering the development of a new VRP ormodifications to an existing VRP.
5
Chapter 2
Related work
In this chapter, we survey work related to this dissertation. This includes work that aimsto answer similar questions to those answered by this dissertation, as well as work that usessimilar techniques to those used in this dissertation.
2.1 Efficacy of tools and techniques
This section surveys work that studies how effective various tools are at finding bugs orvulnerabilities. This work is particularly relevant to Chapter 4, which studies the efficacy ofmanual source code review at finding vulnerabilities, and Chapter 5, which studies how welltwo vulnerability rewards programs (VRPs) work in practice.
Web application vulnerability detection
Most current techniques for detecting web security vulnerabilities are automated tools forstatic analysis. Accordingly, there have been many publications proposing and evaluatingnew automated tools for detecting web application vulnerabilities [69, 73, 72, 114, 78, 75].
Code review
One of the largest drawbacks to conducting code inspections is the time-consuming andcumbersome nature of the task. This high cost has motivated a number of studies investi-gating general code inspection performance and effectiveness [58, 79, 35]. Hatton [66] founda relationship between the total number of defects in a piece of code and the number ofdefects found in common by teams of inspectors. The authors gave the inspectors a programwritten in C with 62 lines of code; the inspectors were told to find any parts of the codethat would cause the program to fail. From this research, the authors were able to predictthe total number of defects with surprising accuracy; the average of the predicted number ofdefects across all 22 2-person teams was 26.47, and the actual number of defects was 26± 2.
CHAPTER 2. RELATED WORK 6
A subsequent paper by the same author [65] found that checklists had no significant effecton the effectiveness of a code inspection. Other studies have explored whether there arerelationships between specific factors, such as review rate or the presence of maintainabilitydefects (i.e., code considered difficult to change as requirements change), and code inspec-tion performance [27, 60]. These experiments were carried out on general-purpose softwareand were not focused on security vulnerabilities, whereas our study in Chapter 4 focuses onsecurity vulnerabilities in web applications.
Defect prediction
A large body of work addresses defect prediction using empirical techniques; we refer thereader to a survey by Catal et al. [41]. Defect prediction techniques rely on classical metricssuch as code complexity and lines of code. Vulnerabilities, as opposed to the more generalcategory of software defects, are harder to predict using empirical techniques. Shin andWilliams found only a weak correlation between complexity measures and vulnerabilities inthe Mozilla JavaScript engine [106]. Zimmerman et al. identify this “needle in the haystack”nature of vulnerability prediction and suggest the need for measures specific to softwaresecurity [116].
Neuhaus et al. use a data set of Firefox security advisories in combination with the Firefoxcode base to map vulnerabilities to software components and predict which components arelikely to contain vulnerabilities [92].
Meneely and Williams performed two studies to evaluate how well Linus’ Law, “Givenenough eyeballs, all bugs are shallow” [101], holds within real software projects. In the firststudy [82], they evaluate correlations between developer activity metrics and vulnerabilitiesin the Linux kernel. They identify several metrics that correlate with more vulnerabilities,and they find that files with changes from many developers (9 or more) are much more likelyto be vulnerable. In the second study [83], they replicate the first study on two differentsoftware projects: PHP and Wireshark. They confirm their findings from the first studyand strengthen their models that predict vulnerable components based on the number ofdevelopers that have committed to the code.
2.2 Comparisons between different tools
This section surveys work that explicitly compares one tool to another. This work is particu-larly relevant to Chapter 3, which aims to compare programming languages, web applicationdevelopment frameworks, and vulnerability-finding techniques. Additionally, our study onVRPs in Chapter 5 makes a comparison between the VRP of Google Chrome and that ofMozilla Firefox.
CHAPTER 2. RELATED WORK 7
Programming languages
The 9th edition of the WhiteHat Website Security Statistic Report [115] offers insight into therelationship between programming language and application security. Their data set, whichincludes over 1,500 web applications and over 20,000 vulnerabilities, was gathered from thepenetration-testing service WhiteHat performs for its clients. Their report found differencesbetween languages in the prevalence of different vulnerability classes as well as the averagenumber of “serious” vulnerabilities over the lifetime of the applications. For example, in theirsample of applications, 57% of the vulnerabilities in JSP (JavaServer Pages) applicationswere XSS vulnerabilities, while only 52% of the vulnerabilities in Perl applications were XSSvulnerabilities. Another finding was that PHP applications were found to have an average of26.6 vulnerabilities over their lifetime, while Perl applications had 44.8 and JSP applicationshad 25.8.
Walden et al. [113] measured the vulnerability density of the source code of 14 PHP and11 Java applications, using different static analysis tools for each set. They found that theJava applications had lower vulnerability density than the PHP applications, but the resultwas not statistically significant.
While these analyses sample across distinct applications, our study in Chapter 3 samplesacross different implementations of the same application. Our data set is smaller, but itscollection was more controlled. The first study focused on fixed combinations of programminglanguage and framework (e.g., Java JSP), and the second did not include a frameworkcomparison. Our study focuses separately on language and framework.
Dwarampudi et al. [51] compiled a fairly comprehensive list of pros and cons of theofferings of several different programming languages with respect to many language features,including security. No experiment or data analysis were performed as a part of this effort.
The Plat Forms [100] study (from which our study in Chapter 3 acquired much of itsdata) performed a shallow security analysis of their data set. They ran simple black-boxtests against the implementations in order to find indications of errors or vulnerabilities, andthey found minor differences, which are consistent with our results. We greatly extendedtheir study using both white- and black-box techniques to find vulnerabilities.
Black-box penetration testing tools
We are aware of three separate efforts to compare the effectiveness of different automatedblack-box web application security scanners. Suto [107] tested each scanner against thedemonstration site of each other scanner and found differences in the effectiveness of thedifferent tools. His report lists detailed pros and cons of using each tool based on hisexperience.
Bau et al. [33] tested 8 different scanners in an effort to identify ways in which thestate of the art of black box scanning could be improved. They found that the scannerstended to perform well on reflected XSS and first-order SQL injection vulnerabilities (i.e.,one in which malicious input flows directly into a SQL query), but poorly on second-order
CHAPTER 2. RELATED WORK 8
vulnerabilities (e.g., stored XSS and SQL injection vulnerabilities in which stored maliciouscontent flows into a SQL query). We augment this finding with the result that manualanalysis performs better for stored XSS, authentication and authorization bypass, CSRF,insecure session management, and insecure password storage, and black-box testing performsbetter for reflected XSS and SQL injection (Chapter 3).
Doupe et al. [50] evaluated 11 scanners against a web application custom-designed tohave many different crawling challenges and types of vulnerabilities. They found that thescanners were generally poor at crawling the site, that they performed poorly against “logic”vulnerabilities (e.g., application-specific vulnerabilities, which often include authorizationbypass vulnerabilities), and that they required their operators to have a lot of knowledgeand training to be able to use them effectively.
While these studies compare several black-box tools to one another, we compare theeffectiveness of a single black-box tool to that of manual source code analysis (Chapter 3)and we subsequently analyze manual source code analysis in detail (Chapter 4). Our choiceregarding which black-box scanner to use when designing our study on web applicationdevelopment tools was based in part on these studies of black-box scanners.
Bug-finding techniques
Wagner et al. [112] performed a case study against 5 applications in which they analyzed thetrue- and false-positive rates of three static bug-finding tools and compared manual sourcecode review to static analysis for one of the 5 applications. This study focused on defects ofany type, making no specific mention of security vulnerabilities. They found that all defectsthe static analysis tools discovered were also found by the manual review. Our study inChapter 3 focuses specifically on security vulnerabilities in web applications, and we use adifferent type of tool in our study than they use in their study.
Two short articles [45, 80] discuss differences between various tools one might considerusing to find vulnerabilities in an application. The first lists constraints, pros, and consof several tools, including source code analysis, dynamic analysis, and black-box scanners.The second article discusses differences between white- and black-box approaches to findingvulnerabilities. Overall, these articles provide a gentle introduction to the space of optionsavailable for finding vulnerabilities. Our studies, on the other hand, gather evidence tosuggest how well various tools work in practice.
Basili and Selby [32] compared the effectiveness of code reading by stepwise abstrac-tion, functional testing, and structural testing. They found that when the experiment wasperformed with professional programmers, code reading detected more faults than eitherfunctional or structural testing. The experiments were performed on software written inprocedural languages, but none were network-facing applications. Jones [71] showed thatno single method out of formal design inspection, formal code inspection, formal qualityassurance, and formal testing was highly efficient in detecting and removing defects; a com-bination of all four methods yielded the highest efficiency. When only one method was used,the highest efficiency for removing defects was achieved by formal design inspection followed
CHAPTER 2. RELATED WORK 9
by formal code inspection. When we conducted our study in Chapter 4, we did not specifyhow the reviewers should review the code as long as they did not use any automated tools.
Austin and Williams evaluated four different techniques for vulnerability discovery ontwo health record systems: “systematic and exploratory manual penetration testing, staticanalysis, and automated penetration testing” [28], finding that very few vulnerabilities arein fact found by multiple techniques and that automatic automated penetration testing isthe most effective in terms of vulnerabilities found per hour.
2.3 Vulnerability ecosystem
This section surveys work that uses vulnerability data sets to discover how the nature ofvulnerabilities (e.g., the number of vulnerabilities present, the severity of vulnerabilities, orhow long vulnerabilities remain latent) has changed over time within a single applicationor across multiple applications. This work is particularly relevant to Chapter 5, which usesa data set of vulnerabilities in two web browsers to understand how the security of thesebrowsers has changed over time.
Vulnerability rates within software
Rescorla gathered data from NIST’s ICAT database (which has since been updated and re-named to NVD [8]) to analyze whether vulnerability rates tend to decrease over time [102].He found no evidence that it is in fact worthwhile for software vendors to attempt to find vul-nerabilities in their own software because there is no evidence that such efforts are reducingvulnerability rates.
Ozment and Schechter used the OpenBSD CVS repository to ask and answer similarquestions as Rescorla [95]. They find that the rate of discovery of what they call foundationalvulnerabilities—those present since the beginning of the study period—had decreased overthe study period.
Neuhaus and Plattner use vulnerability reports for Mozilla, Apache httpd, and ApacheTomcat to evaluate whether vulnerability fix rates have changed over time [91]. They con-clude that the supply of vulnerabilities is not declining, and therefore that attackers and/orvulnerability researchers have not hit diminishing returns in looking for vulnerabilities.
Evolution of vulnerabilities over time
Scholte et al. use the NVD to evaluate how cross-site scripting and SQL injection vulnera-bilities have evolved over time [104]. They find that the complexity of such vulnerabilitiesdoes not appear to have changed over time and that many foundational cross-site scriptingvulnerabilities are still being discovered.
10
Chapter 3
Web application development tools
3.1 Introduction
The web has become the dominant platform for new software applications. As a result, newweb applications are being developed all the time, causing the security of such applications tobecome increasingly important. Web applications manage users’ personal, confidential, andfinancial data. Vulnerabilities in web applications can prove costly for organizations; costsmay include direct financial losses, increases in required technical support, and tarnishedimage and brand.
Security strategies of an organization often include developing processes and choosingtools that reduce the number of vulnerabilities present in live web applications. Thesesoftware security measures are generally focused on some combination of (1) building securesoftware, and (2) finding and fixing security vulnerabilities in software after it has been built.
How should managers and developers in charge of these tasks decide which tools – lan-guages, frameworks, debuggers, etc. – to use to accomplish these goals? What basis ofcomparison do they have for choosing one tool over another? Common considerations forchoosing (e.g.,) one programming language over another include:
• How familiar staff developers are with the language.
• If new developers are going to be hired, the current state of the market for developerswith knowledge of the language.
• Interoperability with and re-usability of existing in-house and externally-developedcomponents.
This chapter was previously published at the 2nd USENIX Conference on Web ApplicationDevelopment [62].
CHAPTER 3. WEB APPLICATION DEVELOPMENT TOOLS 11
• Perceptions of security, scalability, reliability, and maintainability of applications de-veloped using that language.
Similar considerations exist for deciding which web application development framework touse and which process to use for finding vulnerabilities.
This work begins an inquiry into how to improve one part of the last of these criteria:the basis for evaluating a tool’s inclination (or disinclination) to contribute to applicationsecurity.
Past research and experience reveal that different tools can have different effects onapplication security. The software engineering and software development communities haveseen that an effective way to preclude buffer overflow vulnerabilities when developing a newapplication is to simply use a language that offers automatic memory management. Wehave seen also that even if other requirements dictate that the C language must be used fordevelopment, using the safer strlcpy instead of strcpy can preclude the introduction ofmany buffer overflow vulnerabilities [86], and this is merely one of many such functions toconsider.
This research is an exploratory study into the security properties of some of the toolsand processes that organizations might choose to use during and after they build their webapplications. We seek to understand whether the choice of language, web application devel-opment framework, or vulnerability-finding process affects the security of the applicationsbuilt using these tools.
We study the questions by analyzing 9 independent implementations of the same webapplication. We collect data on (1) the number of vulnerabilities found in these implemen-tations using both a manual security review and an automatic black-box penetration testingtool, and (2) the level of security support offered by the frameworks. We look in these datasets for patterns that might indicate differences in application security between program-ming languages, frameworks, or processes for finding vulnerabilities. These patterns allowus to generate and test hypotheses regarding the security implications of the various toolswe consider.
This chapter’s main contributions are as follows:
• We develop a methodology for studying differences in the effect on application securitythat different web application development tools may have. The tools we consider areprogramming languages, web application development frameworks, and processes forfinding vulnerabilities.
• We generate and test hypotheses regarding the differences in security implications ofthese tools.
• We develop a taxonomy for framework-level defenses that ranges from always on frame-work support to no framework support.
CHAPTER 3. WEB APPLICATION DEVELOPMENT TOOLS 12
• We find evidence that automatic framework-level defenses work well to protect webapplications, but that even the best manual defenses will likely continue to fall shortof their goals.
• We find evidence that manual source code analysis and automated black-box penetra-tion testing are complementary.
3.2 Goals
Programming language
We want to measure the influence that programming language choice has on the security ofthe software developed using that language. If such an influence exists, software engineers(or their managers) could take it into account when planning which language to use for agiven job. This information could help reduce risk and allocate resources more appropriately.
We have many reasons to believe that the features of a programming language couldcause differences in the security of applications developed using that language. For example,research has shown that type systems can statically find (and therefore preclude, by haltingcompilation) certain types of vulnerabilities [105, 103]. In general, static typing can findbugs (any of which could be a vulnerability) that may not have been found until the timeof exploitation in a dynamically-typed language.
Also, one language’s standard libraries might be more usable, and therefore less proneto error, than another’s. A modern exception handling mechanism might help developersidentify and recover from dangerous scenarios.
But programming languages differ in many ways beyond the languages themselves. Eachlanguage has its own community, and these often differ in their philosophies and values.For example, the Perl community values TMTOWTDI (“There’s more than one way to doit”) [9], but the Zen of Python [97] states, “[t]here should be one – and preferably, only one– obvious way to do it.” Clear documentation could play a role as well.
Therefore, we want to test whether the choice of language measurably influences overallapplication security. If so, it would be useful to know whether one language fares betterthan another for any specific class of vulnerability. If this is the case, developers could focustheir efforts on classes for which their language is lacking good support, and not worry somuch about those classes in which data show their language is strong.
Web application development framework
Web application development frameworks provide a set of libraries and tools for performingtasks common in web application development. We want to evaluate the role that theyplay in the development of secure software. This can help developers make more informeddecisions when choosing which technologies to use.
CHAPTER 3. WEB APPLICATION DEVELOPMENT TOOLS 13
Recently, we have seen a trend of frameworks adding security features over time. Manymodern frameworks take care of creating secure session identifiers (e.g., Zend, Ruby onRails), and some have added support for automatically avoiding cross-site scripting (XSS) orcross-site request forgery (CSRF) vulnerabilities (e.g., Django, CodeIgniter). It is natural towonder whether frameworks that are proactive in developing security features yield softwarewith measurably better security, but up to this point we have no data showing whether thisis so.
Vulnerability-finding tool
Many organizations manage security risk by assessing the security of software before theydeploy or ship it. For web applications, two prominent ways to do so are: (1) black-boxpenetration testing, using automated tools designed for this purpose, and (2) manual sourcecode analysis by an analyst knowledgeable about security risks and common vulnerabilities.The former has the advantage of being mostly automated and being cheaper; the latterhas a reputation as more comprehensive but more expensive. However, we are not aware ofquantitative data to measure their relative efficacy. We work toward addressing this problemby comparing the effectiveness of manual review to that of automated black-box penetrationtesting. Solid data on this question may help organizations make an informed choice betweenthese assessment methods.
3.3 Methodology
In order to address these questions, we analyze several independent implementations ofthe same web application specification, written using different programming languages anddifferent frameworks. We find vulnerabilities in these applications using both manual sourcecode review and automated black-box penetration testing, and we determine the level offramework support each implementation has at its disposal to help it contend with variousclasses of vulnerabilities. We look for associations between: (1) programming language andnumber of vulnerabilities, (2) framework support and number of vulnerabilities, and (3)number of vulnerabilities found by manual source code analysis and by automated black-boxpenetration testing.
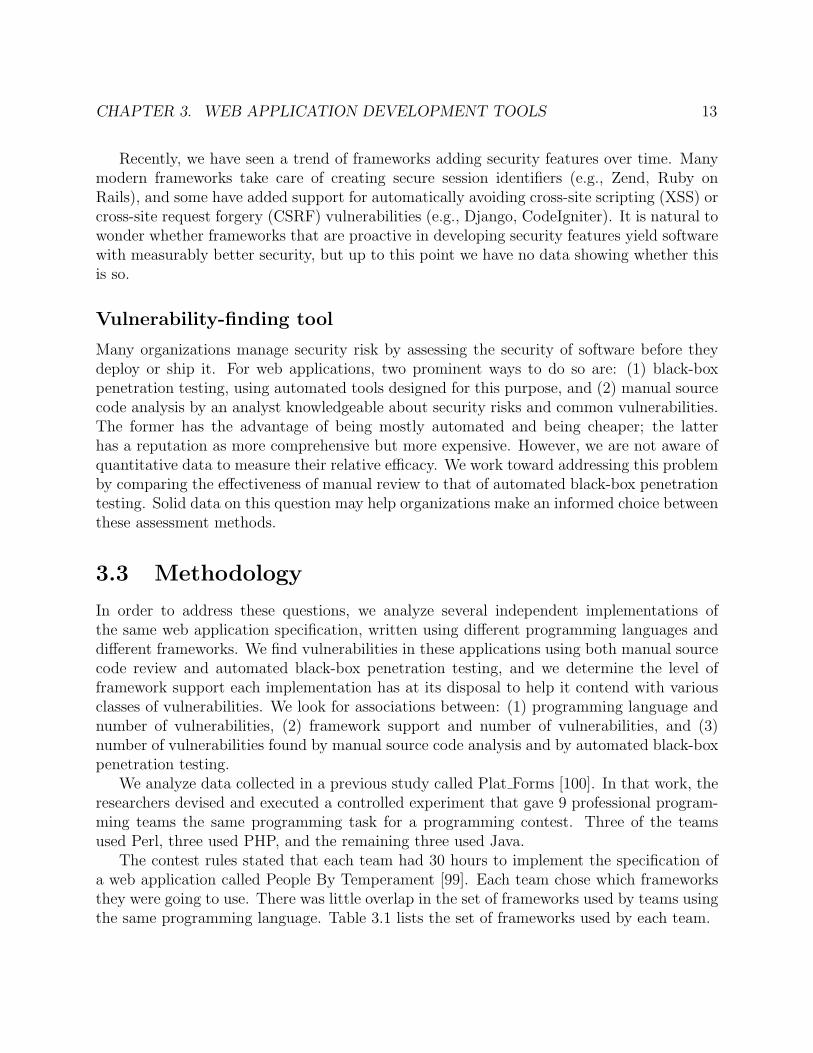
We analyze data collected in a previous study called Plat Forms [100]. In that work, theresearchers devised and executed a controlled experiment that gave 9 professional program-ming teams the same programming task for a programming contest. Three of the teamsused Perl, three used PHP, and the remaining three used Java.
The contest rules stated that each team had 30 hours to implement the specification ofa web application called People By Temperament [99]. Each team chose which frameworksthey were going to use. There was little overlap in the set of frameworks used by teams usingthe same programming language. Table 3.1 lists the set of frameworks used by each team.
CHAPTER 3. WEB APPLICATION DEVELOPMENT TOOLS 14
Team Number Language Frameworks used
1 Perl DBIx::DataModel, Catalyst, TemplateToolkit
2 Perl Mason, DBI5 Perl Gantry, Bigtop, DBIx::Class3 Java abaXX, JBoss, Hibernate4 Java Spring, Spring Web Flow, Hibernate,
Acegi Security9 Java Equinox, Jetty, RAP6 PHP Zend Framework, OXID framework7 PHP proprietary framework8 PHP Zend Framework
Table 3.1: Set of frameworks used by each team.
The researchers collected the 9 programs and analyzed their properties. While they wereprimarily concerned with metrics like performance, completeness, size, and usability, were-analyze their data to evaluate the security properties of these 9 programs.
Each team submitted a complete source code package and a virtual machine image. TheVM image runs a web server, which hosts their implementation of People by Temperament.The source code packages were trimmed to remove any code that was not developed specif-ically for the contest, and these trimmed source code packages were released under opensource licenses.1
For our study, we used the set of virtual machine images and the trimmed source codepackages. The Plat Forms study gathered other data (e.g., samples at regular intervals ofthe current action of each developer) that we did not need for the present study. The datafrom our study are publicly available online.2
People by Temperament
We familiarized ourselves with the People by Temperament application before beginning oursecurity analysis. The application is described as follows:
PbT (People by Temperament) is a simple community portal where memberscan find others with whom they might like to get in contact: people register tobecome members, take a personality test, and then search for others based oncriteria such as personality types, likes/dislikes, etc. Members can then get incontact with one another if both choose to do so. [99]
1http://www.plat-forms.org/sites/default/files/platforms2007solutions.zip2http://www.cs.berkeley.edu/~finifter/datasets/
CHAPTER 3. WEB APPLICATION DEVELOPMENT TOOLS 15
Integer-valued
Stored XSSReflected XSSSQL injectionAuthentication or authorization bypass
BinaryCSRFBroken session managementInsecure password storage
Table 3.2: The types of vulnerabilities we looked for. We distinguish binary and integer-valued vulnerability classes. Integer-valued classes may occur more than once in an imple-mentation. For example, an application may have several reflected XSS vulnerabilities. Thebinary classes represent presence or absence of an application-wide vulnerability. For exam-ple, in all implementations in this study, CSRF protection was either present throughout theapplication or not present at all (though this could have turned out differently).
People by Temperament is a small but realistic web application with a non-trivial attacksurface. It has security goals that are common amongst many web applications. We listthem here:
• Isolation between users. No user should be able to gain access to another user’saccount; that is, all information input by a user should be integrity-protected withrespect to other users. No user should be able to view another user’s confidentialinformation without approval. Confidential information includes a user’s password,full name, email address, answers to personality test questions, and list of contacts.Two users are allowed to view each other’s full name and email address once they haveagreed to be in contact with one another.
• Database confidentiality and integrity. No user should be able to directly accessthe database, since it contains other users’ information and it may contain confidentialweb site usage information.
• Web site integrity. No user should be able to vandalize or otherwise modify the website contents.
• System confidentiality and integrity. No user should be able to gain access toanything on the web application server outside of the scope of the web application. Nouser should be able to execute additional code on the server.
The classes of vulnerabilities that we consider are presented in Table 3.2. A vulnerabilityin any of these classes violates at least one of the application’s security goals.
CHAPTER 3. WEB APPLICATION DEVELOPMENT TOOLS 16
ReviewNum-ber
Dev.TeamNumber
Language SLOC ReviewTime(min.)
ReviewRate(SLOC/hr)
1 6 PHP 2,764 256 6482 3 Java 3,686 229 9663 1 Perl 1,057 210 3024 4 Java 2,021 154 7875 2 Perl 1,259 180 4206 8 PHP 2,029 174 7007 9 Java 2,301 100 1,3818 7 PHP 2,649 99 1,6059 5 Perl 3,403 161 1,268
Table 3.3: Time taken for manual source code reviews, and number of source lines of codefor each implementation.
Vulnerability data
We gathered vulnerability data for each implementation in two distinct phases. In the firstphase, a reviewer performed a manual source code review of the implementation. In thesecond phase, we subjected the implementation to the attacks from an automated black-boxweb penetration testing tool called Burp Suite Pro [98].
We used both methods because we want to find as many vulnerabilities as we could. Wehope that any failings of one method will be at least partially compensated by the other.Although we have many static analysis tools at our disposal, we chose not to include them inthis study because we are not aware of any that work equally well for all language platforms.Using a static analysis tool that performs better for one language than another would haveintroduced systematic bias into our experiment.
Manual source code review
We manually reviewed all implementations. We believe we were adequately qualified to doso given our knowledge about security issues and previous involvement in security reviews.
Using one reviewer for all implementations avoids the problem of subjectivity betweendifferent reviewers that would arise if the reviewers were to examine disjoint sets of imple-mentations. We note that having multiple reviewers would be beneficial if each reviewer wasable to review all implementations independently of all other reviewers.
We followed the Flaw Hypothesis Methodology [36] for conducting the source code re-views, which involves devising a prioritized list of hypothesized flaws based on an under-standing of the system in question. We used the People by Temperament specification andknowledge of flaws common to web applications to develop a list of types of vulnerabilities
CHAPTER 3. WEB APPLICATION DEVELOPMENT TOOLS 17
to look for. We performed two phases of review, first looking for specific types of flaws fromthe list, then comprehensively reviewing the implementation. We confirmed each suspectedvulnerability by developing an exploit.
We randomly generated the order in which to perform the manual source code reviewsin order to mitigate any biases that may have resulted from choosing any particular revieworder. Table 3.3 presents the order in which the reviewer reviewed the implementations aswell as the amount of time spent on each review.
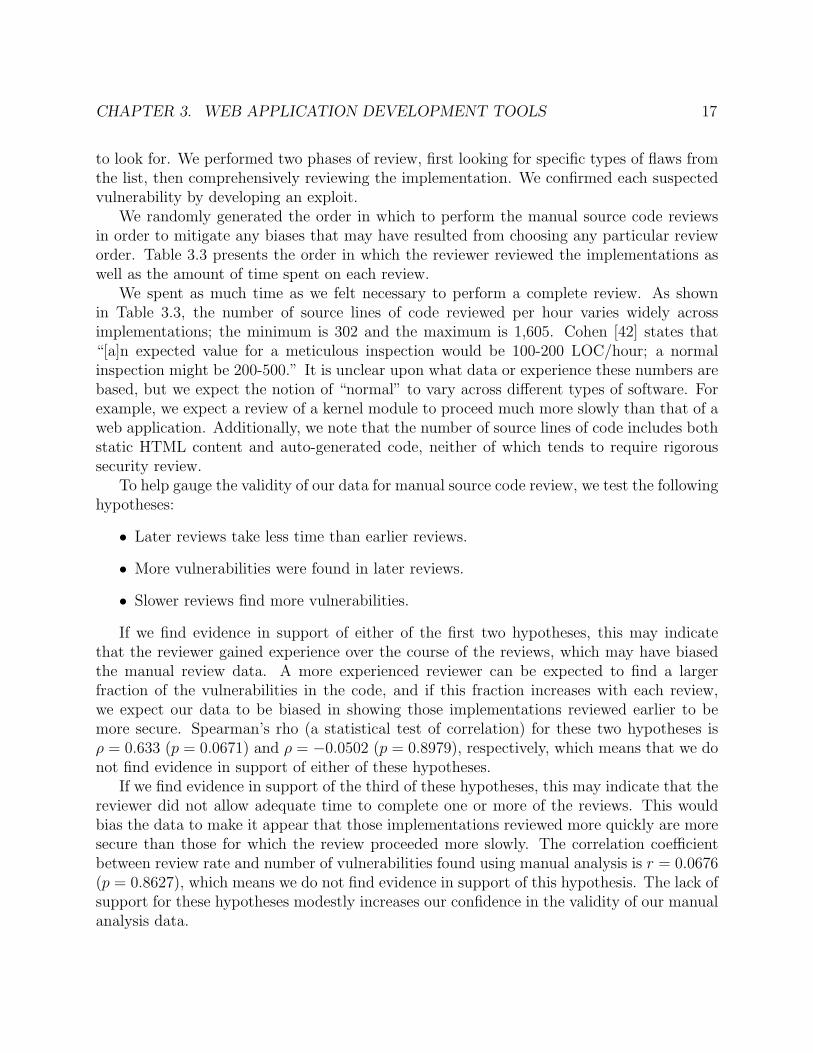
We spent as much time as we felt necessary to perform a complete review. As shownin Table 3.3, the number of source lines of code reviewed per hour varies widely acrossimplementations; the minimum is 302 and the maximum is 1,605. Cohen [42] states that“[a]n expected value for a meticulous inspection would be 100-200 LOC/hour; a normalinspection might be 200-500.” It is unclear upon what data or experience these numbers arebased, but we expect the notion of “normal” to vary across different types of software. Forexample, we expect a review of a kernel module to proceed much more slowly than that of aweb application. Additionally, we note that the number of source lines of code includes bothstatic HTML content and auto-generated code, neither of which tends to require rigoroussecurity review.
To help gauge the validity of our data for manual source code review, we test the followinghypotheses:
• Later reviews take less time than earlier reviews.
• More vulnerabilities were found in later reviews.
• Slower reviews find more vulnerabilities.
If we find evidence in support of either of the first two hypotheses, this may indicatethat the reviewer gained experience over the course of the reviews, which may have biasedthe manual review data. A more experienced reviewer can be expected to find a largerfraction of the vulnerabilities in the code, and if this fraction increases with each review,we expect our data to be biased in showing those implementations reviewed earlier to bemore secure. Spearman’s rho (a statistical test of correlation) for these two hypotheses isρ = 0.633 (p = 0.0671) and ρ = −0.0502 (p = 0.8979), respectively, which means that we donot find evidence in support of either of these hypotheses.
If we find evidence in support of the third of these hypotheses, this may indicate that thereviewer did not allow adequate time to complete one or more of the reviews. This wouldbias the data to make it appear that those implementations reviewed more quickly are moresecure than those for which the review proceeded more slowly. The correlation coefficientbetween review rate and number of vulnerabilities found using manual analysis is r = 0.0676(p = 0.8627), which means we do not find evidence in support of this hypothesis. The lack ofsupport for these hypotheses modestly increases our confidence in the validity of our manualanalysis data.
CHAPTER 3. WEB APPLICATION DEVELOPMENT TOOLS 18
Black-box testing
We used Portswigger’s Burp Suite Professional version 1.3.08 [98] for black box testing ofthe implementations. We chose this tool because a previous study has shown it to be amongthe best of the black box testing tools [50] and because it has a relatively low cost.
We manually spidered each implementation before running Burp Suite’s automated at-tack mode (called “scanner”). All vulnerabilities found by Burp Suite were manually verifiedand de-duplicated (when necessary). Manual verification was necessary because Burp Suite’sresults often included findings that were not true vulnerabilities. We counted separate find-ings as duplicates when they were the result of an error in the same line of code.
Framework support data
We devised a taxonomy to categorize the level of support a framework provides for protectingagainst various vulnerability classes. We distinguish levels of framework support as follows.
The strongest level of framework support is always on. Once a developer decides to usea framework that offers always-on protection for some vulnerability class, a vulnerabilityin that class cannot be introduced unless the developer stops using the framework. Anexample of this is the CSRF protection provided automatically by Spring Web Flow [49],which Team 4 used in its implementation. Spring Web Flow introduces the notion of tokens,which define flows through the UI of an application, and these tokens double as CSRF tokens,a well-known protection mechanism for defending against CSRF vulnerabilities. Since theyare integral to the functionality the framework provides, they cannot be removed or disabledwithout ceasing to use the framework entirely.
The next strongest level of framework support is opt-out support. This level of supportprovides protection against a vulnerability class by default, but it can be disabled by thedeveloper if he so desires. Team 2’s custom ORM framework provides opt-out support forSQL injection. If the framework is used, SQL injection cannot occur, but a developer canopt out by going around the framework to directly issue SQL queries.
Opt-in support refers to a defense that is disabled by default, but can be enabled by thedeveloper to provide protection throughout the application. Enabling the protection mayinvolve changing a configuration variable or calling into the framework code at initializationtime. Once enabled, opt-in support defends against all subsequent instances of that vulner-ability class. Acegi Security, used by Team 4, provides a PasswordEncoder interface withseveral different implementations. We consider this opt-in support because a developer canselect an implementation that provides secure password storage for his application.
Manual support is the weakest level of framework support. This term applies if theframework provides a useful routine to help protect against a vulnerability class, but thatroutine must be utilized by the developer each time protection is desired. For example, manyframeworks provide XSS filters that can be applied to untrusted data before it is included inthe HTML page. These filters spare a developer the burden of writing a correct filter, butthe developer must still remember to invoke the filter every time untrusted data is output
CHAPTER 3. WEB APPLICATION DEVELOPMENT TOOLS 19
to a user. Manual support is weak because a developer has many opportunities to make anerror of omission. Forgetting to call a routine (such as an XSS filter) even once is enoughto introduce a vulnerability. We use the term automatic support to contrast with manualsupport; it refers to any level of support stronger than manual support.
For each implementation, we looked at the source code to discover which frameworkswere used. We read through the documentation for each of the frameworks to find out whichprotection mechanisms were offered for each vulnerability class we consider. We defined theimplementation’s level of support for a particular vulnerability class to be the highest levelof support offered by any framework used by the implementation.
Individual vulnerability data
We gather data about each individual vulnerability to deepen our understanding of thecurrent framework ecosystem, the reasons that developers introduce vulnerabilities, and thelimitations of manual review. For each vulnerability, we determine how far the developerswould have had to stray from their chosen frameworks in order to find manual frameworksupport that could have prevented the vulnerability. Specifically, we label each vulnerabilitywith one of the following classifications:
1. Framework used. Framework support that could have prevented this vulnerabilityexists in at least one of the frameworks used by the implementation.
2. Newer version of framework used. Framework support exists in a newer versionof one of the frameworks used by the implementation.
3. Another framework for language used. Framework support exists in a differentframework for the same language used by the implementation.
4. Some framework for some language. Framework support exists in some frameworkfor some language other than the one used by the implementation.
5. No known support. We cannot find framework support in any framework for anylanguage that would have stopped the vulnerability.
We label each vulnerability with the lowest level at which we are able to find frameworksupport that could have prevented the vulnerability. We do so using our awareness andknowledge of state-of-the-art frameworks as well as the documentation frameworks provide.
Similarly, for each vulnerability, we determine the level at which the developers couldhave found automatic (i.e., opt-in or better) framework support. We evaluate this in thesame manner as we did for manual support, but with a focus only on automatic protectionmechanisms.
CHAPTER 3. WEB APPLICATION DEVELOPMENT TOOLS 20
Java Perl PHPNumber of programmers 9 9 9Mean age (years) 32 32 32Mean experience (years) 7.1 8.7 9.8
Table 3.4: Statistics of the programmers.
Threats to validity
Experimental design. The Plat Forms data were gathered in a non-randomized experi-ment. This means that the programmers chose which language to use; the language was notrandomly assigned to them by the researchers. This leaves the experiment open to selectionbias; it could be the case that more skilled programmers tend to choose one language insteadof another. As a result, any results we find represent what one might expect when hiringnew programmers who choose which language to use, rather than having developers on staffand telling them which language to use.
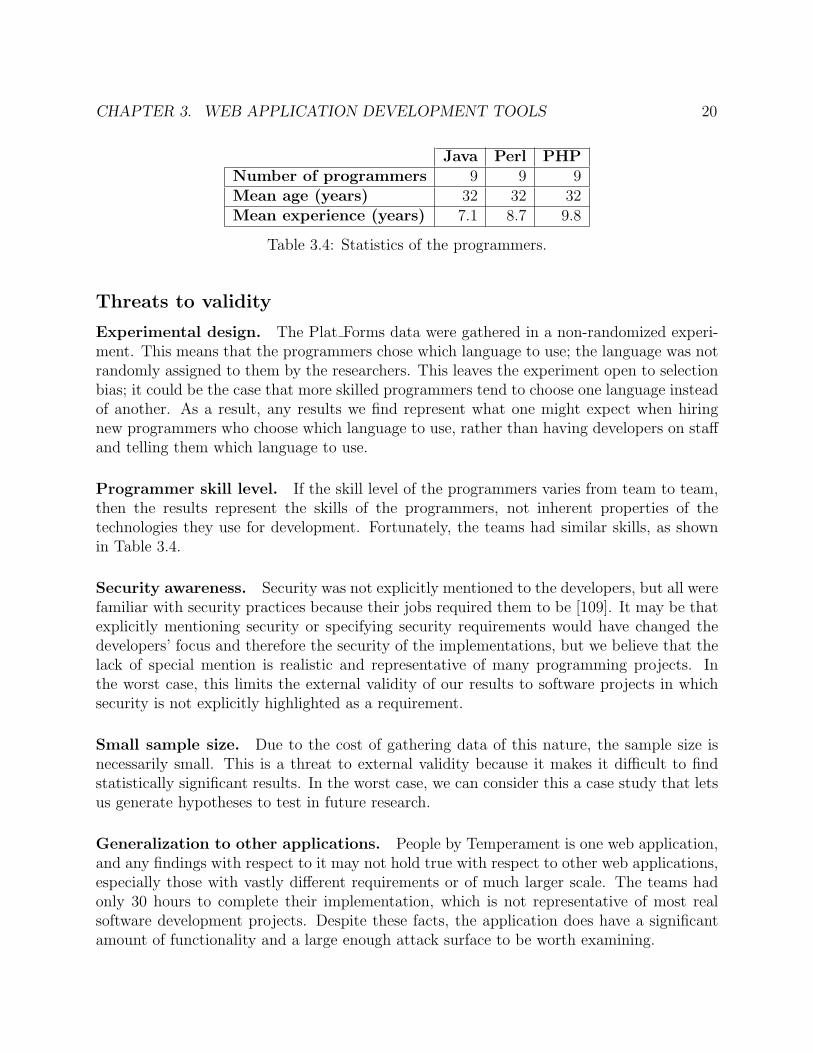
Programmer skill level. If the skill level of the programmers varies from team to team,then the results represent the skills of the programmers, not inherent properties of thetechnologies they use for development. Fortunately, the teams had similar skills, as shownin Table 3.4.
Security awareness. Security was not explicitly mentioned to the developers, but all werefamiliar with security practices because their jobs required them to be [109]. It may be thatexplicitly mentioning security or specifying security requirements would have changed thedevelopers’ focus and therefore the security of the implementations, but we believe that thelack of special mention is realistic and representative of many programming projects. Inthe worst case, this limits the external validity of our results to software projects in whichsecurity is not explicitly highlighted as a requirement.
Small sample size. Due to the cost of gathering data of this nature, the sample size isnecessarily small. This is a threat to external validity because it makes it difficult to findstatistically significant results. In the worst case, we can consider this a case study that letsus generate hypotheses to test in future research.
Generalization to other applications. People by Temperament is one web application,and any findings with respect to it may not hold true with respect to other web applications,especially those with vastly different requirements or of much larger scale. The teams hadonly 30 hours to complete their implementation, which is not representative of most realsoftware development projects. Despite these facts, the application does have a significantamount of functionality and a large enough attack surface to be worth examining.
CHAPTER 3. WEB APPLICATION DEVELOPMENT TOOLS 21
Number of vulnerabilities. We would like to find the total number of vulnerabilitiespresent in each implementation, but each analysis (manual and black-box) finds only somefraction of them. If the detection rate of our manual analysis is better for one language orone implementation than it is for another, this is a possible threat to validity. However, wehave no reason to expect a systematic bias of this nature, as the reviewer’s level of experiencein manual source code review is approximately equivalent for all three languages. At no timedid the reviewer feel that any one review was easier or more difficult than any other.
Similarly, if the detection rate of our black-box tool is better for one language or imple-mentation than it is for another, this could pose a threat to validity. We have no reason tobelieve this is the case. Because black-box testing examines only the input-output behavior ofa web application and not its implementation, it is inherently language- and implementation-agnostic, which leads us to expect that it has no bias for any one implementation over anyother.
Vulnerability severity. Our analysis does not take into account any differences in vul-nerability severity. Using our analysis, an implementation with many low-severity vulnera-bilities would appear less secure than an implementation with only a few very high-severityvulnerabilities, though in fact the latter system may be less secure overall (e.g., expose moreconfidential customer data). We have no reason to believe that average vulnerability severityvaries widely between implementations, but we did not study this in detail.
Vulnerabilities introduced later in the product cycle. Our study considers only thosevulnerabilities introduced during initial product development. Continued development bringsnew challenges for developers that simply were not present in this experiment. Our resultsdo not answer any questions about vulnerabilities introduced during code maintenance orwhen features are added after initial product development.
Framework documentation. If a framework’s documentation is incomplete or incorrect,or if we misread or misunderstood the documentation, we may have mislabeled the levelof support offered by the framework. However, the documentation represents the level ofsupport a developer could reasonably be expected to know about. If we were unable to finddocumentation for protection against a class of vulnerabilities, we expect that developerswould struggle as well. On the other hand, it is possible that a framework could claim it hassupport, but that this support is buggy or not actually present. We have not seen this occurin any framework, so we do not expect it to be widespread enough to affect our conclusions.
Awareness of frameworks and levels of support. There may exist frameworks that weare not aware of that provide strong framework support for a vulnerability class. If this is thecase, our labeling of vulnerabilities with the nearest level at which framework support exists(Section 3.3) may be incorrect. We have made every effort to consider all frameworks with
CHAPTER 3. WEB APPLICATION DEVELOPMENT TOOLS 22
a significant user base in order to mitigate this problem, and we have consulted several listsof frameworks (e.g., [70]) in order to make our search as thorough as reasonably possible.
3.4 Results
We look for patterns in the data and analyze it using statistical techniques. We note thatwe do not find many statistically significant results due to the limited size of our data set.
Total number of vulnerabilities
Figure 3.1 displays the total number of vulnerabilities found in each implementation, includ-ing both integer-valued and binary vulnerability classes (we count a binary vulnerability asone vulnerability in these aggregate counts).
Every implementation had at least one vulnerability. This suggests that building secureweb applications is difficult, even with a well-defined specification, and even for a relativelysmall application.
One of the Perl implementations has by far the most vulnerabilities, primarily due to itscomplete lack of XSS protection.3 This does not seem to be related to the fact that Perl isthe language used, however, since the other two Perl implementations have only a handfulof vulnerabilities, and few XSS vulnerabilities.
The Java implementations have fewer vulnerabilities than the PHP implementations. Infact, every Java implementation contains fewer vulnerabilities than each PHP implementa-tion.
A one-way ANOVA test reveals that the overall relationship in our data set betweenlanguage and total number of vulnerabilities is not statistically significant (F = 0.57, p =0.592). We also perform a Student’s t-test for each pair of languages, using the Bonferronicorrection to account for the fact that we test multiple (3) hypotheses. As expected, we donot find a significant difference between PHP and Perl or between Perl and Java. We find astatistically significant difference between PHP and Java (p = 0.033).
Vulnerability classes
Figure 3.2 breaks down the total number of vulnerabilities into the separate integer-valuedvulnerability classes, and the shaded rows in Table 3.5 present the data for the binaryvulnerability classes.
XSS. A one-way ANOVA test reveals that the relationship between language and numberof stored XSS vulnerabilities is not statistically significant (F = 0.92, p = 0.4492). The sameis true for reflected XSS (F = 0.43, p = 0.6689).
3None of our conclusions would differ if we were to exclude this apparent outlier.
CHAPTER 3. WEB APPLICATION DEVELOPMENT TOOLS 23
010
2030
40
Java 3 Java 4 Java 9 PHP 6 PHP 7 PHP 8 Perl 1 Perl 2 Perl 5
Total Number of Vulnerabilities
Manual BothBlack-box
Figure 3.1: The total number of vulnerabilities found in the 9 implementations of People byTemperament. The x-axis is labeled with the language and team number.
CSRF Session Management Password StorageTeamNum-ber
Language Vulnerable? FrameworkSupport
Vulnerable? FrameworkSupport
Vulnerable? FrameworkSupport
1 Perl • none opt-in • opt-in2 Perl • none • none • none5 Perl • none • none opt-out3 Java manual opt-out • none4 Java always on opt-in • opt-in9 Java • none opt-in none6 PHP • none opt-out • opt-in7 PHP • none opt-out • none8 PHP • none opt-out • opt-in
Table 3.5: Presence or absence of binary vulnerability classes, and framework support forpreventing them.
CHAPTER 3. WEB APPLICATION DEVELOPMENT TOOLS 240
24
68
10
Java 3 Java 4 Java 9 PHP 6 PHP 7 PHP 8 Perl 1 Perl 2 Perl 5
Stored XSS
Manual BothBlack-box
05
1015
20
Java 3 Java 4 Java 9 PHP 6 PHP 7 PHP 8 Perl 1 Perl 2 Perl 5
Reflected XSS
Manual BothBlack-box
01
23
Java 3 Java 4 Java 9 PHP 6 PHP 7 PHP 8 Perl 1 Perl 2 Perl 5
SQL Injection
Manual BothBlack-box
01
2
Java 3 Java 4 Java 9 PHP 6 PHP 7 PHP 8 Perl 1 Perl 2 Perl 5
Authentication/Authorization Bypass
Manual BothBlack-box
Figure 3.2: Vulnerabilities by vulnerability class.
SQL injection. Very few SQL injection vulnerabilities were found. Only two implemen-tations had any such vulnerabilities, and only 4 were found in total. The difference betweenlanguages is not statistically significant (F = 0.70, p = 0.5330).
Authentication and authorization bypass. No such vulnerabilities were found in 5of the 9 implementations. Each of the other 4 had only 1 or 2 such vulnerabilities. Thedifference between languages is not statistically significant (F = 0.17, p = 0.8503).
CSRF. As seen in Table 3.5, all of the PHP and Perl implementations, and 1 of 3 Javaimplementations were vulnerable to CSRF attacks. Fisher’s exact test reveals that thedifference between languages is not statistically significant (p = 0.25).
Session management. All implementations other than 2 of the 3 Perl implementationswere found to implement secure session management. That is, the Perl implementations
CHAPTER 3. WEB APPLICATION DEVELOPMENT TOOLS 25
Vulnerabilities found byTeamNumber
Language Manualonly
Black-boxonly
Both Total
1 Perl 4 1 0 52 Perl 3 1 0 45 Perl 12 3 18 333 Java 1 7 0 84 Java 2 2 0 49 Java 5 0 0 56 PHP 7 3 0 107 PHP 7 3 0 108 PHP 11 0 1 12
Table 3.6: Number of vulnerabilities found in the implementations of People by Tempera-ment. The “Vulnerabilities found by” columns display the number of vulnerabilities foundonly by manual analysis, only by black-box testing, and by both techniques, respectively.The final column displays the total number of vulnerabilities found in each implementation.
were the only ones with vulnerable session management. Fisher’s exact test reveals that thedifference is not statistically significant (p = 0.25).
Insecure password storage. Most of the implementations used some form of insecurepassword storage, ranging from storing passwords in plaintext to not using a salt beforehashing the passwords. One Perl and one Java implementation did not violate currentbest practices for password storage. There does not, however, appear to be any associationbetween programming language and insecure password storage. Fisher’s exact test does notfind a statistically significant difference (p = 0.999).
Manual review vs. black-box testing
Table 3.6, Figure 3.1, and Figure 3.3 list how many vulnerabilities were found only by manualanalysis, only by black-box testing, and by both techniques. All vulnerabilities in the binaryvulnerability classes were found by manual review, and none were found by black-box testing.
We observe that manual analysis fared better overall, finding 71 vulnerabilities (includingthe binary vulnerability classes), while black-box testing found only 39. We also observethat there is very little overlap between the two techniques; the two techniques find differentvulnerabilities. Out of a total of 91 vulnerabilities found by either technique, only 19 werefound by both techniques (see Figure 3.3). This suggests that they are complementary, andthat it may make sense for organizations to use both.
Organizations commonly use only black-box testing. These results suggest that on asmaller budget, this practice makes sense because either technique will find some vulnera-
CHAPTER 3. WEB APPLICATION DEVELOPMENT TOOLS 26
20 19 52
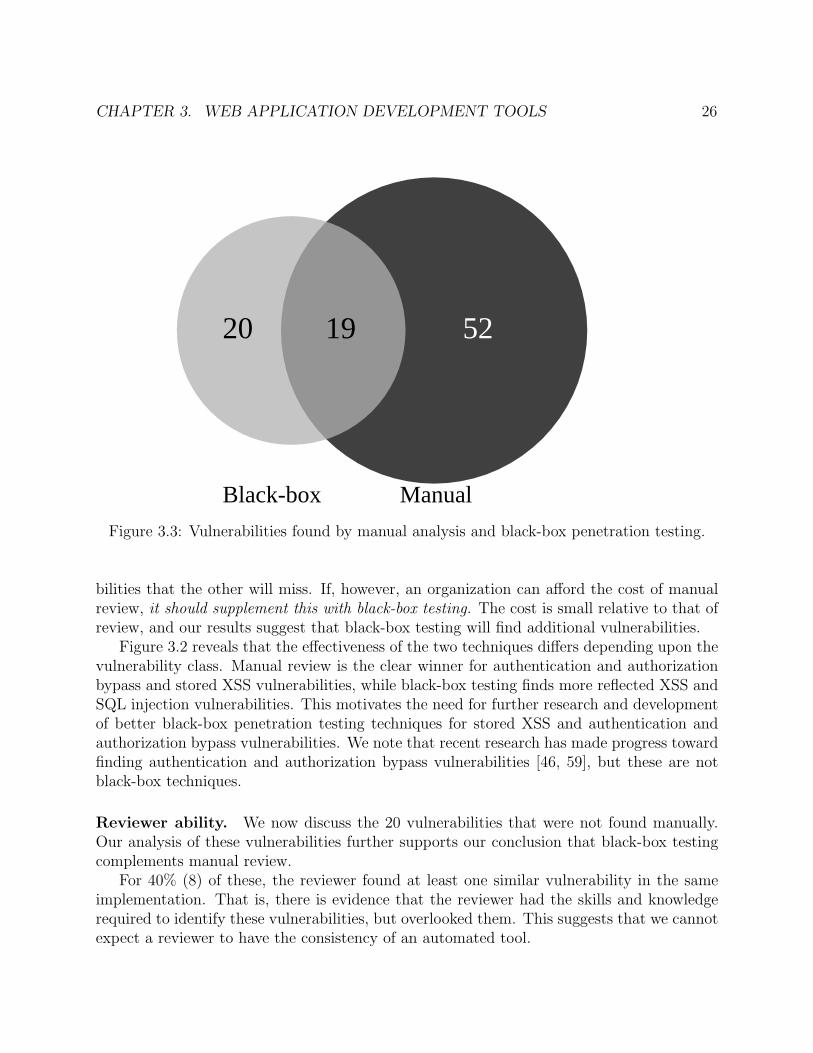
Black-box ManualFigure 3.3: Vulnerabilities found by manual analysis and black-box penetration testing.
bilities that the other will miss. If, however, an organization can afford the cost of manualreview, it should supplement this with black-box testing. The cost is small relative to that ofreview, and our results suggest that black-box testing will find additional vulnerabilities.
Figure 3.2 reveals that the effectiveness of the two techniques differs depending upon thevulnerability class. Manual review is the clear winner for authentication and authorizationbypass and stored XSS vulnerabilities, while black-box testing finds more reflected XSS andSQL injection vulnerabilities. This motivates the need for further research and developmentof better black-box penetration testing techniques for stored XSS and authentication andauthorization bypass vulnerabilities. We note that recent research has made progress towardfinding authentication and authorization bypass vulnerabilities [46, 59], but these are notblack-box techniques.
Reviewer ability. We now discuss the 20 vulnerabilities that were not found manually.Our analysis of these vulnerabilities further supports our conclusion that black-box testingcomplements manual review.
For 40% (8) of these, the reviewer found at least one similar vulnerability in the sameimplementation. That is, there is evidence that the reviewer had the skills and knowledgerequired to identify these vulnerabilities, but overlooked them. This suggests that we cannotexpect a reviewer to have the consistency of an automated tool.
CHAPTER 3. WEB APPLICATION DEVELOPMENT TOOLS 27
For another 40%, the vulnerability detected by the tool was in framework code, whichwas not analyzed by the reviewer. An automated tool may find vulnerabilities that reviewersare not even looking for.
The remaining 20% (4) represent vulnerabilities for which no similar vulnerabilities werefound by the reviewer in the same implementation. It is possible that the reviewer lackedthe necessary skills or knowledge to find these vulnerabilities, since there is no evidence thatthe reviewer was able to find anything similar.
Framework support
We examine whether stronger framework support is associated with fewer vulnerabilities.Figure 3.4 displays the relationship for each integer-valued vulnerability class between thelevel of framework support for that class and the number of vulnerabilities in that class. Iffor some vulnerability class there were an association between the level of framework supportand the number of vulnerabilities, we would expect most of the points to be clustered around(or below) a line with a negative slope.
For each of the three4 classes, we performed a one-way ANOVA test between frameworksupport for the vulnerability class and number of vulnerabilities in the class. None of theseresults are statistically significant.
As shown in Figure 3.4, our data set allows us to compare only frameworks with nosupport to frameworks with manual support because the implementations in our data setdo not use frameworks with stronger support (with one exception). We found no significantdifference between these levels of support. However, this data set does not allow us toexamine the effect of opt-in, opt-out, or always-on support on vulnerability rates. In futurework, we would like to analyze implementations that use frameworks with stronger supportfor these vulnerability classes. Example frameworks include CodeIgniter’s xss clean [3],Google Ctemplate [7], and Django’s autoescape [5], all of which provide opt-out supportfor preventing XSS vulnerabilities. A more diverse data set might reveal relationships thatcannot be gleaned from our current data.
Table 3.5 displays the relationship between framework support and vulnerability statusfor each of the binary vulnerability classes.
There does not appear to be any relationship for password storage. Many of the im-plementations use frameworks that provide opt-in support for secure password storage, butthey do not use this support and are therefore vulnerable anyway. This highlights the factthat manual framework support is only as good as developers’ awareness of its existence.
Session management and CSRF do, on the other hand, appear to be in such a relationship.Only the two implementations that lack framework support for session management havevulnerable session management. Similarly, only the two implementations that have frame-work support for CSRF were not found to be vulnerable to CSRF attacks. Both results were
4The level of framework support for stored XSS and reflected XSS is identical in each implementation,so we combined these two classes.
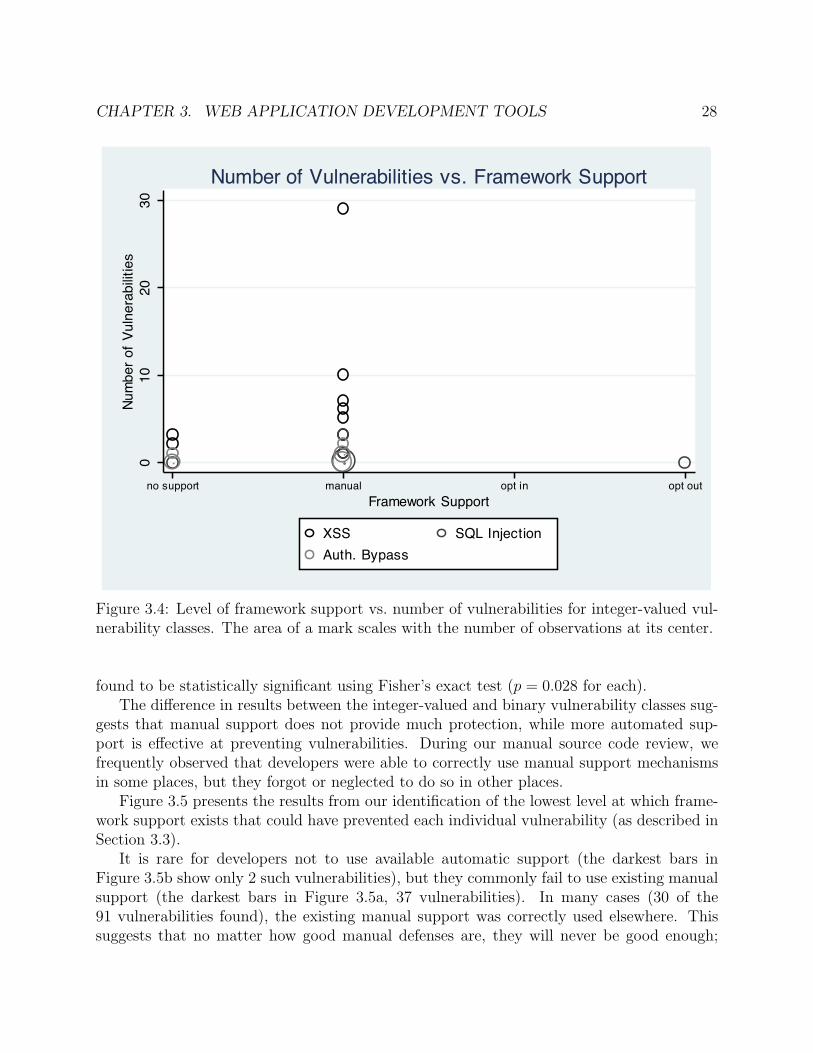
CHAPTER 3. WEB APPLICATION DEVELOPMENT TOOLS 28
010
2030
Num
ber o
f Vul
nera
bilit
ies
no support manual opt in opt outFramework Support
XSS SQL InjectionAuth. Bypass
Number of Vulnerabilities vs. Framework Support
Figure 3.4: Level of framework support vs. number of vulnerabilities for integer-valued vul-nerability classes. The area of a mark scales with the number of observations at its center.
found to be statistically significant using Fisher’s exact test (p = 0.028 for each).The difference in results between the integer-valued and binary vulnerability classes sug-
gests that manual support does not provide much protection, while more automated sup-port is effective at preventing vulnerabilities. During our manual source code review, wefrequently observed that developers were able to correctly use manual support mechanismsin some places, but they forgot or neglected to do so in other places.
Figure 3.5 presents the results from our identification of the lowest level at which frame-work support exists that could have prevented each individual vulnerability (as described inSection 3.3).
It is rare for developers not to use available automatic support (the darkest bars inFigure 3.5b show only 2 such vulnerabilities), but they commonly fail to use existing manualsupport (the darkest bars in Figure 3.5a, 37 vulnerabilities). In many cases (30 of the91 vulnerabilities found), the existing manual support was correctly used elsewhere. Thissuggests that no matter how good manual defenses are, they will never be good enough;
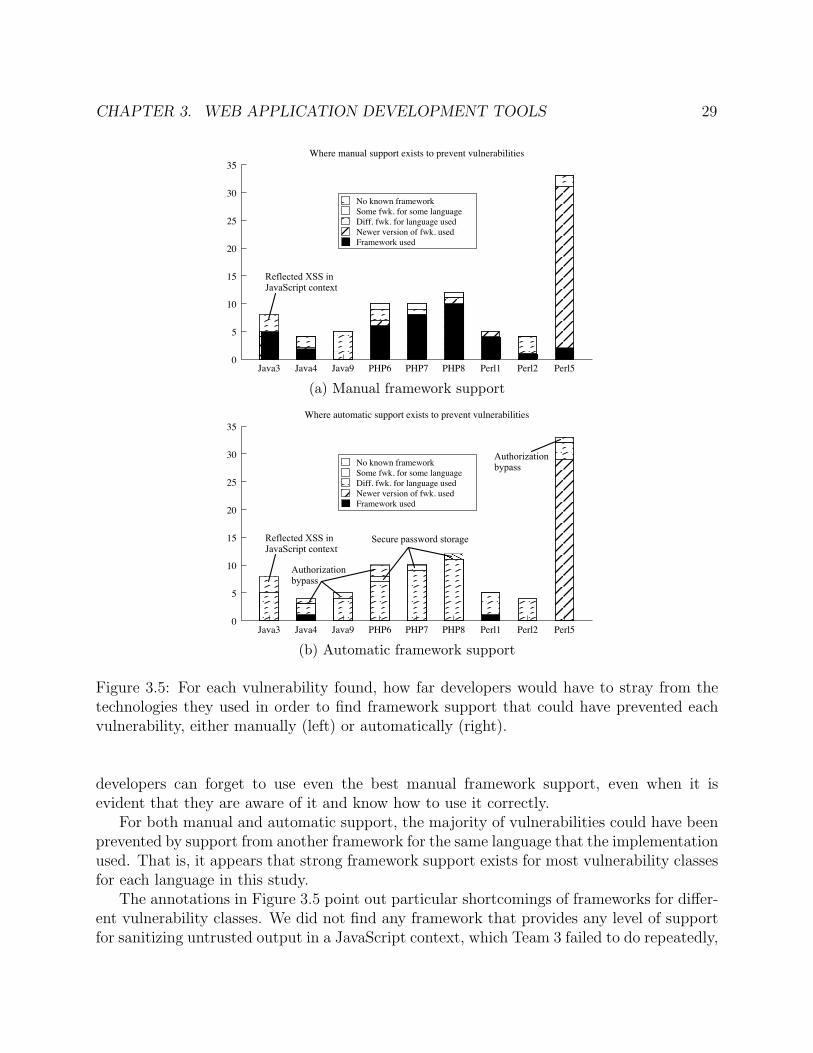
CHAPTER 3. WEB APPLICATION DEVELOPMENT TOOLS 29
0
5
10
15
20
25
30
35
Java3 Java4 Java9 PHP6 PHP7 PHP8 Perl1 Perl2 Perl5
Where manual support exists to prevent vulnerabilities
No known frameworkSome fwk. for some languageDiff. fwk. for language usedNewer version of fwk. usedFramework used
Reflected XSS inJavaScript context
(a) Manual framework support
0
5
10
15
20
25
30
35
Java3 Java4 Java9 PHP6 PHP7 PHP8 Perl1 Perl2 Perl5
Where automatic support exists to prevent vulnerabilities
No known frameworkSome fwk. for some languageDiff. fwk. for language usedNewer version of fwk. usedFramework used
Reflected XSS inJavaScript context
Authorizationbypass
Authorizationbypass
Secure password storage
(b) Automatic framework support
Figure 3.5: For each vulnerability found, how far developers would have to stray from thetechnologies they used in order to find framework support that could have prevented eachvulnerability, either manually (left) or automatically (right).
developers can forget to use even the best manual framework support, even when it isevident that they are aware of it and know how to use it correctly.
For both manual and automatic support, the majority of vulnerabilities could have beenprevented by support from another framework for the same language that the implementationused. That is, it appears that strong framework support exists for most vulnerability classesfor each language in this study.
The annotations in Figure 3.5 point out particular shortcomings of frameworks for differ-ent vulnerability classes. We did not find any framework that provides any level of supportfor sanitizing untrusted output in a JavaScript context, which Team 3 failed to do repeatedly,
CHAPTER 3. WEB APPLICATION DEVELOPMENT TOOLS 30
leading to 3 reflected XSS vulnerabilities. We were also unable to find a PHP frameworkthat offers automatic support for secure password storage, though we were able to find manytutorials on how to correctly (but manually) salt and hash passwords in PHP. Finally, weare not aware of any automatic framework support for preventing authorization bypass vul-nerabilities. Unlike the other vulnerability classes we consider, these require correct policies;in this sense, this vulnerability class is fundamentally different, and harder to tackle, asacknowledged by recent work [46, 59].
Limitations of statistical analysis
We caution the reader against drawing strong, generalizable conclusions from our statisticalanalysis, and we view even our strongest results as merely suggestive but not conclusive. Al-though we entered this study with specific goals and hypotheses (as described in Section 3.2),results that appear statistically significant may not in fact be valid – they could be due torandom chance.
When testing 20 hypotheses at a 0.05 significance level, we expect one of them to ap-pear significant purely by chance. We tested 19 hypotheses in this study, and 3 of themappeared to be significant. Therefore, we should not be surprised if one or two of theseseemingly-significant associations are in fact spurious and due solely to chance. We believemore powerful studies with larger data sets are needed to convincingly confirm the apparentassociations we have found.
3.5 Conclusion and future work
We have analyzed a data set of 9 implementations of the same web application to lookfor security differences associated with programming language, framework, and method offinding vulnerabilities. Each implementation had at least one vulnerability, which indicatesthat it is difficult to build a secure web application – even a small, well-defined one.
Our results provide little evidence that programming language plays a role in applicationsecurity, but they do suggest that the level of framework support for security may influenceapplication security, at least for some classes of vulnerabilities. Even the best manual supportis likely not good enough; frameworks should provide automatic defenses if possible.
In future work, we would like to evaluate more modern frameworks that offer strongersupport for preventing vulnerabilities. We are aware of several frameworks that provide auto-matic support for avoiding many types of XSS vulnerabilities (e.g., Django [48], CodeIgniter [3],and GWT SafeHtml [17]).
We have found evidence that manual code review is more effective than black-box testing,but combining the two techniques is more effective than using either one by itself. We foundthat the two techniques fared differently for different classes of vulnerabilities. Black-boxtesting performed better for reflected XSS and SQL injection, while manual review performedbetter for stored XSS, authentication and authorization bypass, session management, CSRF,
CHAPTER 3. WEB APPLICATION DEVELOPMENT TOOLS 31
and insecure password storage. We believe these findings warrant future research with alarger data set, more reviewers, and more black-box tools.
We believe it will be valuable for future research to test the following hypotheses, whichwere generated from this exploratory study.
• H1: The practical significance of the difference in security between applications that usedifferent programming languages is negligible. If true, programmers need not concernthemselves with security when choosing which language to use (subject to the supportoffered by frameworks available for that language).
• H2: Stronger, more automatic, framework support for vulnerabilities is associated withfewer vulnerabilities. If true, recent advances in framework support for security havebeen beneficial, and research into more framework-provided protections should be pur-sued.
• H3: Black-box penetration testing tools and manual source code review tend to finddifferent sets of vulnerabilities. If true, organizations can make more informed decisionsregarding their strategy for vulnerability remediation.
We see no reason to limit ourselves to exploring these hypotheses in the context of webapplications; they are equally interesting in the context of mobile applications, desktopapplications, and network services.
Finally, we note that future work in this area may benefit from additional data sources,such as source code repositories. These rich data sets may help us answer questions about(e.g.,) developers’ intentions or misunderstandings when introducing vulnerabilities and howvulnerabilities are introduced into applications over time. A deeper understanding of suchissues will aid us in designing new tools and processes that will help developers write moresecure software.
Acknowledgments
We thank Adrienne Felt, Erika Chin, and the anonymous reviewers for their thoughtfulcomments on earlier drafts of this work. We also thank the Plat Forms team for their hardwork in putting together the Plat Forms contest. This research was partially supported byNational Science Foundation grants CNS-1018924 and CCF-0424422.
Additionally, thanks to my co-author of this work, David Wagner [62] for working withme and giving his permission for this work to appear in this thesis.
32
Chapter 4
Manual security review
4.1 Introduction
In this chapter we focus on manual code review. Specifically, we aim to measure the effec-tiveness of manual code review of web applications for improving their security. We used alabor outsourcing site to hire 30 web developers with varying amounts of security experienceto conduct a security code review of a simple web application. These reviewers were askedto perform a line-by-line code review of the application and submit a report of all securityvulnerabilities found. Using the data we collected:
• We quantified the effectiveness of developers at security code review.
• We estimated the optimal number of independent reviewers to hire to achieve a desireddegree of confidence that all bugs will be found.
• We measured the extent to which developer demographic information and experiencecan be used to predict effectiveness at security code review.
These results may help hiring managers and developers in determining how to best allo-cate resources when securing their web applications.
4.2 Goals
Effectiveness
Our research measures how well developers conduct security code review. In particular, weare interested in how effective they are at finding exploitable vulnerabilities in a PHP web
This chapter was previously published at the 5th International Symposium on EngineeringSecure Software and Systems [52].
CHAPTER 4. MANUAL SECURITY REVIEW 33
application, and how much the effectiveness varies between reviewers. We are interested inanswering the following questions:
1. What fraction of the vulnerabilities can we expect to be found by a single securityreviewer?
2. Are some reviewers significantly more effective than others?
3. How much variation is there between reviewers?
Optimal Number of Reviewers
Depending on the distribution of reviewer effectiveness, we want to determine the best num-ber of reviewers to hire. Intuitively, if more reviewers are hired, then a larger percentageof vulnerabilities will be found, but we want to determine the point at which an additionalreviewer is unlikely to uncover any additional vulnerabilities. This would be useful for de-termining the best allocation of resources (money) in the development of a web application.Specifically, we will address the following questions to find the optimal number of reviewers.
4. Will multiple independent code reviewers be significantly more effective than a singlereviewer?
5. If so, how much more effective?
6. How many reviewers are needed to find most or all of the bugs in a web application?
Predicting Effectiveness
We asked each reviewer about the following factors (see Appendix B for the complete ques-tionnaire), which we hoped might be associated with reviewer effectiveness:
• Application comprehension
• Self-assessed confidence in the review
• Education level
• Experience with code reviews
• Name and number of security-related certifications
• Experience in software/web development and computer security
• Confidence as a software/web developer and as a security expert
• Most familiar programming languages
CHAPTER 4. MANUAL SECURITY REVIEW 34
Identifying the relationship between reviewers’ responses to these questions and theirsuccess at finding bugs during code review may provide insight into what criteria or factorswould be most predictive of a successful security review.
4.3 Experimental methodology
To assess developer effectiveness at security code review, we first reviewed a single webapplication for security vulnerabilities. We then hired 30 developers through an outsourcingsite and asked each of them to perform a manual line-by-line security review of the code.After developers completed their reviews, we asked them to tell us about their experienceand qualifications. Finally, we counted how many of the known vulnerabilities they found.
Anchor CMS
We used an existing open-source web application for the review, Anchor CMS. Anchor CMSis written in PHP and JavaScript and uses a MySQL database. We chose this application forour study due to (1) the presence of known vulnerabilities in the code, (2) its size, which wassubstantial enough to be nontrivial but small enough to allow security review at a reasonablecost, and (3) its permissive license, which let us anonymize the code, as described below.
There are currently four release versions of Anchor. We chose to have reviewers reviewthe third release, version 0.6, instead of the latest version. This version had more knownvulnerabilities while still having comparable functionality to the latest version.
To prepare and anonymize the code for review, we modified the Anchor CMS sourcecode in two ways. First, we removed the Anchor name and all branding. We renamed itTestCMS, a generic name that wouldn’t be searchable online. We did not want reviewers toview Anchor CMS’s bug tracker or any publicly reported vulnerabilities; we wanted to ensurethey reviewed the code from scratch with no preconceptions. Our anonymization includedremoval of “Anchor” from page titles, all relevant images and logos, and all instances ofAnchor in variable names or comments.
Once the code was anonymized, we modified the code in two ways to increase the numberof vulnerabilities in it. This was done in order to decrease the role of random noise in ourmeasurements of reviewer effectiveness and to increase the diversity of vulnerability types.First, we took one vulnerability from a prior release of Anchor (version 0.5) and forward-ported it into our code. After this modification, the web application had three Cross-Site Scripting vulnerabilities known to us and no Cross-Site Request Forgery protectionthroughout the application.
Second, we carefully introduced two SQL injection vulnerabilities. To ensure these wererepresentative of real SQL injection vulnerabilities naturally seen in the wild, we foundsimilarly structured CMS applications on security listing websites (SecList.org), analyzedthem, identified two SQL injection vulnerabilities in them, adapted the vulnerable code forAnchor, and introduced these vulnerabilities into TestCMS. The result is a web application
CHAPTER 4. MANUAL SECURITY REVIEW 35
with six known vulnerabilities (seven after one additional vulnerability was discovered byparticipants, which we describe further in Section 4.4). Our procedures were designed toensure that these vulnerabilities are reasonably representative of the issues present in otherweb applications.
These six known vulnerabilities are exploitable by any visitor to the web application; heneed not be a registered user. Additionally, the vulnerabilities are due solely to bugs in thePHP source code of the application. For example, we do not consider problems such as Denialof Service attacks or insecure password policies to be exploitable vulnerabilities in this study.Although these issues were not included in our list of six known vulnerabilities, we did notclassify such reports as incorrect. Section 4.4 contains more details on how we handled suchreports. Lastly, any vulnerabilities in the administrative interface were explicitly specifiedas out of scope for this study.
oDesk
oDesk is an outsourcing site that can be used to hire freelancers to perform many tasks,including web programming, development, and quality assurance. We chose oDesk becauseit is one of the most popular such sites, and because it gave us the most control over thehiring process; oDesk allows users to post jobs (with any specifications, payments, andrequirements), send messages to users, interview candidates, and hire multiple people forthe same job [110]. We used oDesk to post the code review task, hire reviewers that metour requirements, and pay our subjects for their work. The protocol for our experiment wasapproved by the UC Berkeley Institutional Review Board (IRB).
Subject Population and Selection
We recruited subjects for our experiment by posting our job on oDesk. We specified thatrespondents needed to be experienced in developing PHP applications in order to comprehendand work with our code base, and they should have basic web security knowledge. Wescreened all applicants by asking them about how many times they have previously conducteda code review, a security code review, a code review of a web application, and a security codereview of a web application. We also asked four multiple-choice quiz questions to test theirknowledge of PHP and security. Each question showed a short snippet of code and askedwhether the code was vulnerable, and if so, what kind of vulnerability it had; there were sixanswer choices to select from. We accepted all respondents who scored 25% or higher on thescreening test. This threshold was chosen because it allowed us to have a larger sample size,while still ensuring some minimum level of knowledge and understanding of security issues.
Task
We gave participants directions on how to proceed with the code review, an example vulner-ability report, and the TestCMS code base. The instructions specified that no automated
CHAPTER 4. MANUAL SECURITY REVIEW 36
code review tools should be used. Also, the reviewers were told to spend 12 hours on thistask; this number was calculated based upon a baseline of 250 lines of code per hour, assuggested by OWASP [94]. We designed a template that participants were instructed to useto report each vulnerability. The template has the following sections for the reviewer to fillin accordingly:
1. Vulnerability Type
2. Vulnerability Location
3. Vulnerability Description
4. Impact
5. Steps to Exploit
The type, location, description, and impact gave us the information needed for us tounderstand the vulnerability. The last section, “Steps to Exploit”, was intended to encouragereviewers to report only exploitable vulnerabilities as opposed to poor security practices inthe code.
The reviewers were asked to review only a subset of the code given to them. In particular,we had them review everything but the administrative interface and the client-side code.They reviewed approximately 3500 lines of code in total. We specified our interest only inexploitable vulnerabilities. In return, we paid them $20/hour for a total of $240 for thecompleted job. This fixed rate leaves the relationship between compensation and reviewereffectiveness an area for future work.
Data Analysis Approach
Before the study, we scoured public vulnerability databases and Anchor’s bug tracker toidentify all known vulnerabilities in TestCMS. This allowed us to identify a “ground truth”enumeration of vulnerabilities, independent of those the reviewers were able to find. Wemanually analyzed each participant’s report and evaluated the accuracy and correctnessof all bugs they reported, which we describe in more detail in Section 4.4. After runningstatistical tests on the data, we were able to quantify how well the reviewers conducted theirreviews.
Threats to Validity
oDesk Population.
As stated previously, we hired reviewers through the oDesk outsourcing website. This limitsour population to registered oDesk users, as opposed to the population of all web devel-opers or security reviewers. If the population of oDesk users differs significantly from the
CHAPTER 4. MANUAL SECURITY REVIEW 37
population of all web developers or security reviewers, then our results will not necessarilygeneralize to this larger population. However, given the size and volume of activity on oDesk(1.5 million jobs posted in 2012, 3.1 million registered contractors [23]), the population westudy is interesting in its own right, and, at the very least, relevant to anyone hiring securityreviewers using oDesk.
Artificial Vulnerabilities.
As mentioned in Section 4.3, we introduced two SQL Injection vulnerabilities. Addingthese artificial vulnerabilities creates an artificially flawed code base where the application’soriginal developer did not introduce all of the bugs. These artificial vulnerabilities could biasthe results since it may make the code review easier or harder than reviewing a “naturallybuggy” application. The changes made to the code base were modeled after vulnerabilitiesfound in other CMSs, which we hope will serve to minimize the artificiality of the code baseby ensuring that real web developers made the same mistakes before.
Static Analysis Tools.
Using an outsourcing website to conduct our experiment restricted our ways of verifyinghow reviewers performed the review. This was considered when designing the experiment;we required specific and detailed information about each vulnerability reported. Requiringthis information forced the reviewer to fully understand the vulnerability and how it affectsthe application, thereby minimizing the possibility that a reviewer would use static analysistools and maximizing our ability to detect the use of static analysis tools. While therewas no guarantee that reviewers completed their reviews manually, we assumed that allvulnerability reports completed sufficiently and accurately were a result of a manual codereview and consequently we included them in our results.
Security Experts vs. Web Developers.
We hired 30 reviewers for this study, some of whom specialized in security while otherswere purely web developers. Despite the use of a screening test, it is possible that webdevelopers guessed correctly or that the screening questions asked about vulnerabilities thatwere significantly easier to detect than those found in a real application. In this case, webdevelopers would be at a disadvantage. Security experts have a better understanding of theattacks, how they work, and how attackers can use them. It is possible that our screeningprocess was too lenient and caused us to include web developers who are not security expertsand would not get hired in the wild for security review. This could bias our results whenmeasuring variability and effectiveness, but we anticipate that people hired to perform asecurity review in the wild may also include web developers who are not specialists in security.
CHAPTER 4. MANUAL SECURITY REVIEW 38
Difficulties of Anchor Code and Time Frame.
We found that the design of Anchor’s source code made it particularly challenging to un-derstand. It is neither well-documented nor well-structured. With the 12 hours that thereviewers had, results might not be the same as if the code were better-designed. The re-viewers may not find all the vulnerabilities or they may give us many false positives. Wehave no way to verify that each person we hired spent the full 12 hours requested on thesecurity review task, or that this was an accurate reflection of the amount of time they wouldspend on a real-world security review. If either of these conditions fails to hold, it could limitthe applicability of our results.
Upshot.
All empirical studies have limitations, and ours is no exception. Our hope, however, isthat this study will encourage future studies with fewer or different limitations and thatultimately, multiple different but related empirical studies will, when taken together, give usa better understanding of the questions we study.
4.4 Results
Vulnerability Report Classification
In order to understand the reviewers’ code reviews and provide results, we first had toclassify each vulnerability report submitted. We place each vulnerability report into oneof four categories: valid vulnerability, invalid vulnerability, weakness, or out of scope. Avalid vulnerability corresponds to an exploitable vulnerability in the web application. Ifa reviewer identified one of the vulnerabilities we knew about or her steps to exploit thereported vulnerability worked, then this would be classified as valid. We made no judgmentson how well she described the vulnerability. Additionally, if the reviewer identified a knownvulnerability, but her steps to exploit it were incorrect, it was still classified as valid. Whentallying the correctly reported vulnerabilities, each valid vulnerability added to this tally.
An invalid vulnerability is a report that specifies some code as being vulnerable when infact it is not. We verified that an invalid vulnerability was invalid by attempting to exploitthe application using the steps the reviewer provided, as well as looking in the source code.When tallying the number of falsely reported vulnerabilities, each invalid vulnerability addedto the tally. Both valid and invalid vulnerabilities were included in the tally of total reportedvulnerabilities.
The weakness category describes reports that could potentially be security concerns,but are either not exploitable vulnerabilities or are not specific to this web application; forexample, any reports of a denial of service attack or insecure password choice are consideredweaknesses. We did not validate reported weaknesses. Weaknesses contributed to the totalnumber of reports each reviewer submitted, but were considered neither correct nor false.
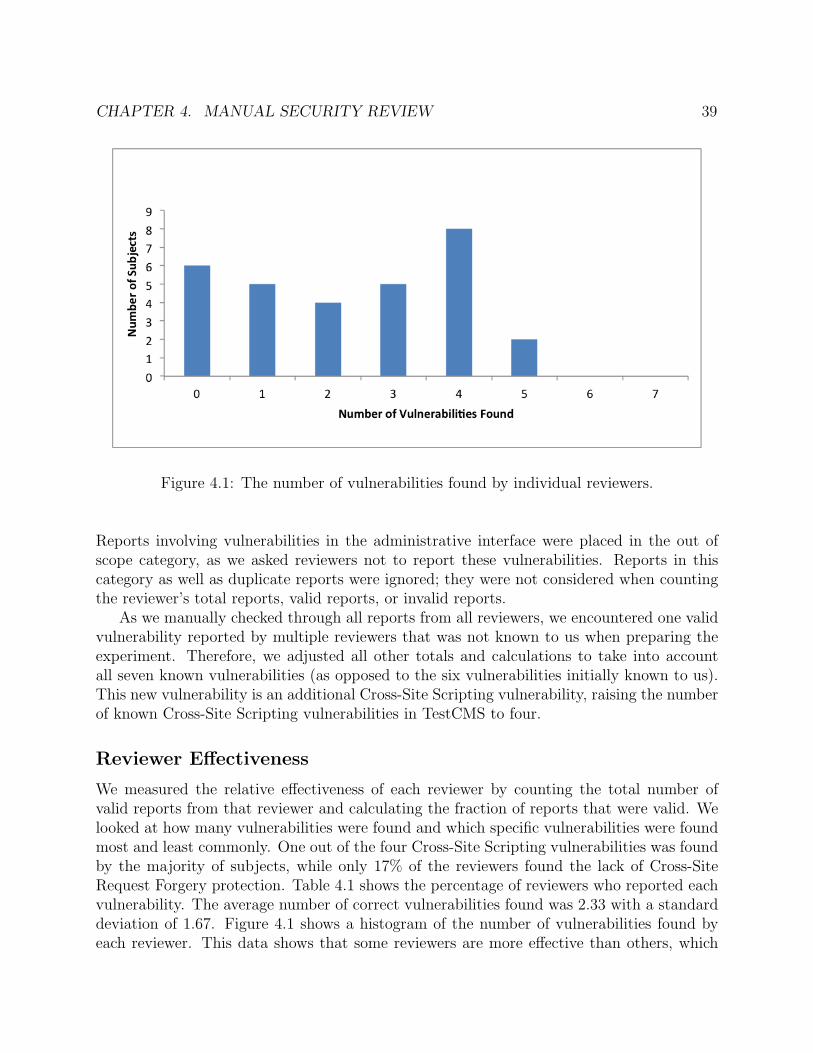
CHAPTER 4. MANUAL SECURITY REVIEW 39
Figure 4.1: The number of vulnerabilities found by individual reviewers.
Reports involving vulnerabilities in the administrative interface were placed in the out ofscope category, as we asked reviewers not to report these vulnerabilities. Reports in thiscategory as well as duplicate reports were ignored; they were not considered when countingthe reviewer’s total reports, valid reports, or invalid reports.
As we manually checked through all reports from all reviewers, we encountered one validvulnerability reported by multiple reviewers that was not known to us when preparing theexperiment. Therefore, we adjusted all other totals and calculations to take into accountall seven known vulnerabilities (as opposed to the six vulnerabilities initially known to us).This new vulnerability is an additional Cross-Site Scripting vulnerability, raising the numberof known Cross-Site Scripting vulnerabilities in TestCMS to four.
Reviewer Effectiveness
We measured the relative effectiveness of each reviewer by counting the total number ofvalid reports from that reviewer and calculating the fraction of reports that were valid. Welooked at how many vulnerabilities were found and which specific vulnerabilities were foundmost and least commonly. One out of the four Cross-Site Scripting vulnerabilities was foundby the majority of subjects, while only 17% of the reviewers found the lack of Cross-SiteRequest Forgery protection. Table 4.1 shows the percentage of reviewers who reported eachvulnerability. The average number of correct vulnerabilities found was 2.33 with a standarddeviation of 1.67. Figure 4.1 shows a histogram of the number of vulnerabilities found byeach reviewer. This data shows that some reviewers are more effective than others, which
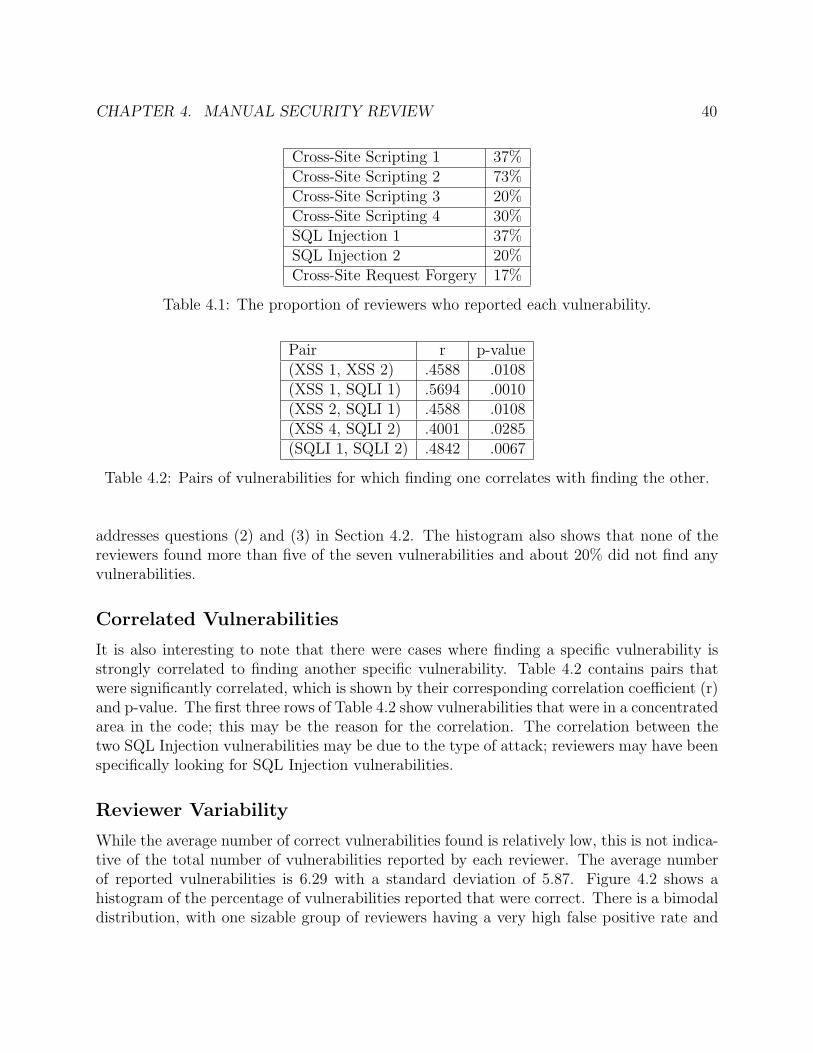
CHAPTER 4. MANUAL SECURITY REVIEW 40
Cross-Site Scripting 1 37%Cross-Site Scripting 2 73%Cross-Site Scripting 3 20%Cross-Site Scripting 4 30%SQL Injection 1 37%SQL Injection 2 20%Cross-Site Request Forgery 17%
Table 4.1: The proportion of reviewers who reported each vulnerability.
Pair r p-value(XSS 1, XSS 2) .4588 .0108(XSS 1, SQLI 1) .5694 .0010(XSS 2, SQLI 1) .4588 .0108(XSS 4, SQLI 2) .4001 .0285(SQLI 1, SQLI 2) .4842 .0067
Table 4.2: Pairs of vulnerabilities for which finding one correlates with finding the other.
addresses questions (2) and (3) in Section 4.2. The histogram also shows that none of thereviewers found more than five of the seven vulnerabilities and about 20% did not find anyvulnerabilities.
Correlated Vulnerabilities
It is also interesting to note that there were cases where finding a specific vulnerability isstrongly correlated to finding another specific vulnerability. Table 4.2 contains pairs thatwere significantly correlated, which is shown by their corresponding correlation coefficient (r)and p-value. The first three rows of Table 4.2 show vulnerabilities that were in a concentratedarea in the code; this may be the reason for the correlation. The correlation between thetwo SQL Injection vulnerabilities may be due to the type of attack; reviewers may have beenspecifically looking for SQL Injection vulnerabilities.
Reviewer Variability
While the average number of correct vulnerabilities found is relatively low, this is not indica-tive of the total number of vulnerabilities reported by each reviewer. The average numberof reported vulnerabilities is 6.29 with a standard deviation of 5.87. Figure 4.2 shows ahistogram of the percentage of vulnerabilities reported that were correct. There is a bimodaldistribution, with one sizable group of reviewers having a very high false positive rate and
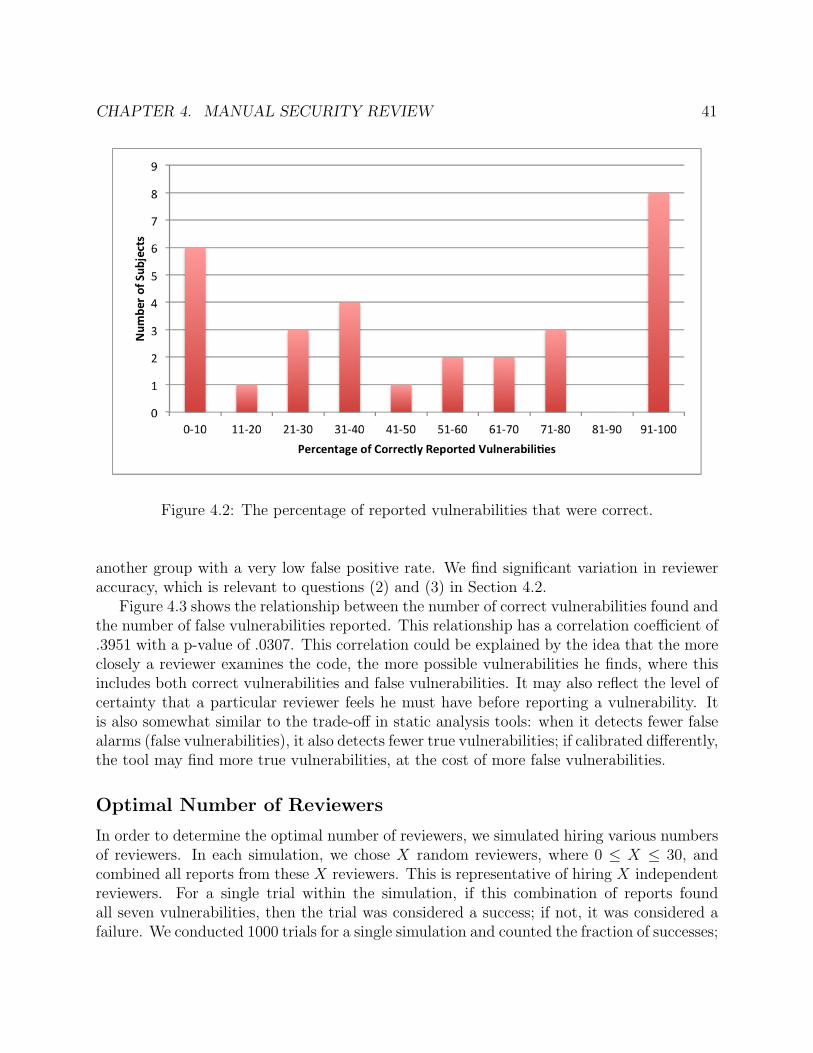
CHAPTER 4. MANUAL SECURITY REVIEW 41
Figure 4.2: The percentage of reported vulnerabilities that were correct.
another group with a very low false positive rate. We find significant variation in revieweraccuracy, which is relevant to questions (2) and (3) in Section 4.2.
Figure 4.3 shows the relationship between the number of correct vulnerabilities found andthe number of false vulnerabilities reported. This relationship has a correlation coefficient of.3951 with a p-value of .0307. This correlation could be explained by the idea that the moreclosely a reviewer examines the code, the more possible vulnerabilities he finds, where thisincludes both correct vulnerabilities and false vulnerabilities. It may also reflect the level ofcertainty that a particular reviewer feels he must have before reporting a vulnerability. Itis also somewhat similar to the trade-off in static analysis tools: when it detects fewer falsealarms (false vulnerabilities), it also detects fewer true vulnerabilities; if calibrated differently,the tool may find more true vulnerabilities, at the cost of more false vulnerabilities.
Optimal Number of Reviewers
In order to determine the optimal number of reviewers, we simulated hiring various numbersof reviewers. In each simulation, we chose X random reviewers, where 0 ≤ X ≤ 30, andcombined all reports from these X reviewers. This is representative of hiring X independentreviewers. For a single trial within the simulation, if this combination of reports foundall seven vulnerabilities, then the trial was considered a success; if not, it was considered afailure. We conducted 1000 trials for a single simulation and counted the fraction of successes;
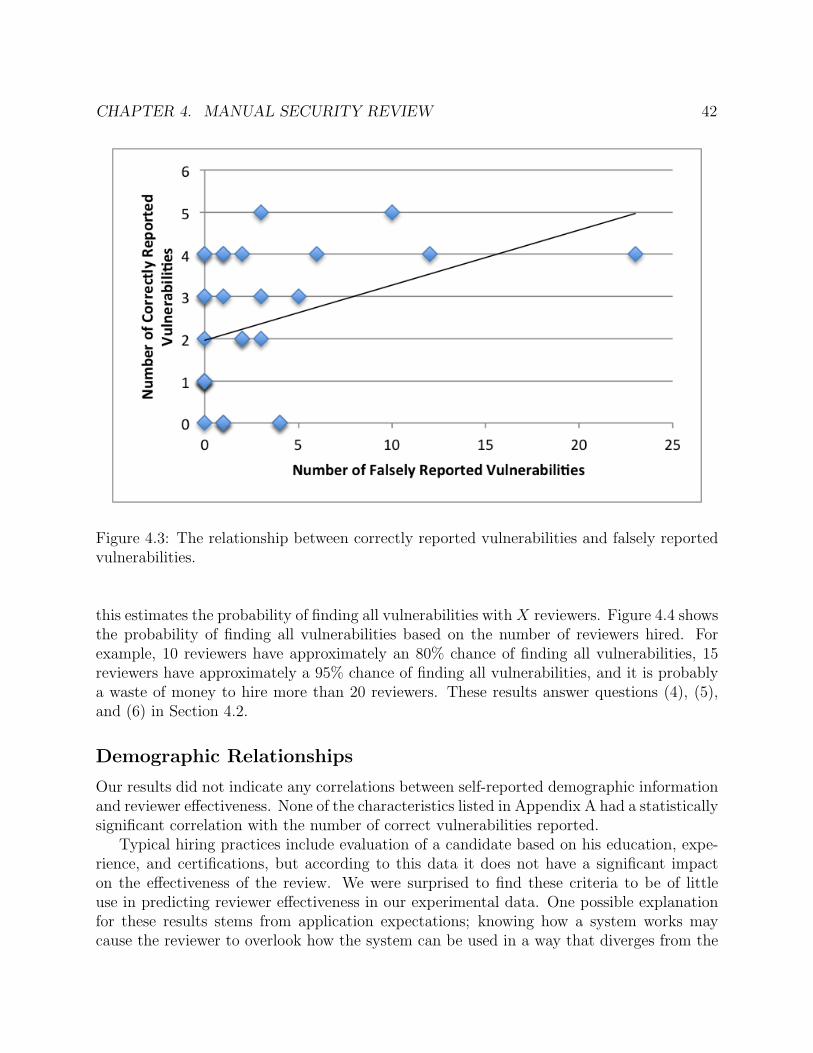
CHAPTER 4. MANUAL SECURITY REVIEW 42
Figure 4.3: The relationship between correctly reported vulnerabilities and falsely reportedvulnerabilities.
this estimates the probability of finding all vulnerabilities withX reviewers. Figure 4.4 showsthe probability of finding all vulnerabilities based on the number of reviewers hired. Forexample, 10 reviewers have approximately an 80% chance of finding all vulnerabilities, 15reviewers have approximately a 95% chance of finding all vulnerabilities, and it is probablya waste of money to hire more than 20 reviewers. These results answer questions (4), (5),and (6) in Section 4.2.
Demographic Relationships
Our results did not indicate any correlations between self-reported demographic informationand reviewer effectiveness. None of the characteristics listed in Appendix A had a statisticallysignificant correlation with the number of correct vulnerabilities reported.
Typical hiring practices include evaluation of a candidate based on his education, expe-rience, and certifications, but according to this data it does not have a significant impacton the effectiveness of the review. We were surprised to find these criteria to be of littleuse in predicting reviewer effectiveness in our experimental data. One possible explanationfor these results stems from application expectations; knowing how a system works maycause the reviewer to overlook how the system can be used in a way that diverges from the
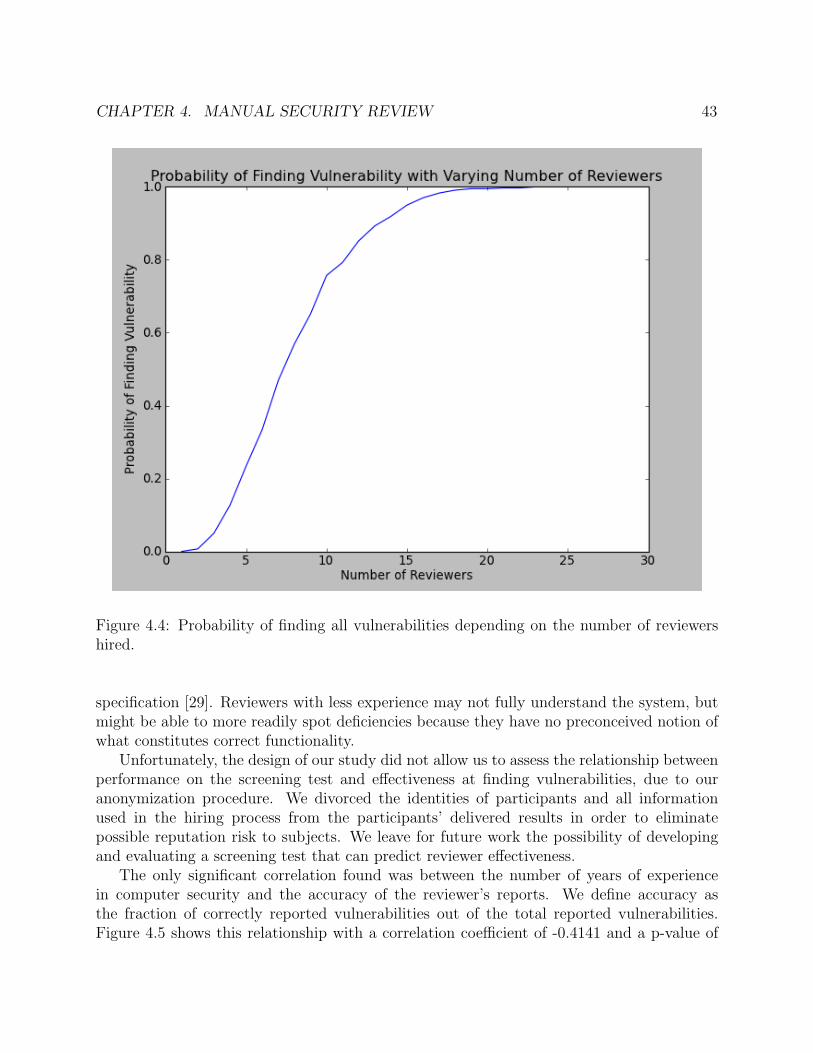
CHAPTER 4. MANUAL SECURITY REVIEW 43
Figure 4.4: Probability of finding all vulnerabilities depending on the number of reviewershired.
specification [29]. Reviewers with less experience may not fully understand the system, butmight be able to more readily spot deficiencies because they have no preconceived notion ofwhat constitutes correct functionality.
Unfortunately, the design of our study did not allow us to assess the relationship betweenperformance on the screening test and effectiveness at finding vulnerabilities, due to ouranonymization procedure. We divorced the identities of participants and all informationused in the hiring process from the participants’ delivered results in order to eliminatepossible reputation risk to subjects. We leave for future work the possibility of developingand evaluating a screening test that can predict reviewer effectiveness.
The only significant correlation found was between the number of years of experiencein computer security and the accuracy of the reviewer’s reports. We define accuracy asthe fraction of correctly reported vulnerabilities out of the total reported vulnerabilities.Figure 4.5 shows this relationship with a correlation coefficient of -0.4141 and a p-value of
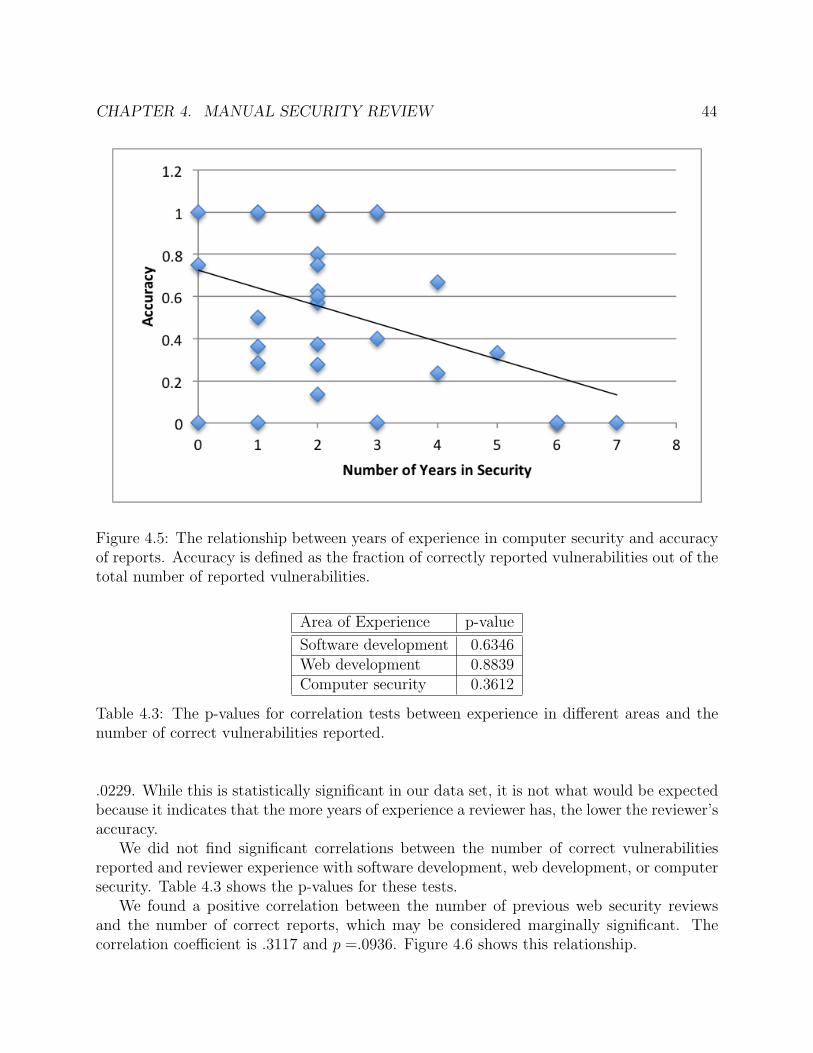
CHAPTER 4. MANUAL SECURITY REVIEW 44
Figure 4.5: The relationship between years of experience in computer security and accuracyof reports. Accuracy is defined as the fraction of correctly reported vulnerabilities out of thetotal number of reported vulnerabilities.
Area of Experience p-value
Software development 0.6346Web development 0.8839Computer security 0.3612
Table 4.3: The p-values for correlation tests between experience in different areas and thenumber of correct vulnerabilities reported.
.0229. While this is statistically significant in our data set, it is not what would be expectedbecause it indicates that the more years of experience a reviewer has, the lower the reviewer’saccuracy.
We did not find significant correlations between the number of correct vulnerabilitiesreported and reviewer experience with software development, web development, or computersecurity. Table 4.3 shows the p-values for these tests.
We found a positive correlation between the number of previous web security reviewsand the number of correct reports, which may be considered marginally significant. Thecorrelation coefficient is .3117 and p =.0936. Figure 4.6 shows this relationship.
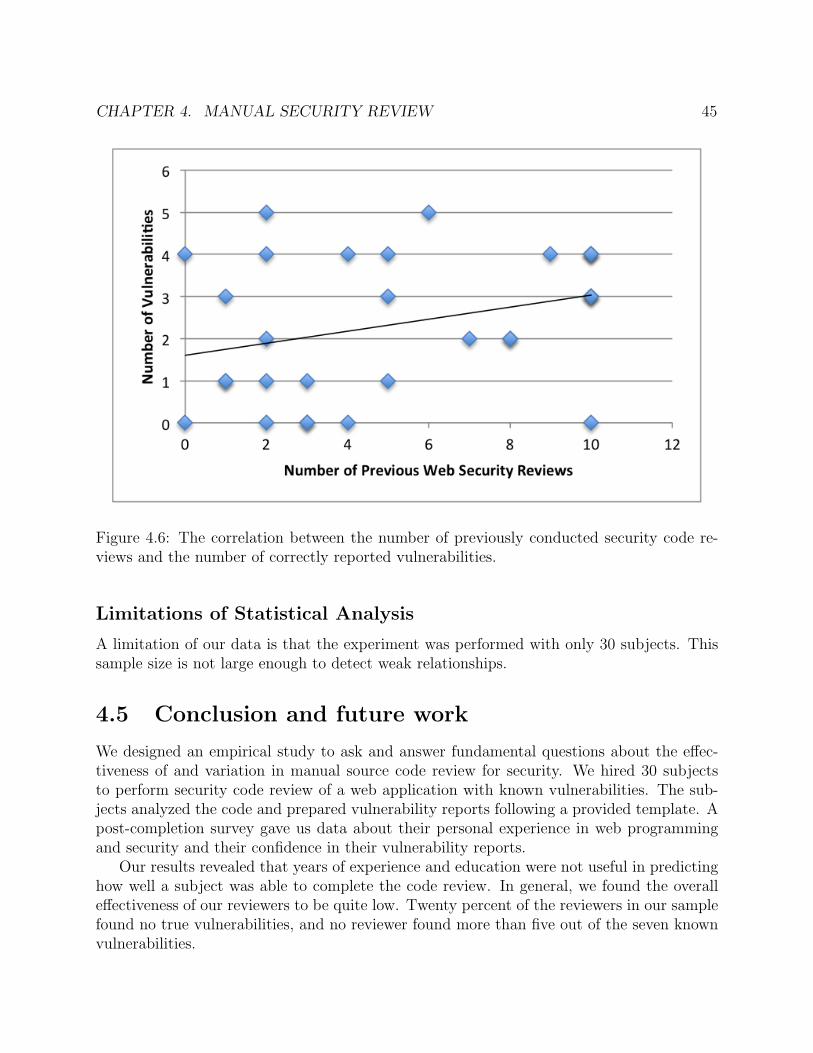
CHAPTER 4. MANUAL SECURITY REVIEW 45
Figure 4.6: The correlation between the number of previously conducted security code re-views and the number of correctly reported vulnerabilities.
Limitations of Statistical Analysis
A limitation of our data is that the experiment was performed with only 30 subjects. Thissample size is not large enough to detect weak relationships.
4.5 Conclusion and future work
We designed an empirical study to ask and answer fundamental questions about the effec-tiveness of and variation in manual source code review for security. We hired 30 subjectsto perform security code review of a web application with known vulnerabilities. The sub-jects analyzed the code and prepared vulnerability reports following a provided template. Apost-completion survey gave us data about their personal experience in web programmingand security and their confidence in their vulnerability reports.
Our results revealed that years of experience and education were not useful in predictinghow well a subject was able to complete the code review. In general, we found the overalleffectiveness of our reviewers to be quite low. Twenty percent of the reviewers in our samplefound no true vulnerabilities, and no reviewer found more than five out of the seven knownvulnerabilities.
CHAPTER 4. MANUAL SECURITY REVIEW 46
No self-reported metric proved to be useful in predicting reviewer effectiveness, leaving asan open question the best way to select freelance security reviewers that one has no previousexperience with. The difficulty in predicting reviewer effectiveness in advance supportsanecdotal reports that the most effective way to evaluate a freelancer is by their performanceon previously assigned tasks.
It would be interesting to study whether these results apply to other populations and toevaluate whether performance on our screening test correlates with reviewer effectiveness.It would also be interesting to compare the effectiveness of manual security review to thatof other techniques, such as automated penetration testing tools. We leave these as openproblems for future work.
Acknowledgments
We give special thanks to Aimee Tabor and the TRUST program staff. This work was sup-ported in part by TRUST (Team for Research in Ubiquitous Secure Technology) throughNSF grant CCF-0424422, by the AFOSR under MURI award FA9550-12-1-0040, and by aNational Science Foundation Graduate Research Fellowship. Any opinions, findings, conclu-sions, or recommendations expressed here are those of the authors and do not necessarilyreflect the views of the entities that provided funding.
Additionally, thanks to my co-authors of this work, Anne Edmundson, Brian Holtkamp,Emanuel Rivera, Adrian Mettler, and David Wagner [52] for working with me and givingtheir permission for this work to appear in this thesis.
47
Chapter 5
Vulnerability rewards programs
5.1 Introduction
Some software vendors pay security researchers for the responsible disclosure of a securityvulnerability. Programs implementing the rules for this exchange are known as vulnerabilityrewards programs (VRPs) or bug bounty programs. The last couple of years have seen anupsurge of interest in VRPs, with some vendors expanding their existing programs [26, 53],others introducing new programs [24, 30, 87], and some companies offering to act as anintermediary between security researchers and vendors offering VRPs [10].
VRPs offer a number of potential attractions to software vendors. Offering adequateincentives entices security researchers to look for vulnerabilities, and this increased attentionimproves the likelihood of finding latent vulnerabilities.1 Second, coordinating with securityresearchers allows vendors to more effectively manage vulnerability disclosures, reducingthe likelihood of unexpected and costly zero-day disclosures. Monetary rewards provide anincentive for security researchers not to sell their research results to malicious actors in theunderground economy or the gray world of vulnerability markets. Third, VRPs may make itmore difficult for black hats to find vulnerabilities to exploit. Patching vulnerabilities foundthrough a VRP increases the difficulty and therefore cost for malicious actors to find zero-days because the pool of latent vulnerabilities has been diminished. Additionally, experiencegained from VRPs (and exploit bounties [57, 64]) can yield improvements to mitigationtechniques and help identify other related vulnerabilities and sources of bugs. Finally, VRPsoften engender goodwill amongst the community of security researchers. Taken together,VRPs provide an attractive tool for increasing product security and protecting customers.
Despite their potential benefits, there is an active debate over the value and effectivenessof VRPs. A number of vendors, notably Microsoft, Adobe, and Oracle, do not maintain aVRP, with Microsoft arguing that VRPs do not represent the best return on investment ona per-bug basis [63]. Further, it is also not clear if the bounties awarded are a sufficientattraction for security researchers motivated by money—underground economy prices for
1For instance, Linus’s Law suggests “Given enough eyeballs, all bugs are shallow.” [101]
CHAPTER 5. VULNERABILITY REWARDS PROGRAMS 48
vulnerabilities are far higher than those offered by VRPs [85, 54].Given the emergence of VRPs as a component of the secure development lifecycle and
the debate over the efficacy of such programs, we use available data to better understandexisting VRPs. We focus on the Google Chrome and Mozilla Firefox web browsers, bothof which are widely considered to have mature and successful VRPs, as case studies. Weanalyze these VRPs along several dimensions with the intention of better understanding thecharacteristics, metrics, and trajectory of a successful VRP.
We make the following contributions:
• We collect and analyze data on vulnerability rewards over the last 3 years for theGoogle Chrome VRP and the Mozilla Firefox VRP (Section 5.3).
• We assess the state of these VRPs along several dimensions, including costs, benefits,popularity, and efficacy (Section 5.4).
• We make concrete recommendations for software vendors aiming to start or evolvetheir own VRP (Section 5.5).
5.2 Background
A secure software development lifecycle (SDLC) aims to address software security throughoutthe entire software development process, from before specifications are developed to longafter software has been released [47]. A vulnerability remediation strategy is any systematicapproach whose goal is to reduce the number of software vulnerabilities [14]. Vulnerabilityremediation strategies are one important part of an SDLC, complemented by things likeincident response [13], operational security considerations [12], and defense in depth [4].
Potential vulnerability remediation strategies include:
• Code reviews. These can range from informal, as-needed requests for code review tosystematized, formal processes for mandatory code inspection. Typically, SDLCs alsoinclude an extra security review for security critical features.
• Penetration testing. Software vendors may perform in-house penetration testing ormay hire external companies who specialize in this service. Penetration testing rangesfrom manual to automated.
• Use of dynamic and static analysis tools. Specialized tools exist for catchinga wide range of flaws, e.g., memory safety vulnerabilities, configuration errors, andconcurrency bugs.
• Vulnerability rewards programs. The focus of our study, VRPs have recentlyreceived increased attention from the security community.
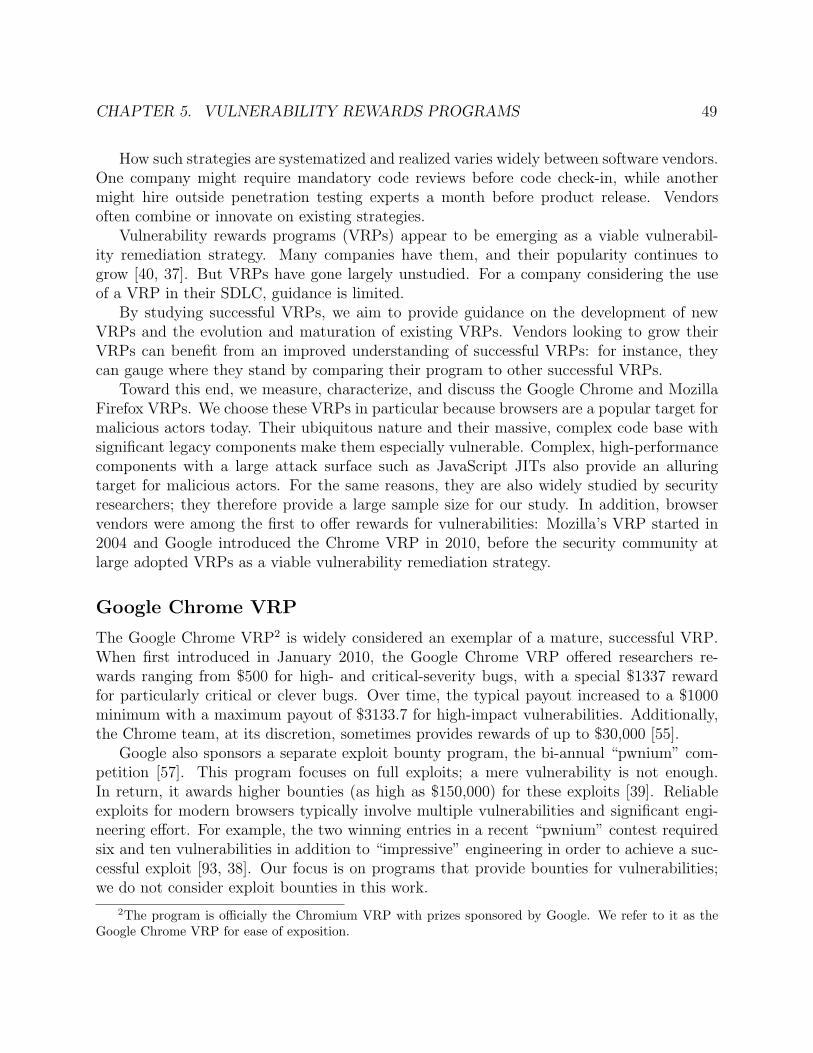
CHAPTER 5. VULNERABILITY REWARDS PROGRAMS 49
How such strategies are systematized and realized varies widely between software vendors.One company might require mandatory code reviews before code check-in, while anothermight hire outside penetration testing experts a month before product release. Vendorsoften combine or innovate on existing strategies.
Vulnerability rewards programs (VRPs) appear to be emerging as a viable vulnerabil-ity remediation strategy. Many companies have them, and their popularity continues togrow [40, 37]. But VRPs have gone largely unstudied. For a company considering the useof a VRP in their SDLC, guidance is limited.
By studying successful VRPs, we aim to provide guidance on the development of newVRPs and the evolution and maturation of existing VRPs. Vendors looking to grow theirVRPs can benefit from an improved understanding of successful VRPs: for instance, theycan gauge where they stand by comparing their program to other successful VRPs.
Toward this end, we measure, characterize, and discuss the Google Chrome and MozillaFirefox VRPs. We choose these VRPs in particular because browsers are a popular target formalicious actors today. Their ubiquitous nature and their massive, complex code base withsignificant legacy components make them especially vulnerable. Complex, high-performancecomponents with a large attack surface such as JavaScript JITs also provide an alluringtarget for malicious actors. For the same reasons, they are also widely studied by securityresearchers; they therefore provide a large sample size for our study. In addition, browservendors were among the first to offer rewards for vulnerabilities: Mozilla’s VRP started in2004 and Google introduced the Chrome VRP in 2010, before the security community atlarge adopted VRPs as a viable vulnerability remediation strategy.
Google Chrome VRP
The Google Chrome VRP2 is widely considered an exemplar of a mature, successful VRP.When first introduced in January 2010, the Google Chrome VRP offered researchers re-wards ranging from $500 for high- and critical-severity bugs, with a special $1337 rewardfor particularly critical or clever bugs. Over time, the typical payout increased to a $1000minimum with a maximum payout of $3133.7 for high-impact vulnerabilities. Additionally,the Chrome team, at its discretion, sometimes provides rewards of up to $30,000 [55].
Google also sponsors a separate exploit bounty program, the bi-annual “pwnium” com-petition [57]. This program focuses on full exploits; a mere vulnerability is not enough.In return, it awards higher bounties (as high as $150,000) for these exploits [39]. Reliableexploits for modern browsers typically involve multiple vulnerabilities and significant engi-neering effort. For example, the two winning entries in a recent “pwnium” contest requiredsix and ten vulnerabilities in addition to “impressive” engineering in order to achieve a suc-cessful exploit [93, 38]. Our focus is on programs that provide bounties for vulnerabilities;we do not consider exploit bounties in this work.
2The program is officially the Chromium VRP with prizes sponsored by Google. We refer to it as theGoogle Chrome VRP for ease of exposition.
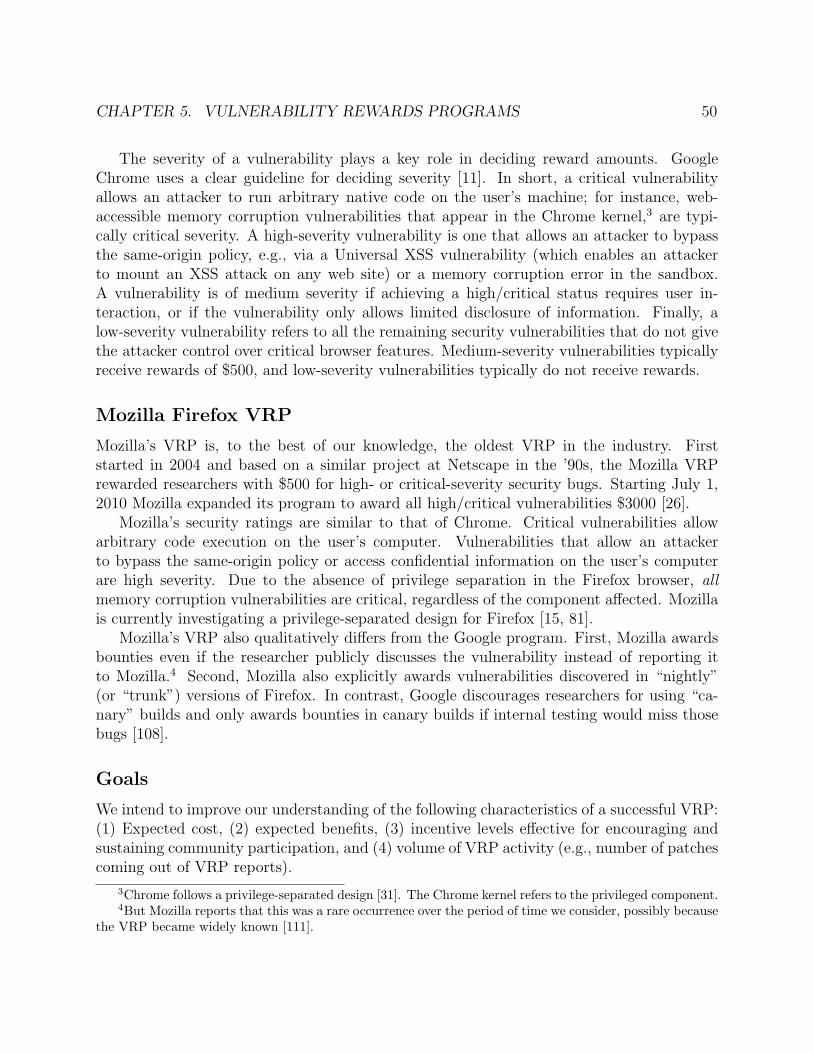
CHAPTER 5. VULNERABILITY REWARDS PROGRAMS 50
The severity of a vulnerability plays a key role in deciding reward amounts. GoogleChrome uses a clear guideline for deciding severity [11]. In short, a critical vulnerabilityallows an attacker to run arbitrary native code on the user’s machine; for instance, web-accessible memory corruption vulnerabilities that appear in the Chrome kernel,3 are typi-cally critical severity. A high-severity vulnerability is one that allows an attacker to bypassthe same-origin policy, e.g., via a Universal XSS vulnerability (which enables an attackerto mount an XSS attack on any web site) or a memory corruption error in the sandbox.A vulnerability is of medium severity if achieving a high/critical status requires user in-teraction, or if the vulnerability only allows limited disclosure of information. Finally, alow-severity vulnerability refers to all the remaining security vulnerabilities that do not givethe attacker control over critical browser features. Medium-severity vulnerabilities typicallyreceive rewards of $500, and low-severity vulnerabilities typically do not receive rewards.
Mozilla Firefox VRP
Mozilla’s VRP is, to the best of our knowledge, the oldest VRP in the industry. Firststarted in 2004 and based on a similar project at Netscape in the ’90s, the Mozilla VRPrewarded researchers with $500 for high- or critical-severity security bugs. Starting July 1,2010 Mozilla expanded its program to award all high/critical vulnerabilities $3000 [26].
Mozilla’s security ratings are similar to that of Chrome. Critical vulnerabilities allowarbitrary code execution on the user’s computer. Vulnerabilities that allow an attackerto bypass the same-origin policy or access confidential information on the user’s computerare high severity. Due to the absence of privilege separation in the Firefox browser, allmemory corruption vulnerabilities are critical, regardless of the component affected. Mozillais currently investigating a privilege-separated design for Firefox [15, 81].
Mozilla’s VRP also qualitatively differs from the Google program. First, Mozilla awardsbounties even if the researcher publicly discusses the vulnerability instead of reporting itto Mozilla.4 Second, Mozilla also explicitly awards vulnerabilities discovered in “nightly”(or “trunk”) versions of Firefox. In contrast, Google discourages researchers for using “ca-nary” builds and only awards bounties in canary builds if internal testing would miss thosebugs [108].
Goals
We intend to improve our understanding of the following characteristics of a successful VRP:(1) Expected cost, (2) expected benefits, (3) incentive levels effective for encouraging andsustaining community participation, and (4) volume of VRP activity (e.g., number of patchescoming out of VRP reports).
3Chrome follows a privilege-separated design [31]. The Chrome kernel refers to the privileged component.4But Mozilla reports that this was a rare occurrence over the period of time we consider, possibly because
the VRP became widely known [111].
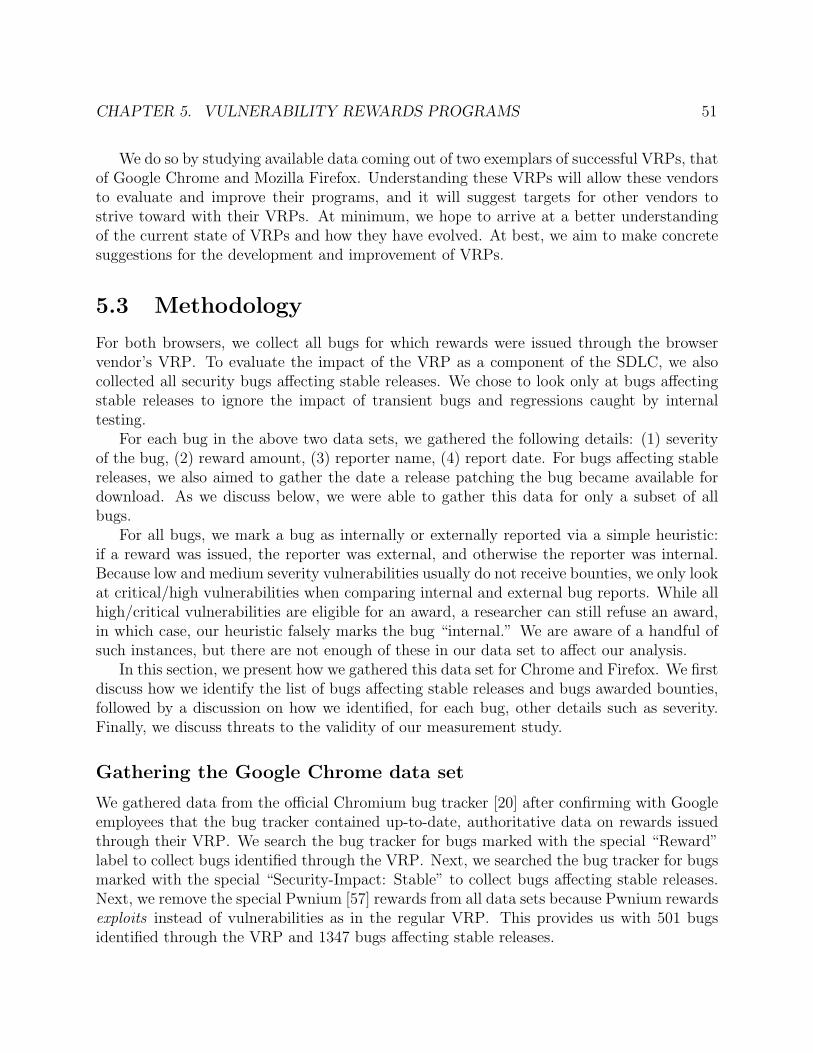
CHAPTER 5. VULNERABILITY REWARDS PROGRAMS 51
We do so by studying available data coming out of two exemplars of successful VRPs, thatof Google Chrome and Mozilla Firefox. Understanding these VRPs will allow these vendorsto evaluate and improve their programs, and it will suggest targets for other vendors tostrive toward with their VRPs. At minimum, we hope to arrive at a better understandingof the current state of VRPs and how they have evolved. At best, we aim to make concretesuggestions for the development and improvement of VRPs.
5.3 Methodology
For both browsers, we collect all bugs for which rewards were issued through the browservendor’s VRP. To evaluate the impact of the VRP as a component of the SDLC, we alsocollected all security bugs affecting stable releases. We chose to look only at bugs affectingstable releases to ignore the impact of transient bugs and regressions caught by internaltesting.
For each bug in the above two data sets, we gathered the following details: (1) severityof the bug, (2) reward amount, (3) reporter name, (4) report date. For bugs affecting stablereleases, we also aimed to gather the date a release patching the bug became available fordownload. As we discuss below, we were able to gather this data for only a subset of allbugs.
For all bugs, we mark a bug as internally or externally reported via a simple heuristic:if a reward was issued, the reporter was external, and otherwise the reporter was internal.Because low and medium severity vulnerabilities usually do not receive bounties, we only lookat critical/high vulnerabilities when comparing internal and external bug reports. While allhigh/critical vulnerabilities are eligible for an award, a researcher can still refuse an award,in which case, our heuristic falsely marks the bug “internal.” We are aware of a handful ofsuch instances, but there are not enough of these in our data set to affect our analysis.
In this section, we present how we gathered this data set for Chrome and Firefox. We firstdiscuss how we identify the list of bugs affecting stable releases and bugs awarded bounties,followed by a discussion on how we identified, for each bug, other details such as severity.Finally, we discuss threats to the validity of our measurement study.
Gathering the Google Chrome data set
We gathered data from the official Chromium bug tracker [20] after confirming with Googleemployees that the bug tracker contained up-to-date, authoritative data on rewards issuedthrough their VRP. We search the bug tracker for bugs marked with the special “Reward”label to collect bugs identified through the VRP. Next, we searched the bug tracker for bugsmarked with the special “Security-Impact: Stable” to collect bugs affecting stable releases.Next, we remove the special Pwnium [57] rewards from all data sets because Pwnium rewardsexploits instead of vulnerabilities as in the regular VRP. This provides us with 501 bugsidentified through the VRP and 1347 bugs affecting stable releases.
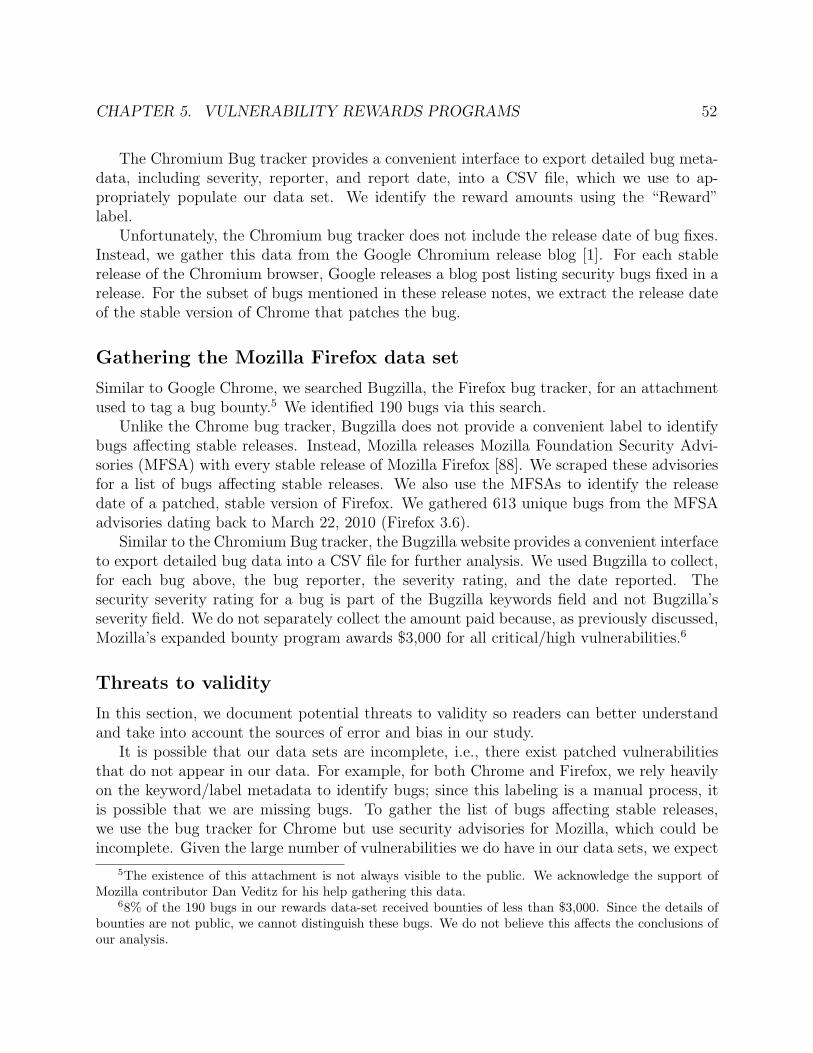
CHAPTER 5. VULNERABILITY REWARDS PROGRAMS 52
The Chromium Bug tracker provides a convenient interface to export detailed bug meta-data, including severity, reporter, and report date, into a CSV file, which we use to ap-propriately populate our data set. We identify the reward amounts using the “Reward”label.
Unfortunately, the Chromium bug tracker does not include the release date of bug fixes.Instead, we gather this data from the Google Chromium release blog [1]. For each stablerelease of the Chromium browser, Google releases a blog post listing security bugs fixed in arelease. For the subset of bugs mentioned in these release notes, we extract the release dateof the stable version of Chrome that patches the bug.
Gathering the Mozilla Firefox data set
Similar to Google Chrome, we searched Bugzilla, the Firefox bug tracker, for an attachmentused to tag a bug bounty.5 We identified 190 bugs via this search.
Unlike the Chrome bug tracker, Bugzilla does not provide a convenient label to identifybugs affecting stable releases. Instead, Mozilla releases Mozilla Foundation Security Advi-sories (MFSA) with every stable release of Mozilla Firefox [88]. We scraped these advisoriesfor a list of bugs affecting stable releases. We also use the MFSAs to identify the releasedate of a patched, stable version of Firefox. We gathered 613 unique bugs from the MFSAadvisories dating back to March 22, 2010 (Firefox 3.6).
Similar to the Chromium Bug tracker, the Bugzilla website provides a convenient interfaceto export detailed bug data into a CSV file for further analysis. We used Bugzilla to collect,for each bug above, the bug reporter, the severity rating, and the date reported. Thesecurity severity rating for a bug is part of the Bugzilla keywords field and not Bugzilla’sseverity field. We do not separately collect the amount paid because, as previously discussed,Mozilla’s expanded bounty program awards $3,000 for all critical/high vulnerabilities.6
Threats to validity
In this section, we document potential threats to validity so readers can better understandand take into account the sources of error and bias in our study.
It is possible that our data sets are incomplete, i.e., there exist patched vulnerabilitiesthat do not appear in our data. For example, for both Chrome and Firefox, we rely heavilyon the keyword/label metadata to identify bugs; since this labeling is a manual process, itis possible that we are missing bugs. To gather the list of bugs affecting stable releases,we use the bug tracker for Chrome but use security advisories for Mozilla, which could beincomplete. Given the large number of vulnerabilities we do have in our data sets, we expect
5The existence of this attachment is not always visible to the public. We acknowledge the support ofMozilla contributor Dan Veditz for his help gathering this data.
68% of the 190 bugs in our rewards data-set received bounties of less than $3,000. Since the details ofbounties are not public, we cannot distinguish these bugs. We do not believe this affects the conclusions ofour analysis.
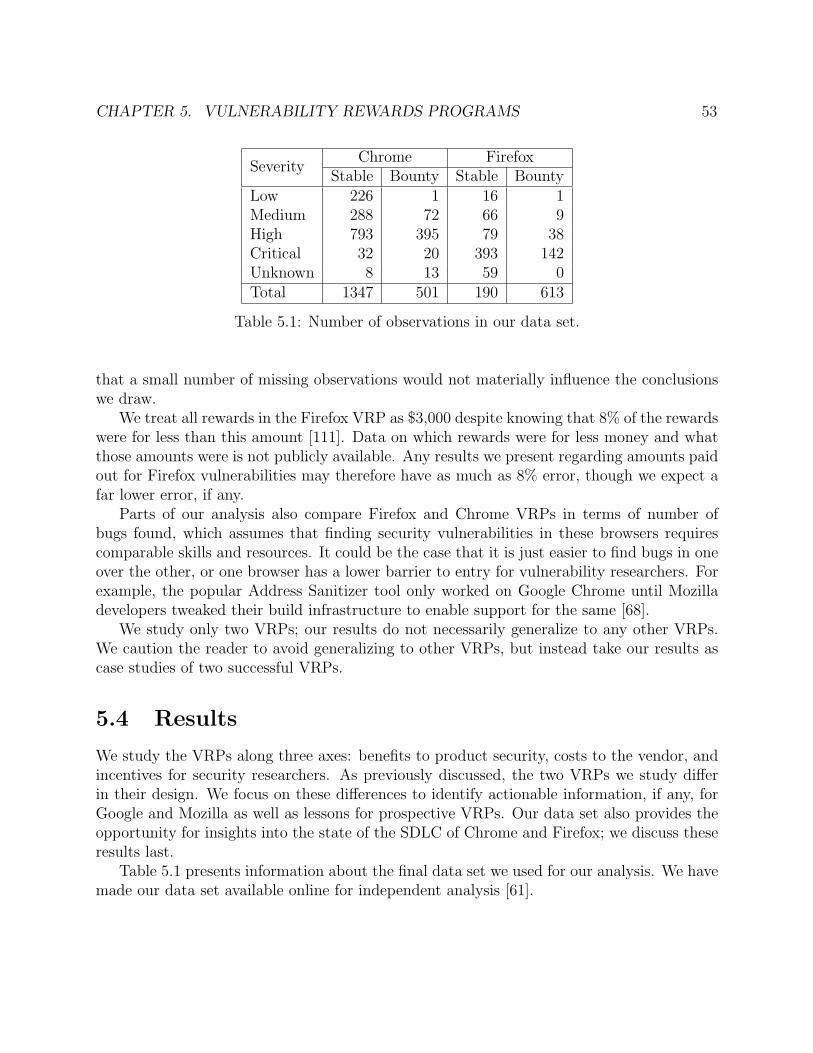
CHAPTER 5. VULNERABILITY REWARDS PROGRAMS 53
SeverityChrome Firefox
Stable Bounty Stable BountyLow 226 1 16 1Medium 288 72 66 9High 793 395 79 38Critical 32 20 393 142Unknown 8 13 59 0Total 1347 501 190 613
Table 5.1: Number of observations in our data set.
that a small number of missing observations would not materially influence the conclusionswe draw.
We treat all rewards in the Firefox VRP as $3,000 despite knowing that 8% of the rewardswere for less than this amount [111]. Data on which rewards were for less money and whatthose amounts were is not publicly available. Any results we present regarding amounts paidout for Firefox vulnerabilities may therefore have as much as 8% error, though we expect afar lower error, if any.
Parts of our analysis also compare Firefox and Chrome VRPs in terms of number ofbugs found, which assumes that finding security vulnerabilities in these browsers requirescomparable skills and resources. It could be the case that it is just easier to find bugs in oneover the other, or one browser has a lower barrier to entry for vulnerability researchers. Forexample, the popular Address Sanitizer tool only worked on Google Chrome until Mozilladevelopers tweaked their build infrastructure to enable support for the same [68].
We study only two VRPs; our results do not necessarily generalize to any other VRPs.We caution the reader to avoid generalizing to other VRPs, but instead take our results ascase studies of two successful VRPs.
5.4 Results
We study the VRPs along three axes: benefits to product security, costs to the vendor, andincentives for security researchers. As previously discussed, the two VRPs we study differin their design. We focus on these differences to identify actionable information, if any, forGoogle and Mozilla as well as lessons for prospective VRPs. Our data set also provides theopportunity for insights into the state of the SDLC of Chrome and Firefox; we discuss theseresults last.
Table 5.1 presents information about the final data set we used for our analysis. We havemade our data set available online for independent analysis [61].
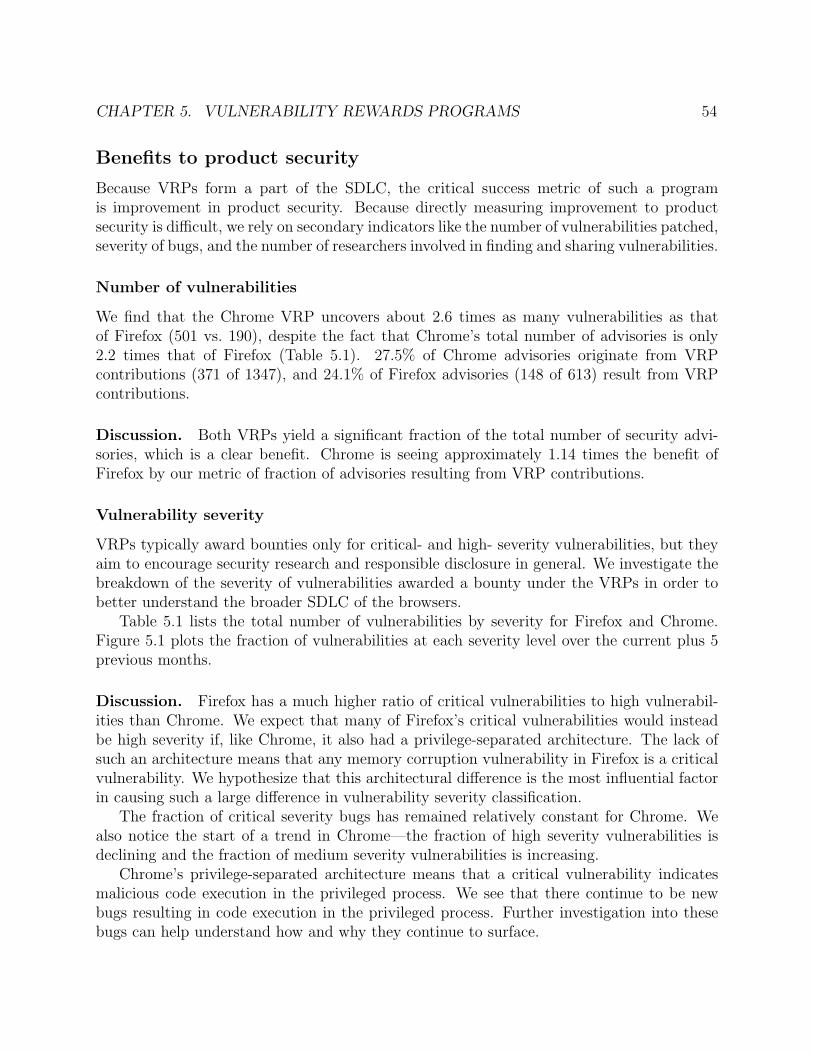
CHAPTER 5. VULNERABILITY REWARDS PROGRAMS 54
Benefits to product security
Because VRPs form a part of the SDLC, the critical success metric of such a programis improvement in product security. Because directly measuring improvement to productsecurity is difficult, we rely on secondary indicators like the number of vulnerabilities patched,severity of bugs, and the number of researchers involved in finding and sharing vulnerabilities.
Number of vulnerabilities
We find that the Chrome VRP uncovers about 2.6 times as many vulnerabilities as thatof Firefox (501 vs. 190), despite the fact that Chrome’s total number of advisories is only2.2 times that of Firefox (Table 5.1). 27.5% of Chrome advisories originate from VRPcontributions (371 of 1347), and 24.1% of Firefox advisories (148 of 613) result from VRPcontributions.
Discussion. Both VRPs yield a significant fraction of the total number of security advi-sories, which is a clear benefit. Chrome is seeing approximately 1.14 times the benefit ofFirefox by our metric of fraction of advisories resulting from VRP contributions.
Vulnerability severity
VRPs typically award bounties only for critical- and high- severity vulnerabilities, but theyaim to encourage security research and responsible disclosure in general. We investigate thebreakdown of the severity of vulnerabilities awarded a bounty under the VRPs in order tobetter understand the broader SDLC of the browsers.
Table 5.1 lists the total number of vulnerabilities by severity for Firefox and Chrome.Figure 5.1 plots the fraction of vulnerabilities at each severity level over the current plus 5previous months.
Discussion. Firefox has a much higher ratio of critical vulnerabilities to high vulnerabil-ities than Chrome. We expect that many of Firefox’s critical vulnerabilities would insteadbe high severity if, like Chrome, it also had a privilege-separated architecture. The lack ofsuch an architecture means that any memory corruption vulnerability in Firefox is a criticalvulnerability. We hypothesize that this architectural difference is the most influential factorin causing such a large difference in vulnerability severity classification.
The fraction of critical severity bugs has remained relatively constant for Chrome. Wealso notice the start of a trend in Chrome—the fraction of high severity vulnerabilities isdeclining and the fraction of medium severity vulnerabilities is increasing.
Chrome’s privilege-separated architecture means that a critical vulnerability indicatesmalicious code execution in the privileged process. We see that there continue to be newbugs resulting in code execution in the privileged process. Further investigation into thesebugs can help understand how and why they continue to surface.
CHAPTER 5. VULNERABILITY REWARDS PROGRAMS 55
0.2
.4.6
.8Fr
actio
n vu
lns
in c
urre
nt p
lus
last
5 m
onth
s
7/09 1/10 7/10 1/11 7/11 1/12 7/12 1/13
Low MediumHigh Critical
(a) Chrome
0.2
.4.6
.8Fr
actio
n vu
lns
in c
urre
nt p
lus
last
5 m
onth
s
7/09 1/10 7/10 1/11 7/11 1/12 7/12 1/13
Low MediumHigh Critical
(b) Firefox
Figure 5.1: Moving average over the current plus 5 previous months of the percentage ofvulnerabilities at each severity level (low is blue solid line, medium is red long-dashed line,high is green short-dashed line, and critical is yellow dash-dotted line).
Low-severity vulnerabilities in Google Chrome make up a significant fraction of all vul-nerabilities reported. In contrast, the fraction of low- and medium-severity vulnerabilities inFirefox remains negligible.
CHAPTER 5. VULNERABILITY REWARDS PROGRAMS 56
02
00
40
06
00
80
01
00
0N
um
be
r h
igh
+critica
l vu
lns o
pe
ne
d (
cu
mu
lative
)
1/09 7/09 1/10 7/10 1/11 7/11 1/12 7/12 1/13
(a) Chrome
01
00
20
03
00
40
05
00
Nu
mb
er
hig
h+
critica
l vu
lns o
pe
ne
d (
cu
mu
lative
)
1/07 1/08 1/09 1/10 1/11 1/12 1/13
(b) Firefox
Figure 5.2: Number of high- plus critical-severity vulnerabilities reported over time, discov-ered internally (blue long-dashed line), externally (red short-dashed line), and total (greensolid line).
Community engagement
One advantage of VRPs is engagement with the broader security community. We studiedthis engagement along two axes: (1) the contribution of internal and external researcherstowards identifying security vulnerabilities, and (2) the number of external participants.
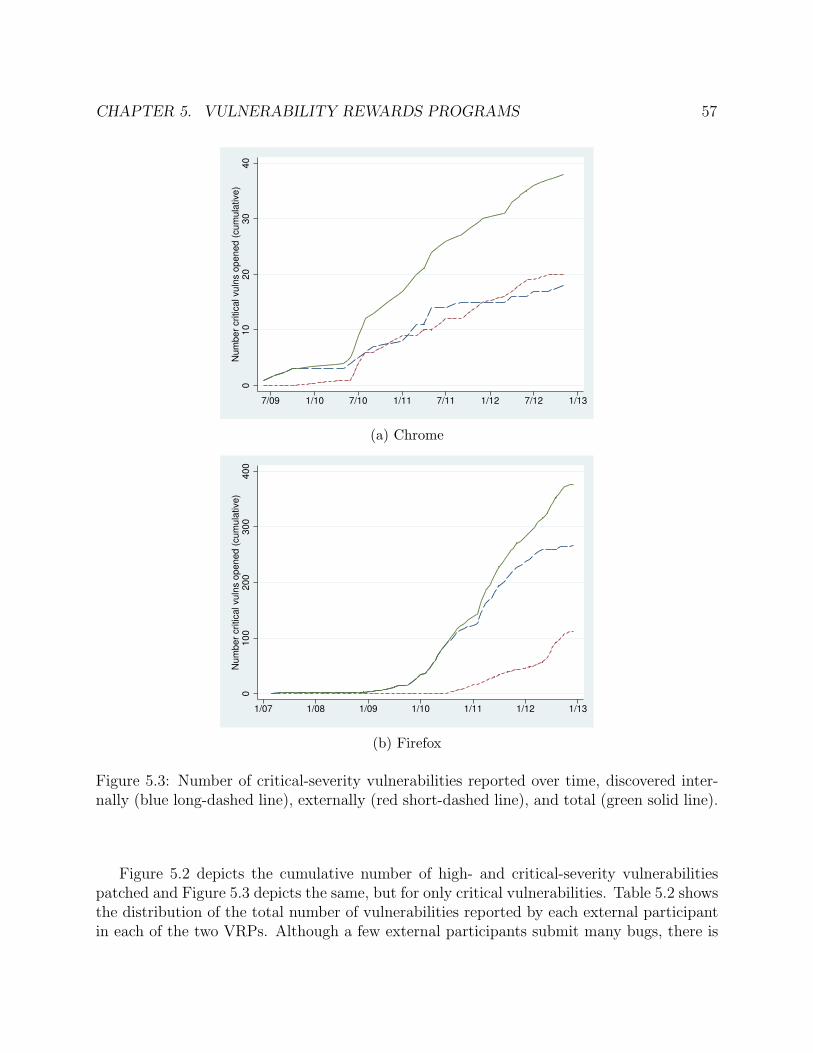
CHAPTER 5. VULNERABILITY REWARDS PROGRAMS 57
01
02
03
04
0N
um
be
r critica
l vu
lns o
pe
ne
d (
cu
mu
lative
)
7/09 1/10 7/10 1/11 7/11 1/12 7/12 1/13
(a) Chrome
01
00
20
03
00
40
0N
um
be
r critica
l vu
lns o
pe
ne
d (
cu
mu
lative
)
1/07 1/08 1/09 1/10 1/11 1/12 1/13
(b) Firefox
Figure 5.3: Number of critical-severity vulnerabilities reported over time, discovered inter-nally (blue long-dashed line), externally (red short-dashed line), and total (green solid line).
Figure 5.2 depicts the cumulative number of high- and critical-severity vulnerabilitiespatched and Figure 5.3 depicts the same, but for only critical vulnerabilities. Table 5.2 showsthe distribution of the total number of vulnerabilities reported by each external participantin each of the two VRPs. Although a few external participants submit many bugs, there is
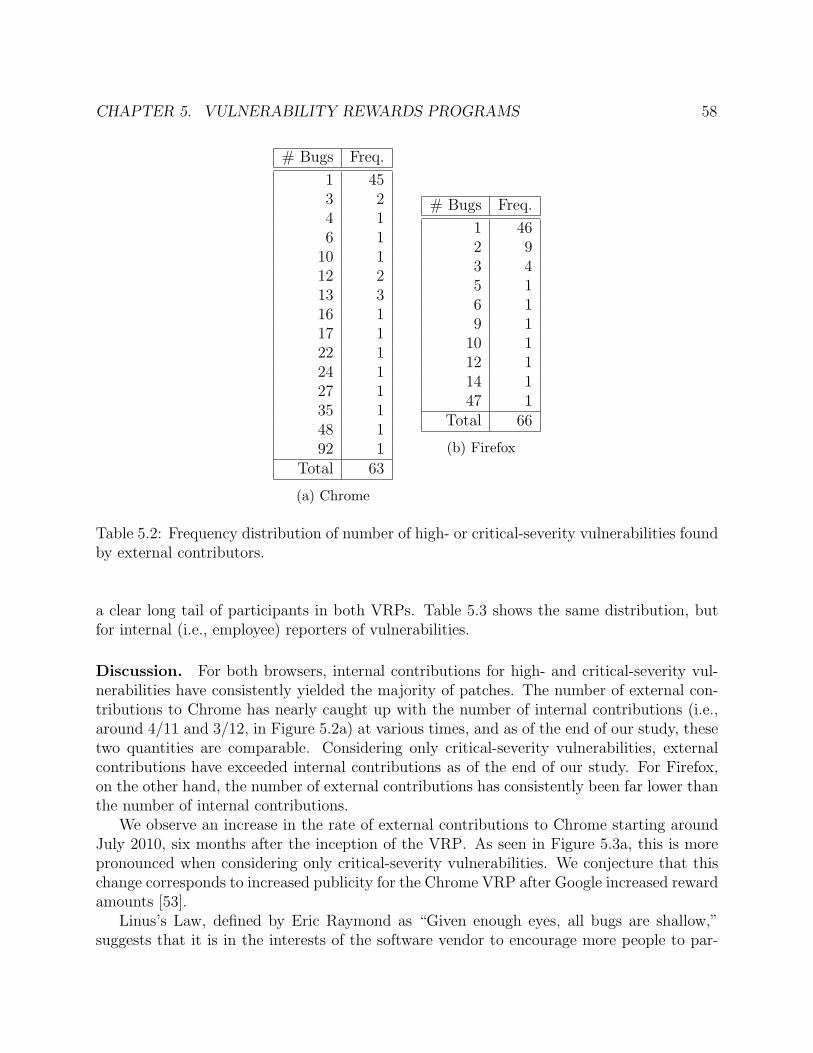
CHAPTER 5. VULNERABILITY REWARDS PROGRAMS 58
# Bugs Freq.
1 453 24 16 110 112 213 316 117 122 124 127 135 148 192 1
Total 63
(a) Chrome
# Bugs Freq.
1 462 93 45 16 19 110 112 114 147 1
Total 66
(b) Firefox
Table 5.2: Frequency distribution of number of high- or critical-severity vulnerabilities foundby external contributors.
a clear long tail of participants in both VRPs. Table 5.3 shows the same distribution, butfor internal (i.e., employee) reporters of vulnerabilities.
Discussion. For both browsers, internal contributions for high- and critical-severity vul-nerabilities have consistently yielded the majority of patches. The number of external con-tributions to Chrome has nearly caught up with the number of internal contributions (i.e.,around 4/11 and 3/12, in Figure 5.2a) at various times, and as of the end of our study, thesetwo quantities are comparable. Considering only critical-severity vulnerabilities, externalcontributions have exceeded internal contributions as of the end of our study. For Firefox,on the other hand, the number of external contributions has consistently been far lower thanthe number of internal contributions.
We observe an increase in the rate of external contributions to Chrome starting aroundJuly 2010, six months after the inception of the VRP. As seen in Figure 5.3a, this is morepronounced when considering only critical-severity vulnerabilities. We conjecture that thischange corresponds to increased publicity for the Chrome VRP after Google increased rewardamounts [53].
Linus’s Law, defined by Eric Raymond as “Given enough eyes, all bugs are shallow,”suggests that it is in the interests of the software vendor to encourage more people to par-
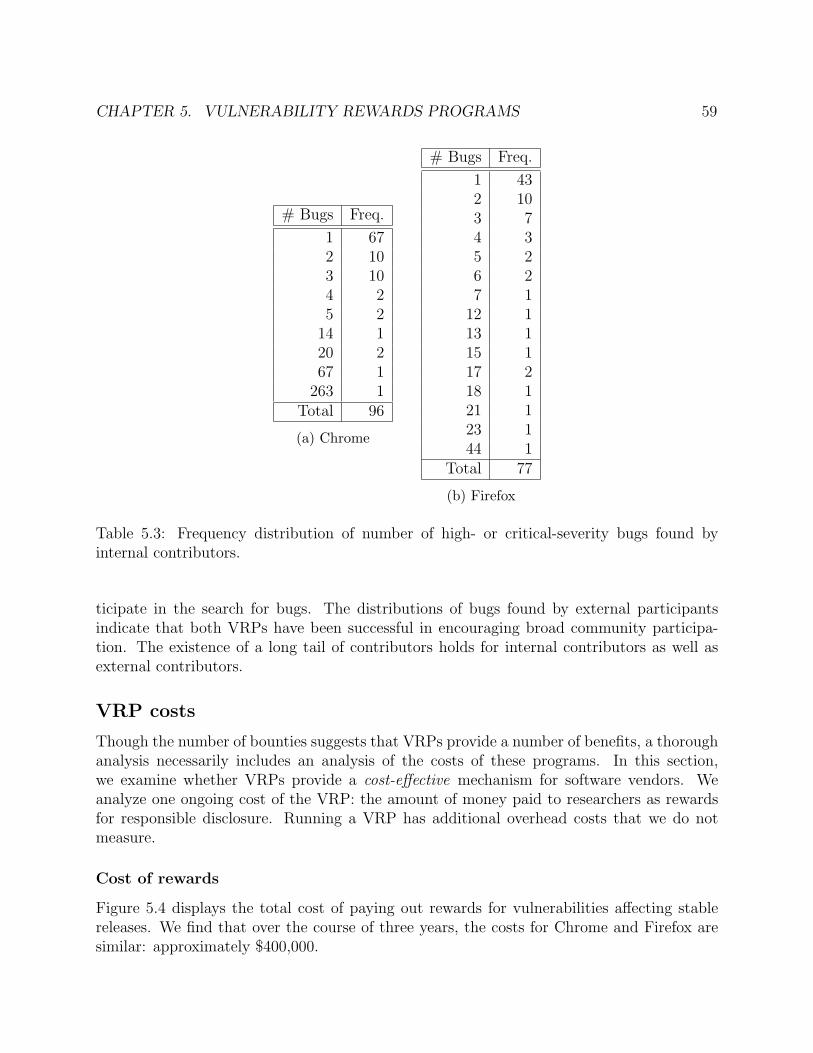
CHAPTER 5. VULNERABILITY REWARDS PROGRAMS 59
# Bugs Freq.
1 672 103 104 25 214 120 267 1263 1
Total 96
(a) Chrome
# Bugs Freq.
1 432 103 74 35 26 27 112 113 115 117 218 121 123 144 1
Total 77
(b) Firefox
Table 5.3: Frequency distribution of number of high- or critical-severity bugs found byinternal contributors.
ticipate in the search for bugs. The distributions of bugs found by external participantsindicate that both VRPs have been successful in encouraging broad community participa-tion. The existence of a long tail of contributors holds for internal contributors as well asexternal contributors.
VRP costs
Though the number of bounties suggests that VRPs provide a number of benefits, a thoroughanalysis necessarily includes an analysis of the costs of these programs. In this section,we examine whether VRPs provide a cost-effective mechanism for software vendors. Weanalyze one ongoing cost of the VRP: the amount of money paid to researchers as rewardsfor responsible disclosure. Running a VRP has additional overhead costs that we do notmeasure.
Cost of rewards
Figure 5.4 displays the total cost of paying out rewards for vulnerabilities affecting stablereleases. We find that over the course of three years, the costs for Chrome and Firefox aresimilar: approximately $400,000.
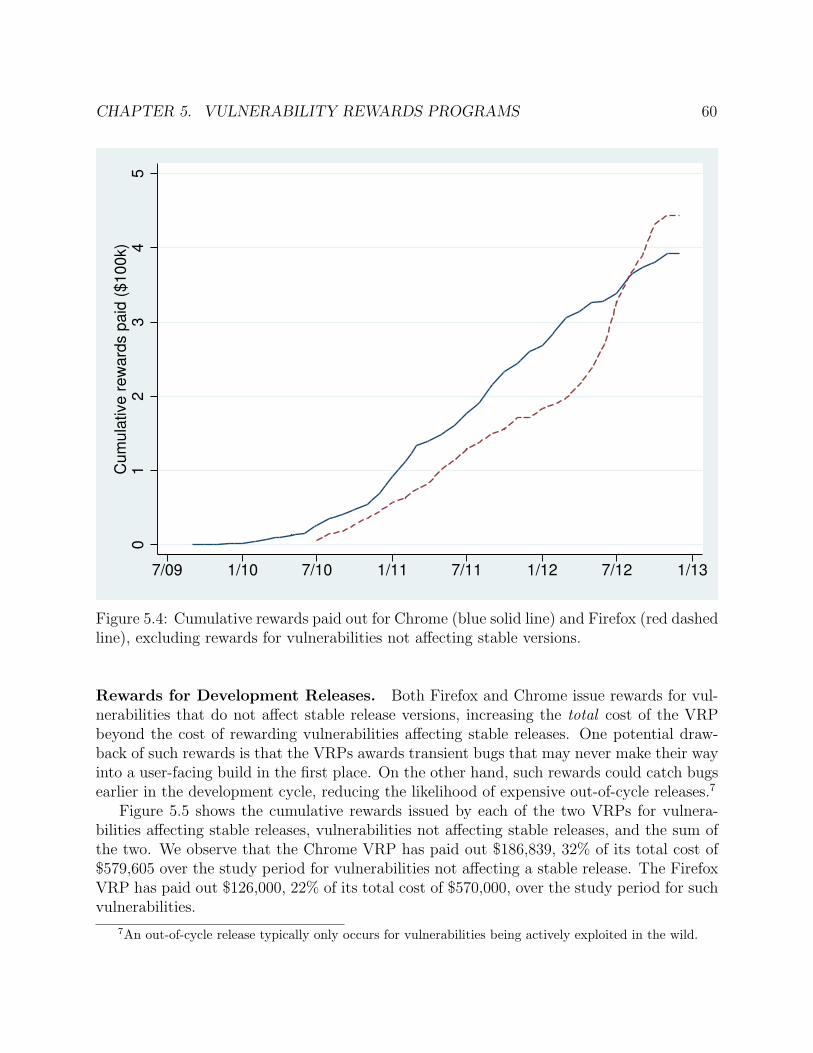
CHAPTER 5. VULNERABILITY REWARDS PROGRAMS 60
01
23
45
Cum
ula
tive r
ew
ard
s p
aid
($100k)
7/09 1/10 7/10 1/11 7/11 1/12 7/12 1/13
Figure 5.4: Cumulative rewards paid out for Chrome (blue solid line) and Firefox (red dashedline), excluding rewards for vulnerabilities not affecting stable versions.
Rewards for Development Releases. Both Firefox and Chrome issue rewards for vul-nerabilities that do not affect stable release versions, increasing the total cost of the VRPbeyond the cost of rewarding vulnerabilities affecting stable releases. One potential draw-back of such rewards is that the VRPs awards transient bugs that may never make their wayinto a user-facing build in the first place. On the other hand, such rewards could catch bugsearlier in the development cycle, reducing the likelihood of expensive out-of-cycle releases.7
Figure 5.5 shows the cumulative rewards issued by each of the two VRPs for vulnera-bilities affecting stable releases, vulnerabilities not affecting stable releases, and the sum ofthe two. We observe that the Chrome VRP has paid out $186,839, 32% of its total cost of$579,605 over the study period for vulnerabilities not affecting a stable release. The FirefoxVRP has paid out $126,000, 22% of its total cost of $570,000, over the study period for suchvulnerabilities.
7An out-of-cycle release typically only occurs for vulnerabilities being actively exploited in the wild.
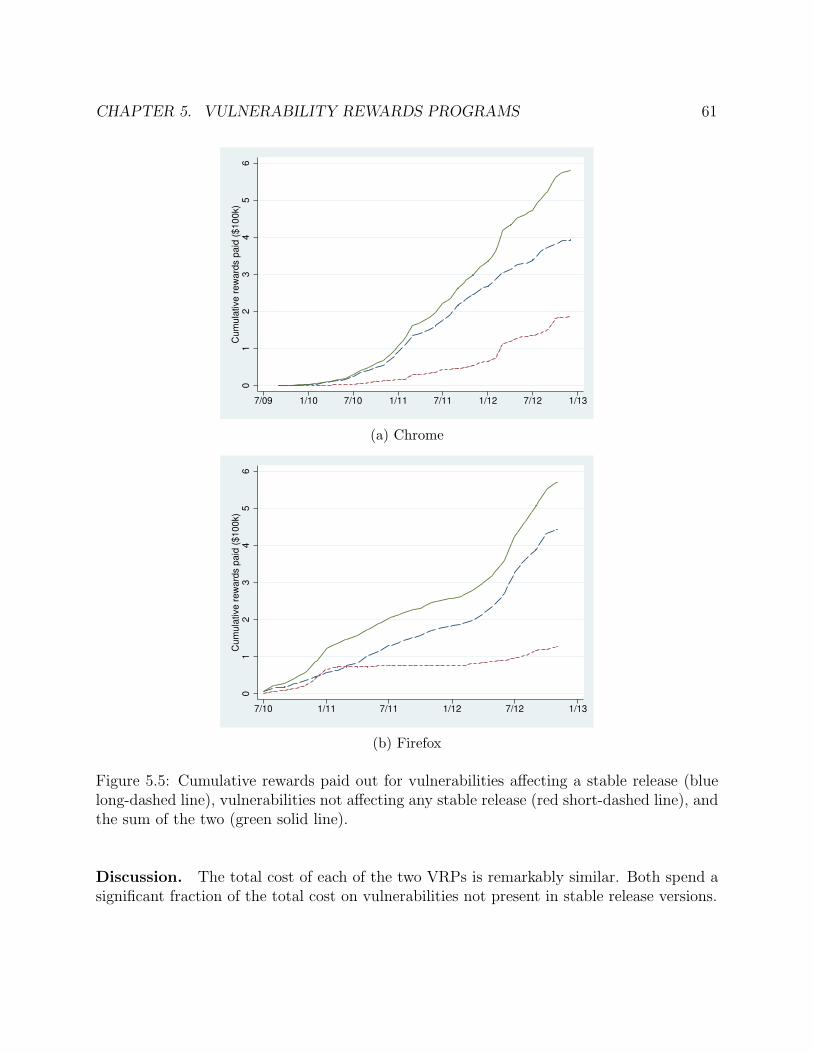
CHAPTER 5. VULNERABILITY REWARDS PROGRAMS 61
01
23
45
6C
um
ula
tive
re
wa
rds p
aid
($
10
0k)
7/09 1/10 7/10 1/11 7/11 1/12 7/12 1/13
(a) Chrome
01
23
45
6C
um
ula
tive
re
wa
rds p
aid
($
10
0k)
7/10 1/11 7/11 1/12 7/12 1/13
(b) Firefox
Figure 5.5: Cumulative rewards paid out for vulnerabilities affecting a stable release (bluelong-dashed line), vulnerabilities not affecting any stable release (red short-dashed line), andthe sum of the two (green solid line).
Discussion. The total cost of each of the two VRPs is remarkably similar. Both spend asignificant fraction of the total cost on vulnerabilities not present in stable release versions.
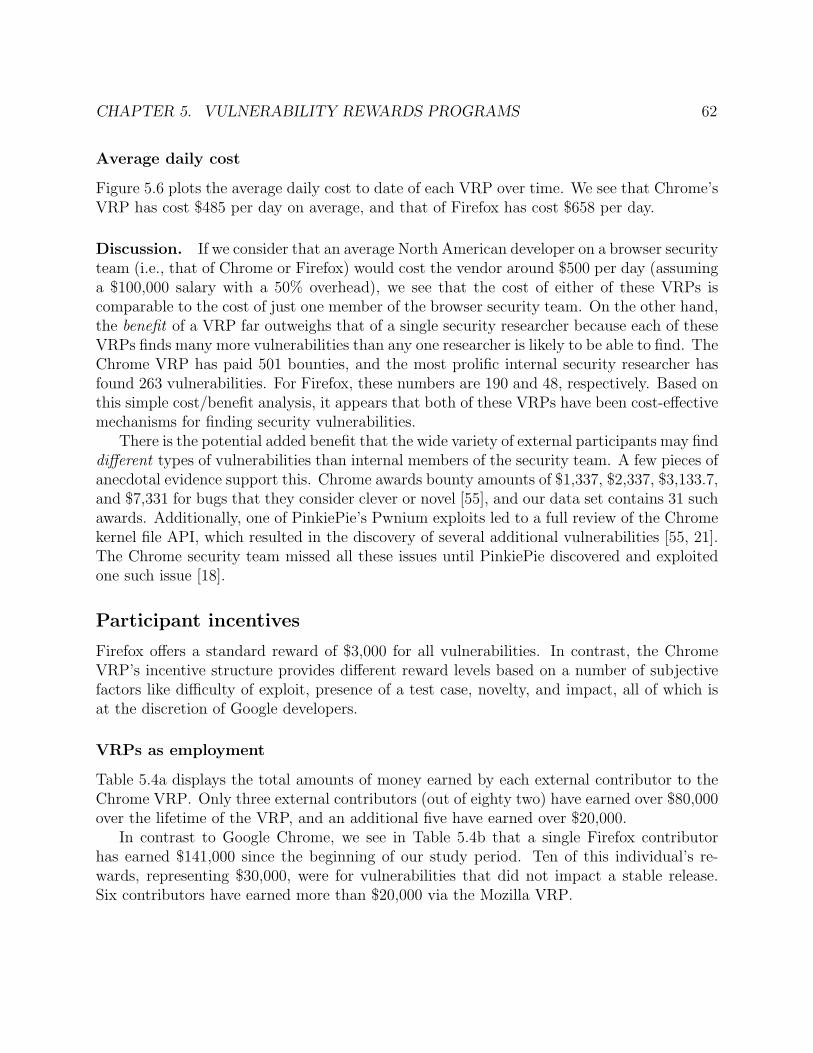
CHAPTER 5. VULNERABILITY REWARDS PROGRAMS 62
Average daily cost
Figure 5.6 plots the average daily cost to date of each VRP over time. We see that Chrome’sVRP has cost $485 per day on average, and that of Firefox has cost $658 per day.
Discussion. If we consider that an average North American developer on a browser securityteam (i.e., that of Chrome or Firefox) would cost the vendor around $500 per day (assuminga $100,000 salary with a 50% overhead), we see that the cost of either of these VRPs iscomparable to the cost of just one member of the browser security team. On the other hand,the benefit of a VRP far outweighs that of a single security researcher because each of theseVRPs finds many more vulnerabilities than any one researcher is likely to be able to find. TheChrome VRP has paid 501 bounties, and the most prolific internal security researcher hasfound 263 vulnerabilities. For Firefox, these numbers are 190 and 48, respectively. Based onthis simple cost/benefit analysis, it appears that both of these VRPs have been cost-effectivemechanisms for finding security vulnerabilities.
There is the potential added benefit that the wide variety of external participants may finddifferent types of vulnerabilities than internal members of the security team. A few pieces ofanecdotal evidence support this. Chrome awards bounty amounts of $1,337, $2,337, $3,133.7,and $7,331 for bugs that they consider clever or novel [55], and our data set contains 31 suchawards. Additionally, one of PinkiePie’s Pwnium exploits led to a full review of the Chromekernel file API, which resulted in the discovery of several additional vulnerabilities [55, 21].The Chrome security team missed all these issues until PinkiePie discovered and exploitedone such issue [18].
Participant incentives
Firefox offers a standard reward of $3,000 for all vulnerabilities. In contrast, the ChromeVRP’s incentive structure provides different reward levels based on a number of subjectivefactors like difficulty of exploit, presence of a test case, novelty, and impact, all of which isat the discretion of Google developers.
VRPs as employment
Table 5.4a displays the total amounts of money earned by each external contributor to theChrome VRP. Only three external contributors (out of eighty two) have earned over $80,000over the lifetime of the VRP, and an additional five have earned over $20,000.
In contrast to Google Chrome, we see in Table 5.4b that a single Firefox contributorhas earned $141,000 since the beginning of our study period. Ten of this individual’s re-wards, representing $30,000, were for vulnerabilities that did not impact a stable release.Six contributors have earned more than $20,000 via the Mozilla VRP.
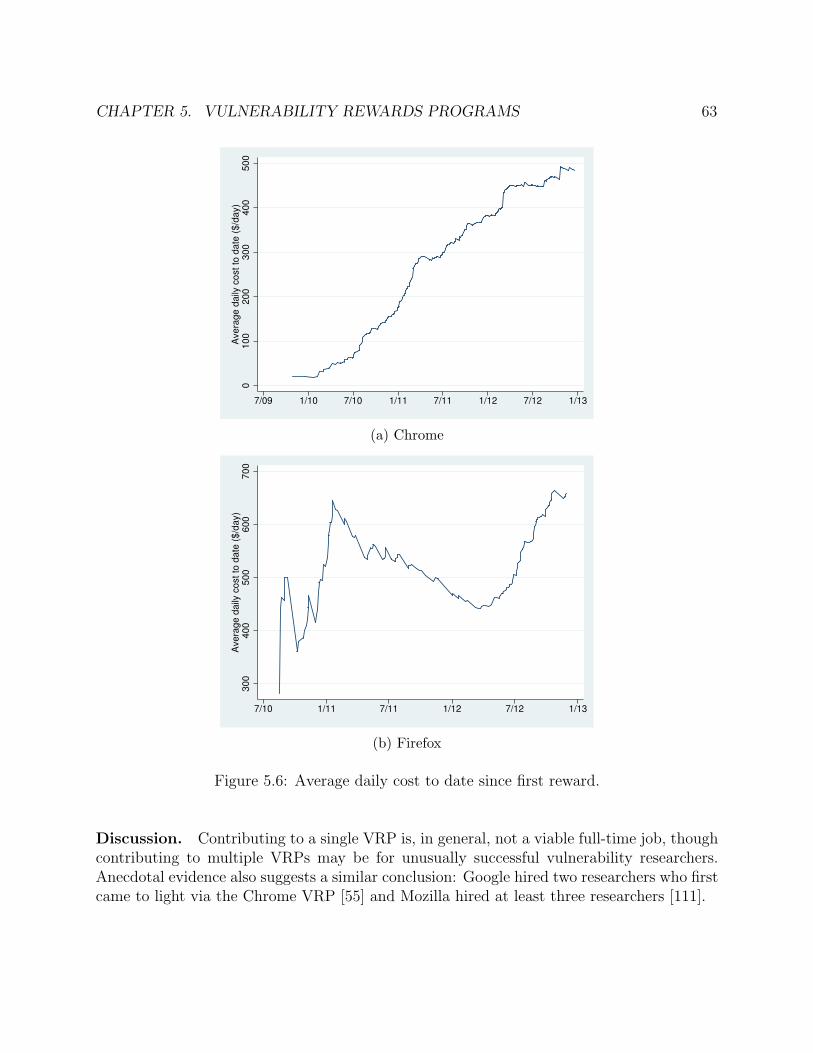
CHAPTER 5. VULNERABILITY REWARDS PROGRAMS 63
01
00
20
03
00
40
05
00
Ave
rag
e d
aily
co
st
to d
ate
($
/da
y)
7/09 1/10 7/10 1/11 7/11 1/12 7/12 1/13
(a) Chrome
30
04
00
50
06
00
70
0A
ve
rag
e d
aily
co
st
to d
ate
($
/da
y)
7/10 1/11 7/11 1/12 7/12 1/13
(b) Firefox
Figure 5.6: Average daily cost to date since first reward.
Discussion. Contributing to a single VRP is, in general, not a viable full-time job, thoughcontributing to multiple VRPs may be for unusually successful vulnerability researchers.Anecdotal evidence also suggests a similar conclusion: Google hired two researchers who firstcame to light via the Chrome VRP [55] and Mozilla hired at least three researchers [111].
CHAPTER 5. VULNERABILITY REWARDS PROGRAMS 64
$ earned Freq.
500 261,000 251,337 61,500 22,000 13,000 23,133 13,500 24,000 15,000 17,500 111,000 111,500 111,837 115,000 117,133 118,337 120,633 124,133 128,500 128,633 137,470 180,679 185,992 1105,103 1Total 82
(a) Chrome
$ earned Freq.
3,000 466,000 129,000 412,000 115,000 121,000 127,000 130,000 136,000 142,000 1141,000 1Total 70
(b) Firefox
Table 5.4: Frequency distributions of total amounts earned by external VRP contributors.
Repeat contributors
Figure 5.7 shows the cumulative number of vulnerabilities patched due to reports from first-time VRP participants and repeat participants. For both programs, first-time participantrewards are steadily increasing, and repeat participant rewards are increasing even morequickly.
Discussion. Both VRP incentive structures are evidently sufficient for both attracting newparticipants and continuing to entice existing participants, though we do note differences be-
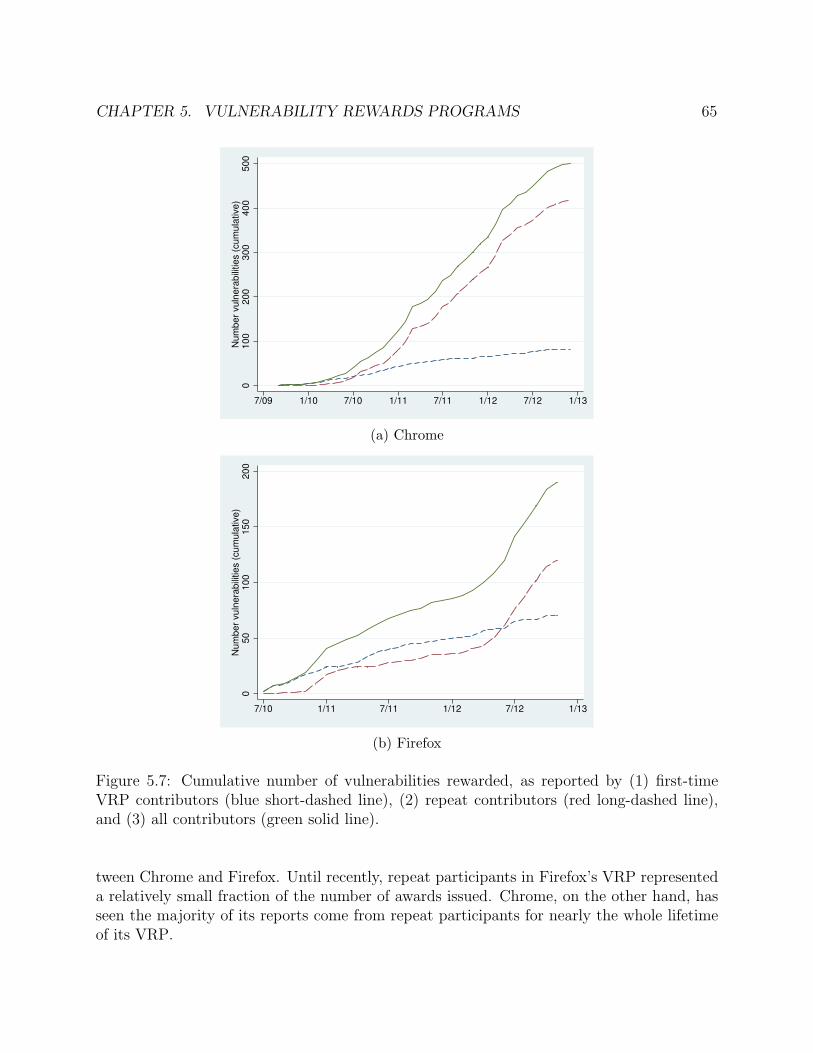
CHAPTER 5. VULNERABILITY REWARDS PROGRAMS 65
01
00
20
03
00
40
05
00
Nu
mb
er
vu
lne
rab
ilitie
s (
cu
mu
lative
)
7/09 1/10 7/10 1/11 7/11 1/12 7/12 1/13
(a) Chrome
05
01
00
15
02
00
Nu
mb
er
vu
lne
rab
ilitie
s (
cu
mu
lative
)
7/10 1/11 7/11 1/12 7/12 1/13
(b) Firefox
Figure 5.7: Cumulative number of vulnerabilities rewarded, as reported by (1) first-timeVRP contributors (blue short-dashed line), (2) repeat contributors (red long-dashed line),and (3) all contributors (green solid line).
tween Chrome and Firefox. Until recently, repeat participants in Firefox’s VRP representeda relatively small fraction of the number of awards issued. Chrome, on the other hand, hasseen the majority of its reports come from repeat participants for nearly the whole lifetimeof its VRP.
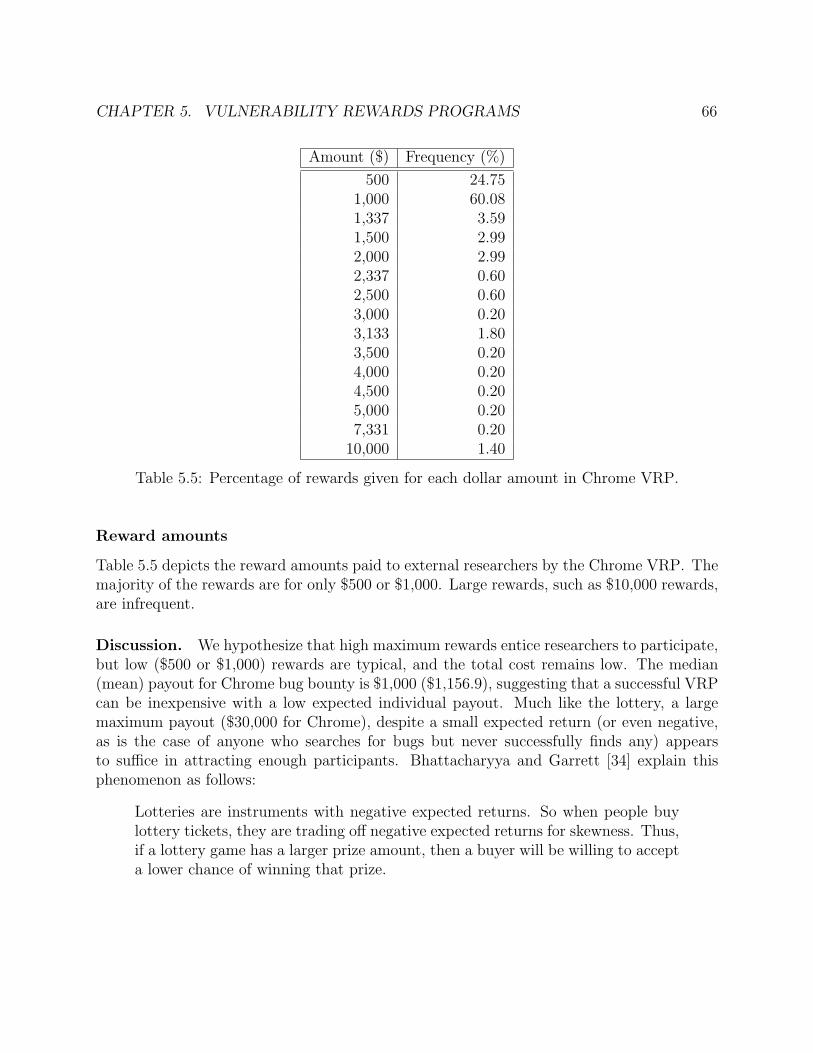
CHAPTER 5. VULNERABILITY REWARDS PROGRAMS 66
Amount ($) Frequency (%)
500 24.751,000 60.081,337 3.591,500 2.992,000 2.992,337 0.602,500 0.603,000 0.203,133 1.803,500 0.204,000 0.204,500 0.205,000 0.207,331 0.2010,000 1.40
Table 5.5: Percentage of rewards given for each dollar amount in Chrome VRP.
Reward amounts
Table 5.5 depicts the reward amounts paid to external researchers by the Chrome VRP. Themajority of the rewards are for only $500 or $1,000. Large rewards, such as $10,000 rewards,are infrequent.
Discussion. We hypothesize that high maximum rewards entice researchers to participate,but low ($500 or $1,000) rewards are typical, and the total cost remains low. The median(mean) payout for Chrome bug bounty is $1,000 ($1,156.9), suggesting that a successful VRPcan be inexpensive with a low expected individual payout. Much like the lottery, a largemaximum payout ($30,000 for Chrome), despite a small expected return (or even negative,as is the case of anyone who searches for bugs but never successfully finds any) appearsto suffice in attracting enough participants. Bhattacharyya and Garrett [34] explain thisphenomenon as follows:
Lotteries are instruments with negative expected returns. So when people buylottery tickets, they are trading off negative expected returns for skewness. Thus,if a lottery game has a larger prize amount, then a buyer will be willing to accepta lower chance of winning that prize.
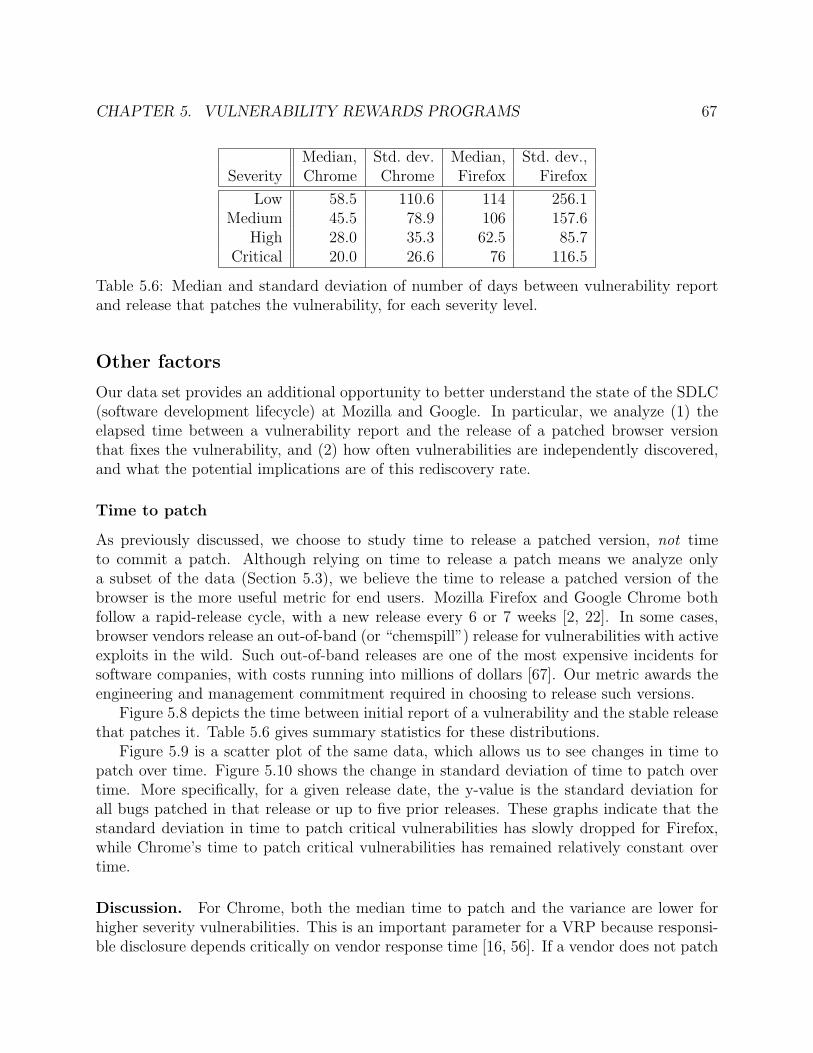
CHAPTER 5. VULNERABILITY REWARDS PROGRAMS 67
Median, Std. dev. Median, Std. dev.,Severity Chrome Chrome Firefox Firefox
Low 58.5 110.6 114 256.1Medium 45.5 78.9 106 157.6
High 28.0 35.3 62.5 85.7Critical 20.0 26.6 76 116.5
Table 5.6: Median and standard deviation of number of days between vulnerability reportand release that patches the vulnerability, for each severity level.
Other factors
Our data set provides an additional opportunity to better understand the state of the SDLC(software development lifecycle) at Mozilla and Google. In particular, we analyze (1) theelapsed time between a vulnerability report and the release of a patched browser versionthat fixes the vulnerability, and (2) how often vulnerabilities are independently discovered,and what the potential implications are of this rediscovery rate.
Time to patch
As previously discussed, we choose to study time to release a patched version, not timeto commit a patch. Although relying on time to release a patch means we analyze onlya subset of the data (Section 5.3), we believe the time to release a patched version of thebrowser is the more useful metric for end users. Mozilla Firefox and Google Chrome bothfollow a rapid-release cycle, with a new release every 6 or 7 weeks [2, 22]. In some cases,browser vendors release an out-of-band (or “chemspill”) release for vulnerabilities with activeexploits in the wild. Such out-of-band releases are one of the most expensive incidents forsoftware companies, with costs running into millions of dollars [67]. Our metric awards theengineering and management commitment required in choosing to release such versions.
Figure 5.8 depicts the time between initial report of a vulnerability and the stable releasethat patches it. Table 5.6 gives summary statistics for these distributions.
Figure 5.9 is a scatter plot of the same data, which allows us to see changes in time topatch over time. Figure 5.10 shows the change in standard deviation of time to patch overtime. More specifically, for a given release date, the y-value is the standard deviation forall bugs patched in that release or up to five prior releases. These graphs indicate that thestandard deviation in time to patch critical vulnerabilities has slowly dropped for Firefox,while Chrome’s time to patch critical vulnerabilities has remained relatively constant overtime.
Discussion. For Chrome, both the median time to patch and the variance are lower forhigher severity vulnerabilities. This is an important parameter for a VRP because responsi-ble disclosure depends critically on vendor response time [16, 56]. If a vendor does not patch
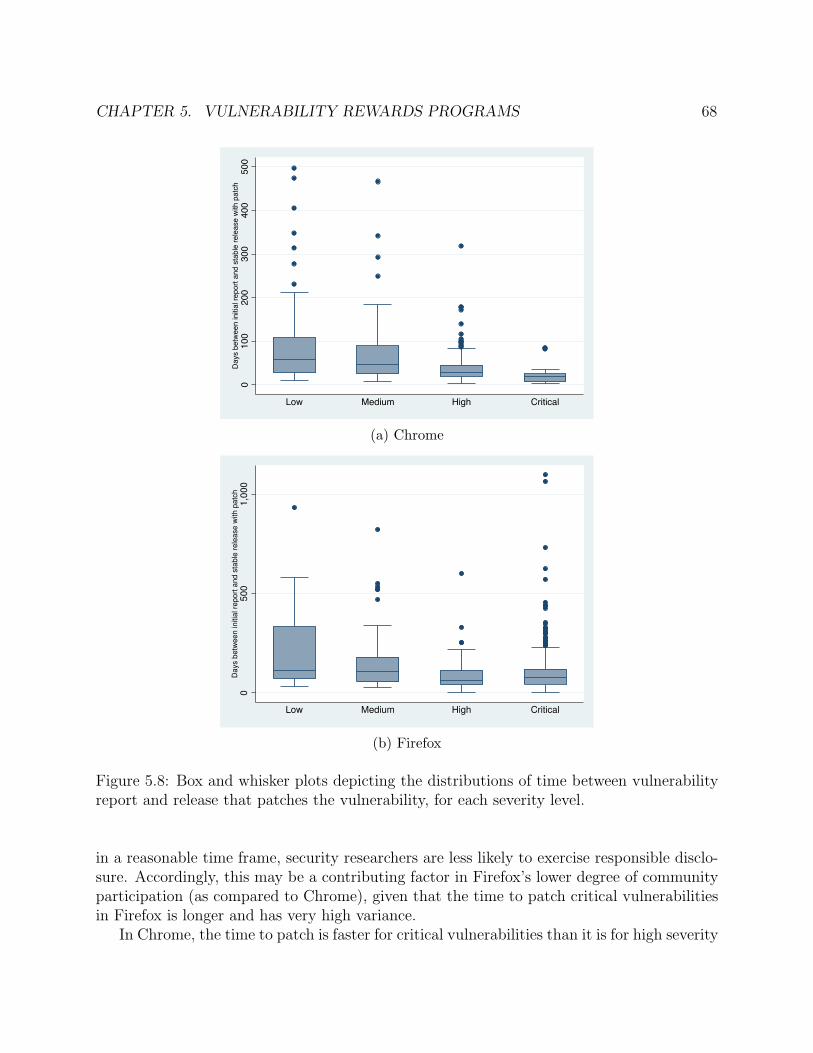
CHAPTER 5. VULNERABILITY REWARDS PROGRAMS 68
01
00
20
03
00
40
05
00
Days b
etw
een initia
l re
port
and s
table
re
lease
with p
atc
h
Low Medium High Critical
(a) Chrome
05
00
1,0
00
Days b
etw
een initia
l re
port
and s
table
rele
ase w
ith p
atc
h
Low Medium High Critical
(b) Firefox
Figure 5.8: Box and whisker plots depicting the distributions of time between vulnerabilityreport and release that patches the vulnerability, for each severity level.
in a reasonable time frame, security researchers are less likely to exercise responsible disclo-sure. Accordingly, this may be a contributing factor in Firefox’s lower degree of communityparticipation (as compared to Chrome), given that the time to patch critical vulnerabilitiesin Firefox is longer and has very high variance.
In Chrome, the time to patch is faster for critical vulnerabilities than it is for high severity
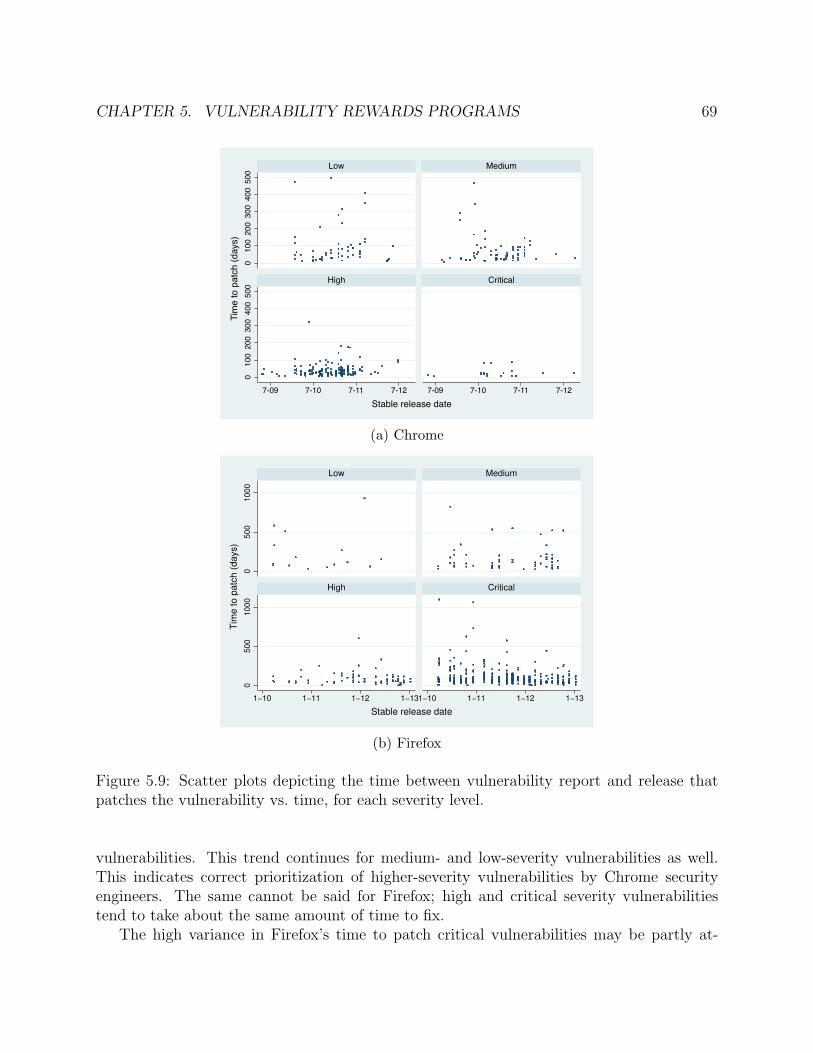
CHAPTER 5. VULNERABILITY REWARDS PROGRAMS 69
010
020
030
040
050
00
100
200
300
400
500
7-09 7-10 7-11 7-12 7-09 7-10 7-11 7-12
Low Medium
High Critical
Tim
e to
pat
ch (d
ays)
Stable release date
(a) Chrome
0500
1000
0500
1000
1−10 1−11 1−12 1−131−10 1−11 1−12 1−13
Low Medium
High Critical
Tim
e t
o p
atc
h (
da
ys)
Stable release date
(b) Firefox
Figure 5.9: Scatter plots depicting the time between vulnerability report and release thatpatches the vulnerability vs. time, for each severity level.
vulnerabilities. This trend continues for medium- and low-severity vulnerabilities as well.This indicates correct prioritization of higher-severity vulnerabilities by Chrome securityengineers. The same cannot be said for Firefox; high and critical severity vulnerabilitiestend to take about the same amount of time to fix.
The high variance in Firefox’s time to patch critical vulnerabilities may be partly at-
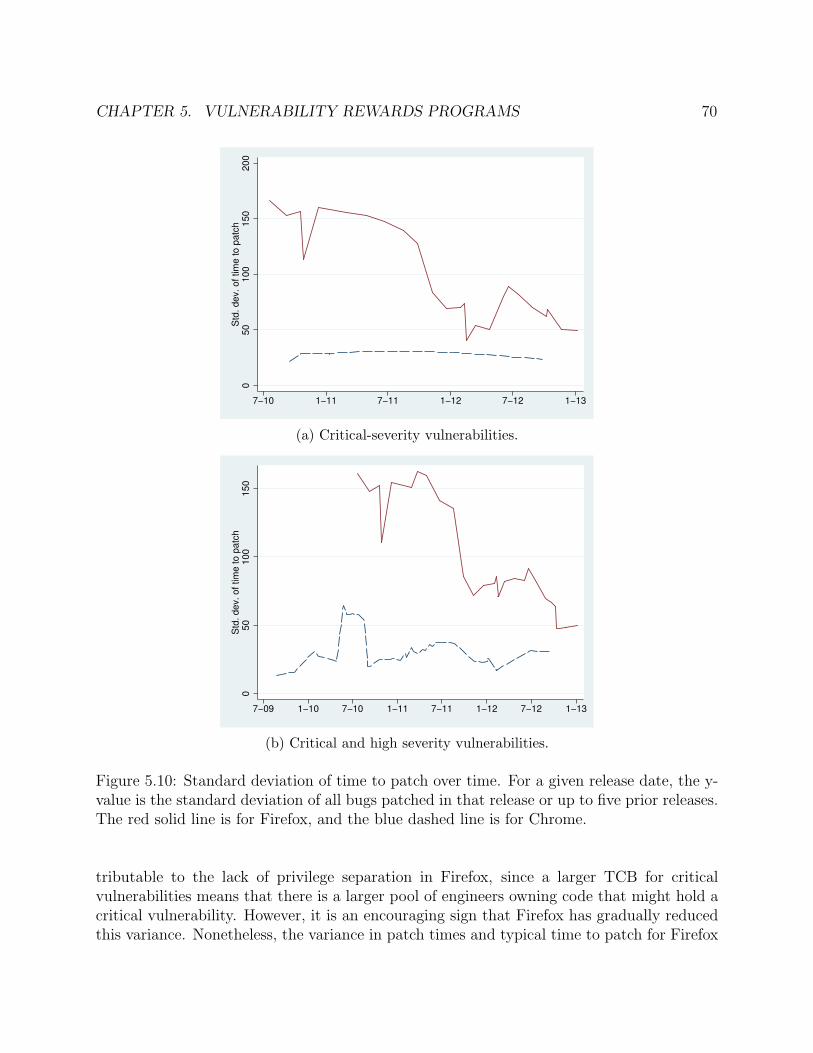
CHAPTER 5. VULNERABILITY REWARDS PROGRAMS 70
05
01
00
15
02
00
Std
. d
ev.
of
tim
e t
o p
atc
h
7−10 1−11 7−11 1−12 7−12 1−13
(a) Critical-severity vulnerabilities.
05
01
00
15
0S
td.
de
v.
of
tim
e t
o p
atc
h
7−09 1−10 7−10 1−11 7−11 1−12 7−12 1−13
(b) Critical and high severity vulnerabilities.
Figure 5.10: Standard deviation of time to patch over time. For a given release date, the y-value is the standard deviation of all bugs patched in that release or up to five prior releases.The red solid line is for Firefox, and the blue dashed line is for Chrome.
tributable to the lack of privilege separation in Firefox, since a larger TCB for criticalvulnerabilities means that there is a larger pool of engineers owning code that might hold acritical vulnerability. However, it is an encouraging sign that Firefox has gradually reducedthis variance. Nonetheless, the variance in patch times and typical time to patch for Firefox
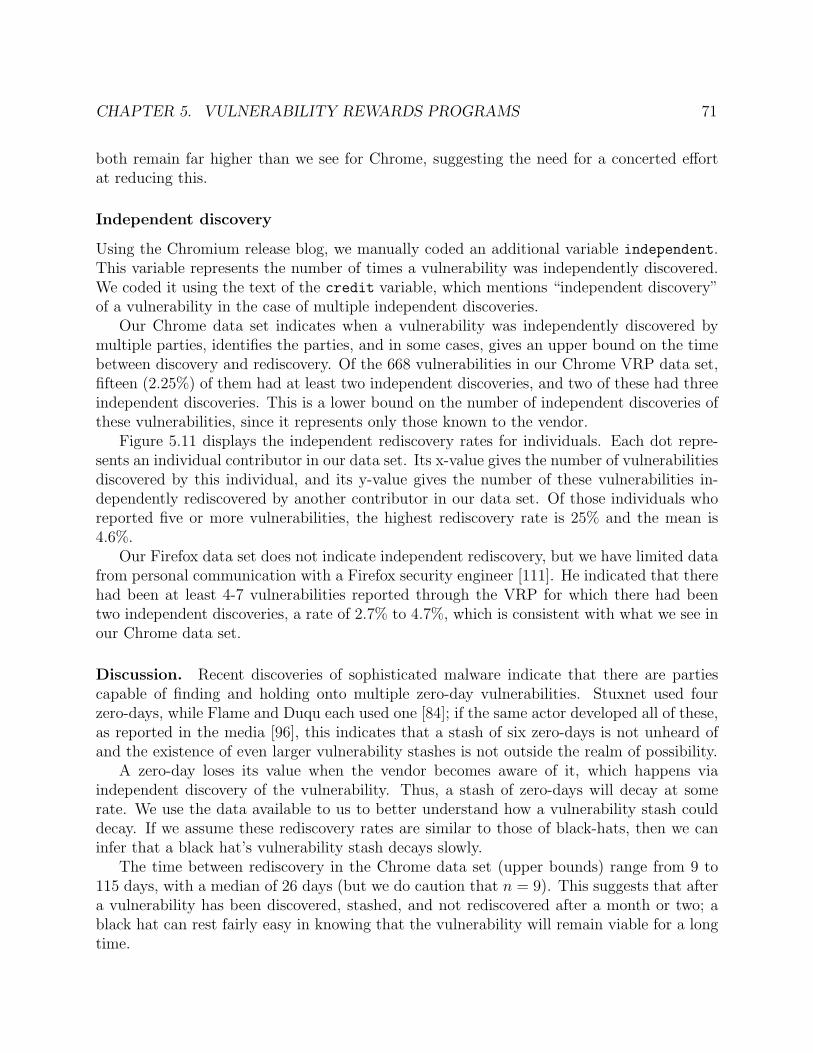
CHAPTER 5. VULNERABILITY REWARDS PROGRAMS 71
both remain far higher than we see for Chrome, suggesting the need for a concerted effortat reducing this.
Independent discovery
Using the Chromium release blog, we manually coded an additional variable independent.This variable represents the number of times a vulnerability was independently discovered.We coded it using the text of the credit variable, which mentions “independent discovery”of a vulnerability in the case of multiple independent discoveries.
Our Chrome data set indicates when a vulnerability was independently discovered bymultiple parties, identifies the parties, and in some cases, gives an upper bound on the timebetween discovery and rediscovery. Of the 668 vulnerabilities in our Chrome VRP data set,fifteen (2.25%) of them had at least two independent discoveries, and two of these had threeindependent discoveries. This is a lower bound on the number of independent discoveries ofthese vulnerabilities, since it represents only those known to the vendor.
Figure 5.11 displays the independent rediscovery rates for individuals. Each dot repre-sents an individual contributor in our data set. Its x-value gives the number of vulnerabilitiesdiscovered by this individual, and its y-value gives the number of these vulnerabilities in-dependently rediscovered by another contributor in our data set. Of those individuals whoreported five or more vulnerabilities, the highest rediscovery rate is 25% and the mean is4.6%.
Our Firefox data set does not indicate independent rediscovery, but we have limited datafrom personal communication with a Firefox security engineer [111]. He indicated that therehad been at least 4-7 vulnerabilities reported through the VRP for which there had beentwo independent discoveries, a rate of 2.7% to 4.7%, which is consistent with what we see inour Chrome data set.
Discussion. Recent discoveries of sophisticated malware indicate that there are partiescapable of finding and holding onto multiple zero-day vulnerabilities. Stuxnet used fourzero-days, while Flame and Duqu each used one [84]; if the same actor developed all of these,as reported in the media [96], this indicates that a stash of six zero-days is not unheard ofand the existence of even larger vulnerability stashes is not outside the realm of possibility.
A zero-day loses its value when the vendor becomes aware of it, which happens viaindependent discovery of the vulnerability. Thus, a stash of zero-days will decay at somerate. We use the data available to us to better understand how a vulnerability stash coulddecay. If we assume these rediscovery rates are similar to those of black-hats, then we caninfer that a black hat’s vulnerability stash decays slowly.
The time between rediscovery in the Chrome data set (upper bounds) range from 9 to115 days, with a median of 26 days (but we do caution that n = 9). This suggests that aftera vulnerability has been discovered, stashed, and not rediscovered after a month or two; ablack hat can rest fairly easy in knowing that the vulnerability will remain viable for a longtime.
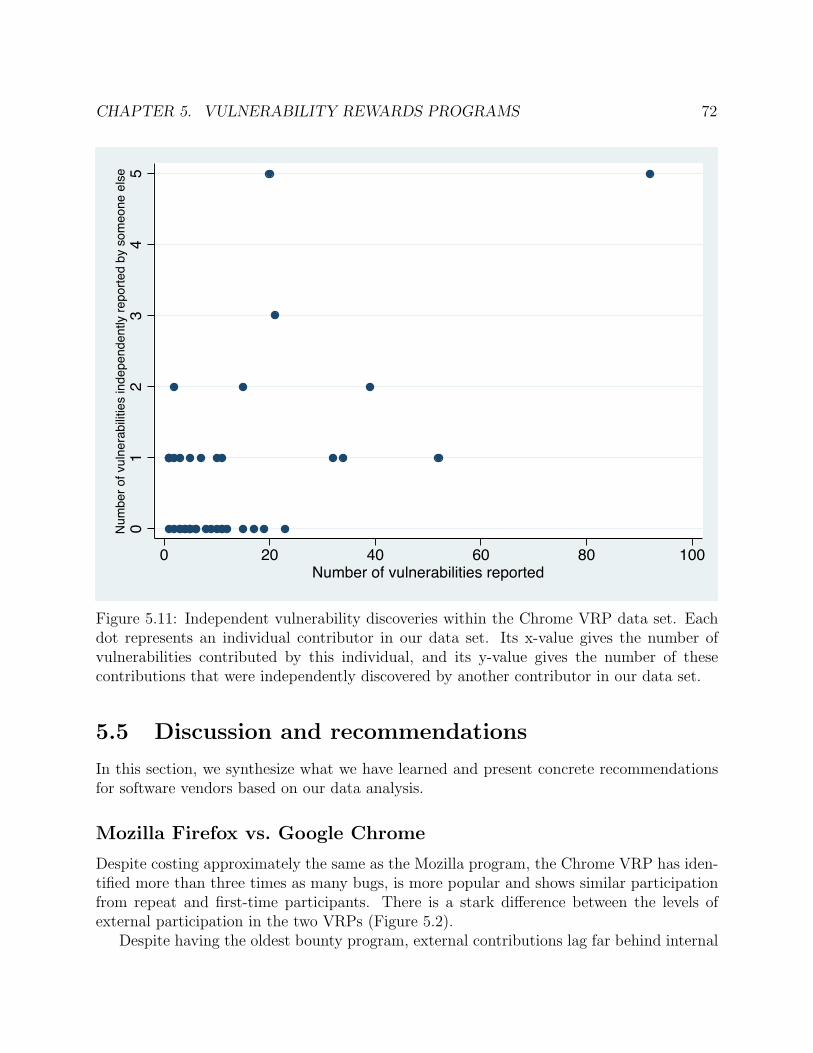
CHAPTER 5. VULNERABILITY REWARDS PROGRAMS 72
01
23
45
Num
ber
of vu
lnera
bili
ties independently r
eport
ed b
y s
om
eone e
lse
0 20 40 60 80 100Number of vulnerabilities reported
Figure 5.11: Independent vulnerability discoveries within the Chrome VRP data set. Eachdot represents an individual contributor in our data set. Its x-value gives the number ofvulnerabilities contributed by this individual, and its y-value gives the number of thesecontributions that were independently discovered by another contributor in our data set.
5.5 Discussion and recommendations
In this section, we synthesize what we have learned and present concrete recommendationsfor software vendors based on our data analysis.
Mozilla Firefox vs. Google Chrome
Despite costing approximately the same as the Mozilla program, the Chrome VRP has iden-tified more than three times as many bugs, is more popular and shows similar participationfrom repeat and first-time participants. There is a stark difference between the levels ofexternal participation in the two VRPs (Figure 5.2).
Despite having the oldest bounty program, external contributions lag far behind internal
CHAPTER 5. VULNERABILITY REWARDS PROGRAMS 73
contributions to Firefox’s security advisories. In contrast, external contributions to Chrome’ssecurity advisories closely rival internal contributions. Investigating further, we find threekey differences between the two programs:
Tiered structure with large special rewards. Mozilla’s program has a fixed payout of$3,000, which is approximately equal to the normal maximum payout for Chrome ($3,1337).Nonetheless, Chrome’s tiered structure, with even higher payouts (e.g., $10,000) possible forclever bugs and special cases appears to be far more effective in encouraging participation.This makes sense with an understanding of incentives in lotteries: the larger the potentialprize amount, the more willing participants are to accept a lower expected return, which,for VRPs, means the program can expect more participants [34].
Time to patch. We see a far higher variance in the time-to-release-patch metric for criticalvulnerabilities in Mozilla Firefox. It is generally accepted that the viability of responsibledisclosure depends on a reasonable vendor response time [16]. Thus, the high variance inMozilla’s response time could affect responsible disclosure through the VRP.
Higher profile. Chrome’s VRP has a higher profile, with annual competitions like Pwniumproviding particularly high rewards (up to $60,000). Chrome authors also provide extrareward top-ups for “interesting” bugs. We believe this sort of “gamification” leads to ahigher profile for the Chrome VRP, which may help encourage participation, particularlyfrom researchers interested in wider recognition.
Our methodology does not provide insight into the motivations of security researchers andthe impact of VRP designs on the same—a topic we leave for future work. Nevertheless, wehypothesize that these three factors combined explain the disparity in participation betweenthe Firefox and Chrome VRPs. Accordingly, we recommend Mozilla change their rewardstructure to a tiered system like that of Chrome. We urge Mozilla to do whatever it takes tocontinue to reduce the variance in time to release a patch for critical vulnerabilities, thoughwe also realize the difficulty involved in doing so. Mozilla may consider holding its ownannual competitions or otherwise increasing the PR surrounding its VRP.
Recommendations for vendors
Our study of the Chrome and Firefox VRPs yield a number of observations that we believecan guide vendors interested in launching or evolving their own VRPs.
We find that VRPs appear to provide an economically efficient mechanism for findingvulnerabilities, with a reasonable cost/benefit trade-off (Section 5.4). In particular, theyappear to be 2-100 times more cost-effective than hiring expert security researchers to findvulnerabilities. We therefore recommend that more vendors consider using them to their(and their users’) advantage. The cost/benefit trade-off may vary for other types of (i.e.,non-browser) software vendors; in particular, the less costly a security incident is for a vendor,
CHAPTER 5. VULNERABILITY REWARDS PROGRAMS 74
the less useful we can expect a VRP to be. Additionally, we expect that the higher-profilethe software project is (among developers and security researchers), the more effective aVRP will be.
Response time, especially for critical vulnerabilities, is important. (Section 5.4). Highvariance in time-to-patch is not appreciated by the security community. It can reasonably beexpected to reduce participation because it makes responsible disclosure through the VRPa less attractive option than the other options available to security researchers.
VRP incentive design is important and should be carefully considered. Chrome’s tieredincentive structure appears more effective at encouraging community participation than Fire-fox’s fixed-amount incentive structure (Section 5.4). Additionally, both Chrome and Firefoxhave increased their rewards over time. Doing so increases publicity, entices participants,and signals that a vendor is betting that their product has become more secure over time.
Our analysis demonstrates the impact of privilege separation on the Chrome VRP (Sec-tion 5.4). Privilege separation also provides flexibility to the Chrome team. For example,a simple way for Chrome to cut costs while still increasing participation could be to reducereward amounts for high-severity vulnerabilities and increase reward amounts for critical-severity vulnerabilities. Mozilla does not have this flexibility. Vendors should consider usingtheir security architecture to their advantage.
5.6 Conclusion and future work
We examined the characteristics of successful vulnerability rewards programs (VRPs) bystudying two successful, well-known VRPs. Both programs appear economically efficient,comparing favorably to the cost of hiring full-time security researchers. The Chrome VRPfeatures low expected payouts accompanied by high potential payouts, a strategy that ap-pears to be effective in engaging a broad community of vulnerability researchers.
We hope that our study of these two VRPs serves as a valuable reference for softwarevendors aiming to evolve an existing VRP or start a new one. Potential future work onunderstanding VRPs includes economic modeling of VRPs; identifying typical patterns, tra-jectories, or phases in a VRP; and studying failed or unsuccessful VRPs to get a better senseof possible pitfalls in VRP development. Gathering and analyzing data from more VRPswill surely paint a more complete picture of their potential costs and benefits.
Acknowledgments
Thanks to my co-authors of this work, Devdatta Akhawe, and David Wagner, for workingwith me and giving their permission for this work to appear in this thesis.
75
Chapter 6
Conclusion
We have performed three empirical studies, each of which has enhanced our understandingof the effectiveness of some tool or technique intended to improve software security.
In Chapter 3, we analyzed a set of 9 implementations of the same web application tolook for security differences associated with programming language, framework, and methodof finding vulnerabilities. Our study suggested that the level of framework support availablefor avoiding certain classes of vulnerabilities does appear to have an impact on applicationsecurity. We also found evidence that even the best manual framework support will continueto fall short, and therefore continued research effort should focus on automated frameworkdefenses against security vulnerabilities. Manual code review found more vulnerabilities thanblack-box testing, but combining the two techniques was more effective than using eitherone by itself.
In Chapter 4, we designed and executed an empirical study to ask questions about theeffectiveness of manual source code review for security. 30 subjects analyzed a web appli-cation with known vulnerabilities and delivered vulnerability reports to us, along with apost-completion survey regarding their level of experience and education. None of the fac-tors on our survey were correlated with reviewer effectiveness on the code review. Overalleffectiveness of the code reviewers was low: twenty percent found no vulnerabilities, andno reviewer found more than 5 of the 7 known vulnerabilities. There was significant vari-ation amongst the reviewers, with 6 subjects delivering all or almost all false positives and8 subjects delivering all or mostly all true positives. Our simulation based on our data setrevealed that a random set of 10 reviewers had approximately an 80% chance of finding allvulnerabilities, 15 reviewers had approximately a 95% chance of finding all vulnerabilities,and hiring more than 20 reviewers would almost certainly be a waste of money.
In Chapter 5, we gathered and analyzed data from two well-known vulnerability rewardsprograms: those of Google Chrome and Mozilla Firefox. Our analysis revealed that bothprograms appear economically efficient, comparing favorably to the cost of hiring full-timesecurity researchers. Both programs have successfully encouraged broad community par-ticipation, with both a steady stream of first-time contributors and repeat contributors.Chrome’s program has uncovered more than three times as many vulnerabilities as that of
CHAPTER 6. CONCLUSION 76
Firefox despite having a remarkably similar total cost. Chrome’s average time to patch crit-ical vulnerabilities (as well as the variance) is lower than that of Firefox. We hypothesizethat Chrome has seen more benefit from its VRP as compared to that of Firefox due to thesedifferences in time-to-patch and rewards structure.
In addition to achieving our broad goal of demonstrating that empirical techniques areuseful toward improving our understanding of various tools, we have:
• Developed methodologies for testing the security implications of various software de-velopment and vulnerability remediation techniques. We developed three differentexperimental methodologies over the course of our three studies, each of which can bere-used or extended for future studies.
• Supplemented opinions, recommendations, anecdotes, and “best practices” with em-pirical evidence that some technique tends to yield more secure software than someother technique.
• Improved the state of software security by providing actionable recommendations re-garding which tools or techniques to choose. Our three studies can serve as referencesfor software developers or software vendors choosing which tools to use to prevent orfind vulnerabilities in their software.
77
Appendix A
Demographic and Other Factors inCode Review Study
We tested the following demographic and other factors for correlation with number of cor-rectly reported vulnerabilities. None were statistically significant.
• Self-reported level of understanding of the web application
• Percentage of vulnerabilities the developer thought they identified
• Years of experience in software development
• Years of experience in web development
• Years of experience in computer security
• Developer’s confidence in the review
• The number of security reviews previously conducted by the developer
• The number of web security reviews previously conducted by the developer
• Self-reported level of expertise on computer security
• Self-reported level of expertise on software development
• Self-reported level of expertise on web development
• Self-reported level of expertise on web security
• Education
• Number of security-related certifications

78
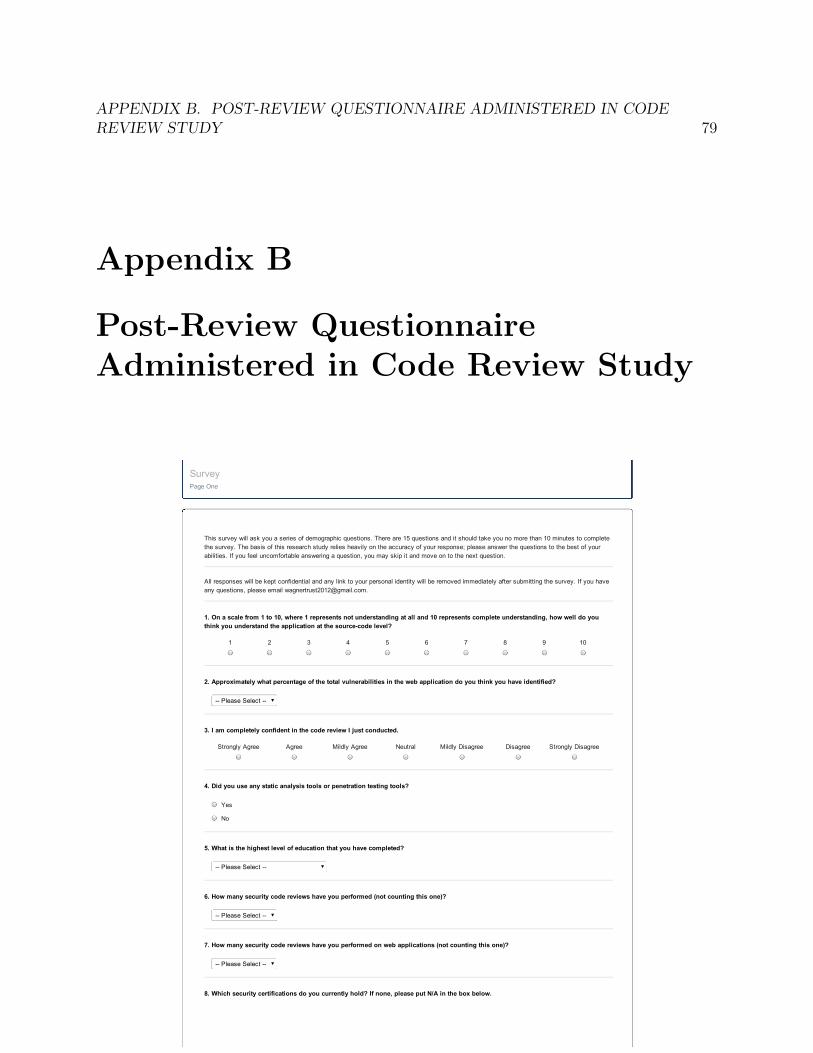
APPENDIX B. POST-REVIEW QUESTIONNAIRE ADMINISTERED IN CODEREVIEW STUDY 79
Appendix B
Post-Review QuestionnaireAdministered in Code Review Study
SurveyPage One
This survey will ask you a series of demographic questions. There are 15 questions and it should take you no more than 10 minutes to completethe survey. The basis of this research study relies heavily on the accuracy of your response; please answer the questions to the best of yourabilities. If you feel uncomfortable answering a question, you may skip it and move on to the next question.
All responses will be kept confidential and any link to your personal identity will be removed immediately after submitting the survey. If you haveany questions, please email [email protected].
1 2 3 4 5 6 7 8 9 10
Please Select
Strongly Agree Agree Mildly Agree Neutral Mildly Disagree Disagree Strongly Disagree
Please Select
Please Select
Please Select
1. On a scale from 1 to 10, where 1 represents not understanding at all and 10 represents complete understanding, how well do youthink you understand the application at the sourcecode level?
2. Approximately what percentage of the total vulnerabilities in the web application do you think you have identified?
3. I am completely confident in the code review I just conducted.
4. Did you use any static analysis tools or penetration testing tools?
Yes
No
5. What is the highest level of education that you have completed?
6. How many security code reviews have you performed (not counting this one)?
7. How many security code reviews have you performed on web applications (not counting this one)?
8. Which security certifications do you currently hold? If none, please put N/A in the box below.
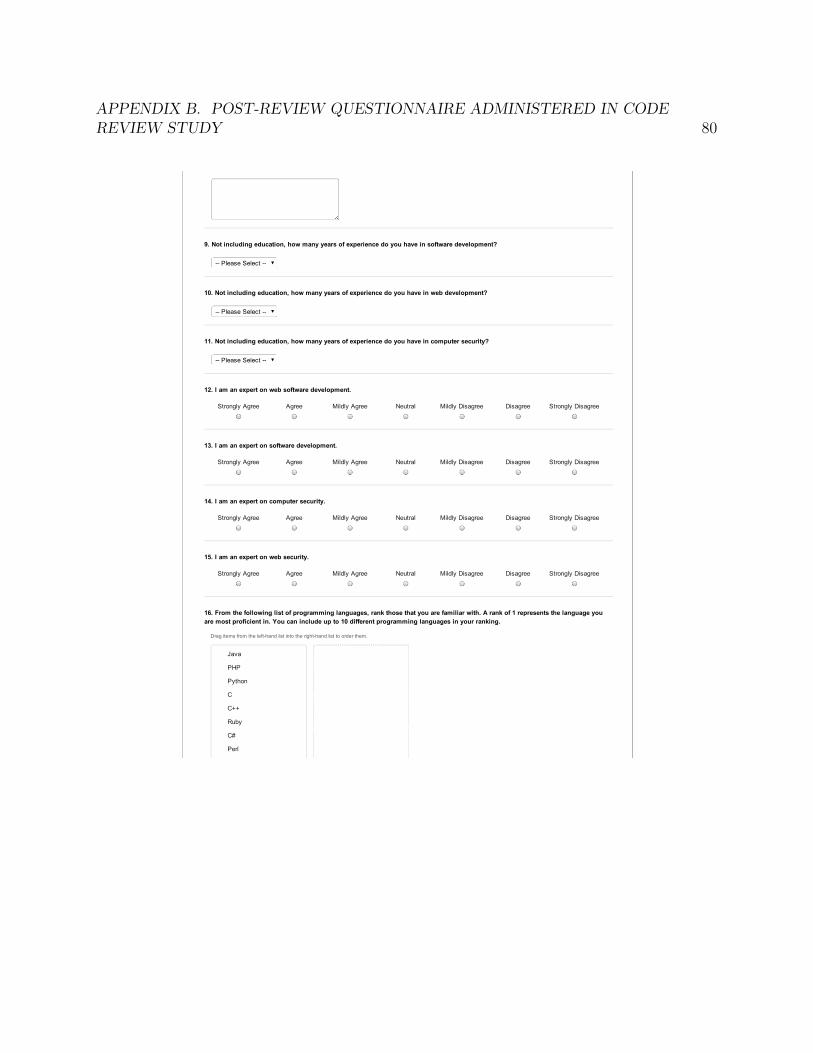
APPENDIX B. POST-REVIEW QUESTIONNAIRE ADMINISTERED IN CODEREVIEW STUDY 80
Please Select
Please Select
Please Select
Strongly Agree Agree Mildly Agree Neutral Mildly Disagree Disagree Strongly Disagree
Strongly Agree Agree Mildly Agree Neutral Mildly Disagree Disagree Strongly Disagree
Strongly Agree Agree Mildly Agree Neutral Mildly Disagree Disagree Strongly Disagree
Strongly Agree Agree Mildly Agree Neutral Mildly Disagree Disagree Strongly Disagree
Drag items from the lefthand list into the righthand list to order them.
9. Not including education, how many years of experience do you have in software development?
10. Not including education, how many years of experience do you have in web development?
11. Not including education, how many years of experience do you have in computer security?
12. I am an expert on web software development.
13. I am an expert on software development.
14. I am an expert on computer security.
15. I am an expert on web security.
16. From the following list of programming languages, rank those that you are familiar with. A rank of 1 represents the language youare most proficient in. You can include up to 10 different programming languages in your ranking.
Java
PHP
Python
C
C++
Ruby
C#
Perl
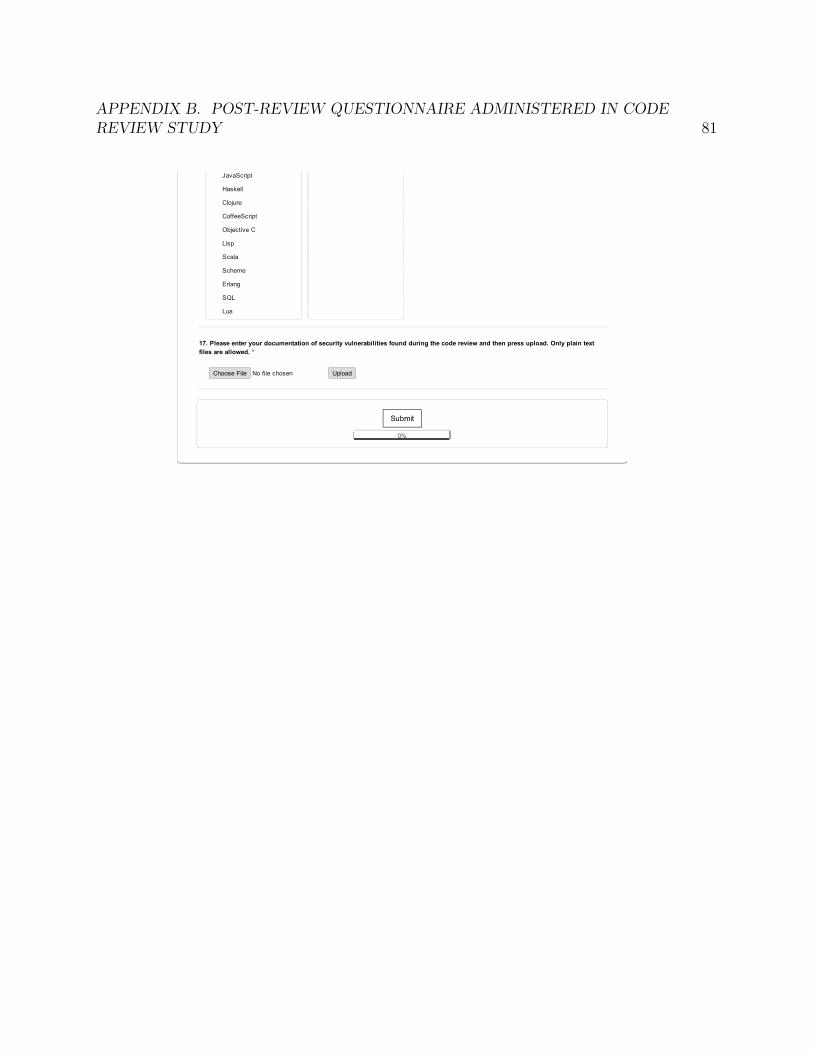
APPENDIX B. POST-REVIEW QUESTIONNAIRE ADMINISTERED IN CODEREVIEW STUDY 81
Submit
JavaScript
Haskell
Clojure
CoffeeScript
Objective C
Lisp
Scala
Scheme
Erlang
SQL
Lua
17. Please enter your documentation of security vulnerabilities found during the code review and then press upload. Only plain textfiles are allowed. *
No file chosenChoose File Upload
0%
82
Bibliography
[1] Chrome Releases: Stable Updates. http://googlechromereleases.blogspot.com/
search/label/Stable%20updates.
[2] Chromium Development Calendar and Release Info. http://www.chromium.org/
developers/calendar.
[3] CodeIgniter User Guide Version 1.7.3: Input Class. http://codeigniter.com/user_guide/libraries/input.html.
[4] Defense in Depth. http://www.nsa.gov/ia/_files/support/defenseindepth.pdf.
[5] django: Built-in template tags and filters. http://docs.djangoproject.com/en/
dev/ref/templates/builtins.
[6] git. http://git-scm.com/.
[7] google-ctemplate. http://code.google.com/p/google-ctemplate/.
[8] National Vulnerability Database. http://nvd.nist.gov/.
[9] perl.org glossary. http://faq.perl.org/glossary.html#TMTOWTDI.
[10] Secunia Vulnerability Coordination Reward Program (SVCRP). https://secunia.
com/community/research/svcrp/.
[11] Severity Guidelines for Security Issues. https://sites.google.com/a/chromium.
org/dev/developers/severity-guidelines.
[12] Understanding Operational Security. http://www.cisco.com/web/about/security/intelligence/opsecurity.html.
[13] Creating a Computer Security Incident Response Team: A Process for Getting Started,February 2006. https://www.cert.org/csirts/Creating-A-CSIRT.html.
[14] Vulnerability Remediation, September 2010. https://www.cert.org/vuls/
remediation.html.
BIBLIOGRAPHY 83
[15] MozillaWiki: Electrolysis, April 2011. https://wiki.mozilla.org/Electrolysis.
[16] CERT/CC Vulnerability Disclosure Policy, November 2012. https://www.cert.org/kb/vul_disclosure.html.
[17] Developer’s Guide – SafeHtml, October 2012. https://developers.google.com/
web-toolkit/doc/latest/DevGuideSecuritySafeHtml.
[18] Security: Pwnium 2 tcmalloc profile bug, 2012. http://crbug.com/154983.
[19] Bugzilla, February 2013. http://www.bugzilla.org/.
[20] Chromium Bug Tracker, 2013. http://crbug.com.
[21] Chromium bug tracker: Sandbox bypasses found in review, 2013. http://goo.gl/
13ZlR.
[22] MozillaWiki: RapidRelease/Calendar, January 2013. https://wiki.mozilla.org/
RapidRelease/Calendar.
[23] oDesk at a Glance, April 2013. https://www.odesk.com/info/about/.
[24] The MEGA Vulnerability Reward Program, February 2013. https://mega.co.nz/
#blog_6.
[25] Update google chrome, 2013. https://support.google.com/chrome/bin/answer.
py?hl=en&answer=95414.
[26] Lucas Adamski. Refresh of the Mozilla Security Bug Bounty Program, July 2010.https://blog.mozilla.org/security/2010/07/15/refresh/.
[27] Ozlem Albayrak and David Davenport. Impact of Maintainability Defects on CodeInspections. In Proceedings of the 2010 ACM-IEEE International Symposium on Em-pirical Software Engineering and Measurement, pages 50:1–50:4, 2010.
[28] Andrew Austin and Laurie Williams. One technique is not enough: A comparison ofvulnerability discovery techniques. In Empirical Software Engineering and Measure-ment (ESEM), 2011 International Symposium on, pages 97–106. IEEE, 2011.
[29] D. Baca, K. Petersen, B. Carlsson, and L. Lundberg. Static code analysis to detectsoftware security vulnerabilities—does experience matter? In Availability, Reliabilityand Security, 2009. International Conference on, pages 804–810. IEEE, 2009.
[30] Michael Barrett. PayPal “Bug Bounty” Program for Security Researchers, June 2012.https://www.thepaypalblog.com/2012/06/paypal-bug-bounty-program/.
[31] Adam Barth, Collin Jackson, Charles Reis, and The Google Chrome Team. TheSecurity Architecture of the Chromium Browser. Technical report, 2008.
BIBLIOGRAPHY 84
[32] V.R. Basili and R.W. Selby. Comparing the Effectiveness of Software Testing Strate-gies. IEEE Transactions on Software Engineering, SE-13(12):1278–1296, Dec 1987.
[33] Jason Bau, Elie Bursztein, Divij Gupta, and John Mitchell. State of the Art: Auto-mated Black-Box Web Application Vulnerability Testing. In 2010 IEEE Symposiumon Security and Privacy, pages 332–345, May 2010.
[34] Nalinaksha Bhattacharyya and Thomas A. Garrett. Why People Choose NegativeExpected Return Assets - An Empirical Examination of a Utility Theoretic Ex-planation. Federal Reserve Bank of St. Louis Working Paper Series, March 2006.http://research.stlouisfed.org/wp/2006/2006-014.pdf.
[35] S. Biffl. Analysis of the Impact of Reading Technique and Inspector Capability onIndividual Inspection Performance. In Proceedings of the Seventh Asia-Pacific SoftwareEngineering Conference (APSEC), pages 136–145, 2000.
[36] Matt Bishop. Computer Security: Art and Science. Addison-Wesley Professional,Boston, MA, 2003.
[37] Eusebiu Blindu. Vulnerabilities reward programs, July 2012. http://www.
testalways.com/2012/07/13/vulnerabilities-reward-programs/.
[38] Ken Buchanan, Chris Evans, Charlie Reis, and Tom Sepez. A Taleof Two Pwnies (Part 2), June 2012. http://blog.chromium.org/2012/06/
tale-of-two-pwnies-part-2.html.
[39] Ken Buchanan, Chris Evans, Charlie Reis, and Tom Sepez. Show off Your SecuritySkills: Pwn2Own and Pwnium 3, January 2013. http://blog.chromium.org/2013/01/show-off-your-security-skills-pwn2own.html.
[40] Luca Carettoni. “No More Free Bugs” Initiative, October 2011. http://blog.
nibblesec.org/2011/10/no-more-free-bugs-initiatives.html.
[41] Cagatay Catal and Banu Diri. A systematic review of software fault prediction studies.Expert Systems with Applications, 36(4):7346–7354, 2009.
[42] Jason Cohen. Best Kept Secrets of Peer Code Review, page 117. Smart Bear, Inc.,Austin, TX, 2006.
[43] Steve Coll. The rewards (and risks) of cyber war, June 2012. http://www.newyorker.com/online/blogs/comment/2012/06/the-rewards-and-risks-of-cyberwar.
html.
[44] Coverity. Coverity security advisor, 2013. http://www.coverity.com/products/
security-advisor.html.
BIBLIOGRAPHY 85
[45] Mark Curphey and Rudolph Araujo. Web application security assessment tools. IEEESecurity and Privacy, 4:32–41, 2006.
[46] Michael Dalton, Christos Kozyrakis, and Nickolai Zeldovich. Nemesis: Preventing au-thentication & access control vulnerabilities in web applications. In USENIX SecuritySymposium, pages 267–282. USENIX Association, 2009.
[47] Noopur Davis. Secure Software Development Life Cycle Processes, July 2012. https://buildsecurityin.us-cert.gov/bsi/articles/knowledge/sdlc/326-BSI.html.
[48] Django Software Foundation. Django, 2013. https://www.djangoproject.com/.
[49] Keith Donald, Erwin Vervaet, and Ross Stoyanchev. Spring Web Flow: Reference Doc-umentation, October 2007. http://static.springsource.org/spring-webflow/
docs/1.0.x/reference/index.html.
[50] A. Doupe, M. Cova, and G. Vigna. Why Johnny Can’t Pentest: An Analysis ofBlack-box Web Vulnerability Scanners. In Proceedings of the Conference on Detectionof Intrusions and Malware and Vulnerability Assessment (DIMVA), Bonn, Germany,July 2010.
[51] Venkatreddy Dwarampudi, Shahbaz Singh Dhillon, Jivitesh Shah, Nikhil Joseph Se-bastian, and Nitin Satyanarayan Kanigicharla. Comparative study of the Pros andCons of Programming languages: Java, Scala, C++, Haskell, VB.NET, AspectJ, Perl,Ruby, PHP & Scheme. http://arxiv.org/pdf/1008.3431.
[52] Anne Edmundson, Brian Holtkamp, Emanuel Rivera, Matthew Finifter, Adrian Met-tler, and David Wagner. An Empirical Study on the Effectiveness of Security CodeReview. In Proceedings of the International Symposium on Engineering Secure Soft-ware and Systems, March 2013.
[53] Chris Evans. Celebrating Six Months of Chromium Security Rewards, July 2010. http://blog.chromium.org/2010/07/celebrating-six-months-of-chromium.html.
[54] Chris Evans. Bug bounties vs. black (& grey) markets,May 2011. http://scarybeastsecurity.blogspot.com/2011/05/
bug-bounties-vs-black-grey-markets.html.
[55] Chris Evans. Personal Communication, March 2013.
[56] Chris Evans, Eric Grosse, Neel Mehta, Matt Moore, Tavis Ormandy, Julien Tinnes,Michal Zalewski, and Google Security Team. Rebooting Responsible Disclosure: afocus on protecting end users, July 2010. http://googleonlinesecurity.blogspot.com/2010/07/rebooting-responsible-disclosure-focus.html.
BIBLIOGRAPHY 86
[57] Chris Evans and Justin Schuh. Pwnium: rewards for exploits, February 2012. http:
//blog.chromium.org/2012/02/pwnium-rewards-for-exploits.html.
[58] M. E. Fagan. Design and Code Inspections to Reduce Errors in Program Development.IBM Systems Journal, 15(3):182–211, 1976.
[59] V. Felmetsger, L. Cavedon, C. Kruegel, and G. Vigna. Toward Automated Detectionof Logic Vulnerabilities in Web Applications. In Proceedings of the USENIX SecuritySymposium, Washington, DC, August 2010.
[60] A.L. Ferreira, R.J. Machado, L. Costa, J.G. Silva, R.F. Batista, and M.C. Paulk. AnApproach to Improving Software Inspections Performance. In 2010 IEEE InternationalConference on Software Maintenance (ICSM), pages 1–8, Sept 2010.
[61] Matthew Finifter, Devdatta Akhawe, and David Wagner. Chrome and Firefox VRPdatasets, February 2013. http://usenixsecurity13.weebly.com/.
[62] Matthew Finifter and David Wagner. Exploring the Relationship Between Web Appli-cation Development Tools and Security. In Proceedings of the 2nd USENIX Conferenceon Web Application Development. USENIX, June 2011.
[63] Dennis Fisher. Microsoft Says No to Paying Bug Bounties, July 2010. http:
//threatpost.com/microsoft-says-no-paying-bug-bounties-072210/.
[64] Brian Gorenc. Pwn2Own 2013, January 2013. http://dvlabs.tippingpoint.com/
blog/2013/01/17/pwn2own-2013.
[65] L. Hatton. Testing the Value of Checklists in Code Inspections. IEEE Software,25(4):82–88, July–Aug 2008.
[66] Les Hatton. Predicting the Total Number of Faults Using Par-allel Code Inspections. http://www.leshatton.org/2005/05/
total-number-of-faults-using-parallel-code-inspections/, May 2005.
[67] Chris Hofmann. Personal Communication, March 2013.
[68] Christian Holler. Trying new code analysis techniques, January 2012. https://blog.mozilla.org/decoder/2012/01/27/trying-new-code-analysis-techniques/.
[69] Yao-Wen Huang, Fang Yu, Christian Hang, Chung-Hung Tsai, Der-Tsai Lee, and Sy-Yen Kuo. Securing Web Application Code by Static Analysis and Runtime Protection.In Proceedings of the 13th International Conference on the World Wide Web, pages40–52, 2004.
[70] Jaspal. The best web development frameworks, June 2010. http://www.
webdesignish.com/the-best-web-development-frameworks.html.
BIBLIOGRAPHY 87
[71] C. Jones. Software Defect-Removal Efficiency. IEEE Computer, 29(4):94–95, Apr1996.
[72] N. Jovanovic, C. Kruegel, and E. Kirda. Pixy: A Static Analysis Tool for DetectingWeb Application Vulnerabilities. In IEEE Symposium on Security and Privacy, pages263–268, May 2006.
[73] Stefan Kals, Engin Kirda, Christopher Kruegel, and Nenad Jovanovic. SecuBat: AWeb Vulnerability Scanner. In Proceedings of the 15th International Conference onthe World Wide Web, pages 247–256, 2006.
[74] Sean Michael Kerner. HP Fortifies Security with Static and Dynamic Analy-sis, February 2010. http://www.developer.com/security/article.php/3866371/
HP-Fortifies-Security-with-Static-and-Dynamic-Analysis.htm.
[75] A. Kieyzun, P.J. Guo, K. Jayaraman, and M.D. Ernst. Automatic Creation of SQLInjection and Cross-Site Scripting Attacks. In 31st IEEE International Conference onSoftware Engineering, pages 199–209, May 2009.
[76] Brian Krebs. Tagging and tracking espionage botnets, July 2012. https://
krebsonsecurity.com/2012/07/tagging-and-tracking-espionage-botnets/.
[77] Brian Krebs. Crimeware author funds exploit buyingspree, January 2013. https://krebsonsecurity.com/2013/01/
crimeware-author-funds-exploit-buying-spree/.
[78] Monica S. Lam, Michael Martin, Benjamin Livshits, and John Whaley. Securing WebApplications With Static and Dynamic Information Flow Tracking. In Proceedingsof the 2008 ACM SIGPLAN Symposium on Partial Evaluation and Semantics-BasedProgram Manipulation, pages 3–12, 2008.
[79] P. McCarthy, A. Porter, H. Siy, and Jr. Votta, L.G. An Experiment to Assess Cost-Benefits of Inspection Meetings and Their Alternatives: A Pilot Study. In Proceedingsof the 3rd International Software Metrics Symposium, pages 100–111, Mar 1996.
[80] Gary McGraw and Bruce Potter. Software security testing. IEEE Security and Privacy,2:81–85, 2004.
[81] Ian Melven. MozillaWiki: Features/Security/Low rights Firefox, August 2012. https://wiki.mozilla.org/Features/Security/Low_rights_Firefox.
[82] Andrew Meneely and Laurie Williams. Secure Open Source Collaboration: an Empir-ical Study of Linus’ Law. In Proceedings of the 16th ACM conference on Computerand communications security, pages 453–462. ACM, 2009.
BIBLIOGRAPHY 88
[83] Andrew Meneely and Laurie Williams. Strengthening the Empirical Analysis of theRelationship Between Linus’ Law and Software Security. In Proceedings of the 2010ACM-IEEE International Symposium on Empirical Software Engineering and Mea-surement, page 9. ACM, 2010.
[84] Bill Miller and Dale Rowe. A survey of scada and critical infrastructure incidents. InProceedings of the 1st Annual conference on Research in information technology, RIIT’12, pages 51–56, New York, NY, USA, 2012. ACM.
[85] Charles Miller. The legitimate vulnerability market: the secretive world of 0-dayexploit sales. In WEIS, 2007.
[86] Todd C. Miller and Theo de Raadt. strlcpy and strlcat - consistent, safe, string copyand concatenation. http://www.courtesan.com/todd/papers/strlcpy.html.
[87] Elinor Mills. Facebook launches bug bounty program, July 2011. http://news.cnet.com/8301-27080\_3-20085163-245/facebook-launches-bug-bounty-program/.
[88] Mozilla Foundation. Mozilla Foundation Security Advisories, January 2013. https:
//www.mozilla.org/security/announce/.
[89] Liam Murchu. Stuxnet using three additional zero-day vulnerabil-ities, September 2010. http://www.symantec.com/connect/blogs/
stuxnet-using-three-additional-zero-day-vulnerabilities.
[90] Atif Mushtaq. Man in the browser, February 2010. http://www.fireeye.com/blog/technical/malware-research/2010/02/man-in-the-browser.html.
[91] Stephan Neuhaus and Bernhard Plattner. Software security economics: Theory, inpractice. In WEIS, 2012.
[92] Stephan Neuhaus, Thomas Zimmermann, Christian Holler, and Andreas Zeller. Pre-dicting vulnerable software components. In Proceedings of the 14th ACM conferenceon Computer and communications security, pages 529–540. ACM, 2007.
[93] Jorge Lucangeli Obes and Justin Schuh. A Tale of Two Pwnies (Part 1), May 2012.http://blog.chromium.org/2012/05/tale-of-two-pwnies-part-1.html.
[94] OWASP Foundation. Code Review Metrics. https://www.owasp.org/index.php/
Code_Review_Metrics, 2010.
[95] Andy Ozment and Stuart E. Schechter. Milk or wine: does software security improvewith age. In In USENIX-SS06: Proceedings of the 15th conference on USENIX SecuritySymposium. USENIX Association, 2006.
BIBLIOGRAPHY 89
[96] Nicole Perlroth. Researchers Find Clues in Malware, May2012. http://www.nytimes.com/2012/05/31/technology/
researchers-link-flame-virus-to-stuxnet-and-duqu.html.
[97] Tim Peters. PEP 20 – The Zen of Python. http://www.python.org/dev/peps/
pep-0020/.
[98] PortSwigger Ltd. Burp Suite Professional. http://www.portswigger.net/burp/
editions.html.
[99] Lutz Prechelt. Plat Forms 2007 task: PbT. Technical Report TR-B-07-10, FreieUniversitat Berlin, Institut fur Informatik, Germany, January 2007.
[100] Lutz Prechelt. Plat Forms: A Web Development Platform Comparison by an Ex-ploratory Experiment Searching for Emergent Platform Properties. IEEE Transactionson Software Engineering, 99, 2010.
[101] Eric S. Raymond. The Cathedral and the Bazaar. O’Reilly & Associates, Inc., Se-bastopol, CA, USA, 1st edition, 1999.
[102] Eric Rescorla. Is finding security holes a good idea? IEEE Security & Privacy,3(1):14–19, 2005.
[103] W. Robertson and G. Vigna. Static Enforcement of Web Application Integrity ThroughStrong Typing. In Proceedings of the USENIX Security Symposium, Montreal, Canada,August 2009.
[104] Theodoor Scholte, Davide Balzarotti, and Engin Kirda. Quo vadis? a study of the evo-lution of input validation vulnerabilities in web applications. Financial Cryptographyand Data Security, pages 284–298, 2012.
[105] Umesh Shankar, Kunal Talwar, Jeffrey S. Foster, and David Wagner. Detecting For-mat String Vulnerabilities with Type Qualifiers. In Proceedings of the 10th USENIXSecurity Symposium, pages 201–220, 2001.
[106] Yonghee Shin and Laurie Williams. Is complexity really the enemy of software security?In Proceedings of the 4th ACM workshop on Quality of protection, pages 47–50. ACM,2008.
[107] Larry Suto. Analyzing the Accuracy and Time Costs of Web Application Security Scan-ners, February 2010. http://www.ntobjectives.com/files/Accuracy_and_Time_
Costs_of_Web_App_Scanners.pdf.
[108] The Chromium Authors. Vulnerability Rewards Program: Rewards FAQ, 2010. http://goo.gl/m1MdV.
BIBLIOGRAPHY 90
[109] Florian Thiel. Personal Communication, November 2009.
[110] TopSite. 10 Best Outsourcing Websites. http://www.topsite.com/best/
outsourcing.
[111] Dan Veditz. Personal Communication, February 2013.
[112] Stefan Wagner, Jan Jrjens, Claudia Koller, Peter Trischberger, and Technische Uni-versitt Mnchen. Comparing bug finding tools with reviews and tests. In Proceedings ofthe 17th International Conference on Testing of Communicating Systems (TestCom05),volume 3502 of LNCS, pages 40–55. Springer, 2005.
[113] James Walden, Maureen Doyle, Robert Lenhof, and John Murray. Java vs. PHP: Se-curity Implications of Language Choice for Web Applications. In International Sym-posium on Engineering Secure Software and Systems (ESSoS), February 2010.
[114] G. Wassermann and Z. Su. Sound and Precise Analysis of Web Applications for In-jection Vulnerabilities. In Proceedings of the 2007 ACM SIGPLAN Conference onProgramming Language Design and Implementation, pages 32–41, June 2007.
[115] WhiteHat Security. WhiteHat Website Security Statistic Report: 9th Edition, May2010. http://www.whitehatsec.com/home/resource/stats.html.
[116] Thomas Zimmermann, Nachiappan Nagappan, and Laurie Williams. Searching for aneedle in a haystack: Predicting security vulnerabilities for windows vista. In SoftwareTesting, Verification and Validation (ICST), 2010 Third International Conference on,pages 421–428. IEEE, 2010.