Embed Size (px)
Citation preview

Towards Net Zero in freight transport
Key information, perspectives and practical guidance
Made possible by a donation from
August 2021

2
The writing team from UCL was composed of Dr Olivier Dessens and Dr Catherine Willan.
We would like to acknowledge the HSBC advisory team of Michaela Wright, Matthew Swain, Robert King, Andrew Asquith, Charles Garfit and Caroline Bourne.
We are grateful to the interviewees from the di�erent freight, transport and logistic companies: Keith Broom (Group Finance Director, Suttons Group), Klare Chamberlain (Environmental Manager, CalMac Ferries Ltd), Carl Hanson (Group Asset Director, Wincanton plc), Peter Harris (Vice President International Sustainability, UPS) and Justin Laney (General Manager – Fleet, John Lewis Partnership) for their time and shared insight.
Thank you also to Professor Paul Ekins and the administrative sta� at UCL Institute for Sustainable Resources.
For any questions about the report, please contact Dr Olivier Dessens, [email protected] or Professor Paul Ekins, [email protected]
Authors and acknowledgements

3
Authors and Acknowledgements 2
Table of Contents 3
Abbreviations 4
Foreword from Professor Paul Ekins 5
Executive Summary 6
1. Introduction 8
2. Overview of freight sector demand and GHG emissions 10
2.1 At a global level 10
2.2 The UK freight sector 12
3. Forecast future freight demand 14
3.1 At a global level 14
3.2 Forecast for the UK 16
4. Current regulatory drivers and mechanisms for the transport sector in relation to climate mitigation 17
4.1 Introduction to the Paris Agreement 17
4.2 Explicit policies for long-distance international transport 17
4.3 UK specific legislation regarding climate change 18
4.4 Implications of UK climate change legislation for road freight transport 20
5. Toward zero emissions in the freight sector: Technological fuel choices in logistics 22
5.1 At a global level 22
5.2 At a UK level 26
6. Toward zero emissions in the freight sector: Non technological improvements towards higher e�ciency in logistics 30
6.1 At a global level 30
6.2 At a UK level 30
7. Specific Insights from the interviews: Views from UK transport businesses 33
7.1 Businesses feel that the climate change agenda is shifting rapidly 33
7.2 Changing what you control is the obvious starting point 34
7.3 There are distinctive technology pathways depending on the nature of the fleet, and stable policy support will be vital 34
7.4 Savings can be made now from low-carbon changes, but longer-term options present a di�erent case 36
Contents
7.5 Businesses need to be ready to forge new partnerships and consider implications for current operational models 36
7.6 There is great potential upside from net zero – but the case for a first-mover advantage is not yet clear for every business 37
7.7 Concluding remarks on the commercial realities of a low carbon transport industry 38
8. Conclusion 39
9. References 42
9.1 Section 1 references 42
9.2 Section 2 references 42
9.3 Section 3 references 42
9.4 Section 4 references 42
9.5 Section 5 references 42
9.6 Section 6 references 43
9.7 Section 7 references 43
10. ANNEX 1: The Paris Agreement on Climate Change 44
10.1 Annex 1 references 45
10. ANNEX 2: Businesses and interviewees’ information 46

4
BEV Battery Electric Vehicle
CCC Climate Change Committee
COP Conference of the Parties
EV Electric Vehicle
GDP Gross Domestic Product
GHG Green House Gas
HGV Heavy Goods Vehicle.
ICAO International Civil Aviation Organisation
ICE Internal Combustion Engine
IMO International Maritime Organisation
IPCC Intergovernmental Panel on Climate Change
ITF International Transport Forum (ITF is an intergovernmental organisation administratively integrated with the OECD)
KPI Key Performance Indicator
LCCC Levelised Cost of Conserved Carbon
LCV Light Commercial Vehicle
LNG Liquefied Natural Gas
LPG Liquefied Petroleum Gas
MEPC Marine Environment Protection Committee (IMO)
MtCO2 Million tonnes carbon dioxide
NDC Nationally Determined Contributions
OECD Organisation for Economic Co-operation and Development
OEM Original Equipment Manufacturers
PHEV Plug-In Hybrid Electric Vehicle
R&D Research and Development
RTK Revenue-Tonne Kilometer
Abbreviations

5
Freight transport is generally perceived to be among the most di¥cult economic activities to decarbonise. The option that is now the front runner for passenger vehicles – electric drive trains powered by batteries – is of much less general application to aircraft, heavy lorries, or large ships, because of weight, power density, power, range, size, or a combination of all these characteristics.
But there are options for freight decarbonisation, as this report makes clear. Just as importantly, there are freight businesses that are keen to experiment with these options, and implement them to the extent possible within a global and highly competitive market.
These businesses are constrained by the fact that the options are still relatively undeveloped commercially. They are therefore still quite expensive.
In some cases they require infrastructure that has not yet been put in place. And governments or, in the case of shipping and aviation, international organisations have not yet put in place the measures and incentives that will allow businesses that want to radically decarbonise their operations to do so without excessive competitive disadvantage.
That needs to change, if governments anywhere, or freight businesses, are to come anywhere near achieving the ‘net zero’ emissions to which they are increasingly committed by mid-century, especially given the high rates of growth of global and UK freight that are projected through to 2050. The UN agencies for aviation and shipping, ICAO (International Civil Aviation Organisation) and IMO (International Maritime Organisation), that have been given responsibility for reducing the emissions from these sectors, need to greatly increase the ambition of the measures they are proposing.
There is still considerable uncertainty as to which of the several technological possibilities for decarbonising freight road transport will eventually become the commercial front-runner, or whether a range of technologies will get established in the market.
This calls for both substantial public budgets for research and development and demonstration projects at commercial scale that allow for cost reductions as operating experience is acquired, along the lines of those experienced with o�shore wind generation.
The core message of this report is that many freight businesses are keen to do their bit for emission reduction on the track towards net zero, but they also need governments and international public policy to put the technological options, infrastructure and institutions in place that will enable such progressive businesses to remain competitive. At the moment, they don’t feel that they are getting the support they need.
Professor Paul Ekins OBE UCL Institute for Sustainable Resources, University College London
Foreword from Professor Paul Ekins

6
Transport underpins modern economies and ways of life, facilitating the national and international movement of goods and services and community inter-connectedness. One of the consequences of the COVID-19 pandemic has been to reveal the extent to which we rely on complex supply chains, and to make clear the vital role which freight transport plays. Yet the environmental impact of transport is very significant. In light of the UK’s aim to reach net-zero emissions by 2050, the sector must decarbonise. To do so will involve navigating interlinking issues that are technological, financial, political and commercial. Compiling this report has entailed a comprehensive review of expert literature and interviews with a small group of freight business decision makers to consider the opportunities and challenges for the UK in moving to a net-zero transport system. Its key findings are set out in this Executive Summary.
Transport emissions in context
The Paris Agreement of 2015 set goals to limit global warming to well below 2, preferably to 1.5 degrees Celsius, compared to pre-industrial levels (see Annex 1 for more detail). To achieve this target, global greenhouse gas (GHG) emissions will need to fall dramatically from today’s levels, reaching ‘net zero’ by mid-century, meaning that remaining emissions are balanced by an equal amount being removed from the atmosphere (through nature-based solutions such as absorption by trees or in soils or through technological means).
The UK has set an ambitious goal of ‘net zero’ across all major sectors, including transport, by 2050. Transport is the largest contributor to UK domestic greenhouse gas emissions, responsible for 27% in 2019. Freight and logistics represent roughly half domestic transport emissions, not including international aviation and shipping. Carbon emissions from transport have remained largely flat since 1990, contrasting with the significant reductions made in emissions from power generation, meaning it is now the UK’s largest emitting sector, exceeding industry and residential emissions. Increasing attention is also being given to its impacts on air quality.
Evolving demand for transport services and di�ering technological options
COVID-19 has had an unprecedented impact on travel demand and the transport sector as a whole. However, freight transport is now returning to pre-pandemic levels and it is accepted that future growth will revert to pre-pandemic forecasts. Indeed, one challenge in the freight sector is the substantial expected global growth in demand for the next three decades. Barriers to decarbonisation in freight will di�er by mode of transport. In some cases the lack of commercially available decarbonisation technologies or low-carbon operational practices are hurdles
Executive Summaryto strong emissions mitigation. While some parts of the freight sector already have a range of tested and scalable emission-reduction opportunities, for example delivery with electric vans, this is not the case in other parts of the sector, such as long-distance road haulage or aviation.
The key findings of the report are that some reductions in emissions can be achieved through an improvement in the e¥ciency of available technologies and logistics systems, as well as some reduction in demand for services. However, the bulk of the reduction toward net zero will have to be driven by more profound changes, mostly in how the sector is powered. Although the barriers to implementing these changes are still substantial, a number of policies and programmes for the transport sector across the UK and internationally have been developed during the past decade. Avoided journeys, modal shifts, uptake of improved vehicle and engine performance technologies and low-carbon fuels, and - ultimately - changes in the built environment, together o�er high mitigation potential that could achieve net zero in the transport sector.
The policy framework
The Transport Decarbonisation Plan was published by the Department for Transport in July 2021, and is the latest report to set out the principles that underpin the UK government approach to delivering the UK 2050 net zero-target, and a path to net-zero transport in the UK, and the wider benefits it could deliver. The phase out dates for new non-zero emission LCVs and HGVs are 2035 and 2045 respectively (with a phase out of new ICE vehicle sales 5 years earlier for both types of vehicles). For the rail sector, the ambition is to remove all diesel-only trains from the network by 2040, in parallel setting a rail freight growth target. Regarding the maritime sector, indicative targets from 2030 will be introduced and consultation on the potential for a planned phase-out date for the sale of new non-zero emission domestic vessels will be conducted. Finally, consultations will start through “The Jet Zero Council” for aviation, to be established by the UK Government, to reach net-zero in 2050 with a net-zero target for domestic aviation in 2040, and in the interim to introduce a UK mandate for sustainable aviation fuels.
Insights from UK business
The freight business decision makers we spoke to as part of our research, were fully aware of increasing ambition of the climate change agenda in the UK. Companies were keen to get data and systems in place, in order to respond as and when requests from elsewhere in the supply chain come for low-carbon services and footprint data. For companies, there will be a long list of actions along the route to net zero.

7
The comparative maturity of the electric vehicle market for lighter vehicles and shorter routes gives those who operate in these markets more obvious short-term choices. For businesses whose operations rely on HGVs and long-haul journeys, the low-carbon vehicle market is not mature, and the pathway is much less clear. Government action is needed to deliver the huge change in infrastructures required.
Maximising the e¥ciency of operations and reducing fuel costs are already key metrics for transport companies and are accompanied by carbon and other sustainability benefits. The transition to a net-zero position will require more than e¥ciency however. Changes in technology or behaviours are not always an easy fit to established business models, meaning these may need to be flexed, existing capabilities and relationships reviewed, and the terms of new partnerships negotiated. In the longer term, businesses will need to reconsider the variations in total cost of ownership that arise from technological changes.
Transport businesses want to contribute to a net-zero UK, but uncertainty can hold some businesses back. This is particularly true for the HGV sector with no clear practical pathway to decarbonisation where technical solutions are still fragmented and at the development stage in the OEM industry. This requires policymakers to signal clear pathways for technology and infrastructure investment, and to seek holistic solutions across the industry’s value chains, and therefore provide the foundations on which businesses can be confident in adapting their business models to make transformational reductions in carbon emissions.
8
It has been clearly established over the past decades that climate change is happening and that it is caused primarily by anthropogenic emissions of greenhouse gases i.e. resulting from the influence of human beings. Carbon dioxide is known to be one of the main greenhouse gases since the mid-19th century. Other greenhouse gases are methane, ozone, chlorofluorocarbons and hydrofluorocarbons. Each has a di�erent warming potential and behaviour in the atmospheric system. All these gases are of importance to Earth’s energy balance and as a consequence to the climate system. Direct measurements of CO2 in the atmosphere (and auxiliary measurements such as air bubbles trapped in ice) show that atmospheric CO2 increased by more than 40% from 1800 to 2020 due to human activity. Other greenhouse gases (notably methane and nitrous oxide) are also increasing. The expected impact on Earth’s climate is based on scientific understanding of how greenhouse gases trap energy in the atmosphere and how the climate system reacts to this increased energy (the first sign being warming). The observed increase in atmospheric greenhouse gases (and other anthropogenic changes such as land use for example) explains most of the observed global surface temperature rise since 19001.
The impacts of increased GHG concentrations in the atmosphere extend well beyond an increase in temperature. They a�ect sea levels, cryosphere (where water is in solid form), ecosystems, health, economic output and communities around the world. Impacts from climate change are happening now and can be measured in physical and economic terms2.
Climate change, unabated, will pose a grave threat to socioeconomic development. As a consequence of this, the United Nations Climate Change Conference held in Paris in 2015 (COP 21) reached a consensus agreement on climate among all participating nations to limit the global average temperature rise to well below 2˚C above pre-industrial levels and to pursue e�orts to limit the increase to 1.5˚C3. Achieving this objective means controlling greenhouse gas emissions and particularly CO2 which accounts for about 80% of total GHG emissions4. The main provisions and implications of the Paris Agreement are described in the Annex 1.
To achieve the Paris Agreement target, global large mitigation of emissions is needed. All parties recognise the need to peak global greenhouse gas emissions “as soon as possible” and to fully decarbonize their economies during this century to achieve net-zero global greenhouse gas emissions5. Deep decarbonisation of the economy will require a radical shift in the nature and structure of the economic system, major improvements in energy e¥ciency and rapid transition in the energy types and mix used. Action now is required to lay the foundation and maintain a healthy momentum towards a low-emission society.
The transport sector is responsible for 57% of global oil demand as it is the largest consumer of petroleum-derived
fuels worldwide6. With 92% of final transport energy demand consisting of oil products it is presently the least diversified of the major energy end-use sectors. The sector, including passengers and freight, represents about 23% of the world's final energy use and contributes to around 15% of global GHG emissions (but 23% of energy-related CO2 emissions). Surface transport (including road transport) represents the biggest share, while international shipping and aviation are each responsible for just 2% of total greenhouse gas emissions, though their emissions are growing strongly. Mainly driven by economic growth, behavioural changes and population increase, transport sector emissions have increased by 2.5% annually between 2010 and 20157.
The transport system plays an important role in today's economy and society as a facilitator of growth and employment. Globally, the transport industry directly employs around 78 million people and accounts for about 5% of gross world product8. For the UK in 2018, employment in the transport sector was 1.7 million9, with 290,000 in road freight, 255,000 in postal and courier activities and 422,000 in warehousing and support activities. At the macroeconomic level, transportation is strongly related to level of output, employment, and income within the economy (in developed countries transportation can account for 6% to 12% of GDP). At the microeconomic level, transportation links producers to supply chains and to consumers, and drives distribution costs. As such transport, its infrastructure and the logistic system has an important e�ect on each sector and subsector of the economy, creating potential opportunities or barriers to economic development.
To achieve net-zero emissions during this century, all sectors of the economy will have to drastically reduce their emissions. Some residual greenhouse gas emissions may be allowed by permanently removing an equivalent amount of atmospheric carbon dioxide. Decarbonising the transport sector (in relation to global net-zero goals) implies changes such as curbing demand, a shift to cleaner transport modes and a shift to new energy sources, the aim being to deliver sectoral zero emissions. Demand reduction can reduce emissions by a certain amount, but net-zero emissions will require that transport vehicles, from cars to airplanes, will need to run more e¥ciently and on zero-emission energy in the future.
For each mode of transport, direct emissions can be decomposed into di�erent components with di�erent levers. First is the activity level or the amount of freight to be transported, influenced by economic and commercial factors. The second parameter is the system infrastructure, modal choice and logistical systems available. Then the energy intensity of operations is directly related to vehicle design, engine e¥ciency, driving behaviour, and usage patterns. Finally, and probably the most important, there is the carbon intensity of the fuel used to power the vehicles performing the freight transport. Only zero-carbon fuels would allow
1. Introduction

9
freight transport with zero CO2 emissions, as the first three components presented above can only lower emissions to a certain extent.
Transport-related climate change mitigation actions can yield substantial health as well as economic benefits. Internal combustion engines in the transport sector have strong e�ects on local and global pollution with links to well-being and premature death. Tailpipe emissions from transportation resulted in an estimated 7.8 million years of life lost and approximately $1 trillion (2015 US$) in health damages globally in 2015. Among transportation sub-sectors, on-road diesels contributed most to the health burden from transportation tailpipe emissions10. Mitigation of greenhouse gas emissions may therefore also improve air quality. Economically, a transition to zero emissions in the sector will accelerate technical innovation, job creation and skill development in the green economy. The joint achievement of both economic development and environmental improvement has been called Green Growth. According to the World Bank, Green Growth is essential for future development and can lead to significant economic and social, as well as environmental, gains11.
This report covers current and projected freight sector demand and CO2 emission (Sections 2 and 3), the regulatory drivers for emissions reductions in the sector (Section 4), and the technological and non-technological options for emissions reductions (Sections 5 and 6), including all forms of zero emission energy that have the potential to power transport at scale as well as other improvements that could facilitate the transition to net-zero emission in the freight transport system.
Research interviews were conducted with managers in a number of UK freight and logistic companies, in order to understand how their businesses are a�ected by the net-zero mitigation target in the short term and how they plan for the longer term toward 2050. The interviewed companies were CalMac, John Lewis Partnership, Suttons, UPS, and Wincanton (see Annex 2). Quotes from interviews are used throughout the report to highlight the findings from the research and Section 7 outlines and summarises the business insights gained during the interviews. Section 8 concludes, followed by the Reference Section and two Annexes related to the Paris Agreement (Annex 1) and the presentation of the businesses interviewed (Annex 2).

10
Figure 2.1 Evolution of freight transport and gross domestic product worldwide.1
2. Overview of freight sector demand and GHG emissions2.1 At a global level
Globalisation and the associated geographical fragmentation of international production have driven growth in international trade. Supply chains have become longer and more complex, as logistics networks link increasingly distant economic centres. This is caused by global innovation and competitive pressures, and the development of new manufacturing centres that a�ect international trade and shape freight patterns at local, regional and global scales. In the 1990s and 2000s China was said to have become the “workshop of the world”, greatly increasing the demand for international freight shipping.
Freight transport is an example of what economists call a derived demand as the transport is not required in itself, but only as a means to satisfy another demand. Freight transport is required by manufacturers, processors and retailers to produce goods and get them to consumers. The level of demand for goods is influenced by various factors, including the performance of the wider economy, as seen by the worldwide GDP in figure 2.1, and changes in lifestyles and consumption patterns over time. Changes in the last decades have led to an increase in freight transport, at a local level with more frequent and smaller shipments and at a global level
with larger and faster shipments needed. As a result, there has been increased demand for rapid but energy-intensive transport such as van delivery or air freight. As freight transport presently relies heavily on fossil fuel this has resulted in an increase in emissions of pollutants and greenhouse gases. As the sector is still a long way from being able to switch to cleaner energy sources, it is increasingly recognised as one of the hardest industries to rapidly decarbonise.
The inset of Figure 2.2 shows that the share of transport emissions tends to increase due to structural changes as GDP per capita increased (regions became richer)2. The di�erence between North America (dotted green) and other OECD countries (purple and dotted red) shows that the development path taken by developing countries in the past had a significant impact on present emissions. This is important as economies in transition nowadays take decisions (concerning their transport sector) that will have impacts on the future share of their transport-related emissions and, consequently, their future total GHG emissions. The figure also presents regional transport emissions for the sector by region and type of transport, highlighting the potential development of emissions if the developing countries follow the historical development trajectories of the developed countries.
Freight transport, all modesFreight transport by seaGDP worldwide (constant 2016 prices)
1975
1979
1981
1983
1985
1987
1977
1989
1991
0
50
100
150
200
250
300
350
1993
1997
1999
2001
2003
2005
1995
2007
2009
2011
2013
2015
Index (1990 = 100)

11
Figure 2.2 GHG emissions from transport sub-sectors by region in 1970, 1990 and 2010.2
International shipping (green) and aviation (amber) (INT-TRA) shown separately. Inset shows the relative share of total GHG emissions for transport relative to GDP per capita from 1970 to 2010 for each region and the world. Note: EIT= Economies In Transition, MAF= Middle-East and Africa, LAM= Latin America
MAF
2010199019700.0
0.5
1.0
1.5
2.0
2.5
3.0
3.5
4.0
GH
G E
mis
sion
s (G
tCO
2 eq/
yr)
201019901970 201019901970 201019901970 201019901970 201019901970
LAM INT-TRAEITASIAOECD-1990
East AsiaEconomies in transitionLatin America and CaribbeanMiddle East and North Africa
0
5
10
15
20
25
30
GDP per Capita (Int$2005)
50000 20,00015,00010,000 35,00030,00025,000 45,00040,000
Tran
spor
t sec
tor s
hare
in C
O2 e
mis
sion
s (%
)
North AmericaSouth-East Asia and PacificPacific OECDSouth Asia
Sub Saharan AfricaWestern EuropeWorld
Indirect emissions from electricity generationRoadRailHFC and indirect N2O
Pipelines etcDomestic waterborneInternational and coastal shippingInternational aviation
Domestic aviation*Total (without indirect emissions)
*3.14
*2.66
*1.71
*0.14
*0.40
*1.15
*0.26
*0.51 *0.48
*0.07*0.26
*0.57
*0.14*0.29
*0.55 *0.48*0.62
*1.10

12
2.2 The UK freight sector
Road tra¥c in Great Britain (including passengers and freight) increased from 255 billion miles travelled in 1990 to 328 billion miles in 2018, an increase of 29%. Total fuel used for road transport in the UK remained relatively stable from 1990 to 2017, as the fuel e¥ciency of newer vehicles has improved; petrol use declined over this period but diesel share has increased. Figure 2.3 focuses on freight tonnage within the UK in di�erent modes of surface transport3. Road freight transport is the dominant mode (90% of tonnage moved by road).
This is mainly driven by the facts that road transport:
� Has a high level of flexibility and cost-e�ectiveness;
� Is adapted to short distances and for small consignments;
� Has low barriers to entry into the sector (low start-up costs and a low level of institutional and regulatory complexity); and
� Benefits from the extent of the high-capacity strategic highways network.
The financial crisis in 2008 had an impact on freight transport, reducing it by 25% within two years; but lower level of growth returned to the subsector from 2010.
Figure 2.3 Domestic freight transport by mode in Great Britain 2001–15 (million tonnes)3
The vast majority of road freight is carried in heavy goods vehicles (HGVs), which are defined as vehicles over 3.5 tonnes in weight, including both the vehicle and its load. Although there are many types and sizes of HGV, the main type of HGV used for long-distance road haulage is the combination
of a tractor and 13.6-metre trailer unit. There has been an increase in light goods vehicle (LCV) tra¥c. Before 2020, most LCV movements on the road network were not associated with e-commerce deliveries but were mainly used for food distribution, construction and business services4. Therefore, while the growth in LCV tra¥c on the roads is partly related to the growth in e-commerce, it is also driven by the growth in services. Road (HGV and LCV) largely dominates the internal freight transport in the UK (up to 90%), meaning that rail and waterborne carried only about 10% of UK freight in 2015 (with an equal contribution of 5% for rail and 5% for waterborne transport).
Rail freight transport can be cost-e�ective, even over short distances (less than 100km) for full trainload consignments moving between two rail-connected sites. It can also provide economic and flexible transport when containers are transported in an intermodal transport chain. Over longer distances rail freight can be even more competitive with road. The average length of UK rail haulage is about 150km. Other benefits of rail freight include: the ability to move large volumes of cargo, and low greenhouse gas and other emissions per unit moved (even for diesel powered locomotives).
Waterborne freight transport includes the transport of domestic freight within the UK on inland waterways, along the coasts and between Great Britain and Northern Ireland. Large volumes of bulk goods and some containers are transported along the coast between UK ports and along wide inland waterways and on the major river estuaries. There is no cargo transported on canals nowadays in the UK.
Finally, pipelines provide a specialist mode of transport for the cost-e�ective transport of large volumes of bulk liquids and gases between ports and manufacturing sites, refineries and power stations or major airports (for example, kerosene from a refinery or storage to an airport).
In recent decades the transport sector has been one of the highest-emitting sectors of greenhouse gases in the UK. It was lower than energy supply but above the business, and residential sectors. Together these four sectors accounted for almost 80% of emissions in 2010. However, since 1990, the UK has achieved steep emissions reductions in its energy supply sector, historically the highest emitter, particularly in the last eight years as a result of phasing out coal in power generation and the increasing the use of renewables, such as wind and solar. In other areas – such as transport – emissions remain largely unchanged. As seen in figure 2.4, since 2016 the transport sector (dark blue line) is now the highest emitter within the presented sectors and has been stable over the last 3 decades. Before the COVID-19 epidemic, in 2019 transport was responsible for 28% of all greenhouse gas emissions in the UK. Transport emissions were only 3.0% lower than in 1990, as increased road tra¥c has largely o�set improvements in vehicle fuel e¥ciency. Only 2% of all licensed vehicles (including passengers and freight without distinction) in the UK in 2020 are low/ultra-low emissions vehicles (in 2018 it was 0.5%). In 2020 PHEV, BEV, range-extended electric or fuel cell electric cars accounted for 10.9% of all newly registered cars5.
Water Rail Road
Million tonnes
1,5001,000500 2,0000
2015
2014
2013
2012
2011
2010
2009
2008
2007
2006
2005
2004
2003
2002
2001

13
However in figure 2.4, transport emissions are strongly a�ected by the 2020 COVID-19 epidemic after 2019. Road tra¥c in the UK decreased by 21% between 2019 and 2020 for all vehicles, but only by 9% and 6% in the respective LCV and HGV modes6. Globally, trade value for 2020 presents a lost equivalent to 13 to 22 percent of total 2019 trade volume. The range is driven by the uncertainty in the length of the pandemic as well as macroeconomic scenarios underlying the post-COVID-19 recovery at the time of this analysis. The extent of the disruption will vary by commodity, trade route, and mode of transport. Some recovery scenarios have been analysed and trade volumes may take 15 to 48 months to recover to 2019 levels7. It is also projected that global trade growth will be reverting to previous projected rates (as presented in the next section) after the end of the pandemic.
Figure 2.4 UK emissions by sector8
As shown in Figure 2.5 below, HGVs (large trucks) are currently estimated to account for around 16% of UK GHG emissions from domestic transport. LCV (mostly vans) emissions are almost at the level of HGVs (15%). The DfT “Freight Carbon Review”9 found that HGVs account for just 5% of vehicle miles. Regional delivery was the most common by number of vehicles, followed by construction, urban delivery, long haul, and municipal utility. In terms of vehicle numbers on the road, HGVs represent only a small proportion, but due to the vehicle large load capability and relatively high mileages associated with long haul freight transport, their contribution is important. There are four million LCVs compared to only half a million HGVs on UK roads. This may suggest an opportunity to significantly reduce road freight emissions if an e�ective targeted decarbonisation solution for HGVs can be developed. On the LCV side almost all vans are diesel-powered o�ering good fuel economy and reliability for high-mileage vehicles. Low-carbon LCVs exist on the market but between 2012 and 2018 fewer than 5,000 vans received the plug-in van grant. The demand has been constrained by the limited availability of models, the reduced payload (due to battery weight), the increased cost and reduced range compared to a diesel vehicle.
Figure 2.5 GHG emissions by transport mode9
Emissions from UK international shipping bunkers were estimated to be 7.9 MtCO2 in 2018, a small decrease of 0.2% from the 2017 level. Since 1990, emissions from UK shipping bunkers have fluctuated, but in recent years have been at around the same level that they were in 1990.
In 2018, emissions from international aviation fuel use from UK bunkers were estimated to be 36.7 MtCO2. This is an increase of 1.1% from the year before, however it doesn’t di�erentiate freight and passenger flights. Between 1990 and 2006, when emissions reached a peak, emissions more than doubled from 15.5 MtCO2 to 35.6 MtCO2. After 2006 emissions flattened out, but rose again in the years to 2018 to above the 2006 total (before the COVID-19 crisis).
58%
16%
15%
3%2%
2% 4%
Cars & TaxisHeavy goods vehiclesLight vansBuses & Coaches
RailDomestic ShippingOthers
Source: BEIS (2021) 2020 UK Greenhouse Gas Emissions. Provisional figures.
Notes: LULUCF = Land use, land use change and forestry. Estimates of emissiona for sectors with large proportions of non-CO2 emissions are not shown on the second chart. Final estimates of 2020 emissions in these sectors will be published in early 2022. The sectoral emissions for aviation and shipping include the UK's share of international aviation and shipping emissions and are CCC estimates.
Surface transportManufacturing & constructionElectricity supplyFuel supplyShipping
BuildingsAgriculture & LULUCFAviationWasteF-gas
0
50
100
150
200
Ann
ual e
mis
sion
s M
tCO
2e
202020102000
-25
-10
-5
0
5
Cha
nge
in e
mis
sion
s M
tCO
2e
Elec
tric
itysu
pply
Surf
ace
tran
spor
t
Avi
atio
n
-15
-20
Man
ufac
turin
g&
con
stru
ctio
n
Ship
ping
Fuel
sup
ply
Bui
ldin
gs
Average annual change 2009-2019

14
3.1 At a global level
According to pre-COVID-19 projections from the OECD (Organisation for Economic Co-operation and Development)1, the growth in trade was expected to continue to outpace GDP growth with world trade estimated to grow at around 3.5% annually within the next decade (lower compared to 6.9% over the period 1990-2007). Still, global trade (in constant values) is projected to grow by a factor of 4 from 2010 to 2050. The weight of trade (in tonnes of goods moved) will grow less, by a factor of 3.8, reflecting changes in the product composition of the world trade and more specifically the fact that countries are moving up the value chain, producing more high value goods. While freight weight will grow slower than the trade value, world freight volumes will increase more strongly over the same period, by a factor of 4.3 (measured in tonne-kilometres [t-km]) in a baseline scenario, indicating again an increase in the length of the transport links (given the slower growth in the weight of trade). Of the 108 trillion t-km transported worldwide in 2015, 70% went by sea, 18% by road, 9% by rail and 2% by inland waterway. Less than 0.25% of global freight in t-km is transported by air (Figure 3.1).
Global freight demand would triple between 2015 and 2030, based on the pre-COVID-19 demand pathway. The projected compound annual growth rate of total freight through to 2030 is 3.1%. Within the di�erent modes of freight transport, with global GDP doubling by 2030, air freight could increase by around 5.9% p.a. and maritime container tra¥c could increase by more than 6% p.a.; and rail freight tra¥c worldwide could increase at around 2-3% p.a. On this basis: air freight could triple in 20 years; and port handling of maritime containers worldwide could quadruple by 2030. After 2030, freight demand could grow faster over the longer term, at 3.4% through to 2050. Maritime shipping will remain the largest contributor to global tonne-kilometres. Ships will account for more than three-quarters of all goods movements by 2050 (Figure 3.1). The remaining goods will be transported by road (17%) and rail (7%). Air freight, while representing a marginal share of total freight transport, will have the highest compound annual growth rate of all modes through to 2030 (5.9%) and 2050 (4.5%). Its growth is driven by larger shares of high-value goods being transported by air, most notably toward China. As noted, these forecasts in the OECD report1 do not include the e�ects of the COVID-19 pandemic that could delay the timing of achieving these demand levels by 15 to 48 months as discussed in the previous chapter.
Figure 3.1 Projected global freight transport demand by mode. Current demand pathway, billion tonne-kilometres1
3. Forecast future freight demand
It is noteworthy that freight demand depends primarily on economic growth and international trade activity. In light of the current instability of the global economy and the rising tensions over trade, the accuracy of growth projections for freight transport in the current demand pathway is uncertain. Forecasts could shift as a result of increased protectionism or a global economic downturn, but also depending on improvements in freight transport capacity in countries or regions with significant growth potential. Most of this growth is driven from development in developing country regions where large shares of future population and income growth are expected. The baseline trade scenario, as developed for the OECD1, projects that trade within the OECD economies will halve its share from 47% to 25% of global trade, while trade between non-OECD economies will more than double from 15% to 33%, with higher income growth in emerging and developing economies than in OECD countries. This is the result of future changes in consumption structures and in relative productivity between developed and developing regions.
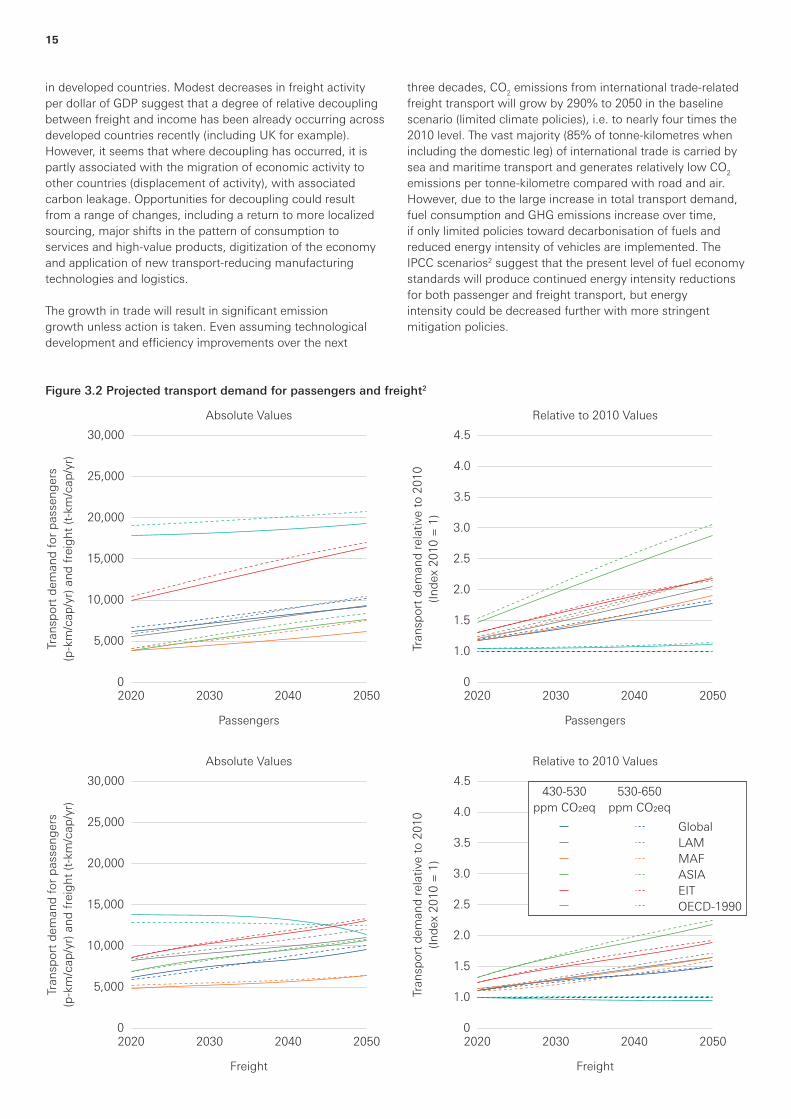
Regional projections, as presented in the IPCC report2, for passenger and freight travel demands show that while demand in non-OECD countries grows rapidly, a lower starting point results in a much lower per capita level of freight travel in 2050 than in OECD countries (Figure 3.2). In all scenarios the pathways present lower increases in freight transport than in passenger transport, which increases as much as threefold by 2050 compared to 2010 levels. Freight demand has historically been closely coupled to GDP, but there is potential for future decoupling as seen for the OECD region (blue line). Over the long term, changes in activity growth rates for a 2˚C target (the 430–530 ppm CO2 scenario) suggest that decoupling freight transport demand from GDP could take place as early as 2040
SeaRoad
RailInland waterways
Air
2050203020150
100,000
150,000
200,000
250,000
300,000
350,000
400,000
15
in developed countries. Modest decreases in freight activity per dollar of GDP suggest that a degree of relative decoupling between freight and income has been already occurring across developed countries recently (including UK for example). However, it seems that where decoupling has occurred, it is partly associated with the migration of economic activity to other countries (displacement of activity), with associated carbon leakage. Opportunities for decoupling could result from a range of changes, including a return to more localized sourcing, major shifts in the pattern of consumption to services and high-value products, digitization of the economy and application of new transport-reducing manufacturing technologies and logistics.
The growth in trade will result in significant emission growth unless action is taken. Even assuming technological development and e¥ciency improvements over the next
three decades, CO2 emissions from international trade-related freight transport will grow by 290% to 2050 in the baseline scenario (limited climate policies), i.e. to nearly four times the 2010 level. The vast majority (85% of tonne-kilometres when including the domestic leg) of international trade is carried by sea and maritime transport and generates relatively low CO2 emissions per tonne-kilometre compared with road and air. However, due to the large increase in total transport demand, fuel consumption and GHG emissions increase over time, if only limited policies toward decarbonisation of fuels and reduced energy intensity of vehicles are implemented. The IPCC scenarios2 suggest that the present level of fuel economy standards will produce continued energy intensity reductions for both passenger and freight transport, but energy intensity could be decreased further with more stringent mitigation policies.
Figure 3.2 Projected transport demand for passengers and freight2
10,000
15,000
20,000
25,000
30,000
Tran
spor
t dem
and
for p
asse
nger
s(p
-km
/cap
/yr)
and
frei
ght (
t-km
/cap
/yr)
0
5,000
205020402020 2030
Absolute Values
Passengers
10,000
15,000
20,000
25,000
30,000
Tran
spor
t dem
and
for p
asse
nger
s(p
-km
/cap
/yr)
and
frei
ght (
t-km
/cap
/yr)
0
5,000
205020402020 2030
Absolute Values
Freight
2.5
3.0
3.5
4.0
4.5
Tran
spor
t dem
and
rela
tive
to 2
010
(Inde
x 20
10 =
1)
0
2.0
205020402020 2030
Relative to 2010 Values
Freight
1.5
1.0
430-530ppm CO2eq
530-650ppm CO2eq
GlobalLAMMAFASIAEITOECD-1990
2.5
3.0
3.5
4.0
4.5
Tran
spor
t dem
and
rela
tive
to 2
010
(Inde
x 20
10 =
1)
0
2.0
205020402020 2030
Relative to 2010 Values
Passengers
1.5
1.0

16
3.2 Forecast for the UK
The National Infrastructure Commission has commanded a report, published in 2019, on freight demand forecasts for the UK3. The report has developed several scenarios for freight demand in the UK until 2050. Here we will concentrate on two major scenarios named ‘Business as Usual’ and ‘Carbon Reduction’ (Figure 3.3).
The ‘Business as Usual’ (BAU) scenario involved e�ectively no change from the existing position except that existing Government policy will have led to the end of the sale of new diesel and petrol LCVs after 2030. It assumes that consumer demand would have led to an increase in e-commerce’s market share to 65% of the general merchandise market and 35% of the food market due to its convenience and cost e�ectiveness; this would have led to a significant switch away from passenger trips to retail outlets, mainly using private cars, to home deliveries by battery-operated LCVs (with sales of new ICE LCVs in the UK banned from 2030, however the proposed 2040 ban on ICE HGVs is not included in the scenario). Economic trends in terms of growth, productivity and employment continue up to 2050.
The ‘Carbon Reduction’ scenario reduces carbon emissions to mitigate climate change and emissions of other air pollutants to protect health. There is a ban on the sale of new petrol and diesel cars and vans from 2030; freight LCVs use enhanced battery technology for deliveries, while HGVs use
electric propulsion in two di�erent ways (e-highways on a core freight network and batteries for movements in urban areas and more remote areas – these technologies will be introduced later in the report). Rail freight services would operate on a core electrified network, with battery technology for operation on non-electrified lines. Shipping would use LNG and electric propulsion for short journeys.
Total heavy freight is forecast in the BAU 2050 scenario to increase by 1.1% per annum to reach 2.86 billion tonnes of freight transported in 2050 mostly by HGV, as this scenario does not include the additional clustering of warehousing on rail- and water-connected distribution parks. As a consequence, the rail modal split in terms of tonne kilometres falls from 8.5% in 2015 to 8.4% in BAU. Annual average growth rates for the other scenario (Carbon Reduction) is lower, at 0.9% average growth rate, and reflect the lower levels of forecast economic growth in the mitigation scenario.
Total light freight in terms of trips is forecast in the BAU scenario to increase by 3.6% per annum to reach 9.24 billion trips in 2050. For the Carbon Reduction scenario the growth rate for LCV transport is lower, at 2.0%. This is driven by a lower penetration of e-commerce in the retail market; in this scenario consumers are paying for the full cost of the e-commerce deliveries and as consequence a higher proportion of local ‘bricks and mortar’ retail is maintained. The lower growth rate means that LCV freight only doubles in the ‘Carbon Reduction’ scenario instead of tripling under BAU.
Figure 3.3 Modelled aggregate demand for “heavy” and “light” freight transport in the UK for the years 2015, 2050 and for two scenarios3
The units for freight is billion tonnes carried.
2015 Business as Usual (BAU) 2050
Carbon Reduction 2050
Road freight transport
Freight tonnes lifted in HGV (billion tonnes) 1.97 2.86 2.60
Total growth 2015-50 45.3% 32.2%
Compound average growth rate 2015-50 1.1% 0.8%
Freight transported in LGVs (billion trips) 2.76 9.24 5.44
Growth 2015-50 235% 97%
Compound average growth rate 2015-50 3.6% 2.0%
Heavy road and rail freight transport
Road tkm by HGVs (billion) 164 223 180
Growth in road tkm by HGVs 2015-50 36.4% 9.8%
Compound average growth rate for road tkm by HGVs 2015-50
0.9% 0.3%
Average length of road haul by HGVs (km) 87 81 72
RAIL Rail tkm (billion) 15 21 19
Growth in rail tkm 2015-50 35.6% 23.0%
Compound average growth rate 2015-50 0.9% 0.6%
Average length of rail haul (km) 167 191 183
Rail modal split in tkm 8.5% 8.4% 9.4%

17
4. Current regulatory drivers and mechanisms for the transport sector in relation to climate mitigation4.1 Introduction to the Paris Agreement
The Paris Agreement (see Annex 1) has ushered in a new phase of climate action and diplomacy. Its vision of net-zero carbon emissions has become adopted as a legal or policy target in a number of countries, and stated commitment to compliance with that target has also become common in businesses.
4.2 Explicit policies for long-distance international transport
Because of their nature, international shipping and aviation emissions are not part of the current NDC accounting or included in the Paris Agreement. Instead, they are dealt with in the context of international specialised organisations (UN agencies): the International Maritime Organisation (IMO) and International Civil Aviation Organisation (ICAO).
Emissions from domestic flights are accounted within each NDC. Responsibility for reducing emissions from international flights, which account for around 65% of the aviation industry’s CO2 emissions, and 1.3% of global CO2 emissions, has been delegated to ICAO. The “CORSIA” scheme was developed and adopted in 2016 by 192 countries within ICAO1. CORSIA is short for “Carbon O�setting and Reduction Scheme for International Aviation” and aims to ensure any rise in international aviation emissions above 2020 levels is o�set elsewhere. It is significant because of the aviation sector’s large and rapidly increasing CO2 emissions.
CORSIA is designed to help the aviation industry reach its “aspirational goal” to make all growth in international flights after 2020 “carbon neutral”. It is a market-based mechanism being developed by ICAO. Airlines will have to buy emissions reduction o�sets from other sectors to compensate for any increase in their own emissions. Alternatively, they can use lower carbon “CORSIA eligible” fuels (to be determined by a specific set of parameters such as carbon reduction, sustainability or origin of the feedstock).
The scheme started operating in January 2021, with a voluntary pilot phase that will last to the end of 2023. The first full phase from 2024 through 2026 applies to States that have volunteered to participate in the scheme. The second phase (from 2026 to 2035) would apply to all States that had an individual share of international aviation activities in RTK
(revenue-tonne kilometre) in year 2018 above 0.5 per cent of total RTKs, or who are included in the list of States from the highest to the lowest amount of RTK (this will apply to 90 per cent of total RTKs). Exceptions will be permitted for Least Developed Countries, Small Island Developing States and Landlocked Developing Countries; they will be exempted unless they volunteer to participate in this second phase. Finally, in light of COVID-19's impact on aviation in the year 2020, the emissions baseline above which international airlines must o�set their emissions will now be calculated using only 2019 emissions, rather than averaging 2019 and 2020 emissions as an adjustment to the 2021-2023 pilot phase of CORSIA.
CORSIA timescale:
� 2016 ICAO agrees to o�set emissions growth from 2021 in an approach known as "CORSIA"
� 2018 ICAO council adopts "SARPs" (Standards and Recommended Practices), laying out criteria for CORSIA o�sets
� 2019 All ICAO members start monitoring and reporting emissions from international flights
� 2021 CORSIA begins voluntary trial phase
� 2024 CORSIA begins voluntary first phase
� 2027 CORSIA begins mandatory second phase, with exemptions for some small emitters
� 2032 ICAO reviews if CORSIA should be ended, extended or improved after 2035 (the end of the second phase).
For shipping, within the IMO Assembly, countries have reached agreements on improving the fuel e¥ciency of ships, mainly through ship design and e¥ciency standards2. These measures were adopted in 2018 as an initial strategy for the reduction of greenhouse gas emissions from ships and are known as:
� The Energy E¥ciency Design Index (EEDI), and
� The Ship Energy E¥ciency Management Plan (SEEMP).

18
EEDI and SEEMP are mandatory measures to reduce emissions of greenhouse gases from international shipping, under IMO’s pollution prevention treaty (MARPOL). EEDI prescribes that by 2025, all new ships will be 30% more energy e¥cient than those built in 2014; it is mandatory for new ships. SEEMP stipulates an operational measure that establishes a mechanism to improve the energy e¥ciency of a ship in a cost-e�ective manner and control GHG emissions from the already existing shipping fleet. It has been calculated that the application of these two measures has contributed to reduce shipping greenhouse gas emissions by 180 Mt annually by 2020 (note for comparison that maritime transport emissions were 1,056 Mt in 20183). No agreement has yet been reached to develop a market-based or pricing mechanism for shipping emissions. Shipping companies are starting to react to these measures (Box 4.1).
IMO’s initial GHG strategy envisages a reduction in carbon intensity of international shipping (to reduce CO2 emissions per transport work, as an average across international shipping, by at least 40% by 2030, pursuing e�orts towards 70% by 2050, compared to 2008); and a reduction in total annual GHG emissions from international shipping by at least 50% by 2050 compared to 2008. The strategy includes a specific reference to “a pathway of CO2 emissions reduction consistent with the Paris Agreement temperature goals”. Two new measures were adopted in June 2021 by IMO’s Marine Environment Protection Committee (MEPC 76)4:
� the technical requirement to reduce carbon intensity, based on a new Energy E¥ciency Existing Ship Index (EEXI); and
� the operational carbon intensity reduction requirements, based on a new operational carbon intensity indicator (CII).
The CII requires annual successive carbon intensity reduction rate of -2% compared to 2019 from 2023 until 2026. The EEXI is based on the 2018 calculation guideline of the EEDI, while the reduction values range from 5% to 30% depending on ship type and range5. The initial data-gathering process lasted until 2020. The data collected under the mandatory reporting system will be used for proposals for short-, medium- and long-term measures, with possible timelines, and will help inform the MEPC when it comes to adopt a revised strategy in 2023.
Box 4.1 CalMac
“Up until recently, we have not specified that the vessel must achieve certain environmental targets or have the capability to be adapted. As part of our new Environmental Strategy we have changed our procedures so that as standard we will request that every new vessel will have the ability for cold ironing or plugging into shore side power. So even though we haven't necessarily got the infrastructure yet, every new vessel that comes on, we're going to request that it has the ability, so that then that provides us with the options to reduce emissions.”
4.3 UK specific legislation regarding climate change
Further to the main international policies and goals, the UK has passed specific legislation to pledge specific targets as well as proposing strategies to achieve the goals for di�erent sectors in the transport system.
In the UK the Climate Change Act was passed in November 2008. At the time, it set out legal emission reduction targets that the UK must comply with. It was the first legally binding climate change mitigation target set by a country. Under the Climate Change Act in its 2008 version the net UK carbon account for the year 2050 had to be at least 80% lower than the 1990 baseline. “The 1990 baseline” is defined as the aggregate amount of net UK emissions of carbon dioxide for that year, and of each of the other targeted greenhouse gases (carbon dioxide, methane, nitrous oxide, hydrofluorocarbons, perfluorocarbons, sulphur hexafluoride) calculated consistently with international carbon reporting practice.
The Climate Change Act 2008 was revised in 2019. The revision required that the net UK carbon account for the year 2050 is at least 100% lower than the 1990 baseline. This is the “Climate Change Act 2008 (2050 Target Amendment) Order 2019” and it came into force on the day after it was passed. With this more ambitious target, the UK became in 2019 the first major economy to commit to a ‘net zero’ target. The new target requires the UK to bring all greenhouse gas emissions to net zero by 2050. Emissions of greenhouse gases from international aviation or international shipping do not count as emissions from sources in the United Kingdom.
In 2008 the Climate Change Act also established the Committee on Climate Change (CCC – now renamed “Climate Change Committee”), an independent body to provide evidence-based advice to the UK Government and Parliament on the mandatory carbon budgets. The CCC recommended the 2050 target date for reaching net zero, subsequently adopted by the UK Government, in its report “Net Zero: The UK’s contribution to stopping global warming”, published in May 2019.
Finally, the Climate Change Act provides a system of carbon budgeting, to help the UK meet its targets through a series

19
of five-year carbon budgets. The Climate Change Committee reports regularly, advising and monitoring progress on emission reduction and whether the UK is on track to achieving its carbon budgets and targets. As shown in Figure 4.1 the first and second carbon budget were met and the UK is on track to meet the third (2018–22). But the rate of emissions reduction will need to accelerate if the fourth (2023–27) and fifth (2028–32) carbon budgets are to be met, and these were adopted before the Climate Change Act revision of 2019 are not in line with the Net Zero target. The Committee advised on the sixth carbon budget (2033–37) in December 2020 – the first of the carbon budgets that is in line with the new net zero target – and set out the pathway to 2050 that is shown in Figure 4.1. The UK Government has enshrined new targets in law by adopting the sixth carbon budget into law in April 2021. As consequence, by law, a 78% reduction of UK emissions should happen by 2035.
However, the CCC’s Progress Report 20216 found that there was still a substantial gap between the trajectory of non-electricity emissions pre-COVID-19 and the required trajectory for the sixth carbon budget to be met (see Figure 4.2).
Figure 4.1 The six carbon budgets so far legislated6 Figure 4.2 Required emission reduction to meet the sixth carbon budget6
The ambitions for the UK maritime industry for 2035 and 2050 have been set out in the Clean Maritime Plan launched mid-20197. The Government made a number of commitments, including: a call for evidence on non-tax incentives; a consultation on how the Renewable Transport Fuel Obligation can be used in the maritime sector; a study to identify and support UK zero-emission shipping clusters; and support of clean maritime innovation through funding and competitions. The goal is to develop a zero-emissions maritime sector in the UK.
In respect of the aviation sector, the UK government launched in July 2020 the “Jet Zero Council”8, a partnership between industry and government to deliver new technologies and innovative ways to cut aviation emissions. Two delivery groups have been created: the “Sustainable Aviation Fuels” and the “Zero Emission Flight” delivery groups, respectively to accelerate the delivery of sustainable aviation fuels and develop zero-emission aviation.
Source: BEIS (2021) provisional UK greenhouse gas emissions national statistics 2019: CCC analysis.
Notes: Emissions shown include emissions from international aviation and shipping (IAS) and on an ARS basis, including peatlands. Adjustments for IAS emissions to carbon budgets 1-3 based on historical IAS emissions data; adjustments to carbon budgets 4-5 based on IAS emissions under the balanced net zero pathway.
Source: BEIS (2021) 2020 UK Greenhouse Gas Emissions. Provisional figures: CCC analysis.
Notes: Emissions in this chart are adjusted for future increases to the Global Warming Potentials (GWPs) pf non-CO2 gases, and therefore do not match the total published in the latest greenhouse gas inventory. The sixth carbon budget target was recommended on this basis.
0
100
200
300
1,000
Emis
sion
s in
clud
ing
IAS
(MtC
O2e
/yea
r)
2050
2020
1990
2025
1995
2030
2000
2035
2005
2040
2010
2045
2015
The sixth carbon budgetPast carbon budgetsHistorical emissionsHeadroom for IA5 emissions
Active legislated carbon budgetsThe balanced net zero pathway
400
500
600
700
800
900
5-year carbon budget (MtC
O2e)
0
500
1,000
1,500
5,000
2,000
2,500
3,000
3,500
4,000
4,500
CB1 CB2 CB3 CB4 CB5 CB6
Total GHG emissionsElectricity supply emissionsAll other emissionsIf per sector trends from 2009-2019 continue
Recommended pathways to meet sixth carbon budgetGap to target if pre-2020 trends continue in every sector
0
100
200
300
700
MtC
O2e
2035
2023
2009
2025
2011
2027
2013
2029
2015
2031
2017
2033
2019
2021
400
500
600

20
Box 4.2 Suttons
“In our sector of the market we’re the biggest operator but there are a huge number of smaller operators. Those smaller operators haven't got the data collection systems and analytical capability, so as an industry there is a reliance on people planning movements in their head. If the government really wants to reduce total kms travelled and therefore, emissions from transport, it's got to be tackled at an industry level rather than an individual company level.”
The road freight transport sector will need to play a substantial role in achieving the required acceleration of emission reduction. Responses from the sector indicate that this will be a challenge (Box 4.2).
In addition, businesses do not feel that they are yet adequately supported to make the emissions reduction for which they are being asked, needing incentives as well as regulations, and joint working with Government to ensure that the wrong choices are not made (Box 4.3).
These issues are explored further in the specific sections that follow.
4.4 Implications of UK climate change legislation for road freight transport
Emissions from freight transport will need to be significantly reduced following the adoption of the target of net-zero emissions by 2050, to achieve which, the UK Government has produced a number of strategic documents. “Road to Zero”9 determined that all new cars and vans (including vans for freight transport and delivery) should be e�ectively zero emission by 2035. Between 2030 and 2035, new cars and vans can be sold if they have the capability to drive a significant distance with zero emissions (for example, plug-in hybrids or full hybrids). As a consequence of these decisions, by 2050 almost every van on the UK road will be zero emission (as the ban on new ICE vehicle sales will start in 2030).
In September 2017, the UK amended its Renewable Transport Fuel Obligation for the next 15 years, to align it with the commitments published in the Clean Growth Strategy10. This was designed to provide a firm platform for investment
in sustainable advanced fuels for automotive, road freight and aviation use. The latest targets, published in 2021, are to increase the use of renewable fuels in road transport from 11.2% in 2021 to at least 14.1% by 203211. The road freight sector overall is starting to make progress towards lower-emission power, as take-up of electric vans grows. However, in the meantime, an increase in transport demand meant that by 2017 the road freight sector had only achieved a 1% reduction in emissions since 1990.
Concerning HGVs, the government has published plans introducing specific commitments and policies, with DfT produced in its publication “Decarbonising Transport Setting the Challenge”12 indicating that it aims to:
� Introduce new regulation of Heavy Duty Vehicle (HGV) CO2 emission standards
� Set binding CO2 emission reduction targets for HDV manufacturers of 15% by 2025 and 30% by 2030 (based on 2019 emission levels)
� Launch a joint research project with Highways England to identify and assess zero-emission technologies suitable for HGV tra¥c on the UK road network
� Undertake further emissions testing of the latest natural gas HGVs to gather evidence that will inform decisions on future government policy and support for natural gas as a potential near-term, lower-emission fuel for HGVs.
This establishes, for the first time, CO2 reduction targets for HDVs. Manufacturers face fines for non-compliance.
Box 4.3 UPS
“We think that support and incentives should take the front seat before regulations and restrictions, for the reasons we’ve been discussing, and examples we’ve looked at. That’s how you unlock innovation. There is a role for restrictions and regulations however, and they are necessary, but where they’re necessary they need to be done in a joined up way with long enough lead times to allow business to change its model and get the necessary investments in place, and ideally as much harmonisation as possible.”

21
The “Transport Decarbonisation Plan” was published by the Department for Transport on Wednesday 14 July 202113, and is the latest publication to set out principles that underpin the UK government approach to delivering the UK 2050 net zero-target, the path to net zero transport in the UK, and the wider benefits it can deliver. Regarding surface transport, the phase-out dates of new ICE LCVs and HGVs have been confirmed as 2030 and 2040 (subject to consultation) respectively (with a total phase-out of the sale of all non-zero emission vehicles 5 years later). For the rail sector, the ambition is to remove all diesel-only trains from the network by 2040 and in parallel to set a rail freight growth target. Regarding the maritime sector, indicative targets from 2030 will be introduced and consultation on the potential for a planned phase-out date for the sale of new non-zero emission domestic vessels will be conducted. Finally, consultations will start through the “Jet Zero Council” for aviation to reach net-zero in 2050 with a net-zero target for domestic aviation in 2040 (this should cover all airport operations and domestic flights), and, in the interim, to introduce a UK sustainable aviation fuels mandate.

22
5. Toward zero emissions in the freight sector: Technological fuel choices in logistics5.1 At a global level
The IPCC AR5 report in its transport chapter1 notes that a list of low-carbon fuels from natural gas, electricity, hydrogen, and biofuels (liquid or gaseous) could all enable the transport system to be operated with low to zero direct CO2 emissions, but the overall impact on climate would also depend heavily on their feedstocks and conversion processes (figure 5.1).
Natural gas or methane can be liquefied (LNG) to replace gasoline in vehicle engines after minor modifications to fuel and control systems and can also be used to replace diesel
but with significant modifications. LNG is already successfully used as fuel in some HGVs and ships. The energy e¥ciency of LNG is typically similar to that for gasoline or diesel but with a reduction of up to 25% in tailpipe emissions because of di�erences its carbon content3. However, full lifecycle analysis suggests lower net reductions, in the range of 10–15% for natural gas fuel systems4. As a consequence, according to the IPCC AR51, LNG can at most provide a bridge before the introduction of low-carbon fuels such as biomethane from biomass or waste.
Electricity in batteries can be used as a power source in
Fuel Advantages Disadvantages
Biodiesel • Domestically produced • Lower energy content than diesel • Can be blended in most diesel engines • More expensive • Reduced emissions of some criteria pollutants • B100 not suitable in low temperatures • Biodegradable, non-toxic • Potential engine issues if not used properly Renewable • Drop-in fuel for all diesel vehicles at all blend levels • Availability Diesel up to 100% • Potential land use impacts, although currently most • Can be domestically produced from renewable feed-stocks are waste products such as cooking oil resources or beef tallow • Reduced emissions Ethanol • Domestically produced from renewable resources • Flex-fuel vehicle required for higher blends above • Fuel cost comparable to gasoline 15% for 2001 model years or later • Lower emissions of some air pollutants • Lower energy content • Land use impacts, over 90% of ethanol produced from corn Natural Gas • Domestically produced • Non-renewable fuel • Relatively cheap fuel • Potentially higher greenhouse gas emissions from • Fewer emissions of some criteria pollutants leaked methane Propane • Domestically produced • Non-renewable fuel • Reduced emissions of some criteria pollutants • Few commercially available vehicles Electricity • Fuel can be produced everywhere • Limited driving range • The most energy e¥cient powertrain option available • Battery recharge time • Zero tailpipe emissions • Typically lowest fuel cost / mile Hydrogen • Can be produced with renewable resources • Fuel cost • Zero tailpipe emissions • Lack of fuel availability • Vehicle cost
Figure 5.1 Selected potential fuel alternative for the transport sector2

23
transport. It can be supplied to cars and vans via private and public charger points, and is presently relatively accessible in regions where the system has been installed. The technology for heavy goods vehicles would need the introduction of very rapid charger points (not yet developed) along the main network. In this case the carbon intensity of power grids directly a�ects emissions from the electrified transport system. Electricity from a typical coal-based power plant (1000 gCO2/kWh) would create higher emissions than an e¥cient petrol engine. Of course, using electricity generated from nuclear or renewable energy power plants, or from fossil fuel plants with carbon capture and storage (CCS) could result in near-zero fuel-cycle emissions for electric vehicles. For example, the present carbon intensity of the UK electricity network, on its way to full decarbonisation, was close to 180 gCO2/kWh on average in 20205. As the numbers of EVs in any country are unlikely to reach levels that significantly a�ect national electricity demand for at least a decade, it is expected that electricity systems will have time to partially decarbonize and be appropriately modified to accommodate the increase in charging requirement from EVs.
Hydrogen can be used in fuel cells or directly combusted in internal combustion engines. Hydrogen can be produced by the reforming of coal or natural gas (steam methane reforming is well-established in commercial plants, though CCS technology would have to be added to these plants for the hydrogen to be low-carbon), the feedstock for this technology could also come from biomass. Hydrogen produced commercially via electrolysis using electricity from a range of sources including renewable or from biological feedstocks is still relatively expensive. Hydrogen use in vehicles produces zero tail pipe emissions of carbon and other air pollutants; the full lifecycle emissions will again depend on the feedstock and technology used for production. Deployment of hydrogen in transport would need to be accompanied by large investments into hydrogen production, distribution and vehicle refuelling infrastructure. (Box 5.1 and Box 5.2)
A variety of liquid and gaseous biofuels can be produced from various biomass feedstocks using a range of conversion pathways. The ability to produce large volumes of biofuels cost-e�ectively and sustainably is a primary concern. Liquid biofuels are relatively energy-dense and are, at least in certain forms and blend quantities, compatible with the existing oil fuel infrastructure and with all types of internal combustion engines (including shipping and aircraft). Ethanol and biodiesel can be blended at low levels (10–15%) with petroleum fuels in the present fleets. Much higher blends, as exemplified by ‘flex-fuel’ gasoline engines where ethanol can reach 85% of the fuel blend, are already in extensive use in Brazil. However, ethanol energy density is 35% lower than gasoline, creating problems, especially for aircraft. Synthetic ‘drop-in’ biofuels have similar properties to diesel and kerosene fuels.
They can be derived from a number of possible feedstocks and conversion processes, such as the hydro-treatment of vegetable oils or the Fischer-Tropsch conversion of biomass. Bio-jet fuels suitable for aircraft have been demonstrated to meet the very strict fuel specifications required. Biofuels have lifecycle GHG emissions that are typically 30–90% lower per kilometre travelled than those from oil- derived fuels. However, indirect emissions—including from land use change to provide enough feedstock—can lead to greater total emissions than when using petroleum products. Policy support for biofuels needs to be considered on a case by case basis. Technologies to produce ligno-cellulosic or algae-based biofuels are in development, but may need another decade or more to achieve widespread commercial use. These second generation feedstocks impact less on land use and not at all on agricultural land as only marginal land is required to provide the growing areas for production6. This report indicates that 3.2–14.0 million km2 of degraded or abandoned land can be considered available for energy crops, depending on the sustainability criteria and economic considerations included in the analysis.
Box 5.1 Wincanton
“We are keen to consider hydrogen, as hydrogen is a green option and solves the range problem that we will experience with batteries; we are really, really excited about hydrogen. The current downside is the cost – at the moment the trucks are expensive and so are the electrolysis machines required to generate the hydrogen; but these will come down in price as competition grows.”
Box 5.2 Suttons
“My view is that for commercial vehicles hydrogen's probably going to be the short to medium term solution – and longer term, maybe electric technology with exchangeable batteries or faster charging.”
24
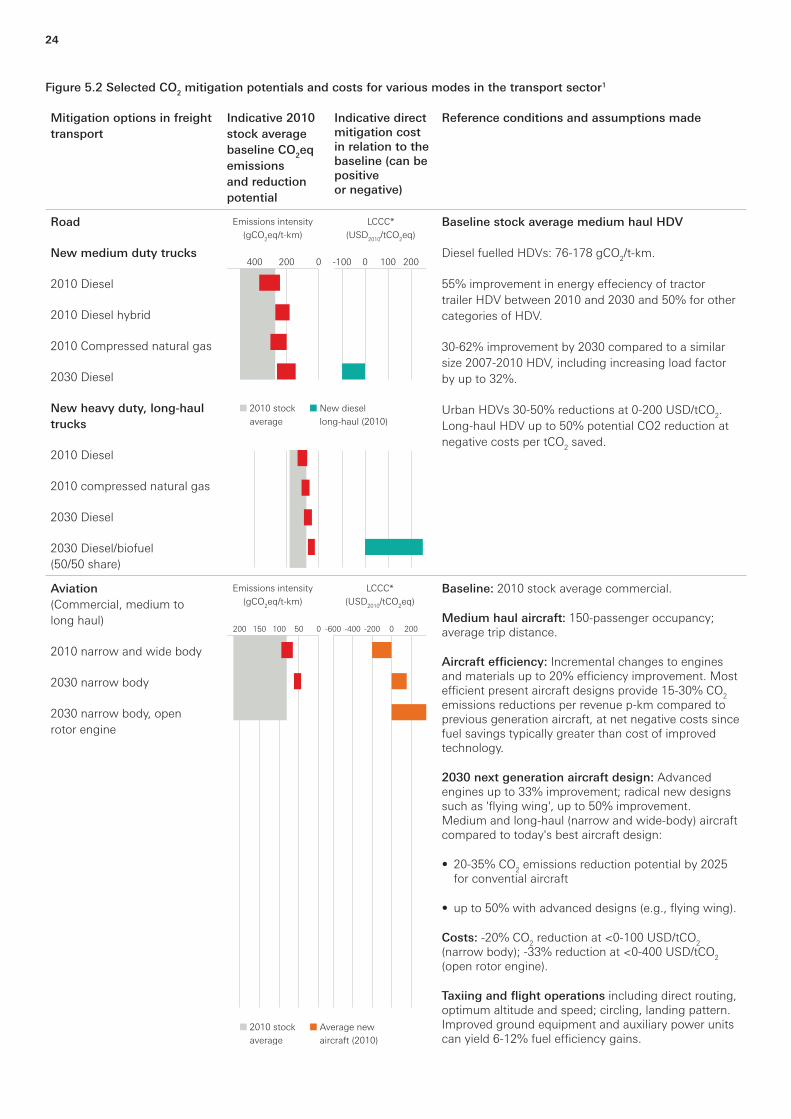
Figure 5.2 Selected CO2 mitigation potentials and costs for various modes in the transport sector1
Mitigation options in freight transport
Indicative 2010 stock average baseline CO2eq emissions and reduction potential
Indicative direct mitigation cost in relation to the baseline (can be positive or negative)
Reference conditions and assumptions made
Road
New medium duty trucks
2010 Diesel
2010 Diesel hybrid
2010 Compressed natural gas
2030 Diesel
New heavy duty, long-haul trucks
2010 Diesel
2010 compressed natural gas
2030 Diesel
2030 Diesel/biofuel (50/50 share)
Emissions intensity(gCO2eq/t-km)
LCCC*(USD2010/tCO2eq)
1000-100 2000200400
2010 stockaverage
New diesellong-haul (2010)
Baseline stock average medium haul HDV
Diesel fuelled HDVs: 76-178 gCO2/t-km.
55% improvement in energy e�eciency of tractor trailer HDV between 2010 and 2030 and 50% for other categories of HDV.
30-62% improvement by 2030 compared to a similar size 2007-2010 HDV, including increasing load factor by up to 32%.
Urban HDVs 30-50% reductions at 0-200 USD/tCO2. Long-haul HDV up to 50% potential CO2 reduction at negative costs per tCO2 saved.
Aviation (Commercial, medium to long haul)
2010 narrow and wide body
2030 narrow body
2030 narrow body, open rotor engine
Emissions intensity(gCO2eq/t-km)
LCCC*(USD2010/tCO2eq)
-400 0-600 200050100
2010 stockaverage
Average newaircraft (2010)
150200 -200
Baseline: 2010 stock average commercial.
Medium haul aircraft: 150-passenger occupancy; average trip distance.
Aircraft e¥ciency: Incremental changes to engines and materials up to 20% e¥ciency improvement. Most e¥cient present aircraft designs provide 15-30% CO2 emissions reductions per revenue p-km compared to previous generation aircraft, at net negative costs since fuel savings typically greater than cost of improved technology.
2030 next generation aircraft design: Advanced engines up to 33% improvement; radical new designs such as 'flying wing', up to 50% improvement. Medium and long-haul (narrow and wide-body) aircraft compared to today's best aircraft design:
• 20-35% CO2 emissions reduction potential by 2025 for convential aircraft
• up to 50% with advanced designs (e.g., flying wing).
Costs: -20% CO2 reduction at <0-100 USD/tCO2 (narrow body); -33% reduction at <0-400 USD/tCO2 (open rotor engine).
Taxiing and flight operations including direct routing, optimum altitude and speed; circling, landing pattern. Improved ground equipment and auxiliary power units can yield 6-12% fuel e¥ciency gains.

25
Figure 5.2 (Continued) Selected CO2 mitigation potentials and costs for various modes in the transport sector1
Baselines of stock average fleet compared with 2010 new vehicles and 2030 projected vehicles based on available data. Note: LCCC is the Levelised cost of conserved carbon.
Mitigation options in freight transport
Indicative 2010 stock average baseline CO2eq emissions and reduction potential
Indicative direct mitigation cost in relation to the baseline (can be positive or negative)
Reference conditions and assumptions made
Rail (Light rail car)
2010 electric, 600 g CO2eq/kWh
2010 electric, 200 g CO2eq/kWh
Emissions intensity(gCO2eq/t-km)
LCCC*(USD2010/tCO2eq)
-400 0-600 200050100150200 -200
Baseline: 2010 electric medium haul train.
Based on electricity grid 600 g CO2/kWh: 3-20 g CO2/ p-km.
2010 light rail: 60-passenger occupancy car:
• CO2 reduction at 4-22 g CO2/p-km;
• Infrastructure cost 14-40 million USD/km.
2010 metro:
• CO2 reduction at 3-21 g CO2/p-km;
• Infrastructure cost 27-330 million USD/km.
2010 long-distance rail:
• 45-50% reduction in CO2/p-km (augmented if switch to low-carbon electricity).
• 14% reduction in operating costs (allowing for increase in speed and with energy costs excluded from cost calculation.
• 8-40% e¥ciency gains (12-19 g CO2/p-km).
• Infrastructure cost 4-75 million USD/km.
Potential GHG savings from eco-driving 15%; regenerative braking 13%; mass reduction 6%.

26
Figure 5.2 presents the potential improvements in emission intensity, and the cost implications, found in the analysis conducted during the IPCC AR51 regarding freight transport at the global level. It shows that, for HGVs, up to a 50% reduction in energy intensity by 2030 appears possible at negative societal cost. LCCC is a metric for identifying the costs of emission mitigation; LCCC can become negative when annual benefits exceed investment costs in comparison to a base line scenario, e.g. when energy e¥ciency measures reduce expenditures for fuels, because of the very large volumes of fuel used by HGVs.
HGVs used in urban areas (with duty cycle not requiring as much annual travel and fuel use as for long-range transport) have a wider range of potential options and costs to mitigate emissions, reaching above 100 US$/tCO2. For LCVs, e¥ciency improvements of 50% in 2030 are technically possible compared to 2010, with some estimates in the literature even higher. Virtually all of these improvements appear to be available at very low (if not negative) societal costs. Electric vehicles have a CO2 reduction cost highly correlated with the carbon intensity of electricity generation: using relatively high carbon intensity electricity systems (500–600 gCO2/kWh), electric LCVs save little CO2 compared to internal combustion engines and the mitigation cost can be many hundreds of dollars per tonne; for very low-carbon electricity (below 200 gCO2/kWh) the mitigation cost drops below 200 USD2010/tCO2. In the future, with lower battery costs and low-carbon electricity, electric LCVs could drop below 100 US$/tCO2 and even approach zero net cost. (Box 5.3)
For virtually all types of ships including container vessels, bulk carriers, and oil tankers, the potential reduction in CO2 emissions is estimated to be over 50% taking into account a wide range of changes. Due to the large volume of fuel used annually by these ships, the net cost of this reduction is likely to be negative7.
New commercial aircraft, over the last decades, are significantly more e¥cient than the models they replace, and provide CO2 reductions at net negative societal cost when accounting for fuel savings over 10–15 years of operation. An additional 30–40% CO2 reduction potential is expected from future new aircraft in the 2020–2030 time-frame, but the mitigation costs are uncertain and some promising technologies, such as open rotor engines, appear expensive and are not yet in commercial use8.
Box 5.3 UPS
“Per unit of energy, electricity is cheaper than diesel but…if we can drive that down even further, then that will help reduce the overall operating costs of the EVs, help overcome the fact that for the moment they are still in capital cost terms more expensive than diesel. That’s the challenge…They should in the longer term be cheaper because they’re simpler, there are fewer moving parts.”
Finally, decarbonisation of rail transport happens through the electrification of the network and the use of low-carbon electricity9. Potential improvements vary geographically: up to 35% energy e¥ciency improvements for United States rail freight and 46% for European Union rail freight have been forecast for 2050. In Europe improvements could bring a 10–12% reduction in operating costs, though the required capital investment in infrastructure and equipment is expected to be high.
Regarding biofuel used for substitution or blended in all modes, they have the potential for large CO2 reduction, although net impact assessments are complex. The cost per tonne of CO2 avoided is highly dependent on the net CO2 reduction (including lifecycle emissions), the relative cost of the biofuel compared to the base fuel (e.g., gasoline or diesel), and any technology changes required to the vehicles and fuel distribution network in order to accommodate new biofuels and/or blends.
5.2 At a UK level
The choices of technological improvements or fuel switch for the UK market are identical to what is available at the global level and has been discussed above. However, the UK Government, via legislative decisions, can provide incentives and pushes toward specific fuel substitute choices.
In 2018 the National Infrastructure Commission, under its “Future of Freight” program, commissioned a report focusing on the land-based freight sector for the UK10.
The report acknowledges that technologies to enable electric HGVs are less developed than for cars and vans (LCVs), because alternatives to large diesel vehicles do not yet exist on the market, most are currently in the engineering development phase with very few early prototype testing. As a consequence, the report scopes di�erent technologies for HGVs and LCVs and concentrates on di�erent fuels and technologies for each type of freight.
Starting with rail and HGVs, they analyse the introduction of biofuels, synthetic fuel, hydrogen, E-highway, rail electrification and LPG10. As mentioned before, several technological issues must be overcome before any of the new fuels proposed for the HGVs and trains are ready to be adopted by operators. The first conclusion is that there would be a mix of technologies in

27
use to reach the 2050 net-zero target. Biofuels can contribute to reducing carbon emissions in comparison to diesel. However, they have life cycle emission and present scalability issues (large production of feedstock and competition with food production). They may be a bridge while other technologies develop. Biofuels are as such seen as important during the transition timeline (Box 5.1). Synthetic fuels, like biofuels, would be easily used in present day engines (minimal adaptation), but they are not considered viable for HGV and trains. This is driven by economic considerations (carbon capture and production are energy-intensive) as well as environmental considerations (continuing tail pipe emissions of CO2 and other pollutants). Electrification of the highway and rail networks would involve very significant upfront capital investment; this solution is adapted only to motorways and mainlines with high freight flows. HGVs and trains may need another power source to operate outside of
Box 5.4 John Lewis Partnership
“We did a rough calculation that for a typical distribution centre where you might have 100 heavy trucks, and if you’re going to charge them all overnight, you would need 12 MW. That just isn’t going to happen. I think Heathrow for example has got a 12 MW supply. No one is going to buy the trucks until the infrastructure is there.”
the electrified network. Batteries seem a preferred choice in that case (already in use in cars and vans) but limitations will have to be overcome in term of capacity/range, mass/volume of the unit and charging speeds/charging point availability. (Box 5.4)
The costs of battery or over-head electrified HGVs have been reviewed in recent modelling work11. Powered by an increasing share of renewable electricity produced at the European scale, the ownership cost of electric HGVs (vehicle purchase, operation and fuel) becomes lower than the similar diesel reference around 2030 as seen in figure 5.3 (the grey bars representing battery HGV). Obviously the cost of ownership of an electric HGV depends on the electricity price and the battery costs. For example, a reduction in battery costs by 42% in 2030 would accelerate the competitiveness of electric HGVs by 5 years (to 2025).
Figure 5.3 Total cost of ownership of HGV.11
Note BEV= battery, OC-BEV= overhead and battery, FCE= fuel-cell, ICE= internal combustion engine with PtL= synthetic diesel and PtM= synthetic methane)
Year of purchase
20252020 20300
£100K
£200K
£300K
£400K
£500K
£600K
£700K
Cos
ts p
er v
ehic
le o
ver fi
rst u
se p
erio
d
Fossil diesel referenceBEV
OC-BEVFCEV
ICEV_PtLICEV_PtM

28
One hurdle to HGV sector decarbonisation seems to be that, while alternative technologies are already available for LCV (EV technology), OEMs have been slow to introduce new types of decarbonised trucks on the market. They are waiting for more certainty of the demand from the road haulage companies as well as the type of infrastructure to be developed around the road network. The regulations presented in the previous section (ban of ICE HGV sale after 2040) will indeed drive high demand for zero-emission HGVs, but the sector will need to step up its R&D e�orts and start deploying new vehicles to commercial operations within the next decade. In the UK this will be supported by the R&D funding to boost the UK’s transition to zero emission road freight announced 27th of July 202112.
For the LCVs, the report10 focuses on a larger number of options for HGVs: BEV, PHEV but also biofuels, LPG and hydrogen (in fuel-cells or dual-fuel systems). For the battery-powered vehicles, range and charging times are still regarded as potential problems, but with recent improvements, there are a number of operators already using them for last-mile deliveries. Plug-in hybrids have an internal combustion engine in addition to electric batteries to overcome the range limitations but present high complexity and are not zero emissions when powered with oil-derived fuels. Once again hybrid vehicles are seen as a bridging technology toward zero emissions using full electric power. The electrification of LCV fleets may also create local problems in the electricity infrastructure when large number of vehicles are plugged into the system at the same time. (Box 5.5)
Biofuels can be introduced as liquid or gas in the LCV fleet. As for HGVs the biodiesel could be blended with diesel or after technical adaptation used directly in the diesel-powered
vans. Biogas (bio-LPG or bio-methane) is stored in liquid form in high-pressure tanks and used in conventional internal combustion engines. Once again, feedstock availability and sustainability are the main issues related to biofuels (Box 5.1).
Finally, hydrogen can be introduced in fuel cell or dual-fuel vans. A fuel cell vehicle employs hydrogen fuel cells to charge a battery which then powers an electric motor in the normal way. On vans, this option is used as a range extender with rapid refuelling of hydrogen tanks achieving zero emissions. A mix of hydrogen and diesel can be used in dual-fuel systems, but once again this would not achieve zero emissions. For hydrogen, the present high costs and a lack of refuelling infrastructure are seen as two of the main problems. However, in the UK it is regarded as a safe, clean energy source (when produced from green electricity or with CCS) which could dramatically cut carbon emissions for LCVs (and cars) even if the investments in hydrogen infrastructure are thought to be high.
The electrification of surface transport or the use of hydrogen has implications for electricity demand. All the short-listed options for road and for rail would likely result in an increase in the UK’s total demand for electricity. In the case of electric vehicles, the grid would need to be reinforced to enable high-speed charging at key locations. A potential benefit of electrification would be o�-peak charging at least for vans not in use overnight (last-mile delivery). The requirements that hydrogen (or synthetic fuel) will place on the grid would depend on the chosen methods and models of production, but to achieve zero emissions production of these fuels, would require the use of decarbonised electricity and localised grid reinforcement around the production sites (Box 5.4 and Box 5.5).
Box 5.5 UPS
“Our vehicles don’t stop long enough during the day for that (recharging) to be feasible. They’re multi-drop, they’re stopping for maybe one or two minutes at a time. They can’t stop to plug in. So, the recharging has to be back at depot overnight and there’s plenty of time for that to happen, but when they’re all plugged in, if the whole fleet is plugged in simultaneously we rapidly exceed the capacity of the power supply infrastructure into the building. We formed a consortium of organisations and we got some government support from Innovate UK who were very helpful, without a doubt, they’ve been great allies of our innovation programme, and we developed what we believe was, maybe still is, the world’s first combined smart grid and energy storage solution at a fleet scale. And it had the e�ect of trebling the number of EVs that we could recharge in our Central London building without any further infrastructure upgrades. And it did it by simply managing the supply of energy into the building and continually monitoring what that grid capacity threshold was, and metering the supply to the vehicles so that they could be recharged in a more progressive, a staged manner, instead of all absorbing power at the same time.”

29
The latest review on aviation and emission mitigation targets for the UK has been published by the CCC as part of its sixth carbon budget report13. In their pathway, sustainable fuels will contribute 25% of liquid fuel consumed in aviation in 2050, with just over two-thirds of this coming from biofuels and the remainder from carbon-neutral synthetic jet fuel (produced via direct air capture of CO2 combined with low-carbon hydrogen, with 75% of this synthetic jet fuel assumed to be made in the UK and the rest imported). These are additive fuels to normal jet-A kerosene from fossil fuels, reducing the carbon intensity of air travel, but the sector would not be able to achieve zero emissions in this way. Net zero could be targeted through the use of (somewhat controversial) emission o�set systems (for example: land use, renewable energy, GHG direct air capture). Aircraft fleet e¥ciency improvements, achieved via a combination of airspace modernisation, operational optimisation, aircraft loadings, aircraft design and new engine e¥ciency improvements is also accounted for in the emission reduction but to limited e�ect. The introduction of electric or hybrid aircraft is not considered for the 2050 target by the CCC. (Box 5.6)
Box 5.6 UPS
“The challenge for many industries is their airlines. Frankly, in that regard, the technologies to decarbonise the airline on an SBTi route map, they just don’t exist. It’s not a lack of willingness, they’re just not there. (SBTi = Science Based Targets initiative). We have set a goal of 30 percent Sustainable Aviation Fuel (SAF) by 2035 and continue to participate in initiatives like the Sustainable Air Freight Alliance to help promote responsible freight transport.”
Finally, the same report also analyses the potential mitigations in maritime transport13. The low- emission fuel considered is ammonia, because of the potential to retrofit ship engines to use this fuel, and the higher energy density of ammonia compared to hydrogen and batteries. In the analysis, 75% of UK ammonia demand is assumed to be produced in the UK, using low-carbon hydrogen, with the remainder imported (made abroad using renewable electrolytic hydrogen). Commercial deployment starts in 2030, with domestic shipping decarbonising faster than international shipping. Ammonia (NH3) delivers the large majority (87%) of the emissions savings from shipping, the remainder is produced by fleet e¥ciency improvements (slow steaming, operational optimisation and ship hull design) (Box 5.7). Biofuels were excluded from this scenario as the overall analysis of the best-use of bioenergy shows that use of biofuels in shipping achieves lower emission savings compared to uses in other sectors (e.g. aviation) and feedstocks are limited. Electrification is used in a limited number of hybrid and full electric propulsion vessels (mostly short-haul ferries). Ammonia is also a more e�ective way of storing hydrogen than high pressure cryogenic tanks and could be a solution to storage-on-board of hydrogen. (Box 5.8)
Box 5.7 CalMac
“Changing the shape of the bow of the vessel can reduce the drag which significantly increase e¥ciency, saving fuel and reducing our emissions. The business case from CalMac’s perspective would be compelling with the pay back from fuel savings in say 10 years.”
Box 5.8 CalMac
“The average life of one of our ferries is about 35 to 40 years. Technology we're bringing on now needs to be - or it needs to have the capability to be - modified to essentially be emission-free say in 10 years. In Scotland, the emphasis at the moment, and I think it's the same across the whole of the UK's maritime industry, is on hydrogen technology, hydrogen storage, and decarbonisation of the electricity grid so that we can then look at electrical options as well.”

30
6. Toward zero emissions in the freight sector: Non technological improvements towards higher e�ciency in logistics6.1 At a global level
Any improvement in e¥ciency of the total freight transport and logistic system, as well as in components of it, would make it easier and cheaper to reach the net-zero target.
The IPCC AR51 has analysed this side of the freight trade in its chapter on transport. Again the analysis is done at a global level. Some changes such as modal shifts due to business behavioural change, uptake of e¥cient vehicles, improved engine performance technologies, investments in related infrastructure, and changes in the built environment o�er good mitigation potential. For example, improvements in the emission intensity of logistic and freight operations could bring ~18% reduction in CO2/t-km from: speed reduction (7% reduction); optimized networks (5%); modal switch (4%); and reduced congestion (1%). It has also been reported that eco-driving-schemes in freight can achieve 12% fuel consumption savings2.
Over the medium term (up to 2030) reducing emissions from transport is possible by densifying urban landscapes, sourcing localized products, internet shopping, restructuring freight logistics systems, and utilizing advanced information and communication technologies. Over the long-term (toward 2050 and after) further reductions are envisaged through urban (re)development and investments in new infrastructure, linked with integrated urban planning, transit-oriented development and more compact urban form. Such mitigation measures could evolve to possibly reduce GHG intensity by 20 – 50 % below a 2010 baseline by 2050.
Over the past few decades, air and road have increased their global share of the global freight market due to economic development and some related changes in the industry and commodity mix. Increasing the rail share will be di¥cult, because of the ‘structural inelasticity’ of the system confining shorter distance freight movements to the road network (higher network density). However, if growth in global truck travel between 2010 and 2050 could be cut by half from the projected 70% increase expected and shifted to the rail systems, about a 20% reduction in fuel demand and CO2 could be achieved without any fuel switch. Longer-term changes need to take account of the di�erential rates at which low-carbon technologies could impact on the future carbon intensity of freight modes. The rate of carbon-related technical innovation, including energy e¥ciency improvements, has
been faster in HGV than rail freight and the HGV replacement rate is typically much higher, which ensures a more rapid uptake of innovation. As a consequence, the flexibility of road transport in comparison to rail may be an advantage in terms of adapting to low-carbon technologies in the sector.
For international trade, opportunities for switching freight from air to shipping services are limited. The two markets are relatively discrete and the products they handle have widely di�ering monetary values and time-sensitivity. The deceleration of deep-sea container vessels in recent years in accordance with the ‘slow steaming’ policies of the shipping lines has further widened the transit time gap between sea and air services.
Finally, the potential for various mitigation options varies from region to region, influenced by the stage of economic development, the status and age of the existing vehicle fleet and infrastructure, and the fuel availability in the region. In OECD countries, transport demand reduction may involve changes in lifestyle and the use of new information and communication technologies. In developing and emerging economies, slowing the rate of growth of conventional transport modes with relatively high carbon emissions by providing a�ordable, low-carbon options could play an important role in achieving global mitigation targets.
6.2 At a UK level
Operators aim to maximise e¥ciency and minimise costs of any logistic firm, but there are opportunities to go further, estimated at 9-11% in the latest CCC analysis3. The improvements are driven by the following:
� Increasing availability of data (vehicle telemetry – the in-situ collection of measurements or other data at remote points and their automatic transmission to receiving equipment) increases e¥ciency savings through route optimisation. (Box 6.1)
� The creation of urban consolidation centres where goods are delivered to the outskirts of towns, is reducing the use of larger vehicles in town centres and allowing consolidated delivery, reducing the number of trips. Urban consolidation centres could reduce the number of vehicle movements by 50-85% and are cost-e�ective4.
31
� Standardisation of data across the industry would allow optimal consolidation and load pooling (Box 6.1).
� Relaxing delivery time to avoid congestion (rush hour), speeding up delivery times and improving e¥ciency of the delivery by vehicle adaptation (Box 6.2). For example, allowing delivery vehicles on bus lanes coupled with dynamic analytics-based routing could reduce emissions by 10% and costs by 30% (Box 6.3).
� Reducing empty-running that has increased over recent years due to faster delivery time and just-in-time supply chains (these factors alone could lead to a 36% increase in urban last-mile deliveries by 2030) (Box 6.1).
� Improved logistics (such as using urban consolidation centres, extending delivery times, reduce empty running and use of larger heavier long haul HGVs) could reduce emissions by between 9% for small rigid HGVs and 11% for articulated HGVs by 2030 (Box 6.3).
There is also potential for emissions reduction through modal shift of freight. Moving freight by rail can reduce CO2 emissions for a shipment by 76% in comparison to road haulage5. Analysis shows that rail freight could increase by around 12% (maximum 69%) by 2030. In the short term, therefore, rail could aid decarbonisation of the freight sector. However, it is expected that, in the longer term, zero-emission HGVs will be available sooner than it will be possible to completely electrify rail freight.
In summary, surface transport demand in the UK is forecast to increase by 10-20% from today’s level by 2050. Reducing demand by improvement in vehicles and operations is cost-e�ective and delivers significant co-benefits (tra¥c reduction, road safety increase) but zero emissions in the UK freight sector can only be achieved by switching to decarbonised fuels in the transport sector.
Box 6.1 Suttons
“Clearly if we can prevent empty mileage it is good for the environment and it's good for us as a business, because if a truck is moving and it hasn't got something in the back it's costing us money… And you know if you planned every truck in the UK as e¥ciently as you could, you could probably reduce the fleet of trucks in the UK by at least 25-30% and still do the same amount of work. Over recent years we have been going to customers and saying, actually we can do this a di�erent way, so rather than you having a completely dedicated fleet, what would happen if we move some of your product in shared vehicles. We can reduce the total mileage run on the contract, and obviously that allows us to be competitive when we tender for work, but also reduces empty mileage which in turn reduces carbon emissions.”
Box 6.2 John Lewis Partnership
“We need to look at how we can make the frozen delivery more e¥cient. For instance, there’s a conventional door on the van, so every time you open the door, air at minus 20 disappears, and then you have to cool it down again. If you had something more like a chest freezer, with loose bags rather than crates, then you would retain most of that cold air. But we’re just in the early stages of looking at di�erent solutions. Our fridges are all specified to allow for the normal rules around the cold chain being slightly abused. People with a fridge van or fridge trailer, are supposed to open the doors for a minimum at a time and close them again, but we design-in extra cooling capacity for resilience.”

32
Box 6.3 Wincanton
“The cost to operate a vehicle, is roughly, one third for the vehicle, including maintenance and insurance, one third for the driver, and then one third for the fuel. Fuel is a big cost, so we already work hard to improve our fuel economy, which also reduces our emissions. Our Winsafe driver training programme concentrates on safe and e¥cient driving but there is only so far we can go with driving the vehicle e¥ciently…we will need to do something di�erent if we want to hit net zero. The current consumer delivery model could be more e¥cient and therefore reduce the impact to the environment – at the moment the focus is on ‘Delivery next day’ not on how the delivery could be most e¥cient.”
33
7. Specific Insights from the interviews: Views from UK transport businesses The previous sections have highlighted the scale and complexity of challenges facing significant decarbonisation in UK transport, and the opportunities available. This section steps away from the wider research landscape of high-level policy and data, and instead considers in detail what the interviews revealed about how some of the UK’s decision makers in transport businesses are responding to these issues. Here we highlight some of the key areas in which interviewees characterised the landscape for change in their eyes, and the challenges and opportunities they perceived within this for them. This includes: the shifts currently taking place in the climate change agenda; companies’ control over emissions; the technological pathways available to di�erent types of business; the case for short-term and long-term emissions savings; new business models and partnerships; and the debate over a first-mover advantage. Whilst we cannot generalise from these insights given the small number of interviews undertaken, they do provide a valuable window into the perspective of individual businesses on net zero in transport.
7.1 Businesses feel that the climate change agenda is shifting rapidly
Complying with current and forthcoming transport regulations is a given; but responding to a variety of other internal and external stakeholders is increasingly important. Preparing data, putting in place policies and reporting systems are the first steps to respond to this shift, and in making a case for climate action to senior leaders. This would place companies in a good position if and when requests from further down the supply chain come for low-carbon services and/or footprint data.
Reflecting the evolution in the policy landscape described earlier, the businesses that we spoke to all appreciated the growing importance of climate change, not just as an overall goal for the UK, but an issue for their businesses specifically. Many noted that this had shown an uptick recently (Box 7.1). Some of the businesses we spoke to had already committed
to ambitious corporate decarbonisation strategies: all of them had considered how their businesses might substantially reduce emissions.
A variety of di�erent factors were identified behind this shift. External media interest was cited. Some businesses mentioned the communication benefits of visibly changing their fleet to more low-carbon options, particularly in engaging customers. However, other sorts of business stakeholders also appear to be pressing for greater attention to carbon emissions reduction. Investors, and the UK finance community more widely, were definitely – and perhaps unsurprisingly – mentioned, given the traction that climate change and net zero has gained in the finance sector. As a result, companies were placing increasing emphasis on reporting their carbon emissions, whether internally, externally, or both. However, we also heard that interest from employees in working for a sustainable employer was also a factor. One director reported how impressed he had been to discover the level of engagement in the company’s employees and their willingness to contribute sustainability ideas.
Section 2 described how freight transport can be characterised as a derived demand, as it facilitates the delivery of other goods and services. From a carbon perspective, freight transport can similarly be viewed as an important constituent of the footprint of the full value chain. There was general agreement amongst the businesses we spoke to that the environmental impact of freight in the supply chains of their downstream customers was increasingly relevant, as more companies turned to consider their indirect (“scope 3”) emissions. Although interviewees did not feel urgent or immediate pressure from all of their customers, they had received requests to supply carbon emissions data, especially when bidding for contracts, and to demonstrate carbon emissions policies. These requests suggested that getting systems in place to deal with greater supply chain scrutiny is very prudent. For companies with public sector clients, national commitments to net zero provided a much clearer
Box 7.1 Wincanton
“It feels that since February this year (2021), it has got to the point, when every day, somebody would come and ask me, what are we doing to get to net zero – the interest in net zero has literally ramped up...”
34
link to the need for action to support their customers’ emissions goals.
The landscape of regulation already described in Section 4 had provided an unequivocal impetus in this sector for the interviewees. For road transport, the shift to decarbonise vans and LCVs in the medium term, meant that businesses overall agreed that diesel fuel is now on its way out. For shipping, new regulations were also driving additional steps to be taken such as ordering new vessels that have the ability to use shore-to-ship power when at port or can be retrofitted with newer low-carbon emitting engines in the future. Regulation in these parts of the transport sector means that action for those a�ected has become non-negotiable. For businesses with HGV-reliant fleets, whilst the most recent government strategy indicates that a transition to zero emissions is needed for these vehicles, the dates and detailed policy is still being formulated*. The basis for decision making is correspondingly less clear, and is discussed further later in this section.
7.2 Changing what you control is the obvious starting point
The easiest wins for companies are within those areas of greenhouse gas emissions that they can control directly. From the long list of actions that lie along the route to net zero, these are the things that companies can focus on ticking o� first.
For businesses at the early stages of forming climate strategies, interviewees suggested that there are certain steps that can usefully be taken. Getting Board-level attention to climate change is a pre-requisite. A strategy for identifying and prioritising issues material to the business is also extremely sensible from a strategic perspective. Putting in place systems and resource to capture data on emissions is also a fundamental building block (Box 7.2). However, for the transport sector, this can to some extent draw on current reporting structures, given that fuel is a significant existing cost, and systems may already exist to track it. Data on emissions can in turn furnish information to make a convincing business case for action to the Board, and further provides a basis for target setting, and subsequently tracking progress. What was really evident - and often inspiring - from the interviews with transport decision makers is that the role of
Box 7.2 CalMac
“The main action undertaken in the last couple of years is to develop and implement a system taking us from a very manual fuel reporting, to a more automated fuel reporting. It still requires data input from the vessel, but reduces the frequency of input, and brings it all into a database where we can extract the data much more easily. The data is used by myself for all the carbon calculations, but is also used by Finance, who audit the fuel deliveries, match invoices and all that kind of stu�. So that's (reporting) been pretty successful.”
motivated and knowledgeable individuals appears to be very significant in making positive change happen.
When interviewees thought about the practicalities of addressing their carbon emissions, the boundaries of control over their activities were often a key consideration. As a starting point, it made sense for interviewees to focus on action in their direct or owned operations. Reducing emissions from purchased, sub-contracted or out-sourced services can be a more di¥cult proposition. Examples include freight services contracted through other parties, services where the company only supplies a driver for a third-party vehicle, or even warehouses managed on behalf of customers. Challenges arising from these activities included the negotiation of “green” contract terms, or obtaining emissions data from the sub-contractor. Here businesses may find that making the case for reductions is more complex when ownership and operational costs are split between parties. This can play out in unforeseen ways, for instance matching the longer-lived asset depreciation of electric vehicles to existing lease periods. Nevertheless, some of the businesses we spoke to were already tackling this challenging area.
Overall, the message is that reaching a fully net-zero position for freight will in general terms involve collaboration across supply chains and shared incentives. In specific terms for UK businesses, the structures of their commercial relationships will create a di�erent composition of activities and hence di�erent emissions profiles arising from them. Therefore, each business must find an individual route towards an eventual “net zero” outcome. Finally, when considering control and responsibilities, the barriers of technology and infrastructure present major variables that are outside companies’ individual control, and these will be considered next.
7.3 There are distinctive technology pathways depending on the nature of the fleet, and stable policy support will be vital
The comparative maturity of the electric vehicle market for lighter vehicles and shorter routes gives those who operate in these markets more distinct short-term choices. For businesses whose operations rely on HGVs and long-haul journeys, the low-carbon vehicle market is not mature, and the pathway is much less clear. Links to supply chains could be important, but
*The latest Transport Decarbonisation Plan will have addressed some of these concerns, but the interviews were conducted before this document was published, and reflect interviewees’ perceptions at that time.

35
government support is needed to provide certainty and deliver the huge change in infrastructures required.
The nature of the technological options open to each business was a key factor in shaping their ability to consider options for decarbonising, and again closely linked to the nature of their operations. Whilst we noted above that there was a general feeling amongst businesses that fossil fuels now had a limited lifespan for transport in the UK, the ability for them to make changes and the timescale in which this might happen varied, depending on the nature of the transport used by each business. For those operating with smaller sizes of vehicles, such as direct-to-consumer food or parcel deliveries, electrification of the fleet is the clear option. For companies operating larger vehicles, or those in the maritime industry, more radical innovation is needed to provide alternative fuels, with no single leader identified by interviewees amongst the technological options at the moment. As explained in Section 4, policy uncertainties also remain in this area, although the government’s recent commitments indicate its long-term aims. In business terms, this translates to significant uncertainty for decision-makers.
Many of the technological hurdles that remain to be overcome, and which were described in Section 5, impact directly on business choices and current ways of working. For electric vehicles, key challenges are that the range is greatly reduced, making these vehicles potentially problematic on long-haul journeys (one business believed their range to about a third of what they needed), and there were further concerns about having to change routes to locate charging points. In addition, businesses believed that additional systems would be needed to monitor electric fleets, in order for managers to view charging status and to optimise charging times and tari� use. Overhead electricity models were mentioned as another possibility and an alternative to reliance on batteries and charging.
Hydrogen or biomethane could therefore be a better option for long-haul and larger freight, as the greater potential range was considered to be more in line with what would be needed for HGV routes. The concept of “filling up” vehicles with hydrogen was also reassuringly familiar as a substitute for diesel to some of the interviewees, and as such it was held as
an easier substitute when route planning, and hence less of a shift in existing practice. Yet interviewees were also aware that the anticipated cost of innovative vehicles (in particular HGVs) is high, and currently not even available at scale on the commercial market. For these reasons, some businesses favoured the more immediately available options of “drop-in” fuels or LNG. These can deliver some carbon savings with very little change in current operational practice (Box 7.3).
As just indicated, the development and di�usion of commercially available low-carbon LCVs and HGVs is a barrier to business action. Concern was expressed by the businesses we spoke to about manufacturers’ ability to deliver a supply of low-carbon vehicles at the scale needed for net zero. For electric LCVs, the issue raised was that if these become mainstream, then manufacturers might not be able to meet a hugely increased level of demand. For HGVs, interviewees were aware that several options were under development. Companies involved in freight may have developed long-term relationships with particular vehicle brands, and therefore the implied choice could be to either change their established supplier to access their preferred low-carbon technology, or to follow the option that their existing supplier is backing. Interviewees also raised related issues around maintenance, and how existing maintenance contracts with suppliers might alter with new low carbon vehicles, or whether they themselves might need to source new engineers with the skills to maintain the new types of vehicle.
Interviewees highlighted that the government has a critical role to play as an enabler. It is not necessarily specific policies that need addressing, as much as a generalised concern about the lack of clarity about how the transition away from diesel will be funded and what the options will be. Businesses know that the infrastructure required necessitates huge investment, whether this in terms of upgrades to the electricity grid, hydrogen pipelines, or other technology options. For instance, some businesses had attempted to calculate the installed electricity capacity needed to electrify fleets, and had come up with such huge numbers that they could not imagine how it would be supplied. This uncertainty can be at odds with decision making. For instance, long replacement cycles (particularly an issue for maritime operators) mean businesses need to start making investment decisions now,
Box 7.3 John Lewis Partnership
“One key thing is what we do for long-distance, heavy trucks. So providing everything works with biomethane we would get an 80% reduction on CO2 versus diesel right now. We believe that there will be zero-carbon biomethane available next year: so there’s going to be quite a lot of demand for biomethane. It’s therefore probably going to be quite important to secure suppliers of biomethane, because there may not be enough to go around everyone who would want it. And you will really need to work with suppliers that have control over the whole supply chain”.

36
to reach medium-term targets such as 2030. As such, the principal call from the businesses we spoke to was for regulation that sets a clear pathway to net zero, and allows them time to act. The importance of government working with the whole value chain, including not just transport businesses, but manufacturers, infrastructure and other parties, was emphasised as critical to making the right environment for change in the UK.
7.4 Savings can be made now from low-carbon changes, but longer-term options present a di�erent case
E¥cient operations are bread and butter to transport operations and are accompanied by carbon and other sustainability benefits. However, businesses will need to reconsider the variations in total cost of ownership that arise from technological changes in the longer term.
As already observed, fuel expenditure is a key cost for transport companies, representing tens of millions of pounds each year for large logistics companies. Therefore, fuel use is often tracked as a matter of course, constituting one of the main elements of total cost of ownership for a vehicle. E¥ciency opportunities and behaviour change to reduce use of fossil fuels are a clear win-win, reducing both operational costs and carbon emissions. For some businesses putting these financial savings into a sustainability frame may represent a newer way of thinking. However, some companies mentioned that being able to contribute to wider social impacts through reductions in fuel use, such as reducing air pollution and promoting safer driving practices, was increasingly important to them.
Companies had undertaken a range of measures to reduce fuel consumption. This included additional capital investment in newer, lower-emitting “Euro 6” engines, and accompanying this with improvements to tyres, both of which investments were considered to pay back in operational savings. Measures to implement driver behaviour changes, and incentivising these through e¥ciency-based KPIs were mentioned frequently. Examples include companies installing and upgrading their vehicle tracking (telematics) systems to assess fuel use, and promoting e¥cient operational behaviours amongst their drivers, such as the e¥cient management of refrigerated vehicles. Route optimisation was another common option, extending from planning, to the acquisition of new businesses or bidding for customers in locations that would help improve delivery e¥ciency. However, maximising the e¥ciency of existing operations on its own is not nearly enough to get companies to net-zero emissions, and the interviewees were fully aware of this.
The economics of the longer-term options needed to reach net zero were also being considered. Here the relative contributions of total costs of ownership for companies may shift, and the exact nature of this was not always agreed on. Several interviewees were positive, believing that a shift to electricity or biomethane from diesel would be a net benefit to their fuel cost. Others drew attention to the expected higher costs of other alternative fuels. Another concern was changes in the payload that can be carried depending on the vehicle technology. Some felt that these could be o�set
by other savings, for instance, changes in maintenance needs (particularly on electric vehicles which have “fewer moving parts” and hence potentially less to go wrong as one interviewee observed). Some participants mentioned other interesting considerations, such as the derogation allowing drivers on a standard licence (category B car licence) to operate alternative-fuel vans up to 4.25 tonnes, creating savings in driver costs and increasing operating hours.
In terms of capital cost, interviewees had mixed opinions on residual values, some considering electric vehicle values higher than those of redundant diesels; others considering that leasing companies, for instance, were not allocating enough value to low-carbon vehicles. If new vehicles have longer life spans, this can also mean that capital cost is depreciated over a longer period. However, the significant uplift in initial capital outlay anticipated by businesses remains considerable, and they believed this would be unlikely to be completely o�set by operational cost savings. This highlights the need for businesses to look closely at how lower-carbon vehicles might shift established patterns of operating and capital costs. Once again, the nature of this shift will link closely to the business model of the specific business itself. This is considered more in the next section.
7.5 Businesses need to be ready to forge new partnerships and consider implications for current operational models
Established business models may need to be flexed, existing capabilities and relationships reviewed, and the terms of new partnerships negotiated.
Companies had thought about how moving to net zero fitted with their existing business models and operational structures. Often, this highlighted areas where significant adaptation or change could be needed. For transport companies, payload, schedules and delivery times are critical. Therefore, trying to accommodate additional time for charging an electric vehicle, for instance, is commercially problematic as any deviations from optimal routes or maintenance depots, or any time spent o� the road, costs money, and furthermore may not suit tight schedules, such as parcel and food deliveries. Another important concern raised by interviewees was the space needed for batteries in electric vehicles, which decreases loading capacity, and therefore facilitates fewer customer deliveries per trip. As such, interviewees foresaw some di¥culties to overcome in aligning new technologies to current business imperatives. As one interviewee put it, it’s about where we need the energy, not what the energy is.
Interviewees also considered more strategic and systemic issues from low-carbon transitions. One aspect that the decision makers often commented on was the environmental impacts arising from built-in expectations of current systems. For instance, they drew attention to the rise in freight-related online purchasing that they had perceived (see also Section 2), customer preferences for fast deliveries and easy returns of goods, and deliveries being fulfilled by individual vehicles from di�erent companies to the same geographical areas rather being pooled (Box 7.4). Interviewees pointed out that changes in national purchasing habits would need to alter to
37
reduce transport’s environmental impacts, and some of these factors indeed appear in the Government’s recently launched transport strategy. A second aspect around the future development of logistics was an awareness that the nature of the goods being transported could also change, as markets for fossil fuel based, or high- carbon, products diminished, and hence a shift either in products moved by freight companies or in the customers themselves might take place. For those in the maritime industry, adaptation to changes in weather patterns is another strategic issue.
Despite this, businesses also perceived great potential in the move to net zero. Some suggested how the ine¥ciencies in current systems could be changed through, for example, o�ering end consumers the choice of lower-carbon options, such as slower delivery. Sharing of warehouse space, delivery loads and fleet assets between customers was also a possibility to reduce empty running and unused space. This would represent a major shift from the current o�ering of ring-fenced and branded assets for each freight customer. New customers could also be recruited from nascent markets in low carbon goods and services. Some interviewees also reported possible opportunities arising from moves towards a more circular economy, and the role that transport could play in moving and recovering waste and resources. Finally, some saw co-benefits arising for others beyond commercial fleet services, such as new electric charging infrastructures benefitting employees or local communities.
One key theme that arose from the interviews was the importance of exploring new partnerships to unlock the systemic change required for decarbonisation at the scale needed to reach net zero. This could include, for instance, working with local authorities, energy companies and network operators to install and manage the requisite grid upgrades needed to support high numbers of EVs. It could also include partnering with companies o�ering innovative fuels or vehicles, or maintenance engineers to manage di�erent types of vehicle, as mentioned earlier. Businesses will need to decide when to bring these new capabilities in-house, and when to use specialist partners. This implies some investment in resource, although the increased skills and relationships gained could also create new services and hence market advantage. More fundamentally, transport businesses will
Box 7.4 John Lewis Partnership
“I think there’s a lot you can do around making it more transparent as to how much carbon could be saved if customers change their behaviour”.
“It feels wrong when in many streets there will be a Tesco’s van, a Sainsbury’s van, an Ocado van, and a John Lewis Partnership van, all delivering similar items, and you think, well logically why don’t you put it on one van? But then at the same time we may also jealously guard our company di�erences.”
likely need to restructure relationships, including with existing partners and supplier contracts, but also with new parties. Hence the challenges of net zero could require a fundamental restructure in organisational attention and capability towards this challenge. Once again, it is clear that individual businesses cannot make the transition alone.
7.6 There is great potential upside from net zero – but the case for a first-mover advantage is not yet clear for every business
Transport businesses want to contribute to a net-zero UK, and many appreciate the need to get ahead of risk and opportunity, but uncertainty can hold some businesses back.
The businesses we spoke to perceived new opportunities and business synergies presented by the move to net zero. However, when and how to make the moves towards this end goal is a challenging decision for each specific business. Decision makers perceived the risks, and appreciated the need to get ahead of the conversation around climate change. This was felt particularly acutely as they were aware of what a key role it could play in reducing the UK’s emissions. However, taking an informed choice of pathway can be di¥cult, as it raises the danger of picking the “wrong” option from the many technological possibilities; what one interviewee referred to as “the Beta Max problem”. Therefore, the case for moving first was not clear, especially beyond electric options for LCVs. This also apply to the OEM industry, particularly for the HGV sector. OEMs have been slow to produce new HGV at scale and are waiting for more certainty in term of future demand in their products.
There was also doubt about moving first in terms of taking on cost. There was a concern that the first businesses to take on board the costs of transition and pass these through to customers might lose out to competitors who had not taken such steps, as customers’ willingness to pay for the low-carbon services they ask for was not considered a given as yet by all of the interviewees. The huge investment needed in UK infrastructure to facilitate low-carbon vehicles was also considered, with one interviewee describing this as a “Mexican stando�” of waiting for someone else to pay for infrastructure upgrades that would benefit several stakeholders in the same

38
area. Government support and stable policy signals could provide confidence to move earlier in this respect by de-risking investment choices (Box 7.5).
Interviewees felt that choices might be easier to make for them as larger businesses. They drew attention to how these hurdles are harder for SMEs to negotiate, due, for instance, to reduce access to resource, systems and capital. As an example, interviewees observed that many smaller logistics companies currently rely on acquiring second-hand diesel vehicles, which would become highly problematic for them with the transition to new low-carbon technologies. Again, government support for smaller businesses could be required to assist with helping these to make the adjustments needed for net zero across the whole transport sector.
7.7 Concluding remarks on the commercial realities of a low carbon transport industry
The businesses spoken to for this report all provide vital services that underpin the UK economy. These include the transport of goods large and small for major brands, highly-specialist products, providing logistics services for the public sector, the sale and distribution of food to everyday consumers, and life-line transport services for communities. They all recognise the environmental impact of their sector as a whole, some have already taken significant steps to reduce emissions, and set ambitious goals. All the businesses spoken to were willing to play their individual parts in contributing to the national goal of net zero. For them to do so, more precise technological decisions about the options for HGVs and vessels will need to be made at a government level (“choosing which horse to back” as one interviewee put it), and the accompanying UK infrastructure put in place to deliver those choices. This requires policymakers to seek holistic solutions across the industry’s value chains, and therefore provide the foundations on which businesses can be confident in adapting their own business models to make transformational reductions in carbon emissions.
Box 7.5 Suttons
“One of the things that concerns me about the current situation is that there seems to be a lot of rhetoric from government about achieving targets, but very little discussion about how anybody is going to get there. The government just legislates to force you to do something, but that means that you’ve then got to make decisions about appropriate technologies and, that might lead you to make the wrong decisions rather than the government developing a strategy that says here's where we want to get, so let's work as an industry with the truck manufacturers to work out what the right technology is. And then work with the industry to implement that technology.”

39
This report is based mostly on an extensive literature review of recent reports and publications produced on climate change and GHG emission mitigation (with a focus on the net-zero emission target) linked to the transport and freight sector at a global level (e.g. IPCC AR51) or with a specific focus on the UK (e.g. CCC2 or DfT3). The report also presents the perspectives of some large UK businesses involved in freight transport and logistics, through a series of in-depth interviews.
The evidence shows that bringing transport close to decarbonisation is possible for surface transport (land and sea) but very challenging for aviation (see Box 5.6 in the previous section). Tackling demand could help to reduce the amount of energy and other resources required to deliver zero-emission freight transport. Improvements in the e¥ciency of the system is also part of the solution including through modal shift, new infrastructure and in logistics. However, the key element driving decarbonisation of the transport sector will be the move from carbon-intensive fuel produced from oil to various decarbonised fuels to power the system (including biofuels, synthetic fuels, hydrogen, ammonia and electricity). This will require comprehensive strategies involving policy decisions, technology choices, infrastructure developments and logistic improvements to achieve the net-zero goal within the next three decades (Box 8.1).
For land transport (road and rail), electricity seems to emerge as the first choice for substitution. Electricity for road and rail can be provided through a rechargeable battery in the vehicle, or electrification of the rail or road network. The LCV sector has a clear technology pathway toward electrification of vehicles. For the HGV sector the technology choice is not yet clearly defined with a slow development toward new decarbonised trucks. The sector will have to speed—up research and development of new vehicles in the next decade to achieve the 2040 sale ban of ICE HGVs. To deploy zero-emission HGVs at scale, fleet owners, infrastructure providers and OEMs need to create partnerships to facilitate development of new fleet. Hydrogen, synthetic fuels or biofuels should only be used when no other alternative exists, because of the lower e¥ciencies in producing them.
However, hydrogen could be used as range extension on some electric vehicles through electricity produced by fuel cells (as an alternative or supplement to batteries). The use of first-generation biofuel is also unsatisfactory due to the competition of present feedstocks with food production and the life-cycle emissions associated with land use. These issues may be addressed when second and third generations of biomass (ligno-cellulosic and algae respectively) become technically available.
Regarding shipping, an already e¥cient mode of freight transport, some e¥ciencies are expected with operational and technical changes. Ammonia has been highlighted by some reports as the alternative fuel choice to decarbonise shipping. Ammonia can be used in diesel-like combustion engines or as storage for hydrogen to produce on-board electricity through fuel cells. LNG has been flagged as a transitional fuel in mitigation scenarios, however it still produces CO2 emissions when used in internal combustion engines.
Finally, aviation is probably the hardest of the transport modes to decarbonise. Once again technological and operational improvements are expected over the next decades but are outweighed by the increase in demand. The choice of alternative fuels until 2050 is limited to synthetic or bio-kerosene, mostly in blend with regular jetA fuel. Electric or hydrogen-powered planes are not expected on the 2050 horizon and, for electricity, the weight and capacity of batteries would limit its use to short-haul flights only. One way for aviation to achieve net-zero goals within the next three decades would be the use of emission o�set schemes, but strict monitoring and verification of the e�ectiveness of these is necessary.
Obviously, the right infrastructure needs to be built to sustain all alternative fuel switches (Box 8.2). Electrification of the main road and rail network for HGVs and trains as well as fast charging points for LCVs is required. If hydrogen is also part of the road fuel choice (to extend LCVs’ range or to power HGVs), hydrogen production and distribution need to be developed. For shipping, the ammonia production needs to
8. Conclusion
Box 8.1 Wincanton
“I call it a three-legged stool of what we need to be successful. One leg is the truck. Is there a vehicle that we can use? Is there a manufacturer developing a vehicle we need for the operation? Another leg, is the fuel. Does the infrastructure exist? Can we use the vehicle when operating it? And the last leg is the customer; is there a customer who is willing to pay for the more expensive solution? And if you don't have all those three, then the stool falls over.”

40
be increased and the associated green hydrogen production developed. The distribution and storage of ammonia is slightly more di¥cult than marine fossil fuels, but its handling is well understood from experience within the fertiliser industry, for example. Finally, for aviation the blending of bio- or synthetic fuels in jetA kerosene is less of a challenge, but the industrial production of these alternatives needs to be established (from trial infrastructure at the present).
In most of the cases (electricity, hydrogen, ammonia, and synthetic fuels) the development of the alternative fuels will require large amounts of electricity. Transport decarbonisation will be highly dependent on the decarbonisation of the power sector, and unless electricity demand considerably decreases in other sectors compared to nowadays, which is unlikely, additional power production will be needed with relatively large investments in renewables, and in electricity transmission grids.
The e�ectiveness of biofuels in any transport sector, and particularly aviation, in mitigating emissions, is conditional on the sustainability of the feedstock and the life-cycle emissions of the production cycle. Waste-to-fuel technology, as well as the second and third generations of bio-feedstocks may overcome these limitations in the future.
Moreover, all studies have shown that actions need to start immediately and the net-zero goal requires very strong political will (Box 8.3). Every single year that measures toward reducing GHG emissions are delayed, the more unlikely for freight transport (and other sectors) to be decarbonised by 2050. For example, even with policies such as only new electric van sales after 2030, the remaining fleet of fossil fuel powered vans will continue to emit CO2 even in 2050.
Finally, the future freight transport system may not be so radically di�erent from the present one. The vast majority of the freight demand will likely require the same modes of transport. New logistics systems and multimodal approaches may have been successfully implemented to reduce the impact of greater demand for freight transport and deliveries particularly in urban areas. However, the major changes toward zero emissions may be as a result of the introduction of electric vehicles or alternative zero-carbon fuels in combustion engines. The new infrastructure needed to support these changes can be expensive (electricity networks or hydrogen production), but the adoption of alternative fuels as well as e¥ciency measures in the transport system will also bring new commercial opportunities (Box 8.4).
Box 8.2 UPS
“One of the biggest challenges and in some ways most interesting areas of innovation is around power supply. The vehicles themselves are interesting but getting the power to the vehicles is an area of terrific challenge and opportunity as well.”
Box 8.3 UPS
“I can only recommend to those organisations that are not engaged in this space yet to start to think about it, and start to learn about it, think about what they can do, educate themselves, build a vision of where they want to be by a certain date. Think about making the first steps. Don’t continually put it o� because the longer it gets delayed the more painful it’s going to be.”

41
Box 8.4 Suttons
“I would say that 70 to 75% of our business is moving stu� around that are either fuels or hydrocarbon refined products to some degree. But what we are doing as a business is strategically looking at new markets. So what we're trying to do is identify those products that are going to feed the new technologies that are probably going to replace some of the products that we currently service, we haven't got a huge fuels business, but we do move diesel and petrol for trucks and cars for a number of customers. Clearly that business is not going to be there long term. But electric cars are going to need electrolytes, so we are identifying the manufacturers of electrolytes and trying to win business with them and get into developing markets early. There's a lot of work going on in our business at the moment to identify those fledgling industries that are going to benefit from this shift”

42
9.1 References Section 1: Introduction1 IPCC 2014: Climate Change 2014: Synthesis Report. Contribution of Working Groups I,
II and III to the Fifth Assessment Report of the Intergovernmental Panel on Climate Change [Core Writing Team, R.K. Pachauri and L.A. Meyer (eds.)]. IPCC, Geneva, Switzerland, 151 pp.
2 Ciscar, Juan-Carlos et al., 2011, Physical and economic consequences of climate change in Europe, PNAS February 15, 2011 108 (7) 2678-2683; https://doi.org/10.1073/pnas.1011612108
3 Rhodes C.J., 2015, The 2015 Paris climate change conference: COP21, Sci Prog, 99 (2016), pp. 97-104, 10.3184/003685016X14528569315192
4 Li H., Y. Lu, J. Zhang, T. Wang, 2013, Trends in road freight transportation carbon dioxide emissions and policies in China Energy Pol, 57, pp. 99-106, 10.1016/j.enpol.2012.12.
5 IPCC 2018, Global warming of 1.5°C. An IPCC Special Report on the impacts of global warming of 1.5°C above pre-industrial levels and related global greenhouse gas emission pathways, in the context of strengthening the global response to the threat of climate change, sustainable development, and e�orts to eradicate poverty [V. Masson-Delmotte, P. Zhai, H. O. Pörtner, D. Roberts, J. Skea, P.R. Shukla, A. Pirani, W. Moufouma-Okia, C. Péan, R. Pidcock, S. Connors, J. B. R. Matthews, Y. Chen, X. Zhou, M. I. Gomis, E. Lonnoy, T. Maycock, M. Tignor, T. Waterfield (eds.)]. Cambridge University Press, Cambridge, United Kingdom and New York, NY, USA.
6 Cazzola, P.,M. Gorner, R. Schuitmaker, E. Maroney, 2016, Global Ev Outlook 2016 International Energy Agency, France
7 Rogelj J, Popp A, Calvin KV, Luderer G, Emmerling J, Gernaat D, Fujimori S, Strefler J, Hasegawa T, Marangoni G, Krey V, Kriegler E, Riahi K, van Vuuren DP, Doelman J, Drouet L, Edmonds J, Fricko O, Harmsen M, Havlik P, Humpenoeder F, Stehfest E, Tavoni Met al., 2018, Scenarios towards limiting global mean temperature increase below 1.5 degrees C, NATURE CLIMATE CHANGE, Vol: 8, Pages: 325-+, ISSN: 1758-678X
8 ILO 2018, International Labour Organisation, Employment by economic activity and occupation, https://ilostat.ilo.org/data/#
9 ONS 2021, O¥ce for National Statistics, UK Workforce Jobs SA : H Transport & storage, https://www.ons.gov.uk/employmentandlabourmarket/peopleinwork/employmentandemployeetypes/timeseries/jws4/lms/previous
10 Anenberg, S. C. et al 2019, The global burden of transportation tailpipe emissions on air pollution-related mortality in 2010 and 2015, Environ. Res. Lett. 14 094012
11 Aramide Awe, Y., 2012, Toward a green, clean, and resilient world for all : a World Bank Group environment strategy 2012-2022 (English). Washington, D.C. : World Bank Group. http://documents.worldbank.org/curated/en/917551468335942128/Toward-a-green-clean-and-resilient-world-for-all-a-World-Bank-Group-environment-strategy-2012-2022
9.2 References Section 2: Overview of freight sector demand and GHG emissions
1 Profillidis V.A., G.N. Botzoris 2019, Evolution and Trends of Transport Demand in Modeling of Transport Demand, https://doi.org/10.1016/C2016-0-00793-3
2 IPCC 2014: Transport. In: Climate Change 2014: Mitigation of Climate Change. Contribution of Working Group III to the Fifth Assessment Report of the Intergovernmental Panel on Climate Change, [Edenhofer, O., R. Pichs-Madruga, Y. Sokona, E. Farahani, S. Kadner, K. Seyboth, A. Adler, I. Baum, S. Brunner, P. Eickemeier, B. Kriemann, J. Savolainen, S. Schlömer, C. von Stechow, T. Zwickel and J.C. Minx (eds.)]. Cambridge University Press, Cambridge, United Kingdom and New York, NY, USA.
3 Government O¥ce for Science 2019, Understanding the UK Freight Transport System Future of Mobility: Evidence Review Foresight, Government O¥ce for Science.
4 Braithwaite, A., 2017, The Implications of Internet Shopping Growth on the Van Fleet and Tra¥c Activity, https://www.racfoundation.org/wp-content/uploads/2017/11/The_Implications_of_Internet_Shopping_Growth_on_the_Van_Fleet_and_Tra¥c_Activity_Braithwaite_May_17.pdf
5 Hirst, D., J. Winnett, S. Hinson 2021, Electric vehicles and infrastructure commonslibrary.parliament.uk, https://researchbriefings.files.parliament.uk/documents/CBP-7480/CBP-7480.pdf
6 DfT 2020a, Decarbonising Transport Setting the Challenge, https://assets.publishing.service.gov.uk/government/uploads/system/uploads/attachment_data/file/932122/decarbonising-transport-setting-the-challenge.pdf
7 Condon, J., S. Gailus, F. Neuhaus, and M. Peña-Alcaraz 2020, Global freight flows after COVID-19: What’s next? McKinsey & Company. https://www.mckinsey.com/industries/travel-logistics-and-infrastructure/our-insights/global-freight-flows-after-covid-19-whats-next
8 CCC 2021 Progress in reducing emissions, 2021 Progress Report to Parliament, https://www.theccc.org.uk/wp-content/uploads/2021/06/Progress-in-reducing-emissions-2021-Report-to-Parliament.pdf
9 DfT 2017, Freight Carbon Review 2017, https://assets.publishing.service.gov.uk/government/uploads/system/uploads/attachment_data/file/590922/freight-carbon-review-2017.pdf
9. References9.3 References Section 3: Forecast future freight demand1 OECD 2019, ITF Transport Outlook, International Transport Forum, https://www.oecd-
ilibrary.org/sites/57f51e1e-en/index.html?itemId=/content/component/57f51e1e-en2 IPCC 2014: Transport. In: Climate Change 2014: Mitigation of Climate Change. Contribution
of Working Group III to the Fifth Assessment Report of the Intergovernmental Panel on Climate Change, [Edenhofer, O., R. Pichs-Madruga, Y. Sokona, E. Farahani, S. Kadner, K. Seyboth, A. Adler, I. Baum, S. Brunner, P. Eickemeier, B. Kriemann, J. Savolainen, S. Schlömer, C. von Stechow, T. Zwickel and J.C. Minx (eds.)]. Cambridge University Press, Cambridge, United Kingdom and New York, NY, USA.
3 MDS 2019, Future of Freight Demand, for the National Infrastructure Commission, https://nic.org.uk/app/uploads/Future-of-Freight_Future-of-Freight-Demand_MDS-Transmodal.pdf
9.4 References Section 4: Current regulatory drivers and mechanisms for the transport sector in relation to climate mitigation
1 ICAO 2021, CORSIA, https://www.icao.int/environmental-protection/CORSIA/Pages/default.aspx
2 IMO 2018, Initial IMO Strategy on Reduction of GHG Emissions from Ship, Resolution MEPC.304(72), https://wwwcdn.imo.org/localresources/en/KnowledgeCentre/IndexofIMOResolutions/MEPCDocuments/MEPC.304(72).pdf
3 IMO 2020, Fourth IMO GHG Study 2020, https://wwwcdn.imo.org/localresources/en/OurWork/Environment/Documents/Fourth%20IMO%20GHG%20Study%202020%20Executive-Summary.pdf
4 IMO 2021, MPEC 76, amendments to MARPOL Annex I, https://www.imo.org/en/MediaCentre/PressBriefings/pages/MEPC76.aspx
5 DNV 2021, EEXI – Energy E¥ciency Existing Ship Index, https://www.dnv.com/maritime/insights/topics/eexi/answers-to-frequent-questions.html
6 CCC 2021 Progress in reducing emissions, 2021 Progress Report to Parliament, https://www.theccc.org.uk/wp-content/uploads/2021/06/Progress-in-reducing-emissions-2021-Report-to-Parliament.pdf
7 DfT 2019, Department for Transport statistics, Clean Maritime Plan: Maritime 2050 environment route map, https://assets.publishing.service.gov.uk/government/uploads/system/uploads/attachment_data/file/815664/clean-maritime-plan.pdf
8 DfT 2020, Jet Zero Council, Department of Transport, https://www.gov.uk/government/groups/jet-zero-council#contact-details
9 DfT 2018, The Road to Zero, Next steps towards cleaner road transport and delivering our Industrial Strategy, https://assets.publishing.service.gov.uk/government/uploads/system/uploads/attachment_data/file/739460/road-to-zero.pdf
10 BEIS 2017, The Clean Growth Strategy Leading the way to a low carbon future, https://www.gov.uk/government/publications/clean-growth-strategy
11 DfT 2021, Transport decarbonisation plan, https://www.gov.uk/government/publications/transport-decarbonisation-plan
12 DfT 2020a, Decarbonising Transport Setting the Challenge, https://assets.publishing.service.gov.uk/government/uploads/system/uploads/attachment_data/file/932122/decarbonising-transport-setting-the-challenge.pdf
13 DfT 2021a, Transport decarbonisation plan, https://www.gov.uk/government/publications/transport-decarbonisation-plan
9.5 References Section 5: Toward zero emissions in the freight sector: Technological fuel choices in logistics
1 IPCC 2014: Transport. In: Climate Change 2014: Mitigation of Climate Change. Contribution of Working Group III to the Fifth Assessment Report of the Intergovernmental Panel on Climate Change, [Edenhofer, O., R. Pichs-Madruga, Y. Sokona, E. Farahani, S. Kadner, K. Seyboth, A. Adler, I. Baum, S. Brunner, P. Eickemeier, B. Kriemann, J. Savolainen, S. Schlömer, C. von Stechow, T. Zwickel and J.C. Minx (eds.)]. Cambridge University Press, Cambridge, United Kingdom and New York, NY, USA.
2 Redwood Energy 2021, https://redwoodenergy.org/wp-content/uploads/2018/07/Alt-Fuels_Fleet-Toolkit_overview-of-alt-fuels.pdf
3 Burel, F., Taccani, R., Zuliani, N. Improving sustainability of maritime transport through utilization of Liquefied Natural Gas (LNG) for propulsion. Energy 2013, 57, 412–420.
4 Speirs J., Balcombe P., Blomerus P., Stettler M., Brandon N., and Hawkes A. 2019, Can natural gas reduce emissions from transport? Heavy goods vehicles and shipping; Sustainable Gas Institute, Imperial College London.
5 National Grid 2020, Record-breaking 2020 becomes greenest year for Britain’s electricity, https://www.nationalgrideso.com/news/record-breaking-2020-becomes-greenest-year-britains-electricity
6 Jia, G., E. Shevliakova, P. Artaxo, N. De Noblet-Ducoudré, R. Houghton, J. House, L. Verchot, 2019, Land–climate interactions. In P. R. Shukla, J. Skea, E. Calvo Buendia, V. (Eds.), Climate Change and Land: an IPCC special report on climate change, desertification, land degradation, sustainable land management, food security, and greenhouse gas fluxes in terrestrial ecosystems.
7 Crist, P. (2009). Greenhouse Gas Emissions Reduction Potential from International Shipping.

43
JTRC Discussion Paper. Joint Transport Research Centre of the OECD and the International Transport Forum. http:/www.internationaltransportforum.org/jtrc/discussionpapers/DP200911.pdf
8 Dray, LM, Schäfer A., Al Zayat K. 2018, The Global Potential for CO2 Emissions Reduction from Jet Engine Passenger Aircraft, National Academy of Sciences, Transportation Research Record: Journal of the Transportation Research Board, http://dx.doi.org/10.1177/0361198118787361
9 Vyas A. D., D. M. Patel, and K. M. Bertram 2013, Potential for energy e¥ciency improvement beyond the light-duty-vehicle sector. U.S. Department of Energy and Argonne National Laboratory, Oak Ridge, US, 82 pp
10 Frazer and Nash 2018, Reducing the Environmental Impact of Freight, for the National Infrastructure Commission, https://nic.org.uk/app/uploads/Future-of-Freight_Reducing-the-Environmental-Impact-of-Freight_CEPA-and-Frazer-Nash.pdf
11 Transport & Environment 2020. How to decarbonise the UK's freight sector by 2050, https://www.transportenvironment.org/publications/how-decarbonise-uks-freight-sector-2050
12 DfT 2021, Road freight goes green with £20 million funding boost, https://www.gov.uk/government/news/road-freight-goes-green-with-20-million-funding-boost
13 CCC 2020 Sixth Carbon Budget report, The UK’s path to Net Zero, https://www.theccc.org.uk/publication/sixth-carbon-budget/
9.6 References Section 6: Toward zero emissions in the freight sector: Non technological improvements towards higher e¥ciency in logistics
1 IPCC 2014: Transport. In: Climate Change 2014: Mitigation of Climate Change. Contribution of Working Group III to the Fifth Assessment Report of the Intergovernmental Panel on Climate Change, [Edenhofer, O., R. Pichs-Madruga, Y. Sokona, E. Farahani, S. Kadner, K. Seyboth, A. Adler, I. Baum, S. Brunner, P. Eickemeier, B. Kriemann, J. Savolainen, S. Schlömer, C. von Stechow, T. Zwickel and J.C. Minx (eds.)]. Cambridge University Press, Cambridge, United Kingdom and New York, NY, USA.
2 UNEP 2011, Towards a green economy: pathways to sustainable development and poverty eradication. UNEP, Nairobi, Kenya, 630 pp., (ISBN: 9280731432).
3 CCC 2020 Sixth Carbon Budget report, The UK’s path to Net Zero, https://www.theccc.org.uk/publication/sixth-carbon-budget/
4 Transport Systems Catapult (2018), Consolidating public sector logistics operations, https://s3-eu-west-1.amazonaws.com/media.ts.catapult/wp-content/uploads/2018/07/13095627/Public-Sector-Logistics-Consolidation_On-Line-Report-web.pdf
5 CCC 2021 Progress in reducing emissions, 2021 Progress Report to Parliament, https://www.theccc.org.uk/wp-content/uploads/2021/06/Progress-in-reducing-emissions-2021-Report-to-Parliament.pdf
9.7 References Section 8: Conclusions1 IPCC 2014: Transport. In: Climate Change 2014: Mitigation of Climate Change. Contribution
of Working Group III to the Fifth Assessment Report of the Intergovernmental Panel on Climate Change, [Edenhofer, O., R. Pichs-Madruga, Y. Sokona, E. Farahani, S. Kadner, K. Seyboth, A. Adler, I. Baum, S. Brunner, P. Eickemeier, B. Kriemann, J. Savolainen, S. Schlömer, C. von Stechow, T. Zwickel and J.C. Minx (eds.)]. Cambridge University Press, Cambridge, United Kingdom and New York, NY, USA.
2 CCC 2020 Sixth Carbon Budget report, The UK’s path to Net Zero, https://www.theccc.org.uk/publication/sixth-carbon-budget/
3 DfT 2017, Freight Carbon Review 2017, https://assets.publishing.service.gov.uk/government/uploads/system/uploads/attachment_data/file/590922/freight-carbon-review-2017.pdf

44
The goal of the Paris Agreement, adopted at the Paris climate conference (COP21) in December 2015, is to limit global warming to well below 2˚C and preferably to 1.5˚C, compared to pre-industrial levels. To achieve this long-term temperature goal, countries aim to reach global peaking of greenhouse gas emissions as soon as possible to achieve net-zero emissions by mid-century. The Paris Agreement, which has achieved universal buy-in from UN countries, contains a legally binding obligation to set national targets to reduce emissions in a 5-year cycle. By 2020, Parties to the Agreement had submitted their plans for climate action known as nationally determined contributions (NDCs) to emission reduction. While these NDCs are not yet enough to reach the agreed temperature objectives, but the agreement paves the way to further action, as outlined below.
The Katowice package adopted at the UN climate conference (COP24) in December 2018 contains common and detailed rules, procedures and guidelines that operationalise the Paris Agreement. It covers most key areas including transparency, finance, mitigation and adaptation, and provides flexibility to Parties that need it in light of their capacities, while enabling them to implement and report on their commitments in a transparent, complete, comparable and consistent manner. This will also enable the Parties to progressively enhance their contributions to tackling climate change, in order to meet the Agreement's long-term goals (the temperature goals).
Under the Paris Agreement the parties agree:
1. a long-term goal of keeping the increase in global average temperature to well below 2˚C above pre-industrial levels;
2. to aim to limit the increase to 1.5°C, since this would significantly reduce risks and the impacts of climate change;
3. on the need for global emissions to peak as soon as possible, recognising that this will take longer for developing countries;
4. to undertake rapid reductions thereafter in accordance with the best available science, so as to achieve a balance between emissions to and removals from the atmosphere in the second half of the century;
5. to submit comprehensive national climate action plans (nationally determined contributions, NDCs).
10. ANNEX 1: The Paris Agreement on Climate Change
Regarding the NDCs transparency and global stocktake mechanism for the NDCs, the governments have agreed to:
1. come together every 5 years to assess the collective progress towards the long-term goals and inform Parties in updating and enhancing their NDCs;
2. report to each other and the public on how they are implementing climate action;
3. track progress towards their commitments under the Agreement through a robust transparency and accountability system.
There are also agreements strengthening actions on adaptation (and support for developing countries) to avert or minimise loss and damage due to climate change; these are out of the scope of this report.
In December 2015, the 2015 United Nations Climate Change Conference called for a major IPCC report to be conducted regarding the Paris Agreement target. The IPCC “Special Report on Global Warming of 1.5˚C” was published in 20181. Within the report various pathways for mitigation of global warming to 1.5˚C are analysed, including portfolios for energy supply and negative emission technologies. In most scenarios reported, global emission reductions and sector transformations for 1.5˚C are clear. In a typical global 1.5˚C pathway (for global warming to be limited to 1.5˚C by 2100), as presented in Figure 10.1 below, CO2 emissions peak in 2020, decline by 45% from 2010 by 2030, and get to zero by 2050, after which they go negative through removing carbon dioxide from the atmosphere using a range of natural and technological options. Net-zero emissions should be achieved within 30 years and has become a central goal in climate policies. In some scenarios large mitigation levels start only after 2030 implying faster mitigation and higher use of carbon removal technologies later in the century to achieve the target. Note that a “net-zero” level could refer to reaching net-zero carbon emissions by a selected date, but di�ers from zero carbon emissions, which requires no carbon to be emitted. ‘Net zero’ refers to balancing the amount of emitted greenhouse gases with the equivalent emissions that are either o�set or sequestered (the long-term capture/storage of CO2 from the atmosphere).

45
Figure 10.1 Global GHG and CO2 emissions pathways in line with the 1.5C target of the Paris Agreement2
10.1 References: Annex 11 IPCC 2018, Global warming of 1.5°C. An IPCC Special Report on the impacts of global
warming of 1.5°C above pre-industrial levels and related global greenhouse gas emission pathways, in the context of strengthening the global response to the threat of climate change, sustainable development, and e�orts to eradicate poverty [V. Masson-Delmotte, P. Zhai, H. O. Pörtner, D. Roberts, J. Skea, P.R. Shukla, A. Pirani, W. Moufouma-Okia, C. Péan, R. Pidcock, S. Connors, J. B. R. Matthews, Y. Chen, X. Zhou, M. I. Gomis, E. Lonnoy, T. Maycock, M. Tignor, T. Waterfield (eds.)]. Cambridge University Press, Cambridge, United Kingdom and New York, NY, USA.
2 Climate Analytics 2019, how the IPCC can guide mitigation action, https://climateanalytics.org/blog/2019/centred-on-science-how-the-ipcc-can-guide-mitigation-action/
GHG emissions
-10
0
10
20
30
40
50
60
2000 2010 2020 2030 2040 2050 2060 2070 2080 2090 2100
Gre
enho
use
gas
emis
sion
s (G
tCO
2 e/y
ear)
-20
GHG emissionspeak around 2020
CO2 emissions reach net-zero around 2050
GHG emissions decline rapidly to 45% below 2010 levels by 2030
CO2 emissions decline rapidly to 45% below 2010 levels by 2030
GHG emissionsreach net-zero around 2070
Residual CO2 and non-CO2 emissions remain in some sectors
Carbon dioxide removal needed to compensate for insu�cient action to date and residual emissions
CO2 missions

46
11. ANNEX 2: Businesses and interviewees’ information
CalmacCalMac Ferries Limited is the UK's largest ferry operator in terms of ships and destinations served and one of the largest transport operators in Scotland. CalMac runs 33 vessels to over 50 ports and harbours, across 200 miles of Scotland's west coast. CalMac provides an everyday lifeline service to local communities, and enables the development of tourism, which is hugely important for the area’s economy.
We interviewed Klare Chamberlain, Environmental Manager, CalMac Ferries Ltd.
UPSUPS is a global leader in logistics, o�ering a broad range of solutions for the transportation of packages and documents, the facilitation of international trade, and the deployment of advanced technology. Globally UPS delivers 24.7m packages and documents daily, operating in more than 220 countries and territories. In the UK, it has a delivery fleet of more than 2,700 vehicles, over 4,300 UPS Access Point locations, and employs around 10,000 sta�. UPS is committed to reducing its impact on the environment and supporting the communities it serves around the world.
We interviewed Peter Harris, Vice President International Sustainability, UPS.
WincantonWincanton plc is a leading supply chain partner for British business. The company provides a range of critical services, including storage, handling and distribution; high volume eFulfilment; retailer ‘dark stores’; two-person home delivery; fleet and transport management; and network optimisation for many of the UK’s best-known companies. It operates across a number of di�erent sectors, and has 7,700 vehicles and over 15m sqft of warehouse space.
We interviewed Carl Hanson, Group Asset Director, Wincanton plc.
John Lewis PartnershipThe John Lewis Partnership is the UK’s largest employee-owned business and parent company of John Lewis & Partners and Waitrose & Partners. John Lewis & Partners is a leading omni-channel retailer in the UK with 50 John Lewis & Partners shops and a growing online business. Waitrose & Partners is dedicated to o�ering superb quality food that has been responsibly sourced, combined with unrivalled high standards of customer service. There are 338 shops, as well as shops at Welcome Break service stations, online at waitrose.com and the Waitrose & Partners farm.
We interviewed Justin Laney, General Manager - Fleet, John Lewis Partnership.
SuttonsSuttons Group is a family-owned business which operates a global logistics service, specialising in the chemical, gas, fuel, and waste sectors. Through two operating divisions (Suttons International and Suttons Tankers) it o�ers all aspects of tank container, road tanker and multimodal services. Suttons provides supporting activities which include fleet management and maintenance. They complete over 20,000 deliveries every month.
We interviewed Keith Broom, Group Finance Director, Suttons Group.